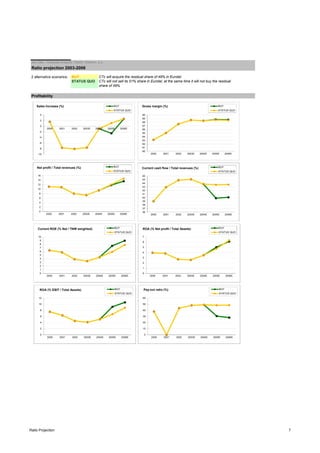
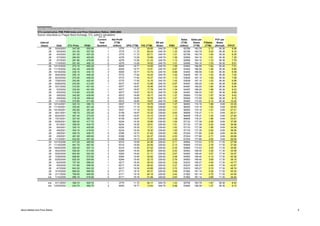
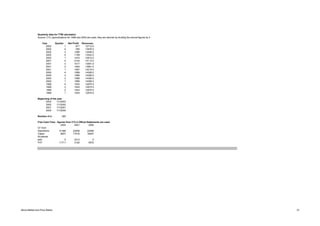
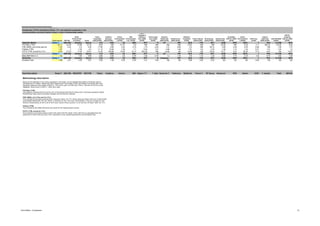
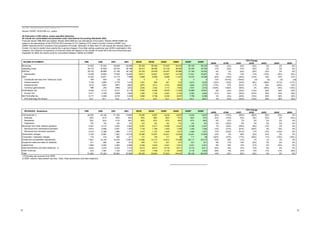
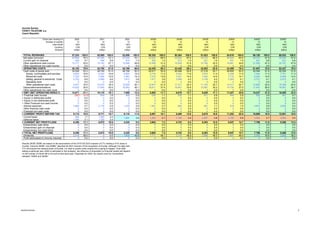
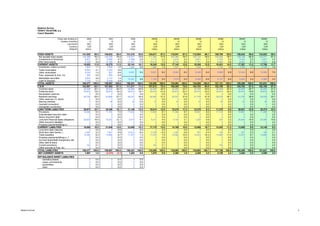
This document provides a financial analysis of Český Telecom, a.s. for the years 2000-2006. It includes an income survey showing revenue, costs, profits, and other financial metrics. It also includes a balance survey showing assets, liabilities, equity and other balance sheet items. The analysis is based on Český Telecom's audited financial statements and other sources. Estimates are provided for some future years and acquisition scenarios.

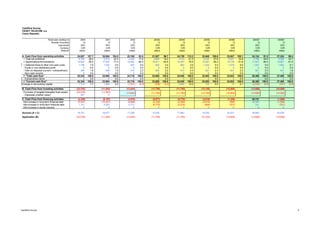
![Ratios
ČESKÝ TELECOM, a.s.
Czech Republic
Jan Zika - Financial Analysis, Český Telecom, a.s.
Fiscal year (ending in) 2000 2001 2002 2003E 2004E 2005E 2006E 2005E* 2006E*
Number of months 12 12 12 12 12 12 12 12 12
Last month DEC DEC DEC DEC DEC DEC DEC DEC DEC
Profitability
Sales increase (%) 1.6 -7.7 -8.1 -7.6 -0.9 1.1 2.6 -2.5 2.6
Gross margin (%) 83.2 85.1 87.5 88.6 88.4 88.6 88.5 88.7 88.7
Current net profit / Total revenues (%) 11.1 10.9 8.0 7.3 9.4 12.0 14.7 11.8 13.5
Current cash flow / Total revenues (%) 39.0 42.9 44.9 45.1 43.8 43.6 43.6 39.9 40.1
Current ROE (% Net / TNW weighted) 6.3 5.8 3.9 3.4 4.4 5.9 7.8 7.5 9.0
ROE (% Net profit / Equity) 6.1 5.7 3.8 3.4 4.5 5.9 7.9 7.4 9.1
ROA (% Net profit / Total Assets) 4.0 3.8 2.7 2.6 3.5 4.7 6.3 5.0 6.1
ROA (% EBIT / Total Assets) 7.5 6.4 4.5 4.1 5.1 6.7 8.8 9.2 10.6
[Current ROA (%) according to the template] 7.5 6.9 4.8 4.3 5.3 6.9 9.1 10.4 10.8
Pay-out ratio (%) 38.0 0.0 43.5 48.1 48.9 48.3 48.4 30.6 28.2
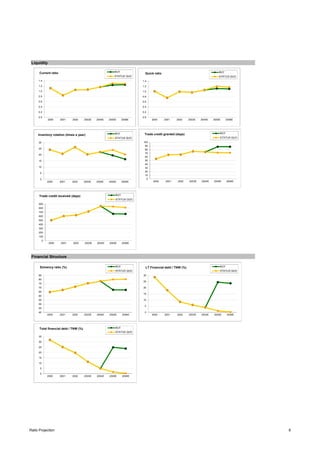
Liquidity
Current ratio 1.1 0.8 1.1 1.1 1.2 1.3 1.3 1.2 1.3
Quick ratio 1.0 0.8 1.0 1.0 1.1 1.2 1.2 1.1 1.1
Inventory rotation (times a year) 24.2 20.9 26.3 20.4 22.3 24.0 20.3 19.6 16.5
Trade credit granted (days) 54.8 65.8 66.5 75.3 73.5 71.7 71.2 87.9 87.8
Trade credit received (days) 502.8 605.2 628.7 717.8 847.4 837.8 814.2 660.1 657.3
Financial Structure
Solvency ratio (%) 64.7 67.3 71.2 75.4 78.0 80.0 80.3 67.4 67.3
Solvency ratio (before correction for goodwill &
intangibles) (%) 64.7 67.3 71.2 75.4 78.0 80.0 80.3 67.4 67.3
Solvency ratio (including operating leases) (%) 64.7 67.3 71.2 75.4 78.0 80.0 80.3 67.4 67.3
LT Financial debt / TNW (%) 28.5 17.9 8.5 6.0 3.9 1.2 0.2 24.5 23.6
Total financial debt / TNW (%) 31.9 25.2 19.8 11.3 5.1 1.7 0.4 25.0 23.8
Ratios 6](https://image.slidesharecdn.com/3e341803-01c1-4d10-9d73-f47032518b56-150202234126-conversion-gate01/85/Financial_analysis_CTc-6-320.jpg)