Download as DOCX, PPTX
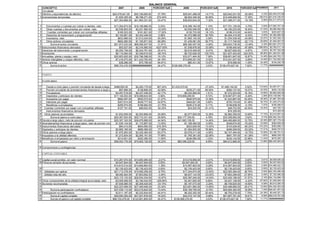
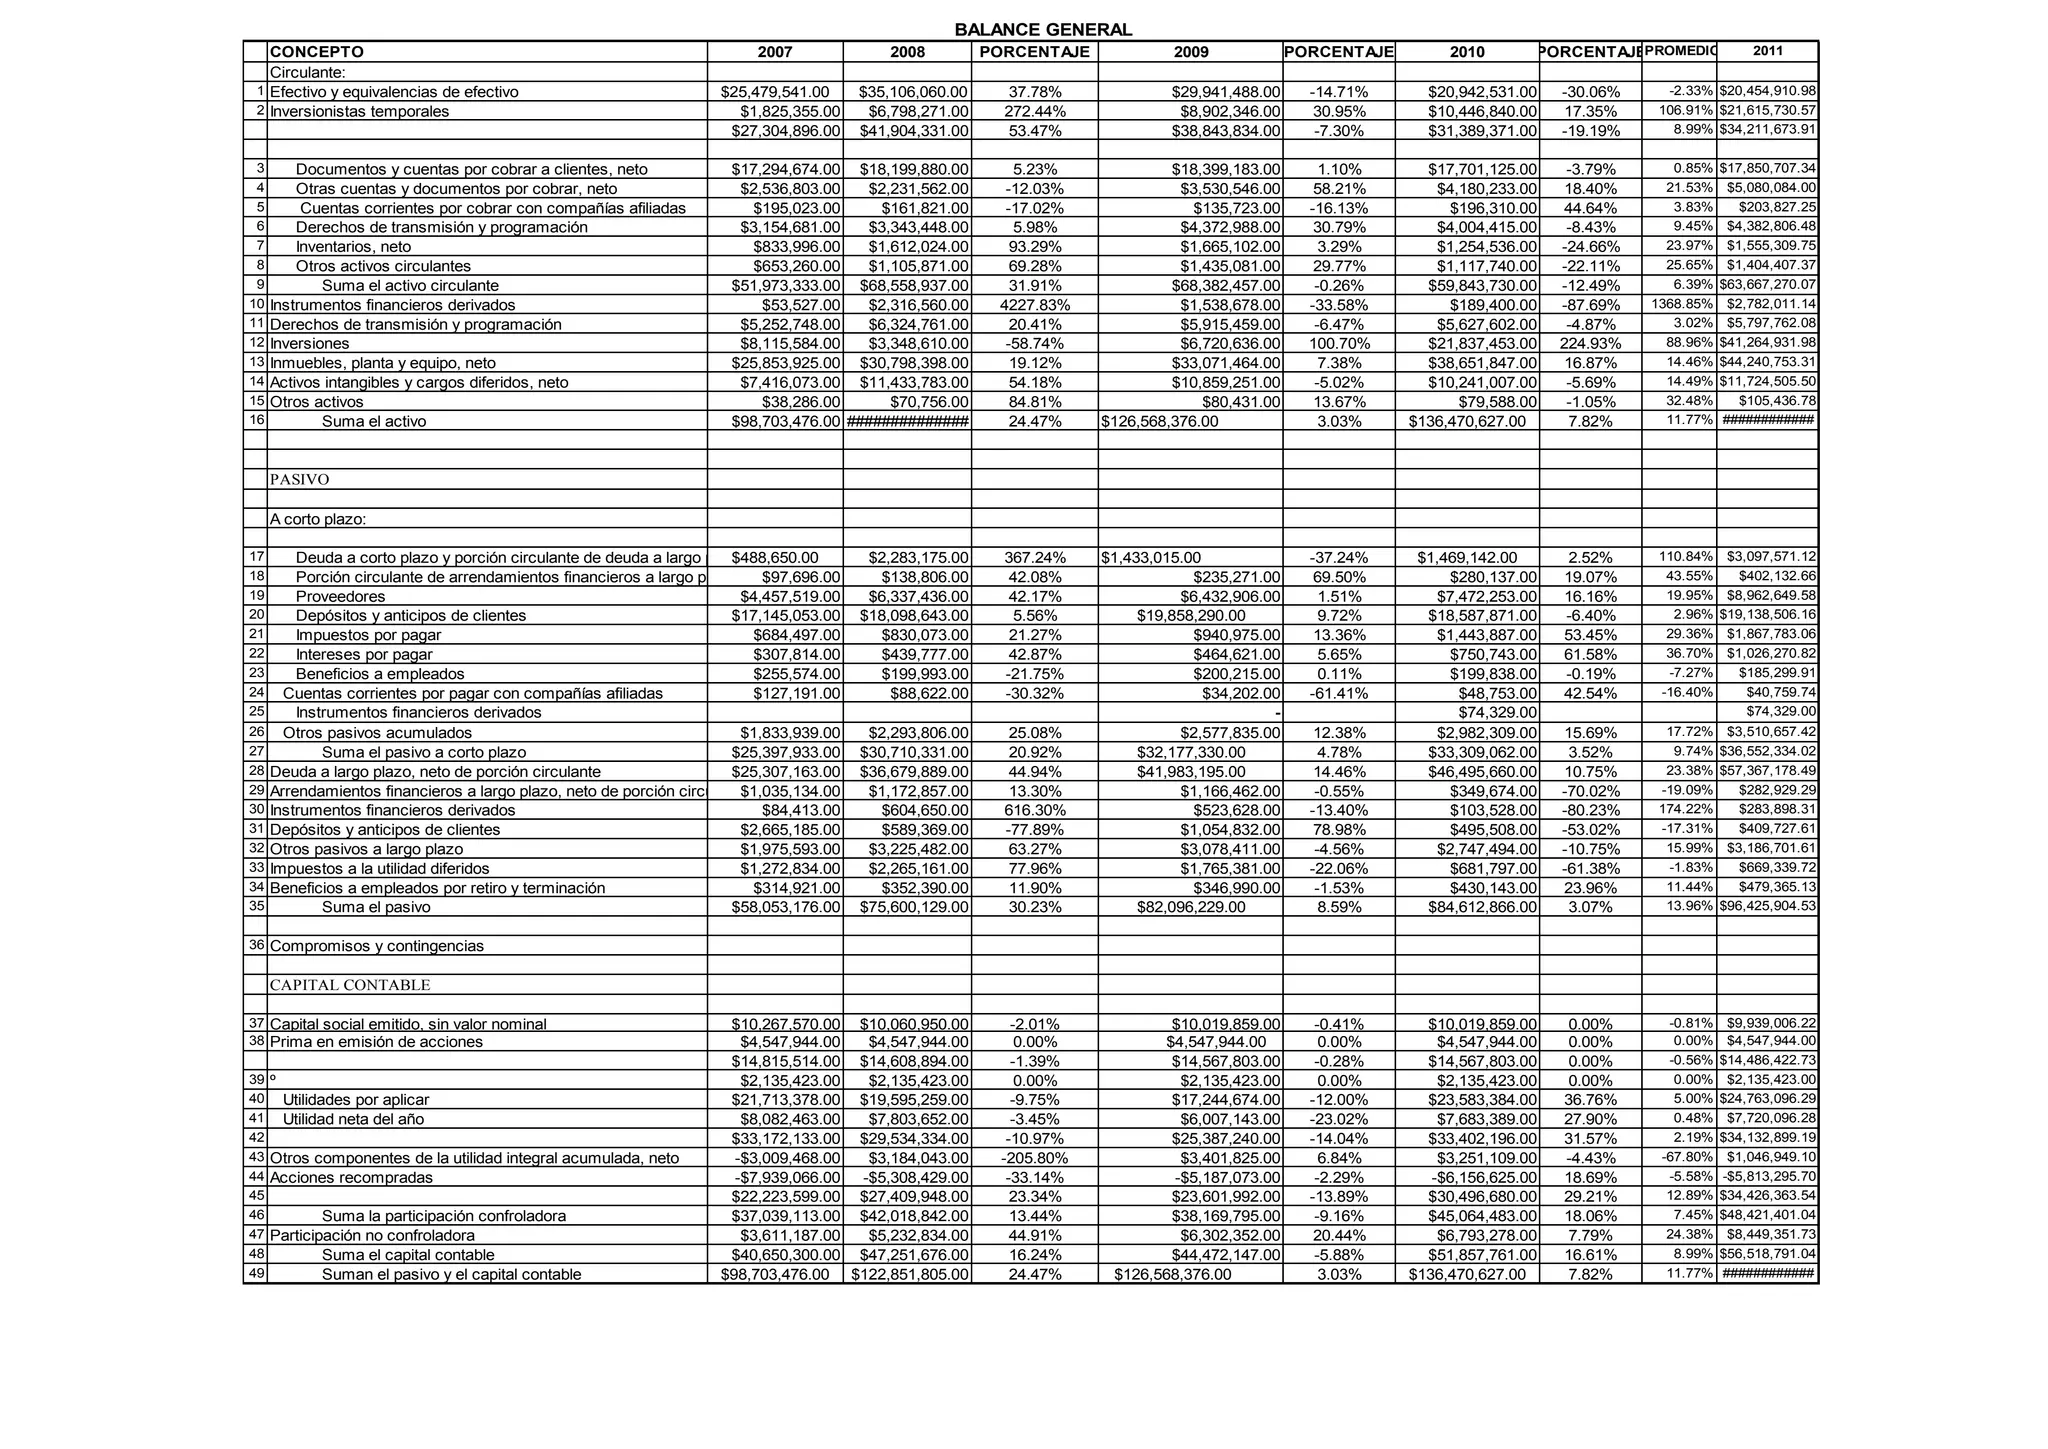

This document summarizes the balance sheet figures for an organization from 2007 to 2011. It shows assets, liabilities, and equity categories with amounts for each year. The main assets included cash, investments, property and equipment. Liabilities included short and long-term debt. Equity included capital stock, retained earnings, and non-controlling interests. Over the period, total assets increased 24.47% to $126.6 million in 2009 while total equity and liabilities increased 16.24% to $122.9 million in 2008.


