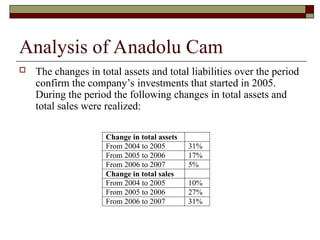
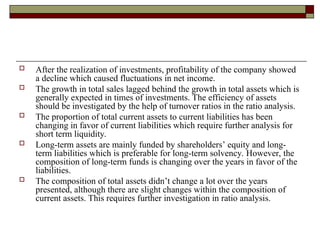
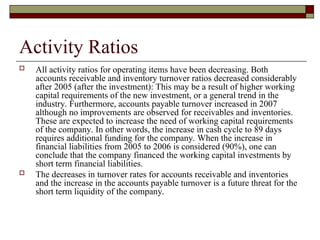
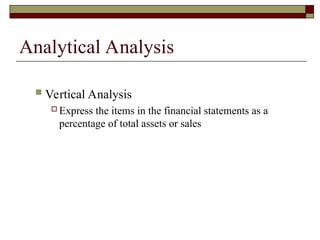
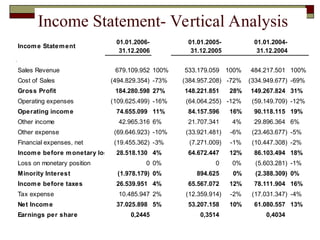
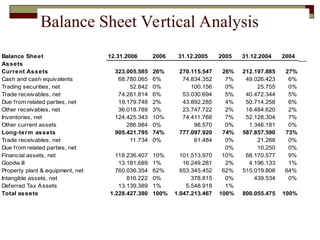
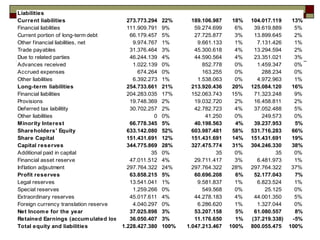
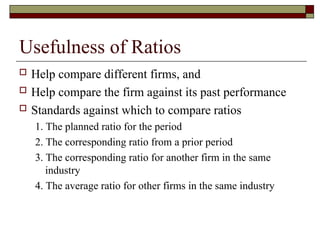
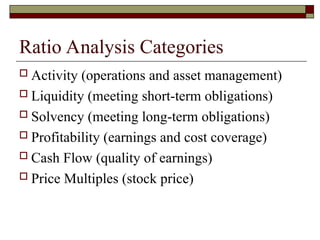
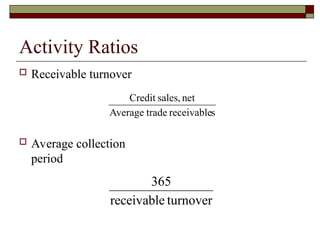
Chapter 14 discusses financial statement analysis, emphasizing its importance for managers, owners, lenders, and other stakeholders to assess a firm's profitability and risks. It outlines analytical tools such as vertical and horizontal analysis, ratio analysis, and highlights the significance of liquidity, solvency, and profitability ratios for comprehensive financial assessment. The document further details various financial metrics derived from income statements and balance sheets over multiple years.

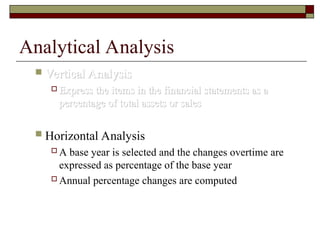
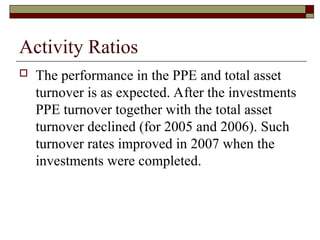
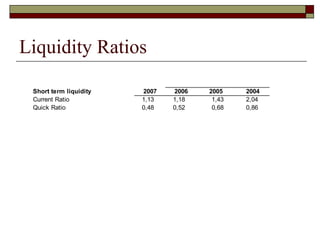
![Liquidity Ratios
Current ratio
Ability to meet short-term obligations
[Current assets/current liabilities]
Quick ratio
Remove less liquid assets
Keep cash, liquid investments, A/R
[(Cash+short-term investments + A/R)/current liabilities]](https://image.slidesharecdn.com/chapter14-5111-241203172931-44f57d0b/85/Chapter-14-511-1-ppt-financial-statments-21-320.jpg)
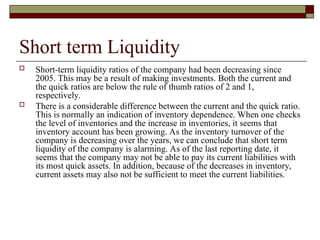
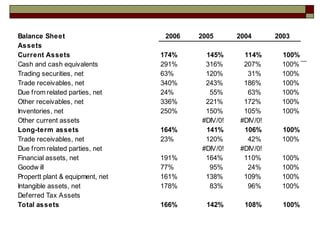
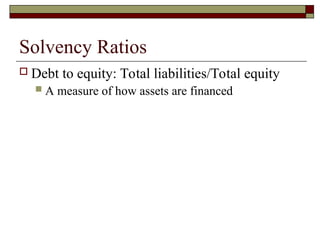
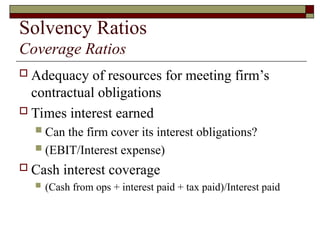
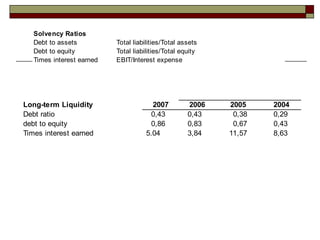
![Solvency Ratios
Debt to assets: Total liabilities/Total assets
Proportion of assets financed with debt
Could include interest bearing debt only
[(short term debt + noncurrent debt)/total assets]
Be aware that assets are recorded at historical
cost, which may be different from current
market value](https://image.slidesharecdn.com/chapter14-5111-241203172931-44f57d0b/85/Chapter-14-511-1-ppt-financial-statments-23-320.jpg)
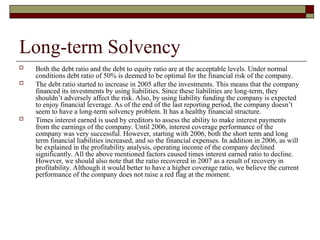
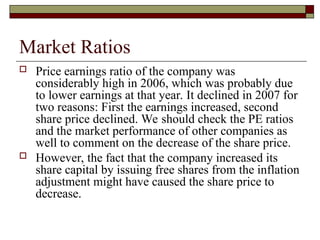
![Price Multiple Ratios
Market’s valuation of a firm’s common stock
P/E = Share price/Earnings per share
Price/book ratio compares stock’s price to the
recorded value of the net assets
[Share price/(Book value of equity/Share outstanding)]
Market Ratios 2007 2006 2005 2004
Price earnings ratio 12,73 46,67 16,93 11,16
price to book value 1,35 1,34 1,49 1,28](https://image.slidesharecdn.com/chapter14-5111-241203172931-44f57d0b/85/Chapter-14-511-1-ppt-financial-statments-32-320.jpg)