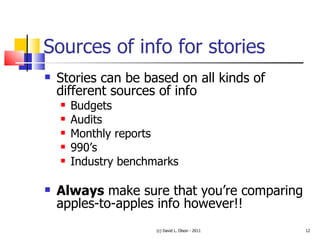
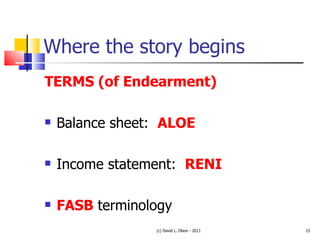
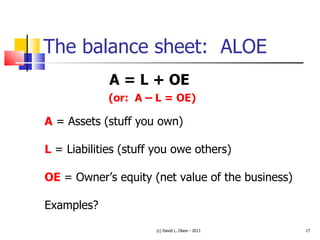
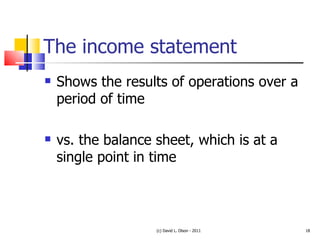
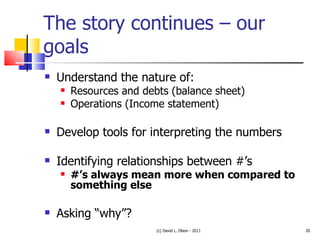
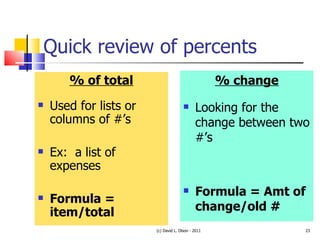
North Carolina Theatre Conference Financial Storytelling Presented by Dave Olson University of North Carolina School of the Arts July, 2011
(c) David L. Olson - 2011 A c c o u n t  F U N  i n g A c c o u n t   i n g =
Dave’s summer, so far Seminar - learned two things Engage the audience, right from the top Use simple pictures to tell your story (preferably hand-drawn) (c) David L. Olson - 2011
(c) David L. Olson - 2011
(c) David L. Olson - 2011 Next, I thought I’d try regular pictures – last year, Shane included a picture of his dog, so I thought I’d follow suit and try that this year, so…
(c) David L. Olson - 2011
Our goal today (c) David L. Olson - 2011 1, 9, 3,  4, 6,5, 7, 8,2,1
Who might want to know our story? Funders Bankers The press Employees The community Management! (c) David L. Olson - 2011
What kinds of stories? Assess the financial/operational health of an organization Strong vs. weak financial position? Long-term viability? Is the company a good investment? (c) David L. Olson - 2011
What types of information? Put yourself in the shoes of a foundation grant reviewer who is evaluating your organization What kinds of questions would they like to know about the company’s financial position? (c) David L. Olson - 2011
Financial storytelling Can also help to make better management decisions! In the end, we can put all of these types of questions/observations together to begin to “tell a story” (c) David L. Olson - 2011
Sources of info for stories Stories can be based on all kinds of different sources of info Budgets Audits Monthly reports 990’s Industry benchmarks Always  make sure that you’re comparing apples-to-apples info however!! (c) David L. Olson - 2011
A quick example The All-Pippin Dinner Theatre Audit Results - 2001 - 2009 What story does this tell? (c) David L. Olson - 2011
First, we must know the language (c) David L. Olson - 2011
Where the story begins TERMS (of Endearment) Balance sheet:  ALOE Income statement:  RENI FASB  terminology (c) David L. Olson - 2011
The balance sheet Shows the accumulated resources of the co. – its financial position At a given point in time (ex:  12/31/11) The value of the business after paying all its bills (c) David L. Olson - 2011
The balance sheet:  ALOE A = L + OE (or:  A – L = OE) A  = Assets (stuff you own) L  = Liabilities (stuff you owe others) OE  = Owner’s equity (net value of the business) Examples? (c) David L. Olson - 2011
The income statement Shows the results of operations over a period of time vs. the balance sheet, which is at a single point in time (c) David L. Olson - 2011
The Income Statement R evenue   -  E xpenses   =  N et  I ncome or profit/(loss) (c) David L. Olson - 2011
The story continues – our goals Understand the nature of:  Resources and debts (balance sheet) Operations (Income statement) Develop tools for interpreting the numbers Identifying relationships between #’s #’s always mean more when compared to something else Asking “why”? (c) David L. Olson - 2011
(c) David L. Olson - 2011
Summary of key tools %’s Ratios Totals Comparisons and trends Unusual items Audit info Benchmarking Relationships (c) David L. Olson - 2011
Quick review of percents % of total Used for lists or columns of #’s Ex:  a list of expenses Formula = item/total % change Looking for the change between two #’s Formula = Amt of change/old # (c) David L. Olson - 2011
Percent of total – pie chart (c) David L. Olson - 2011 What’s the story here?
Percent of total example Salaries   $60,000    (60/100=60%) Rent   $20,000    (20/100=20%) Insurance  $15,000    (15/100=15%) Other   $  5,000    (5/100=5%)  Total   $100,000  (100/100=100%) What’s the story here? (c) David L. Olson - 2011
Percent change example ‘ 10  ‘11  Diff Ticket price:  $100  $150  +$50 What’s the difference? What’s the old #? What’s the % change? (c) David L. Olson - 2011 $50 $100 50/100=.5 or a 50%
Ratios Just a fancy word for % “ Something” relative to “something else” A relationship Formula:  “something”/”something else” (c) David L. Olson - 2011
Some key ratios Income ratios Expense ratios Efficiency ratios Working capital ($) Current ratio (%) (c) David L. Olson - 2011
Income ratios % earned vs. % contributed Range of 40% - 60% in either direction not unusual Why important? (c) David L. Olson - 2011
Expense ratios From the income statement (audited) Program expenses  (min. 70%) Management and general expenses  (15%) Fundraising expenses  (15%) Statement of Functional Expenses Lists exp’s by the nature of the expenditure (c) David L. Olson - 2011
Efficiency ratios How efficient are you at generating a certain type of revenue Compare the cost of generating the revenue, to the revenue generated Can do this for many types of revenue sources (c) David L. Olson - 2011
Efficiency ratio formula Expense/revenue Should give you some % <1 Why? Gives you  “cost to raise (or earn) $1”  of revenue Key ratios:  Development, marketing (c) David L. Olson - 2011
Efficiency ratio example Total development expense:  $20,000 Total development income:  $100,000 $20,000/$100,000 = 20% Now, you can compare to other org’s (c) David L. Olson - 2011
Other storytelling tools Comparisons, trends, and relationships Unusual items Audit info Benchmarking against other organizations (c) David L. Olson - 2011
Items to always check Cash Pledges Debt Net income Net asset balances What does a negative balance here mean? (c) David L. Olson - 2011 Any relationship here?
Deficits – do you know the difference? Annual deficit Accumulated deficit Structural deficit (c) David L. Olson - 2011
Relationship example - cash Key:  double entry bookkeeping! Changes are  always  caused by something else Let’s say that cash doubles from yr 1 to yr 2 What are four reasons cash could double from the prior year? Always ask “why” (c) David L. Olson - 2011
Benchmarking (and a caveat!) What’s the goal of benchmarking? Be aware of context!! Your circumstances may be different than others in the group Data collection, reporting and classification (c) David L. Olson - 2011
Industry benchmarking Theatre Facts  www.tcg.org Non-profit professional theatres that are members of TCG Select “Tools and Research” Compare their %’s to yours By budget group size (c) David L. Olson - 2011
Theatre Facts (2009) Part 1:  Trend Theatres The same theatres (112) that have reported over the last 5 years Part 2:  Participating Theatres Theatres that responded to this year’s survey (c) David L. Olson - 2011
Theatre Facts “group” budgets Group 1: $10 million + Group 2:  $5,000,000 - $9,999,999 Group 3:  $3,000,000 - $4,999,999 Group 4:  $1,000,000 - $2,999,999 Group 5:  $  500,000 - $  999,999 Group 6:  $  499,999 – $  999,999 (c) David L. Olson - 2011
Let’s take a quick look TheatreFacts_2009.pdf Average earned Inc: p. 24, Table 15 (both $ and %) Key efficiency ratios:  p. 26, Table 16 Average expenses:  p. 27, Table 17, 18 Average $ gift, by source:  p. 29, Table 20 Average contrib’d inc.:  p. 30, Table 22 Key operating benchmarks:  p. 33, Table 25 (c) David L. Olson - 2011
Dave, let’s see this stuff in action! Now, let’s really put the  FUN  in account FUNi ng! All-Pippin Dinner Theatre Audit.pdf ArkansasSymphAuditFS.pdf (Work from the “unrestricted fund” only) (c) David L. Olson - 2011
Contact me E-mail:  [email_address] Twitter:  ArtsMgmtGuy LinkedIn:  Dave Olson (UNCSA) Cell:  612-799-1490 (c) David L. Olson - 2011

Financial storytelling

  • 1.
    North Carolina TheatreConference Financial Storytelling Presented by Dave Olson University of North Carolina School of the Arts July, 2011
  • 2.
    (c) David L.Olson - 2011 A c c o u n t F U N i n g A c c o u n t i n g =
  • 3.
    Dave’s summer, sofar Seminar - learned two things Engage the audience, right from the top Use simple pictures to tell your story (preferably hand-drawn) (c) David L. Olson - 2011
  • 4.
    (c) David L.Olson - 2011
  • 5.
    (c) David L.Olson - 2011 Next, I thought I’d try regular pictures – last year, Shane included a picture of his dog, so I thought I’d follow suit and try that this year, so…
  • 6.
    (c) David L.Olson - 2011
  • 7.
    Our goal today(c) David L. Olson - 2011 1, 9, 3, 4, 6,5, 7, 8,2,1
  • 8.
    Who might wantto know our story? Funders Bankers The press Employees The community Management! (c) David L. Olson - 2011
  • 9.
    What kinds ofstories? Assess the financial/operational health of an organization Strong vs. weak financial position? Long-term viability? Is the company a good investment? (c) David L. Olson - 2011
  • 10.
    What types ofinformation? Put yourself in the shoes of a foundation grant reviewer who is evaluating your organization What kinds of questions would they like to know about the company’s financial position? (c) David L. Olson - 2011
  • 11.
    Financial storytelling Canalso help to make better management decisions! In the end, we can put all of these types of questions/observations together to begin to “tell a story” (c) David L. Olson - 2011
  • 12.
    Sources of infofor stories Stories can be based on all kinds of different sources of info Budgets Audits Monthly reports 990’s Industry benchmarks Always make sure that you’re comparing apples-to-apples info however!! (c) David L. Olson - 2011
  • 13.
    A quick exampleThe All-Pippin Dinner Theatre Audit Results - 2001 - 2009 What story does this tell? (c) David L. Olson - 2011
  • 14.
    First, we mustknow the language (c) David L. Olson - 2011
  • 15.
    Where the storybegins TERMS (of Endearment) Balance sheet: ALOE Income statement: RENI FASB terminology (c) David L. Olson - 2011
  • 16.
    The balance sheetShows the accumulated resources of the co. – its financial position At a given point in time (ex: 12/31/11) The value of the business after paying all its bills (c) David L. Olson - 2011
  • 17.
    The balance sheet: ALOE A = L + OE (or: A – L = OE) A = Assets (stuff you own) L = Liabilities (stuff you owe others) OE = Owner’s equity (net value of the business) Examples? (c) David L. Olson - 2011
  • 18.
    The income statementShows the results of operations over a period of time vs. the balance sheet, which is at a single point in time (c) David L. Olson - 2011
  • 19.
    The Income StatementR evenue - E xpenses = N et I ncome or profit/(loss) (c) David L. Olson - 2011
  • 20.
    The story continues– our goals Understand the nature of: Resources and debts (balance sheet) Operations (Income statement) Develop tools for interpreting the numbers Identifying relationships between #’s #’s always mean more when compared to something else Asking “why”? (c) David L. Olson - 2011
  • 21.
    (c) David L.Olson - 2011
  • 22.
    Summary of keytools %’s Ratios Totals Comparisons and trends Unusual items Audit info Benchmarking Relationships (c) David L. Olson - 2011
  • 23.
    Quick review ofpercents % of total Used for lists or columns of #’s Ex: a list of expenses Formula = item/total % change Looking for the change between two #’s Formula = Amt of change/old # (c) David L. Olson - 2011
  • 24.
    Percent of total– pie chart (c) David L. Olson - 2011 What’s the story here?
  • 25.
    Percent of totalexample Salaries $60,000 (60/100=60%) Rent $20,000 (20/100=20%) Insurance $15,000 (15/100=15%) Other $ 5,000 (5/100=5%) Total $100,000 (100/100=100%) What’s the story here? (c) David L. Olson - 2011
  • 26.
    Percent change example‘ 10 ‘11 Diff Ticket price: $100 $150 +$50 What’s the difference? What’s the old #? What’s the % change? (c) David L. Olson - 2011 $50 $100 50/100=.5 or a 50%
  • 27.
    Ratios Just afancy word for % “ Something” relative to “something else” A relationship Formula: “something”/”something else” (c) David L. Olson - 2011
  • 28.
    Some key ratiosIncome ratios Expense ratios Efficiency ratios Working capital ($) Current ratio (%) (c) David L. Olson - 2011
  • 29.
    Income ratios %earned vs. % contributed Range of 40% - 60% in either direction not unusual Why important? (c) David L. Olson - 2011
  • 30.
    Expense ratios Fromthe income statement (audited) Program expenses (min. 70%) Management and general expenses (15%) Fundraising expenses (15%) Statement of Functional Expenses Lists exp’s by the nature of the expenditure (c) David L. Olson - 2011
  • 31.
    Efficiency ratios Howefficient are you at generating a certain type of revenue Compare the cost of generating the revenue, to the revenue generated Can do this for many types of revenue sources (c) David L. Olson - 2011
  • 32.
    Efficiency ratio formulaExpense/revenue Should give you some % <1 Why? Gives you “cost to raise (or earn) $1” of revenue Key ratios: Development, marketing (c) David L. Olson - 2011
  • 33.
    Efficiency ratio exampleTotal development expense: $20,000 Total development income: $100,000 $20,000/$100,000 = 20% Now, you can compare to other org’s (c) David L. Olson - 2011
  • 34.
    Other storytelling toolsComparisons, trends, and relationships Unusual items Audit info Benchmarking against other organizations (c) David L. Olson - 2011
  • 35.
    Items to alwayscheck Cash Pledges Debt Net income Net asset balances What does a negative balance here mean? (c) David L. Olson - 2011 Any relationship here?
  • 36.
    Deficits – doyou know the difference? Annual deficit Accumulated deficit Structural deficit (c) David L. Olson - 2011
  • 37.
    Relationship example -cash Key: double entry bookkeeping! Changes are always caused by something else Let’s say that cash doubles from yr 1 to yr 2 What are four reasons cash could double from the prior year? Always ask “why” (c) David L. Olson - 2011
  • 38.
    Benchmarking (and acaveat!) What’s the goal of benchmarking? Be aware of context!! Your circumstances may be different than others in the group Data collection, reporting and classification (c) David L. Olson - 2011
  • 39.
    Industry benchmarking TheatreFacts www.tcg.org Non-profit professional theatres that are members of TCG Select “Tools and Research” Compare their %’s to yours By budget group size (c) David L. Olson - 2011
  • 40.
    Theatre Facts (2009)Part 1: Trend Theatres The same theatres (112) that have reported over the last 5 years Part 2: Participating Theatres Theatres that responded to this year’s survey (c) David L. Olson - 2011
  • 41.
    Theatre Facts “group”budgets Group 1: $10 million + Group 2: $5,000,000 - $9,999,999 Group 3: $3,000,000 - $4,999,999 Group 4: $1,000,000 - $2,999,999 Group 5: $ 500,000 - $ 999,999 Group 6: $ 499,999 – $ 999,999 (c) David L. Olson - 2011
  • 42.
    Let’s take aquick look TheatreFacts_2009.pdf Average earned Inc: p. 24, Table 15 (both $ and %) Key efficiency ratios: p. 26, Table 16 Average expenses: p. 27, Table 17, 18 Average $ gift, by source: p. 29, Table 20 Average contrib’d inc.: p. 30, Table 22 Key operating benchmarks: p. 33, Table 25 (c) David L. Olson - 2011
  • 43.
    Dave, let’s seethis stuff in action! Now, let’s really put the FUN in account FUNi ng! All-Pippin Dinner Theatre Audit.pdf ArkansasSymphAuditFS.pdf (Work from the “unrestricted fund” only) (c) David L. Olson - 2011
  • 44.
    Contact me E-mail: [email_address] Twitter: ArtsMgmtGuy LinkedIn: Dave Olson (UNCSA) Cell: 612-799-1490 (c) David L. Olson - 2011

Editor's Notes

  • #6 You’ll be happy to hear, I gave up on the drawing – this would have taken forever. I may use a picture from time-to-time however… Shane showed us a picture of his dog at last year’s conference, so, to get started, I thought that I would do the same this year… So, here’s a picture of Shane’s dog!!
  • #11 How? What types of information ? How much operating cash do they have? How much debt are they carrying? Do they have enough cash to pay the bills? Are they breaking even or losing $$, each year? Where are their revenues coming from? Where are they spending their $$? Are any of their revenue streams “at-risk”? Are they carrying an accumulated deficit in their net assets? How efficient are they in the running of various aspects of their operation?
  • #15 A lot of unique terms, concepts in accounting – must know what the “industry” is referring to
  • #22 Use tools to tell the story
  • #29 % revenue split % expense split (70/15/15) Efficiency ratios : Fdr exp/fdr inc Mktg exp/Tkt sales Working capital : current assets – current liabilities – what does this tell us? Current ratio : current assets/current liabilities: proportion of curr assets to curr liabilities
  • #38 Look to: Decreases in pledges receivable? Increase in bank borrowings? Big increase in unearned ticket sales? Big gain on the P &amp; L?
  • #39 Shows where you fall relative to the group