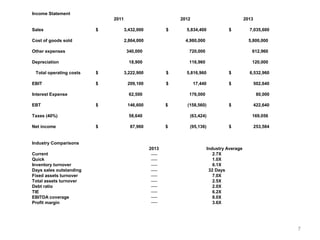
1 
October 15-17, 2014 - CreditScapeConference.com - #creditscape 
Financial Statement Analysis: 
Reading the Numbers Correctly!
Author/ Instructor 
DAVID L. OSBURN, MBA, CCRA 
David Osburn is the founder of Osburn & Associates, LLC that specializes in providing seminars, webinars, and 
keynote speeches to credit managers, CPAs, bankers, and attorneys on topics such as Banking/Finance/Credit, 
Negotiation Skills, Marketing, and Management. 
David also functions as a Contract CFO and works with medical practitioners, financial institutions, CPA firms, 
construction companies, and real estate developers. He is also an adjunct faculty member of both an accredited MBA 
program and the accounting department of a community college with over 29 years of teaching experience. 
David’s extensive professional background includes 14 years as a Business Trainer/Contract CFO and 16 years in 
banking (commercial lending) including the position of Vice President/Senior Banking Officer. 
David has an MBA in Finance/Marketing from Utah State University and a BS degree in Finance from Brigham Young 
University. He is also a graduate of the ABA National Commercial Lending School held at the University of Oklahoma. 
David also holds the professional designation of Certified Credit & Risk Analyst (CCRA) as granted by the National 
Association of Credit Management (NACM). 
Osburn & Associates, LLC 
A Business Training & Contract CFO Firm 
David L. Osburn, MBA, CCRA 
Managing Member 
7426 Alamo Summit Drive 
Las Vegas, Nevada 89129 
Direct: (702) 655-1187 
E-Mail: dlosburn@cox.net 
Web: dlosburn.com 
2
3 
Financial Statement Analysis: Reading the Numbers Correctly! 
Creditor: Loan officers and bond rating analysts analyze ratios to ascertain a 
company’s ability to pay its debts. 
Investor: Stock analysts assess the company’s efficiency, risk, and growth 
prospects through ratio analysis. 
Manager: Business owners and managers use ratios to analyze, control, and 
improve their firm’s operations. 
Guarantor: Business owners are usually required to guarantee their various 
business obligations and use “related” ratio analysis to determine their personal 
position.
Accounting Principles 
Accounting Basics – Quick Review of the Four Financial Statements: 
Income Statement 
Revenue – Expenses = Net Income (Net Loss) 
Statement of Retained Earnings 
Beginning Retained Earnings + Net Income (-Net Loss) – Dividends = Ending 
Retained Earnings 
Balance Sheet 
Assets = Liabilities + Owner’s Equity 
Statement of Cash Flows 
Operating, Investing & Financing Cash Flows 
4
5 
A. Liquidity Ratios 
Definition: 
Working Capital = Current Assets – Current Liabilities 
Current Ratio = Current Assets 
Current Liabilities 
Quick Ratio (Acid Test) = Current Assets-Inventory/Current Liabilities 
Adjustments: Prepaid Expenses, Due From Officers, Shareholders & Employees
6 
SNIDER CORPORATION: 
Balance Sheet 
2011 2012 2013 
Assets 
Cash $ 9,000 $ 7,282 $ 14,000 
Short-term investments 48,600 20,000 71,632 
Accounts receivable 351,200 632,160 878,000 
Inventories 715,200 1,287,360 1,716,480 
Total current assets $ 1,124,000 $ 1,946,802 $ 2,680,112 
Gross fixed assets 491,000 1,202,950 1,220,000 
Less: Accumulated depreciation 146,200 263,160 383,160 
Net fixed assets $ 344,800 $ 939,790 $ 836,840 
Total assets $ 1,468,800 $ 2,886,592 $ 3,516,952 
2011 2012 2013 
Liabilities and Equity 
Accounts payable $ 145,600 $ 324,000 $ 359,800 
Notes payable 200,000 720,000 300,000 
Accruals 136,000 284,960 380,000 
Total current liabilities $ 481,600 $ 1,328,960 $ 1,039,800 
Long-term debt 323,432 1,000,000 500,000 
Common stock 460,000 460,000 1,680,936 
Retained earnings 203,768 97,632 296,216 
Total equity $ 663,268 $ 557,632 $ 1,977,152 
Total liabilities and equity $ 1,468,800 $ 2,886,592 $ 3,516,952
7 
Income Statement 
2011 2012 2013 
Sales $ 3,432,000 $ 5,834,400 $ 7,035,600 
Cost of goods sold 2,864,000 4,980,000 5,800,000 
Other expenses 
340,000 720,000 612,960 
Depreciation 
18,900 116,960 120,000 
Total operating costs $ 3,222,900 $ 5,816,960 $ 6,532,960 
EBIT $ 209,100 $ 17,440 $ 502,640 
Interest Expense 
62,500 176,000 80,000 
EBT $ 146,600 $ (158,560) $ 422,640 
Taxes (40%) 
58,640 
(63,424) 169,056 
Net income $ 87,960 $ (95,136) $ 253,584 
Industry Comparisons 
2013 Industry Average 
Current 2.7X 
Quick 1.0X 
Inventory turnover 6.1X 
Days sales outstanding 32 Days 
Fixed assets turnover 7.0X 
Total assets turnover 2.5X 
Debt ratio 2.0X 
TIE 6.2X 
EBITDA coverage 8.0X 
Profit margin 3.6X
Tasks: 
1) Calculate Snider Corporation’s working capital, current ratio, and quick (acid 
test) ratio. 
Comment on the company’s liquidity position. 
2) Snider Corporation is owned by one principal (Jim “Saw tooth” Snider) with 
personal liquidity consisting of the following: 
$25,000 Cash 
15,000 Mutual funds 
75,000 Individual unlisted stock 
90,000 IRAs 
$205,000 
Comment on Mr. Snider’s personal liquidity. 
Note: The principal’s personal liquidity becomes a major strength of the 
principal’s guarantee (tertiary source of repayment). 8
B. Activity (Turn Factors) 
Definition: 
Account Receivable Turnover 
(A/R / Sales X Days in Period) 
Accounts Payable Turnover 
(A/P / COGS X Days in Period) 
Inventory Turnover 
(Inventory/COGS X Days in Period) 
Task: 
Calculate Snider Corporation’s A/R turnover, A/P turnover, and Inventory 
turnover. 
Comment on the company’s activity. 9
C. Leverage 
Definition: 
Debt Ratio = Debt/Net Worth (Equity) 
Adjustment: Subordinated Debt 
Tasks: 
Calculate the debt to worth ratio for Snider Corporation. 
Comment on the company’s leverage position. 
10
D. Operating Performance 
Definition: 
Common-Size Analysis Vertical - Income Statement (Percent of Sales) 
Net sales $5,000,000 (100%) 
COGS 4,400,000 ( 88%) 
Gross Profit $600,000 ( 12%) 
G & A Expense 350,000 ( 7%) 
Net Profit $250,000 ( 5%) 
Note: 
Common-size analysis vertical – Expresses comparison in percentage of the 
proportional expression of each item in a given period to a base figure selected 
from the same period. 
Common-size analysis horizontal – Expresses comparison in percentage of the 
proportionate change over a period of time. 
11
E. Cash Flow Models - Traditional versus Cash Basis: 
Definition: 
Traditional Cash Flow Analysis 
EBITDA $1,200M 
Less: Debt Ser. (P&I) 500M 
Margin $700M 
DCR 2.4X 
(EBITDA = Net Profit + Interest Expense + Taxes + Depreciation + Amortization) 
Note: Most lenders require a minimum DCR of 1.25X. 
12
C. Personal Cash Flow (Business Owner/Guarantor) 
Salary + Business Income+ $500M 
Rental Income, etc. = Total Income 
Less: Federal Taxes 150M 
Cash Flow Available $350M 
For Debt Service 
Less: Debt Service (P&I) $200M 
Margin $150M 
DCR 1.75X 
Note: Most lenders want to see a minimum guarantor DCR of 1.50X 
13
14 
D. Global Cash Flow 
Business Cash Flow + Personal Cash Flow (Business 
Owner/Guarantor) 
Business Cash Flow: 
EBITDA $1,200M 
Less: Debt Ser (P&I) 500M 
Margin $700M 
Personal Cash Flow: 
Cash Flow Available $350M 
For Debt Service 
Less: Debt Service (P&I) 200M 
Margin $150M 
Combined Margin $850M 
Combined DCR 2.21X
15
16 
The Z-score (Bankruptcy Predictor): 
The following is the Z-Score formula (for manufacturing firms), which is built out of the five weighted 
financial ratios: 
Z-Score = 1.2A + 1.4B + 3.3C + 0.6D + 1.0E 
Where: 
A = Working Capital/Total Assets 
B = Retained Earnings/Total Assets 
C = Earnings Before Interest & Tax/Total Assets 
D = Market Value of Equity/Total Liabilities 
E = Sales/Total Assets 
FYE FYE FYE Interim 
12/31/08 12/31/09 12/31/10 1/31/11 
Scale 
Z-Score 2.92 (.93) 8.06 7.93 
Bankruptcy 
Characteristics: 0-1.80 
Gray Zone: 1.81-3.00 
Non-Bankruptcy Over 3.00 
Characteristics:
17 
Sustainable Growth Model: 
The sustainable growth rate, according to Robert C. Higgins, is the maximum growth rate a company 
can achieve consistent with the firm’s established financial policy. Basically, it is calculated as: 
SGR = (pm*(1-d)*(1+L)) / (T-(pm*(1-d)*(1+L))) 
•pm is the existing and target profit margin 
•d is the target dividend payout ratio 
•L is the target total debt to equity ratio 
•T is the ratio of total assets to sales 
In order to grow faster, the company would have to invest more equity capital, increase its financial 
leverage or increase the target profit margin. 
Example: 
FYE FYE FYE Interim 
12/31/08 12/31/09 12/31/10 1/31/11 
107.39 62.95 (10.57) (36.71)

Financial Statement Analysis - Reading the Numbers Correctly

  • 1.
    1 October 15-17,2014 - CreditScapeConference.com - #creditscape Financial Statement Analysis: Reading the Numbers Correctly!
  • 2.
    Author/ Instructor DAVIDL. OSBURN, MBA, CCRA David Osburn is the founder of Osburn & Associates, LLC that specializes in providing seminars, webinars, and keynote speeches to credit managers, CPAs, bankers, and attorneys on topics such as Banking/Finance/Credit, Negotiation Skills, Marketing, and Management. David also functions as a Contract CFO and works with medical practitioners, financial institutions, CPA firms, construction companies, and real estate developers. He is also an adjunct faculty member of both an accredited MBA program and the accounting department of a community college with over 29 years of teaching experience. David’s extensive professional background includes 14 years as a Business Trainer/Contract CFO and 16 years in banking (commercial lending) including the position of Vice President/Senior Banking Officer. David has an MBA in Finance/Marketing from Utah State University and a BS degree in Finance from Brigham Young University. He is also a graduate of the ABA National Commercial Lending School held at the University of Oklahoma. David also holds the professional designation of Certified Credit & Risk Analyst (CCRA) as granted by the National Association of Credit Management (NACM). Osburn & Associates, LLC A Business Training & Contract CFO Firm David L. Osburn, MBA, CCRA Managing Member 7426 Alamo Summit Drive Las Vegas, Nevada 89129 Direct: (702) 655-1187 E-Mail: dlosburn@cox.net Web: dlosburn.com 2
  • 3.
    3 Financial StatementAnalysis: Reading the Numbers Correctly! Creditor: Loan officers and bond rating analysts analyze ratios to ascertain a company’s ability to pay its debts. Investor: Stock analysts assess the company’s efficiency, risk, and growth prospects through ratio analysis. Manager: Business owners and managers use ratios to analyze, control, and improve their firm’s operations. Guarantor: Business owners are usually required to guarantee their various business obligations and use “related” ratio analysis to determine their personal position.
  • 4.
    Accounting Principles AccountingBasics – Quick Review of the Four Financial Statements: Income Statement Revenue – Expenses = Net Income (Net Loss) Statement of Retained Earnings Beginning Retained Earnings + Net Income (-Net Loss) – Dividends = Ending Retained Earnings Balance Sheet Assets = Liabilities + Owner’s Equity Statement of Cash Flows Operating, Investing & Financing Cash Flows 4
  • 5.
    5 A. LiquidityRatios Definition: Working Capital = Current Assets – Current Liabilities Current Ratio = Current Assets Current Liabilities Quick Ratio (Acid Test) = Current Assets-Inventory/Current Liabilities Adjustments: Prepaid Expenses, Due From Officers, Shareholders & Employees
  • 6.
    6 SNIDER CORPORATION: Balance Sheet 2011 2012 2013 Assets Cash $ 9,000 $ 7,282 $ 14,000 Short-term investments 48,600 20,000 71,632 Accounts receivable 351,200 632,160 878,000 Inventories 715,200 1,287,360 1,716,480 Total current assets $ 1,124,000 $ 1,946,802 $ 2,680,112 Gross fixed assets 491,000 1,202,950 1,220,000 Less: Accumulated depreciation 146,200 263,160 383,160 Net fixed assets $ 344,800 $ 939,790 $ 836,840 Total assets $ 1,468,800 $ 2,886,592 $ 3,516,952 2011 2012 2013 Liabilities and Equity Accounts payable $ 145,600 $ 324,000 $ 359,800 Notes payable 200,000 720,000 300,000 Accruals 136,000 284,960 380,000 Total current liabilities $ 481,600 $ 1,328,960 $ 1,039,800 Long-term debt 323,432 1,000,000 500,000 Common stock 460,000 460,000 1,680,936 Retained earnings 203,768 97,632 296,216 Total equity $ 663,268 $ 557,632 $ 1,977,152 Total liabilities and equity $ 1,468,800 $ 2,886,592 $ 3,516,952
  • 7.
    7 Income Statement 2011 2012 2013 Sales $ 3,432,000 $ 5,834,400 $ 7,035,600 Cost of goods sold 2,864,000 4,980,000 5,800,000 Other expenses 340,000 720,000 612,960 Depreciation 18,900 116,960 120,000 Total operating costs $ 3,222,900 $ 5,816,960 $ 6,532,960 EBIT $ 209,100 $ 17,440 $ 502,640 Interest Expense 62,500 176,000 80,000 EBT $ 146,600 $ (158,560) $ 422,640 Taxes (40%) 58,640 (63,424) 169,056 Net income $ 87,960 $ (95,136) $ 253,584 Industry Comparisons 2013 Industry Average Current 2.7X Quick 1.0X Inventory turnover 6.1X Days sales outstanding 32 Days Fixed assets turnover 7.0X Total assets turnover 2.5X Debt ratio 2.0X TIE 6.2X EBITDA coverage 8.0X Profit margin 3.6X
  • 8.
    Tasks: 1) CalculateSnider Corporation’s working capital, current ratio, and quick (acid test) ratio. Comment on the company’s liquidity position. 2) Snider Corporation is owned by one principal (Jim “Saw tooth” Snider) with personal liquidity consisting of the following: $25,000 Cash 15,000 Mutual funds 75,000 Individual unlisted stock 90,000 IRAs $205,000 Comment on Mr. Snider’s personal liquidity. Note: The principal’s personal liquidity becomes a major strength of the principal’s guarantee (tertiary source of repayment). 8
  • 9.
    B. Activity (TurnFactors) Definition: Account Receivable Turnover (A/R / Sales X Days in Period) Accounts Payable Turnover (A/P / COGS X Days in Period) Inventory Turnover (Inventory/COGS X Days in Period) Task: Calculate Snider Corporation’s A/R turnover, A/P turnover, and Inventory turnover. Comment on the company’s activity. 9
  • 10.
    C. Leverage Definition: Debt Ratio = Debt/Net Worth (Equity) Adjustment: Subordinated Debt Tasks: Calculate the debt to worth ratio for Snider Corporation. Comment on the company’s leverage position. 10
  • 11.
    D. Operating Performance Definition: Common-Size Analysis Vertical - Income Statement (Percent of Sales) Net sales $5,000,000 (100%) COGS 4,400,000 ( 88%) Gross Profit $600,000 ( 12%) G & A Expense 350,000 ( 7%) Net Profit $250,000 ( 5%) Note: Common-size analysis vertical – Expresses comparison in percentage of the proportional expression of each item in a given period to a base figure selected from the same period. Common-size analysis horizontal – Expresses comparison in percentage of the proportionate change over a period of time. 11
  • 12.
    E. Cash FlowModels - Traditional versus Cash Basis: Definition: Traditional Cash Flow Analysis EBITDA $1,200M Less: Debt Ser. (P&I) 500M Margin $700M DCR 2.4X (EBITDA = Net Profit + Interest Expense + Taxes + Depreciation + Amortization) Note: Most lenders require a minimum DCR of 1.25X. 12
  • 13.
    C. Personal CashFlow (Business Owner/Guarantor) Salary + Business Income+ $500M Rental Income, etc. = Total Income Less: Federal Taxes 150M Cash Flow Available $350M For Debt Service Less: Debt Service (P&I) $200M Margin $150M DCR 1.75X Note: Most lenders want to see a minimum guarantor DCR of 1.50X 13
  • 14.
    14 D. GlobalCash Flow Business Cash Flow + Personal Cash Flow (Business Owner/Guarantor) Business Cash Flow: EBITDA $1,200M Less: Debt Ser (P&I) 500M Margin $700M Personal Cash Flow: Cash Flow Available $350M For Debt Service Less: Debt Service (P&I) 200M Margin $150M Combined Margin $850M Combined DCR 2.21X
  • 15.
  • 16.
    16 The Z-score(Bankruptcy Predictor): The following is the Z-Score formula (for manufacturing firms), which is built out of the five weighted financial ratios: Z-Score = 1.2A + 1.4B + 3.3C + 0.6D + 1.0E Where: A = Working Capital/Total Assets B = Retained Earnings/Total Assets C = Earnings Before Interest & Tax/Total Assets D = Market Value of Equity/Total Liabilities E = Sales/Total Assets FYE FYE FYE Interim 12/31/08 12/31/09 12/31/10 1/31/11 Scale Z-Score 2.92 (.93) 8.06 7.93 Bankruptcy Characteristics: 0-1.80 Gray Zone: 1.81-3.00 Non-Bankruptcy Over 3.00 Characteristics:
  • 17.
    17 Sustainable GrowthModel: The sustainable growth rate, according to Robert C. Higgins, is the maximum growth rate a company can achieve consistent with the firm’s established financial policy. Basically, it is calculated as: SGR = (pm*(1-d)*(1+L)) / (T-(pm*(1-d)*(1+L))) •pm is the existing and target profit margin •d is the target dividend payout ratio •L is the target total debt to equity ratio •T is the ratio of total assets to sales In order to grow faster, the company would have to invest more equity capital, increase its financial leverage or increase the target profit margin. Example: FYE FYE FYE Interim 12/31/08 12/31/09 12/31/10 1/31/11 107.39 62.95 (10.57) (36.71)