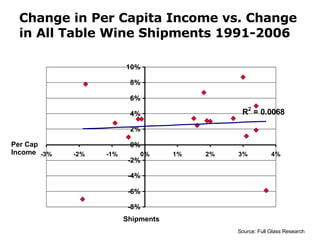
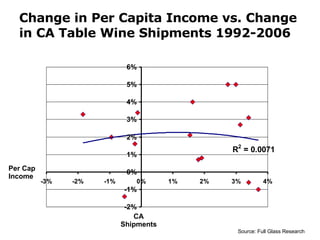
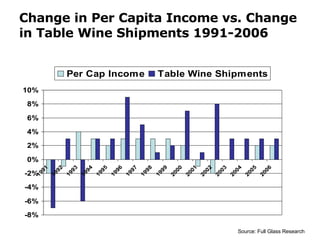
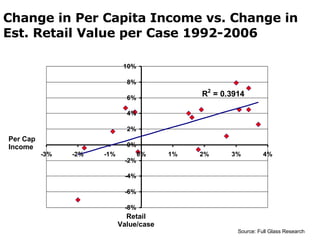
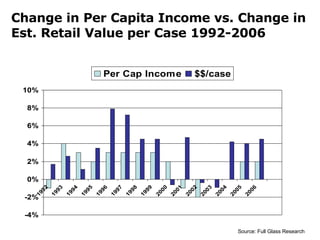
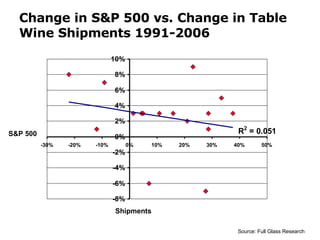
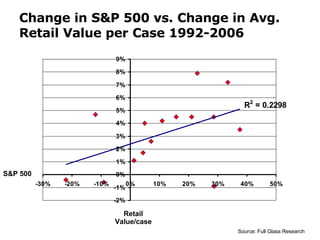
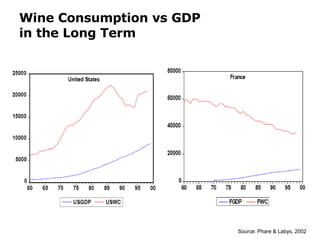
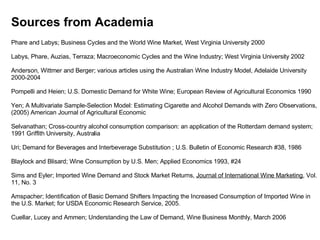
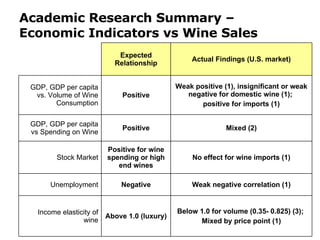
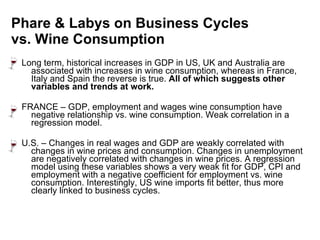
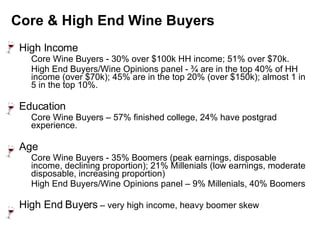
How Wine Sales May Change in 2008   Economic Indicators vs. Wine Sales Christian Miller Full Glass Research, Wine Opinions May 19, 2008
How will changes in the economy affect wine  sales? Will economic troubles derail the wine boom? If there’s an impact, can we estimate how much of an effect it will be? The Economy vs. Wine Sales
A Quick Look at the Numbers Some historical precedents Academic research The economic status of core wine buyers Where does this leave us? Economic Indicators vs. Wine Sales
Change in Per Capita Income vs. Change in All Table Wine Shipments 1991-2006 Per Cap Income Shipments Source: Full Glass Research
Change in Per Capita Income vs. Change in CA Table Wine Shipments 1992-2006 CA Shipments Per Cap Income Source: Full Glass Research
Change in Per Capita Income vs. Change in Table Wine Shipments 1991-2006 Source: Full Glass Research
Change in Per Capita Income vs. Change in Est. Retail Value per Case 1992-2006 Per Cap Income Retail Value/case Source: Full Glass Research
Change in Per Capita Income vs. Change in Est. Retail Value per Case 1992-2006 Source: Full Glass Research
Change in S&P 500 vs. Change in Table Wine Shipments 1991-2006 Shipments S&P 500 Source: Full Glass Research
Change in S&P 500 vs. Change in Avg. Retail Value per Case 1992-2006 S&P 500 Retail Value/case Source: Full Glass Research
Wine Consumption vs GDP in the Long Term Source: Phare & Labys, 2002
Phare and Labys; Business Cycles and the World Wine Market, West Virginia University 2000 Labys, Phare, Auzias, Terraza; Macroeconomic Cycles and the Wine Industry; West Virginia University 2002 Anderson, Wittmer and Berger; various articles using the Australian Wine Industry Model, Adelaide University 2000-2004 Pompelli and Heien; U.S. Domestic Demand for White Wine; European Review of Agricultural Economics 1990 Yen; A Multivariate Sample-Selection Model: Estimating Cigarette and Alcohol Demands with Zero Observations, (2005) American Journal of Agricultural Economic Selvanathan; Cross-country alcohol consumption comparison: an application of the Rotterdam demand system; 1991 Griffith University, Australia Uri; Demand for Beverages and Interbeverage Substitution ; U.S. Bulletin of Economic Research #38, 1986 Blaylock and Blisard; Wine Consumption by U.S. Men; Applied Economics 1993, #24 Sims and Eyler; Imported Wine Demand and Stock Market Returns,  Journal of International Wine Marketing , Vol. 11, No. 3 Amspacher; Identification of Basic Demand Shifters Impacting the Increased Consumption of Imported Wine in the U.S. Market; for USDA Economic Research Service, 2005. Cuellar, Lucey and Ammen; Understanding the Law of Demand, Wine Business Monthly, March 2006 Sources from Academia
Academic Research Summary – Economic Indicators vs Wine Sales Weak negative correlation (1) Negative Unemployment No effect for wine imports (1) Positive for wine spending or high end wines Stock Market Actual Findings (U.S. market) Expected Relationship Above 1.0 (luxury) Positive Positive Below 1.0 for volume (0.35- 0.825) (3);  Mixed by price point (1) Mixed (2) Weak positive (1), insignificant or weak negative for domestic wine (1);  positive for imports (1) Income elasticity of wine GDP, GDP per capita vs. Volume of Wine Consumption GDP, GDP per capita vs Spending on Wine
Phare & Labys on Business Cycles vs. Wine Consumption Long term, historical increases in GDP in US, UK and Australia are associated with increases in wine consumption, whereas in France, Italy and Spain the reverse is true.  All of which suggests other variables and trends at work. FRANCE – GDP, employment and wages wine consumption have negative relationship vs. wine consumption. Weak correlation in a regression model. U.S. – Changes in real wages and GDP are weakly correlated with changes in wine prices and consumption. Changes in unemployment are negatively correlated with changes in wine prices. A regression model using these variables shows a very weak fit for GDP, CPI and employment with a negative coefficient for employment vs. wine consumption. Interestingly, US wine imports fit better, thus more clearly linked to business cycles.
Core & High End Wine Buyers High Income Core Wine Buyers - 30% over $100k HH income; 51% over $70k.  High End Buyers/Wine Opinions panel - ¾ are in the top 40% of HH income (over $70k); 45% are in the top 20% (over $150k); almost 1 in 5 in the top 10%. Education Core Wine Buyers – 57% finished college, 24% have postgrad experience. Age Core Wine Buyers - 35% Boomers (peak earnings, disposable income, declining proportion); 21% Millenials (low earnings, moderate disposable, increasing proportion) High End Buyers/Wine Opinions panel – 9% Millenials, 40% Boomers High End Buyers  – very high income, heavy boomer skew
Core & High End Wine Buyers:  Are they feeling the pain? Income Wealth  Real Estate, Home Equity, Geographic variations Stock Market Unemployment Millenials and Gen X
Channel Shift On-premise Travel and vacation Business Entertainment Restaurant spending Off-Premise Previous downturn coincided with excess supply This time? (channel wars?) Direct Sales Club membership High End segment “ Safe” wines?
A Rough Summary Two things that all studies agree on: Other variables besides economics have significant and sometimes overwhelming effects on wine consumption Wine consumption by volume is inelastic vs. income Volume will probably continue to rise Dollar spending  might  decline IF there are no strong counter-cyclical trends.  Less supply pressure to cut deals; but high cross-price elasticity as consumers become more experimental and quality/distribution continue to rise Business spending downturn? Energy price and wealth-driven vacation downturn?
Keep an eye on… Spread of real estate downturn and credit crunch Income and Employment among Millenials Channel shift Cut-back in higher priced wine purchases Direct Sales Business spending Summer vacations Trends in Culture & Taste?

Test

  • 1.
    How Wine SalesMay Change in 2008 Economic Indicators vs. Wine Sales Christian Miller Full Glass Research, Wine Opinions May 19, 2008
  • 2.
    How will changesin the economy affect wine sales? Will economic troubles derail the wine boom? If there’s an impact, can we estimate how much of an effect it will be? The Economy vs. Wine Sales
  • 3.
    A Quick Lookat the Numbers Some historical precedents Academic research The economic status of core wine buyers Where does this leave us? Economic Indicators vs. Wine Sales
  • 4.
    Change in PerCapita Income vs. Change in All Table Wine Shipments 1991-2006 Per Cap Income Shipments Source: Full Glass Research
  • 5.
    Change in PerCapita Income vs. Change in CA Table Wine Shipments 1992-2006 CA Shipments Per Cap Income Source: Full Glass Research
  • 6.
    Change in PerCapita Income vs. Change in Table Wine Shipments 1991-2006 Source: Full Glass Research
  • 7.
    Change in PerCapita Income vs. Change in Est. Retail Value per Case 1992-2006 Per Cap Income Retail Value/case Source: Full Glass Research
  • 8.
    Change in PerCapita Income vs. Change in Est. Retail Value per Case 1992-2006 Source: Full Glass Research
  • 9.
    Change in S&P500 vs. Change in Table Wine Shipments 1991-2006 Shipments S&P 500 Source: Full Glass Research
  • 10.
    Change in S&P500 vs. Change in Avg. Retail Value per Case 1992-2006 S&P 500 Retail Value/case Source: Full Glass Research
  • 11.
    Wine Consumption vsGDP in the Long Term Source: Phare & Labys, 2002
  • 12.
    Phare and Labys;Business Cycles and the World Wine Market, West Virginia University 2000 Labys, Phare, Auzias, Terraza; Macroeconomic Cycles and the Wine Industry; West Virginia University 2002 Anderson, Wittmer and Berger; various articles using the Australian Wine Industry Model, Adelaide University 2000-2004 Pompelli and Heien; U.S. Domestic Demand for White Wine; European Review of Agricultural Economics 1990 Yen; A Multivariate Sample-Selection Model: Estimating Cigarette and Alcohol Demands with Zero Observations, (2005) American Journal of Agricultural Economic Selvanathan; Cross-country alcohol consumption comparison: an application of the Rotterdam demand system; 1991 Griffith University, Australia Uri; Demand for Beverages and Interbeverage Substitution ; U.S. Bulletin of Economic Research #38, 1986 Blaylock and Blisard; Wine Consumption by U.S. Men; Applied Economics 1993, #24 Sims and Eyler; Imported Wine Demand and Stock Market Returns, Journal of International Wine Marketing , Vol. 11, No. 3 Amspacher; Identification of Basic Demand Shifters Impacting the Increased Consumption of Imported Wine in the U.S. Market; for USDA Economic Research Service, 2005. Cuellar, Lucey and Ammen; Understanding the Law of Demand, Wine Business Monthly, March 2006 Sources from Academia
  • 13.
    Academic Research Summary– Economic Indicators vs Wine Sales Weak negative correlation (1) Negative Unemployment No effect for wine imports (1) Positive for wine spending or high end wines Stock Market Actual Findings (U.S. market) Expected Relationship Above 1.0 (luxury) Positive Positive Below 1.0 for volume (0.35- 0.825) (3); Mixed by price point (1) Mixed (2) Weak positive (1), insignificant or weak negative for domestic wine (1); positive for imports (1) Income elasticity of wine GDP, GDP per capita vs. Volume of Wine Consumption GDP, GDP per capita vs Spending on Wine
  • 14.
    Phare & Labyson Business Cycles vs. Wine Consumption Long term, historical increases in GDP in US, UK and Australia are associated with increases in wine consumption, whereas in France, Italy and Spain the reverse is true. All of which suggests other variables and trends at work. FRANCE – GDP, employment and wages wine consumption have negative relationship vs. wine consumption. Weak correlation in a regression model. U.S. – Changes in real wages and GDP are weakly correlated with changes in wine prices and consumption. Changes in unemployment are negatively correlated with changes in wine prices. A regression model using these variables shows a very weak fit for GDP, CPI and employment with a negative coefficient for employment vs. wine consumption. Interestingly, US wine imports fit better, thus more clearly linked to business cycles.
  • 15.
    Core & HighEnd Wine Buyers High Income Core Wine Buyers - 30% over $100k HH income; 51% over $70k. High End Buyers/Wine Opinions panel - ¾ are in the top 40% of HH income (over $70k); 45% are in the top 20% (over $150k); almost 1 in 5 in the top 10%. Education Core Wine Buyers – 57% finished college, 24% have postgrad experience. Age Core Wine Buyers - 35% Boomers (peak earnings, disposable income, declining proportion); 21% Millenials (low earnings, moderate disposable, increasing proportion) High End Buyers/Wine Opinions panel – 9% Millenials, 40% Boomers High End Buyers – very high income, heavy boomer skew
  • 16.
    Core & HighEnd Wine Buyers: Are they feeling the pain? Income Wealth Real Estate, Home Equity, Geographic variations Stock Market Unemployment Millenials and Gen X
  • 17.
    Channel Shift On-premiseTravel and vacation Business Entertainment Restaurant spending Off-Premise Previous downturn coincided with excess supply This time? (channel wars?) Direct Sales Club membership High End segment “ Safe” wines?
  • 18.
    A Rough SummaryTwo things that all studies agree on: Other variables besides economics have significant and sometimes overwhelming effects on wine consumption Wine consumption by volume is inelastic vs. income Volume will probably continue to rise Dollar spending might decline IF there are no strong counter-cyclical trends. Less supply pressure to cut deals; but high cross-price elasticity as consumers become more experimental and quality/distribution continue to rise Business spending downturn? Energy price and wealth-driven vacation downturn?
  • 19.
    Keep an eyeon… Spread of real estate downturn and credit crunch Income and Employment among Millenials Channel shift Cut-back in higher priced wine purchases Direct Sales Business spending Summer vacations Trends in Culture & Taste?