Financial analysis sony corp - sony corporation manufactures audio, home video game consoles, communications, key device and information technology products for the consumer and professional markets
•
1 like•1,319 views

Sony Corporation manufactures consumer electronics, video game consoles, and professional equipment. In fiscal year 2012, Sony reported revenue of 6.49 trillion JPY, with 162,700 employees globally. Sony has several business segments including consumer products, professional solutions, financial services, and motion pictures. Geographically, Sony generates the most sales from Japan, Europe, and North America. Sony faces challenges with an aging consumer base and increasing competition from other electronics manufacturers.

Recommended
More Related Content
What's hot
What's hot (20)
Similar to Financial analysis sony corp - sony corporation manufactures audio, home video game consoles, communications, key device and information technology products for the consumer and professional markets
Similar to Financial analysis sony corp - sony corporation manufactures audio, home video game consoles, communications, key device and information technology products for the consumer and professional markets (20)
More from BCV
More from BCV (20)
Financial analysis sony corp - sony corporation manufactures audio, home video game consoles, communications, key device and information technology products for the consumer and professional markets
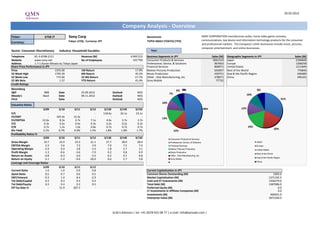
- 1. 20.02.2013 Company Analysis - Overview Ticker: 6758 JT Sony Corp Benchmark: SONY CORPORATION manufactures audio, home video game consoles, Tokyo: 6758, Currency: JPY TOPIX INDEX (TOKYO) (TPX) communications, key device and information technology products for the consumer Currency: and professional markets. The Company's other businesses include music, pictures, computer entertainment, and online businesses. Sector: Consumer Discretionary Industry: Household Durables Year: Telephone 81-3-6748-2111 Revenue (M) 6'493'212 Business Segments in JPY Sales (M) Geographic Segments in JPY Sales (M) Website www.sony.net No of Employees 162'700 Consumer Products & Services 3061214 Japan 2104669 Address 1-7-1 Konan Minato-ku Tokyo Japan Professional, Device, & Solutions 967603 Europe 1268258 Share Price Performance in JPY Financial Services 868971 United States 1211849 Price 1355.00 1M Return 17.9% Motion Pictures Production 656097 Rest of the World 776846 52 Week High 1795.39 6M Return 45.2% Music Production 430751 Asia & the Pacific Region 636489 52 Week Low 772.00 52 Wk Return -17.7% Other - Disk Manufacturing, etc. 378071 China 495101 52 Wk Beta 1.57 YTD Return 41.4% Sony Mobile 77732 Credit Ratings Bloomberg - 6% 1% 0% 8% S&P BBB Date 25.09.2012 Outlook NEG 7% Moody's Baa3 Date 09.11.2012 Outlook NEG 10% Fitch - Date - Outlook NEG 31% 10% Valuation Ratios 3/09 3/10 3/11 3/12 3/13E 3/14E 3/15E 48% 12% P/E - - - - 118.6x 26.1x 23.1x EV/EBIT - 105.4x 12.3x - - - - 13% EV/EBITDA 12.6x 8.3x 4.7x 7.1x 4.0x 3.7x 3.7x P/S 0.3x 0.5x 0.4x 0.3x 0.2x 0.2x 0.2x P/B 0.7x 1.2x 1.0x 0.8x 0.7x 0.7x 0.7x 19% 20% Div Yield 2.1% 0.7% 0.9% 1.5% 1.8% 1.8% 1.7% 15% Profitability Ratios % 3/09 3/10 3/11 3/12 3/13E 3/14E 3/15E Consumer Products & Services Gross Margin 19.7 22.9 23.3 21.1 27.7 28.0 28.4 Professional, Device, & Solutions Japan EBITDA Margin 2.3 5.6 7.3 3.9 7.0 7.5 7.4 Financial Services Europe Operating Margin -2.9 0.4 2.8 -1.0 1.8 2.7 3.1 Motion Pictures Production United States Profit Margin -1.3 -0.6 -3.6 -7.0 0.2 0.8 0.9 Music Production Rest of the World Return on Assets -0.8 -0.3 -2.0 -3.5 0.2 0.7 0.8 Other - Disk Manufacturing, etc. Asia & the Pacific Region Return on Equity -3.1 -1.4 -9.4 -20.0 0.6 2.7 3.8 Sony Mobile China Leverage and Coverage Ratios 3/09 3/10 3/11 3/12 Current Ratio 1.0 1.0 0.9 0.8 Current Capitalization in JPY Quick Ratio 0.5 0.7 0.6 0.5 Common Shares Outstanding (M) 1003.6 EBIT/Interest -9.3 1.4 8.4 -2.9 Market Capitalization (M) 1371192.5 Tot Debt/Capital 0.3 0.3 0.3 0.3 Cash and ST Investments (M) 1356279.0 Tot Debt/Equity 0.3 0.4 0.3 0.5 Total Debt (M) 1387086.0 Eff Tax Rate % - 51.9 207.5 - Preferred Equity (M) 0.0 LT Investments in Affiliate Companies (M) 0.0 Investments (M) 469241.0 Enterprise Value (M) 1871240.5 Q.M.S Advisors | tel: +41 (0)78 922 08 77 | e-mail: info@qmsadv.com |
- 2. Company Analysis - Analysts Ratings Sony Corp Target price in JPY Broker Recommendation Buy and Sell Recommendations vs Price and Target Price Price Brokers' Target Price 3'000 1600 100% 15% 18% 16% 1400 20% 19% 21% 21% 21% 21% 24% 25% 25% 2'500 1200 80% 1000 2'000 800 60% 600 70% 68% 1'500 400 57% 71% 60% 70% 71% 68% 68% 68% 65% 74% 200 40% 1'000 0 Morgan Stanley Mizuho Securities Daiwa Securities Co. Ltd. Barclays Mito Securities SMBC Nikko Securities Inc ACE Research Institute Macquarie Credit Suisse JPMorgan Tokai Tokyo Securities Nomura Okasan Securities EVA Dimensions Goldman Sachs Deutsche Bank TIW 20% 500 15% 19% 15% 16% 10% 10% 10% 11% 11% 11% 12% 5% 0% 0 févr.12 mars.12 avr.12 mai.12 juin.12 juil.12 août.12 sept.12 oct.12 nov.12 déc.12 janv.13 Buy Hold Sell Price Target Price Date Buy Hold Sell Date Price Target Price Broker Analyst Recommendation Target Date 31-Jan-13 16% 68% 16% 20-Feb-13 1355.00 1268.18 Morgan Stanley MASAHIRO ONO Equalwt/In-Line 1050.00 20-Feb-13 31-Dec-12 5% 74% 21% 19-Feb-13 1351.00 1268.18 TIW TAKAO HATTORI neutral 18-Feb-13 30-Nov-12 12% 71% 18% 18-Feb-13 1329.00 1259.09 Okasan Securities TAKANOBU MURAKAMI sell 1000.00 14-Feb-13 31-Oct-12 11% 68% 21% 15-Feb-13 1313.00 1254.17 Goldman Sachs TAKASHI WATANABE neutral/neutral 1100.00 13-Feb-13 28-Sep-12 11% 68% 21% 14-Feb-13 1338.00 1254.17 Tokai Tokyo Securities KOUICHIROU HAGIWARA above average 8-Feb-13 31-Aug-12 11% 68% 21% 13-Feb-13 1304.00 1254.17 Daiwa Securities Co. Ltd. JUNYA AYADA neutral 1420.00 8-Feb-13 31-Jul-12 10% 71% 19% 12-Feb-13 1381.00 1235.39 SMBC Nikko Securities Inc KAZUHARU MIURA underperform 1100.00 8-Feb-13 29-Jun-12 10% 70% 20% 11-Feb-13 1365.00 1235.39 Credit Suisse SHUNSUKE TSUCHIYA neutral 900.00 7-Feb-13 31-May-12 10% 65% 25% 8-Feb-13 1365.00 1235.39 Nomura SHIRO MIKOSHIBA neutral 1460.00 7-Feb-13 30-Apr-12 15% 60% 25% 7-Feb-13 1519.00 1220.00 EVA Dimensions CRAIG STERLING underweight 17-Jan-13 30-Mar-12 19% 57% 24% 6-Feb-13 1481.00 1148.00 Barclays YUJI FUJIMORI equalweight 950.00 21-Dec-12 29-Feb-12 15% 70% 15% 5-Feb-13 1447.00 1148.00 JPMorgan YOSHIHARU IZUMI neutral 840.00 20-Dec-12 4-Feb-13 1457.00 1148.00 ACE Research Institute HIDEKI YASUDA neutral 860.00 20-Dec-12 1-Feb-13 1355.00 1097.14 Deutsche Bank YASUO NAKANE hold 1200.00 15-Nov-12 31-Jan-13 1362.00 1097.14 Macquarie DAMIAN THONG neutral 1080.00 12-Nov-12 30-Jan-13 1383.00 1097.14 Mizuho Securities YOSHIHIRO UJIHARA neutral 1000.00 2-Nov-12 29-Jan-13 1385.00 1097.14 Mito Securities KEITA WAKABAYASHI Neutral Plus 18-Aug-10 28-Jan-13 1407.00 1097.14 25-Jan-13 1290.00 1097.14 24-Jan-13 1189.00 994.29 23-Jan-13 1167.00 994.29 22-Jan-13 1192.00 994.29 21-Jan-13 1187.00 994.29 18-Jan-13 1149.00 994.29 17-Jan-13 1024.00 994.29 16-Jan-13 969.00 994.29 15-Jan-13 995.00 976.43 14-Jan-13 983.00 976.43 11-Jan-13 983.00 976.43 10-Jan-13 968.00 976.43 Q.M.S Advisors | tel: +41 (0)78 922 08 77 | e-mail: info@qmsadv.com |
- 3. 20.02.2013 Sony Corp Company Analysis - Ownership Ownership Type Ownership Statistics Geographic Ownership Distribution Geographic Ownership 0% Shares Outstanding (M) 1003.6 Japan 60.66% Float 98.5% United States 27.66% 1% 1% 1%2% 2% Short Interest (M) Britain 5.02% 5% Short Interest as % of Float 42% Uae 2.33% Days to Cover Shorts Luxembourg 1.07% Institutional Ownership 41.93% Ireland 0.87% Retail Ownership 58.06% 58% Switzerland 0.58% 60% 28% Insider Ownership 0.01% Others 1.82% Institutional Ownership Distribution Bank 46.86% Investment Advisor 37.43% Mutual Fund Manager 10.95% Institutional Ownership Retail Ownership Insider Ownership Unclassified 2.33% Japan United States Britain Uae Pricing data is in JPY Others 2.43% Luxembourg Ireland Switzerland Others Top 20 Owners: TOP 20 ALL Institutional Ownership Holder Name Position Position Change Market Value % of Ownership Report Date Source Country JAPAN TRUSTEE SERVIC 109'016'000 -1'433'000 147'716'680'000 10.77% 30.09.2012 Co File JAPAN 2% 2% MOXLEY & CO 69'745'000 2'804'000 94'504'475'000 6.89% 30.09.2012 Co File UNITED STATES MASTER TRUST BANK OF 49'363'000 -1'840'000 66'886'865'000 4.88% 30.09.2012 Co File JAPAN 11% SUMITOMO MITSUI TRUS 45'399'400 -30'519'600 61'516'187'000 4.49% 15.11.2012 ULT-AGG JAPAN GLG PARTNERS INVESTM 18'688'007 -382'300 25'322'249'485 1.85% 31.12.2012 MF-AGG BRITAIN 48% VANGUARD GROUP INC 17'311'250 282'954 23'456'743'750 1.71% 31.12.2012 MF-AGG UNITED STATES NOMURA 12'868'600 -92'200 17'436'953'000 1.27% 31.01.2013 ULT-AGG NIKKO ASSET MANAGEME 11'748'800 2'112'400 15'919'624'000 1.16% 15.11.2012 ULT-AGG TAM TWO 9'982'000 0 13'525'610'000 0.99% 30.09.2012 Co File UAE 37% BLACKROCK 9'016'430 86'100 12'217'262'650 0.89% 15.02.2013 ULT-AGG UNITED STATES MELLON BANK NA 8'777'000 -767'000 11'892'835'000 0.87% 31.03.2012 Co File UNITED STATES D E SHAW & CO ASIA P -6'425'144 140'000 -8'706'070'120 -0.63% 13.02.2013 Short HONG KONG HIGHBRIDGE INTERNATI -6'404'100 -75'000 -8'677'555'500 -0.63% 18.02.2013 Short CAYMAN ISLANDS DODGE & COX 5'789'828 -187'800 7'845'216'940 0.57% 29.01.2013 MF-AGG UNITED STATES Bank Investment Advisor Mutual Fund Manager Unclassified Others MITSUBISHI UFJ FINAN 5'459'000 -18'000 7'396'945'000 0.54% 31.01.2013 ULT-AGG JAPAN BTG PACTUAL EUROPE L -5'323'198 -1'065'000 -7'212'933'290 -0.53% 13.02.2013 Short BRITAIN DAIWA SECURITIES GRO 4'966'100 -502'100 6'729'065'500 0.49% 31.01.2013 MF-AGG JAPAN MYRIAD OPP MASTER FU -4'526'080 250'760 -6'132'838'400 -0.45% 14.02.2013 Short CAYMAN ISLANDS PINE RIVER FIXED INC -4'279'900 -36'200 -5'799'264'500 -0.42% 18.02.2013 Short CAYMAN ISLANDS D E SHAW & CO HK LTD -3'164'307 -3'164'307 -4'287'635'985 -0.31% 05.12.2012 Short HONG KONG Top 5 Insiders: Holder Name Position Position Change Market Value % of Ownership Report Date Source CHUBACHI RYOJI 33'000 1'000 44'715'000 0.00% 27.06.2012 Co File STRINGER HOWARD 32'000 43'360'000 0.00% 27.06.2012 Co File KATO MASARU 7'000 9'485'000 0.00% 27.06.2012 Co File KIMURA KEIJI 5'000 1'000 6'775'000 0.00% 27.06.2012 Co File KOJIMA YORIHIKO 5'000 1'000 6'775'000 0.00% 27.06.2012 Co File Q.M.S Advisors | tel: +41 (0)78 922 08 77 | e-mail: info@qmsadv.com |
- 4. Company Analysis - Financials I/IV Sony Corp Financial information is in JPY (M) Equivalent Estimates Periodicity: Fiscal Year 3/02 3/03 3/04 3/05 3/06 3/07 3/08 3/09 3/10 3/11 3/12 3/13E 3/14E 3/15E Income Statement Revenue 7'578'258 7'473'633 7'496'391 7'159'616 7'510'597 8'295'695 8'871'414 7'729'993 7'213'998 7'181'273 6'493'212 6'625'109 6'834'723 6'865'552 - Cost of Goods Sold 5'239'592 4'979'421 5'058'205 5'000'112 5'757'145 6'429'698 6'820'328 6'208'329 5'564'113 5'507'151 5'122'500 Gross Income 2'338'666 2'494'212 2'438'186 2'159'504 1'753'452 1'865'997 2'051'086 1'521'664 1'649'885 1'674'122 1'370'712 1'835'155 1'913'722 1'946'384 - Selling, General & Admin Expenses 2'204'035 2'308'772 2'339'284 2'045'585 1'527'036 1'794'247 1'676'604 1'749'447 1'618'113 1'474'301 1'437'987 (Research & Dev Costs) 433'214 443'128 514'483 502'008 531'795 543'937 520'600 497'297 432'001 426'814 433'477 Operating Income 134'631 185'440 98'902 113'919 226'416 71'750 374'482 -227'783 31'772 199'821 -67'275 122'430 181'975 211'619 - Interest Expense 36'436 27'314 27'849 24'578 28'996 27'278 22'931 24'376 22'505 23'909 23'432 - Foreign Exchange Losses (Gains) 31'736 -1'928 -18'059 524 3'065 18'835 -5'571 -48'568 10'876 -9'297 5'089 - Net Non-Operating Losses (Gains) 8'156 -42'877 -56'669 -97'429 -105'150 -155'054 -210'012 -28'636 -28'521 -19'804 -12'610 Pretax Income 58'303 202'931 145'781 186'246 299'505 180'691 567'134 -174'955 26'912 205'013 -83'186 135'360 184'327 218'236 - Income Tax Expense 65'211 80'831 52'774 16'044 176'515 53'888 203'478 -72'741 13'958 425'339 315'239 Income Before XO Items -6'908 122'100 93'007 170'202 122'990 126'803 363'656 -102'214 12'954 -220'326 -398'425 - Extraordinary Loss Net of Tax -5'978 0 2'117 4'713 0 0 0 0 0 0 0 - Minority Interests -16'240 6'581 2'379 1'651 -626 475 -5'779 -3'276 53'756 39'259 58'235 Diluted EPS Before XO Items 120.29 (98.59) (40.66) (258.66) (455.03) Net Income Adjusted* 15'310 115'519 88'511 163'838 123'616 126'328 369'435 -98'938 -40'802 -259'585 -456'660 11'954 55'406 60'707 EPS Adjusted 16.72 125.74 98.26 180.96 122.58 126.15 368.33 (98.59) (40.66) (258.66) (455.03) 11.43 51.84 58.75 Dividends Per Share 25.00 25.00 25.00 25.00 25.00 25.00 25.00 42.50 25.00 25.00 25.00 24.44 25.00 23.39 Payout Ratio % 246.4 19.9 25.5 14.3 20.4 19.8 6.8 2.14 0.48 0.40 Total Shares Outstanding 919 921 924 996 1'001 1'002 1'003 1'004 1'004 1'004 1'004 Diluted Shares Outstanding 921 999 1'000 1'044 1'046 1'050 1'052 1'003 1'004 1'004 1'004 EBITDA 488'766 537'365 465'171 486'784 608'259 471'759 802'492 177'660 402'776 525'187 252'319 464'064 511'283 507'465 *Net income excludes extraordinary gains and losses and one-time charges. Q.M.S Advisors | tel: +41 (0)78 922 08 77 | e-mail: info@qmsadv.com |
- 5. Company Analysis - Financials II/IV Periodicity: 3/02 3/03 3/04 3/05 3/06 3/07 3/08 3/09 3/10 3/11 3/12 3/13E 3/14E 3/15E Balance Sheet Total Current Assets 3337212 3154214 3363355 3556171 3769524 4546723 5009663 3620635 4132872 3844046 3754962 + Cash & Near Cash Items 683'800 713'058 849'211 779'103 703'098 799'899 1'086'431 660'789 1'191'608 1'014'412 894'576 + Short Term Investments 167'323 210'509 279'410 461'694 536'968 493'315 427'709 466'912 579'493 646'171 680'913 + Accounts & Notes Receivable 1'242'826 1'007'395 1'011'189 1'025'362 985'508 1'369'777 1'090'285 853'454 891'625 743'690 769'915 + Inventories 673'437 625'727 666'507 631'349 804'724 940'875 1'021'595 813'068 645'455 704'043 707'052 + Other Current Assets 569'826 597'525 557'038 658'663 739'226 942'857 1'383'643 826'412 824'691 735'730 702'506 Total Long-Term Assets 4'848'583 5'216'331 5'727'307 5'942'929 6'838'229 7'169'639 7'543'076 8'392'876 8'733'242 9'080'942 9'540'705 + Long Term Investments 1'566'739 1'882'613 2'426'697 2'492'784 3'234'037 3'440'567 3'954'460 4'561'651 5'070'342 5'670'662 6'282'676 Gross Fixed Assets 3'369'890 3'175'195 3'272'333 3'393'345 3'549'452 3'690'336 3'600'161 3'510'800 3'356'395 3'084'758 2'949'925 Accumulated Depreciation 1'958'234 1'896'845 1'907'289 2'020'946 2'160'905 2'268'805 2'356'812 2'334'937 2'348'444 2'159'890 2'018'927 + Net Fixed Assets 1'411'656 1'278'350 1'365'044 1'372'399 1'388'547 1'421'531 1'243'349 1'175'863 1'007'951 924'868 930'998 + Other Long Term Assets 1'870'188 2'055'368 1'935'566 2'077'746 2'215'645 2'307'541 2'345'267 2'655'362 2'654'949 2'485'412 2'327'031 Total Current Liabilities 2'558'496 2'435'048 2'982'215 2'809'368 3'200'228 3'551'852 4'023'367 3'810'900 4'059'925 4'126'979 4'529'981 + Accounts Payable 767'625 697'385 778'773 806'044 813'332 1'179'694 920'920 560'795 817'118 793'275 758'680 + Short Term Borrowings 354'063 158'745 475'017 230'266 336'321 108'020 364'431 451'155 284'607 156'828 410'361 + Other Short Term Liabilities 1'436'808 1'578'918 1'728'425 1'773'058 2'050'575 2'264'138 2'738'016 2'798'950 2'958'200 3'176'876 3'360'940 Total Long Term Liabilities 3'233'521 3'632'580 3'707'587 3'795'547 4'166'572 4'754'836 4'787'434 4'986'009 5'520'634 5'842'107 6'255'565 + Long Term Borrowings 838'617 807'439 777'649 678'992 764'898 1'037'849 771'620 660'147 924'207 870'297 762'226 + Other Long Term Borrowings 2'394'904 2'825'141 2'929'938 3'116'555 3'401'674 3'716'987 4'015'814 4'325'862 4'596'427 4'971'810 5'493'339 Total Liabilities 5'792'017 6'067'628 6'689'802 6'604'915 7'366'800 8'306'688 8'810'801 8'796'909 9'580'559 9'969'086 10'785'546 + Long Preferred Equity 0 0 0 0 0 0 0 0 0 0 + Minority Interest 23'368 22'022 22'858 23'847 37'101 38'970 276'849 251'949 319'650 407'915 481'230 + Share Capital & APIC 1'444'329 1'460'474 1'473'084 1'755'931 1'760'762 1'770'330 1'782'023 1'785'799 1'788'634 1'790'587 1'791'159 + Retained Earnings & Other Equity 926'081 820'421 904'918 1'114'407 1'443'090 1'600'374 1'683'066 1'178'854 1'177'271 757'400 237'732 Total Shareholders Equity 2'393'778 2'302'917 2'400'860 2'894'185 3'240'953 3'409'674 3'741'938 3'216'602 3'285'555 2'955'902 2'510'121 Total Liabilities & Equity 8'185'795 8'370'545 9'090'662 9'499'100 10'607'753 11'716'362 12'552'739 12'013'511 12'866'114 12'924'988 13'295'667 Book Value Per Share 2'580.73 2'477.05 2'573.73 2'881.60 3'200.85 3'363.77 3'453.25 2'954.25 2'955.47 2'538.88 2'021.66 1'961.42 2'001.47 2'065.25 Tangible Book Value Per Share 1'967.91 1'881.10 2'004.57 2'408.80 2'695.26 2'826.95 3'149.87 2'511.85 2'518.14 1'681.83 945.05 Q.M.S Advisors | tel: +41 (0)78 922 08 77 | e-mail: info@qmsadv.com |
- 6. Company Analysis - Financials III/IV Periodicity: 3/02 3/03 3/04 3/05 3/06 3/07 3/08 3/09 3/10 3/11 3/12 3/13E 3/14E 3/15E Cash Flows Net Income 15'310 115'519 88'511 163'838 123'616 126'328 369'435 -98'938 -40'802 -259'585 -456'660 11'954 55'406 60'707 + Depreciation & Amortization 354'135 351'925 366'269 372'865 381'843 400'009 428'010 405'443 371'004 325'366 319'594 + Other Non-Cash Adjustments 247'729 164'073 261'857 49'900 -75'297 126'012 -15'626 57'521 260'859 686'770 819'665 + Changes in Non-Cash Capital 120'422 222'271 -84'002 60'394 -30'304 -91'321 -24'135 43'127 321'846 -136'306 -163'060 Cash From Operating Activities 737'596 853'788 632'635 646'997 399'858 561'028 757'684 407'153 912'907 616'245 519'539 + Disposal of Fixed Assets 37'434 25'711 33'987 34'184 38'168 87'319 144'741 153'439 15'671 18'743 22'661 + Capital Expenditures -388'514 -275'285 -427'344 -453'445 -462'473 -527'515 -474'552 -496'125 -338'050 -253'688 -382'549 -201'429 -204'286 -212'143 + Increase in Investments -796'340 -1'136'348 -1'202'730 -1'467'243 -1'405'105 -1'014'906 -103'082 -2'675'118 -1'581'841 -1'458'912 -1'028'150 + Decrease in Investments 380'303 679'497 826'709 949'442 881'903 0 + Other Investing Activities 0 0 7'586 5'890 76'243 739'672 -477'549 1'936'462 1'158'216 979'418 505'152 Cash From Investing Activities -767'117 -706'425 -761'792 -931'172 -871'264 -715'430 -910'442 -1'081'342 -746'004 -714'439 -882'886 + Dividends Paid -22'951 -22'871 -23'106 -22'978 -24'810 -25'052 -25'098 -42'594 -25'085 -25'098 -25'078 + Change in Short Term Borrowings -78'104 -7'970 -57'708 11'397 -11'045 6'096 15'838 244'584 -250'252 6'120 -26'158 + Increase in Long Term Borrowings 228'999 12'323 267'864 57'232 246'326 270'780 31'093 72'188 510'128 1'499 216'887 + Decrease in Long Term Borrowings -171'739 -238'144 -32'042 -94'862 -138'773 -182'374 -34'701 -264'467 -144'105 -216'212 -112'043 + Increase in Capital Stocks 9'529 0 0 0 0 0 7'484 378 114 0 0 + Decrease in Capital Stocks 0 0 0 0 0 0 0 0 0 0 0 + Other Financing Activities 140'342 138'557 110'302 263'278 323'703 176'187 444'674 238'458 273'116 154'689 189'903 Cash From Financing Activities 106'076 -118'105 265'310 214'067 395'401 245'637 439'290 248'547 363'916 -79'002 243'511 Net Changes in Cash 76'555 29'258 136'153 -70'108 -76'005 91'235 286'532 -425'642 530'819 -177'196 -119'836 Free Cash Flow (CFO-CAPEX) 349'082 578'503 205'291 193'552 -62'615 33'513 283'132 -88'972 574'857 362'557 136'990 134'041 182'766 182'424 Free Cash Flow To Firm 344'765 594'937 223'058 216'013 -50'708 52'656 297'836 585'690 336'862 Free Cash Flow To Equity 417'392 201'503 72'061 215'334 440'103 116'772 706'299 172'707 238'337 Free Cash Flow per Share 380.07 629.01 222.26 207.87 -62.75 33.47 282.28 -88.66 572.84 361.27 136.50 Q.M.S Advisors | tel: +41 (0)78 922 08 77 | e-mail: info@qmsadv.com |
- 7. Company Analysis - Financials IV/IV Periodicity: 3/02 3/03 3/04 3/05 3/06 3/07 3/08 3/09 3/10 3/11 3/12 3/13E 3/14E 3/15E Ratio Analysis Valuation Ratios Price Earnings 400.7x 33.4x 44.4x 23.6x 44.5x 47.5x 10.8x 118.6x 26.1x 23.1x EV to EBIT 48.4x 21.2x 42.2x 34.6x 23.6x 82.1x 10.4x 105.4x 12.3x EV to EBITDA 13.3x 7.3x 9.0x 8.1x 8.8x 12.5x 4.8x 12.6x 8.3x 4.7x 7.1x 4.0x 3.7x 3.7x Price to Sales 0.8x 0.5x 0.5x 0.6x 0.7x 0.7x 0.4x 0.3x 0.5x 0.4x 0.3x 0.2x 0.2x 0.2x Price to Book 2.6x 1.7x 1.7x 1.5x 1.7x 1.8x 1.1x 0.7x 1.2x 1.0x 0.8x 0.7x 0.7x 0.7x Dividend Yield 0.4% 0.6% 0.6% 0.6% 0.5% 0.4% 0.6% 2.1% 0.7% 0.9% 1.5% 1.8% 1.8% 1.7% Profitability Ratios Gross Margin 30.9% 33.4% 32.5% 30.2% 23.3% 22.5% 23.1% 19.7% 22.9% 23.3% 21.1% 27.7% 28.0% 28.4% EBITDA Margin 6.4% 7.2% 6.2% 6.8% 8.1% 5.7% 9.0% 2.3% 5.6% 7.3% 3.9% 7.0% 7.5% 7.4% Operating Margin 1.8% 2.5% 1.3% 1.6% 3.0% 0.9% 4.2% -2.9% 0.4% 2.8% -1.0% 1.8% 2.7% 3.1% Profit Margin 0.2% 1.5% 1.2% 2.3% 1.6% 1.5% 4.2% -1.3% -0.6% -3.6% -7.0% 0.2% 0.8% 0.9% Return on Assets 0.2% 1.4% 1.0% 1.8% 1.2% 1.1% 3.0% -0.8% -0.3% -2.0% -3.5% 0.2% 0.7% 0.8% Return on Equity 0.7% 5.0% 3.8% 6.2% 4.0% 3.8% 10.8% -3.1% -1.4% -9.4% -20.0% 0.6% 2.7% 3.8% Leverage & Coverage Ratios Current Ratio 1.30 1.30 1.13 1.27 1.18 1.28 1.25 0.95 1.02 0.93 0.83 Quick Ratio 0.82 0.79 0.72 0.81 0.70 0.75 0.65 0.52 0.66 0.58 0.52 Interest Coverage Ratio (EBIT/I) 3.69 6.79 3.55 4.63 7.81 2.63 16.33 -9.34 1.41 8.36 -2.87 Tot Debt/Capital 0.33 0.30 0.34 0.24 0.25 0.25 0.23 0.26 0.27 0.26 0.32 Tot Debt/Equity 0.50 0.42 0.52 0.31 0.34 0.34 0.30 0.35 0.37 0.35 0.47 Others Asset Turnover 0.95 0.90 0.86 0.77 0.75 0.74 0.73 0.63 0.58 0.56 0.50 Accounts Receivable Turnover 5.97 6.64 7.43 7.03 7.47 7.04 7.21 7.95 8.27 8.78 8.58 Accounts Payable Turnover 5.87 6.73 6.91 6.27 7.32 6.59 6.57 8.10 7.83 6.91 6.61 Inventory Turnover 6.48 7.67 7.83 7.71 8.02 7.37 6.95 6.77 7.63 8.16 7.26 Effective Tax Rate 111.8% 39.8% 36.2% 8.6% 58.9% 29.8% 35.9% 51.9% 207.5% Q.M.S Advisors | tel: +41 (0)78 922 08 77 | e-mail: info@qmsadv.com |
- 8. Company Analysis - Peers Comparision TECHNICOLOR- SONY CORP PANASONIC CORP SHARP CORP PIONEER CORP NINTENDO CO LTD WALT DISNEY CO LG ELECTRONICS EASTMAN KODAK FUNAI ELECTRIC CASIO COMPUTER ALPINE ELEC INC REGR Latest Fiscal Year: 03/2012 03/2012 03/2012 03/2012 03/2012 09/2012 12/2012 12/2011 12/2011 03/2012 03/2012 03/2012 52-Week High 1'832.00 783.00 619.00 434.00 13'120.00 55.95 94'300.00 0.61 2.77 1'984.58 833.00 1'160.00 52-Week High Date 16.03.2012 28.03.2012 29.03.2012 29.03.2012 22.03.2012 19.02.2013 15.03.2012 06.08.2012 20.02.2013 27.02.2012 18.01.2013 29.03.2012 52-Week Low 772.00 376.00 142.00 153.00 8'060.00 40.88 55'800.00 0.14 1.29 883.00 436.00 597.00 52-Week Low Date 15.11.2012 06.11.2012 12.10.2012 11.10.2012 25.07.2012 10.04.2012 25.07.2012 05.06.2012 24.04.2012 05.11.2012 04.06.2012 14.11.2012 Daily Volume 28'336'400 38'447'000 22'984'000 8'238'600 690'500 641'806 1'190'845 24'408 2'071'082 227'900 1'554'300 349'800 Current Price (2/dd/yy) 1'355.00 685.00 331.00 201.00 8'740.00 55.59 76'300.00 0.21 2.71 1'213.00 715.00 864.00 52-Week High % Change -26.0% -12.5% -46.5% -53.7% -33.4% -0.7% -19.1% -65.8% -2.2% -38.9% -14.2% -25.5% 52-Week Low % Change 75.5% 82.2% 133.1% 31.4% 8.4% 36.0% 36.7% 51.8% 109.9% 37.4% 64.0% 44.7% Total Common Shares (M) 1'003.6 2'311.7 1'100.3 321.1 127.9 1'780.0 162.9 271.4 227.3 34.1 268.9 69.8 Market Capitalization 1'371'192.5 1'680'341.6 377'611.4 65'544.9 1'238'187.0 100'355.9 12'486'328.0 56.6 909.3 43'826.7 199'500.0 60'293.8 Total Debt 1'172'587.0 1'575'615.0 1'127'157.0 91'368.0 126.0 14'311.0 5'825'846.0 1'515.0 1'327.0 5'087.0 114'042.0 5'620.0 Preferred Stock - - - - - - 85'930.0 - - - - - Minority Interest 481'230.0 47'780.0 19'226.0 4'924.0 81.0 2'199.0 - 2.0 4.0 974.0 249.0 743.0 Cash and Equivalents 1'575'489.0 611'469.0 195'113.0 45'953.0 958'322.0 3'387.0 1'464'211.0 861.0 405.0 72'646.0 122'419.0 44'209.0 Enterprise Value 1'871'240.5 2'700'320.6 1'373'974.4 137'271.9 280'072.1 116'950.9 16'379'373.2 366.6 1'903.3 - 204'001.0 33'059.8 Valuation Total Revenue LFY 6'493'212.0 7'846'216.0 2'455'850.0 436'753.0 647'652.0 42'278.0 25'427'205.2 6'022.0 3'450.0 246'147.0 301'660.0 202'905.0 LTM 6'543'144.0 7'479'178.0 2'245'431.0 447'601.0 632'908.0 42'840.0 25'420'805.0 4'813.0 3'537.0 194'556.0 295'974.0 211'797.0 CY+1 6'625'109.2 7'268'174.7 2'388'732.1 453'168.1 682'149.6 45'144.3 - - 3'577.3 197'451.1 313'871.0 217'814.3 CY+2 6'834'722.9 7'432'332.3 2'500'454.9 475'949.2 942'471.0 47'952.9 - - 3'452.5 225'296.4 325'954.4 229'014.3 EV/Total Revenue LFY 0.2x 0.3x 0.5x 0.3x - 2.5x 0.6x 0.1x 0.4x - 0.6x 0.1x LTM 0.2x 0.3x 0.5x 0.3x - 2.5x 0.6x 0.1x 0.4x - 0.6x 0.1x CY+1 0.3x 0.4x 0.6x 0.3x 0.6x 2.5x - - 0.5x -0.1x 0.7x 0.1x CY+2 0.3x 0.4x 0.6x 0.2x 0.4x 2.4x - - 0.5x 0.0x 0.6x 0.1x EBITDA LFY 252'319.0 381'837.0 210'873.0 37'082.0 (24'797.0) 10'850.0 458'280.0 (185.0) 438.0 7'008.0 18'342.0 12'389.0 LTM 264'935.0 419'093.0 (22'949.0) 33'238.0 4'234.0 10'959.0 909'662.0 (135.0) 585.0 3'131.0 22'154.0 9'919.0 CY+1 464'063.6 458'110.3 35'686.0 37'161.1 11'813.2 12'295.6 - - 504.8 1'432.0 28'829.0 8'950.0 CY+2 511'282.7 529'634.2 210'445.8 45'581.3 81'689.4 13'434.6 - - 535.5 5'154.0 33'573.9 12'175.0 EV/EBITDA LFY 5.7x 6.1x 5.6x 3.4x - 9.7x 33.0x -1.9x 3.2x - 9.1x 2.2x LTM 5.4x 5.5x - 3.8x - 9.6x 16.6x - 2.4x - 7.6x 2.8x CY+1 3.9x 6.2x 41.5x 3.2x 36.9x 9.2x - - 3.4x - 7.3x 2.5x CY+2 3.4x 5.2x 6.7x 2.5x 4.8x 8.4x - - 3.0x - 6.1x 1.5x EPS LFY -453.16 -163.35 - 34.00 -337.80 3.08 -1'551.25 -2.72 -1.08 - 71.67 - LTM -452.67 -571.48 -657.84 -16.62 -7.25 3.06 1'206.00 -2.60 -1.10 -135.52 22.34 44.59 CY+1 11.43 (330.98) (375.27) (15.67) 107.60 3.44 - - 0.16 (156.59) 39.69 20.06 CY+2 51.84 37.36 (1.77) 25.51 372.75 3.89 - - 0.37 34.79 51.44 57.73 P/E LFY - - - - - 18.2x 63.3x - - - 32.0x 19.4x LTM - - - - - 18.2x - - - - - - CY+1 118.6x - - - 81.2x 16.1x - - 16.6x - 18.0x 43.1x CY+2 26.1x 18.3x - 7.9x 23.4x 14.3x - - 7.3x 34.9x 13.9x 15.0x Revenue Growth 1 Year (9.6%) (9.7%) (18.7%) (4.5%) (36.2%) 3.4% (9.5%) (16.0%) (3.5%) (16.8%) (11.7%) 0.8% 5 Year (4.7%) (2.7%) (6.8%) (8.3%) (19.0%) 1.8% 1.1% (16.0%) (7.6%) (9.0%) (12.8%) (1.8%) EBITDA Growth 1 Year (52.0%) (43.2%) (39.9%) (18.8%) - 12.8% - - (10.6%) (1.8%) (26.5%) (33.4%) 5 Year (11.8%) (13.3%) (11.8%) (7.1%) - 5.5% (18.1%) - (12.6%) (24.7%) (25.5%) (8.6%) EBITDA Margin LTM 4.0% 5.6% (1.0%) 7.4% 0.7% 25.6% 3.5% (2.8%) 16.5% 1.6% 7.5% 4.7% CY+1 7.0% 6.3% 1.5% 8.2% 1.7% 27.2% - - 14.1% 0.7% 9.2% 4.1% CY+2 7.5% 7.1% 8.4% 9.6% 8.7% 28.0% - - 15.5% 2.3% 10.3% 5.3% Leverage/Coverage Ratios Total Debt / Equity % 57.8% 81.6% 180.1% 108.6% 0.0% 36.0% 56.0% - 878.8% 4.1% 76.5% 5.6% FALSE FALSE Total Debt / Capital % 31.8% 44.3% 63.6% 50.6% 0.0% 25.4% 35.7% - 89.5% 3.9% 43.3% 5.2% FALSE FALSE Total Debt / EBITDA 4.818x 3.726x - 2.750x - 1.592x 6.008x - 2.265x 1.597x 5.018x 0.480x FALSE FALSE Net Debt / EBITDA 0.201x 2.600x - 1.798x - 1.299x 4.185x - 1.691x - 0.854x - FALSE FALSE EBITDA / Int. Expense 10.768x 13.443x 24.390x 12.849x - 19.238x 2.102x -1.178x 2.844x 55.619x 18.305x 109.637x FALSE FALSE Credit Ratings S&P LT Credit Rating BBB BBB B+ *- NR NR A BBB- NR B - BBB - FALSE FALSE S&P LT Credit Rating Date 25.09.2012 02.11.2012 05.11.2012 24.08.2012 09.01.2007 22.12.2009 14.10.2011 06.03.2012 23.08.2012 - 10.06.2010 - FALSE FALSE Moody's LT Credit Rating Baa3 Baa3 WR WR - A2 Baa2 WR - - - - FALSE FALSE Moody's LT Credit Rating Date 09.11.2012 20.11.2012 20.04.2012 29.07.2008 - 23.05.2007 21.01.2010 24.01.2012 - - - - FALSE FALSE Q.M.S Advisors | tel: +41 (0)78 922 08 77 | e-mail: info@qmsadv.com |