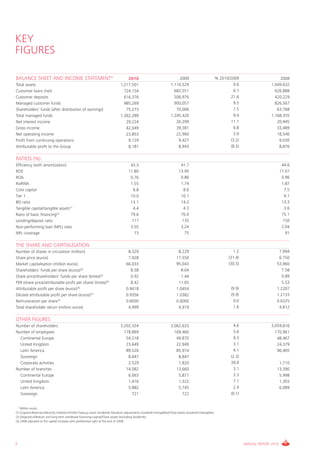
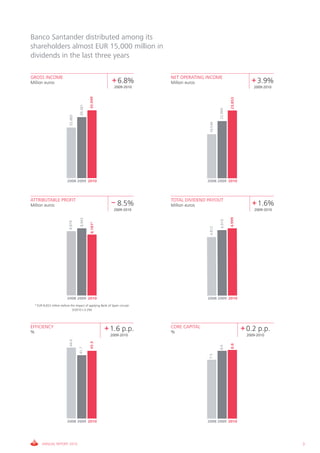
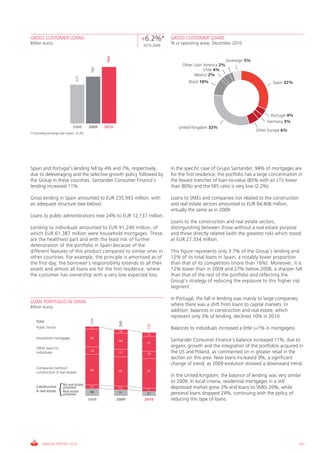
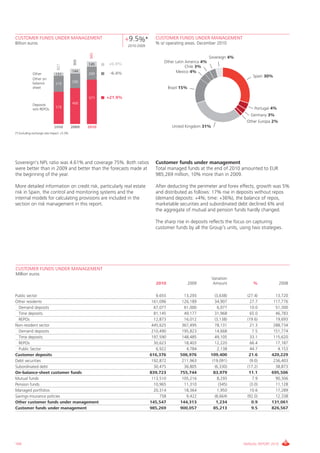
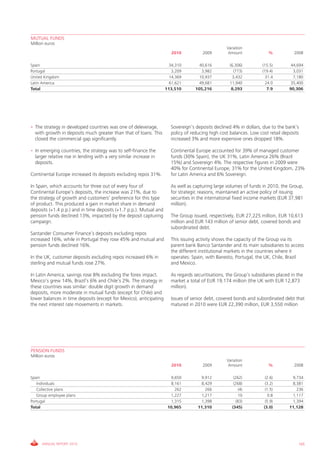
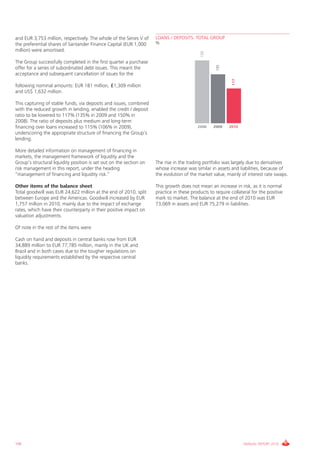
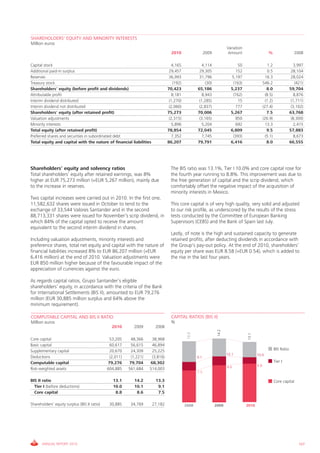
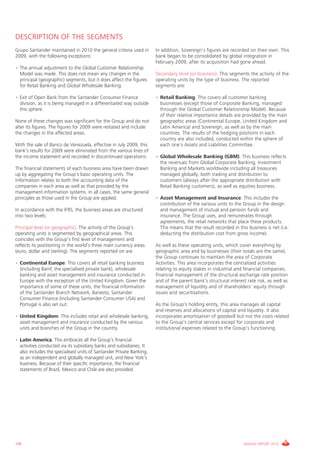
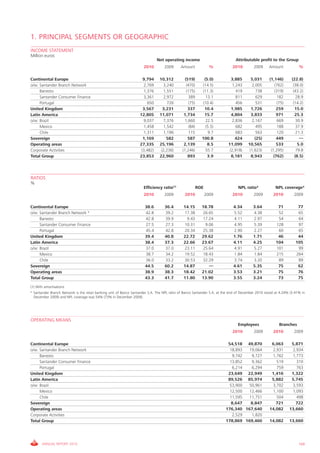
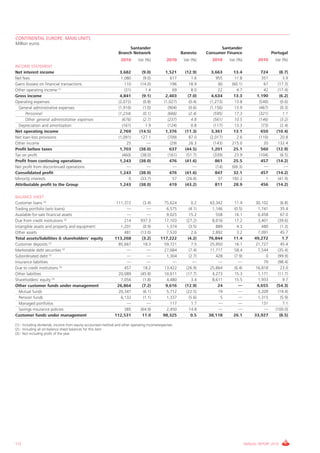
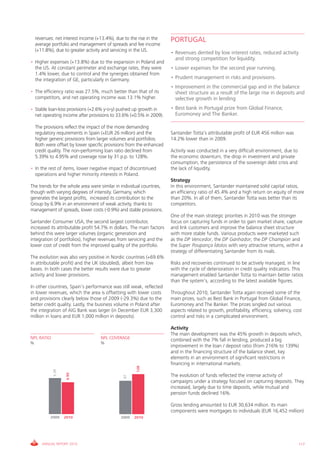
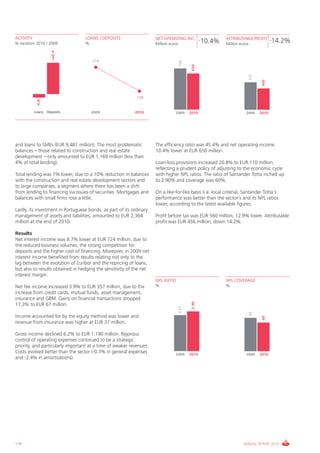
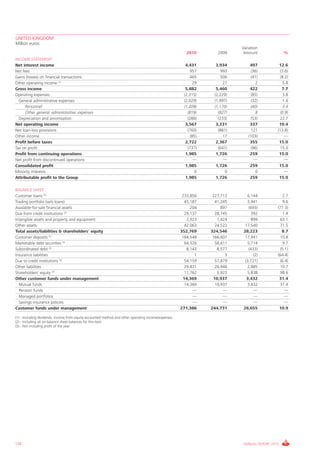
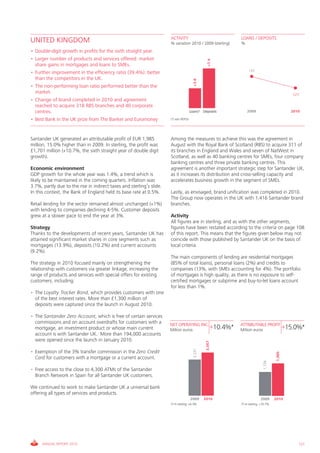
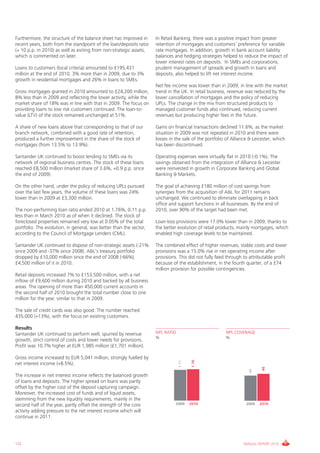
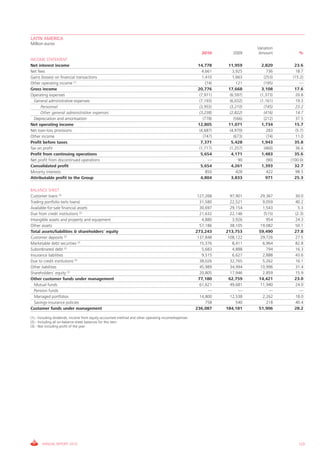
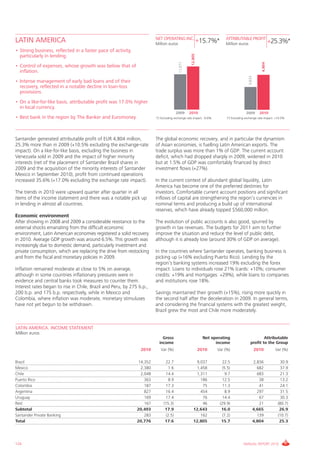
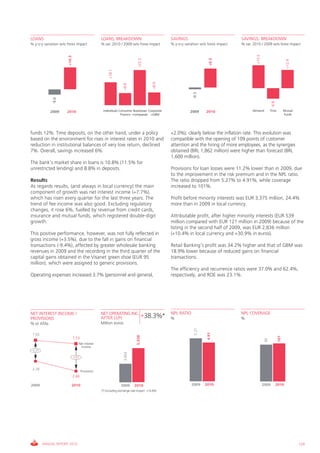
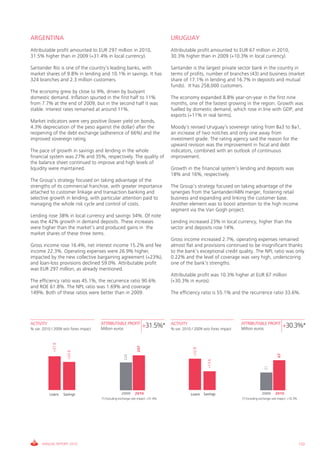
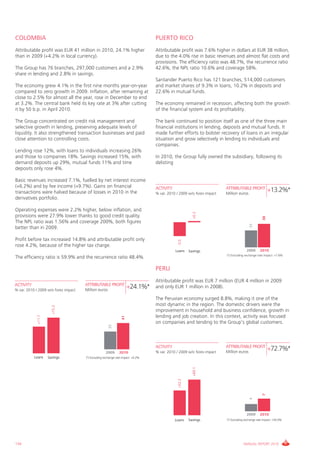
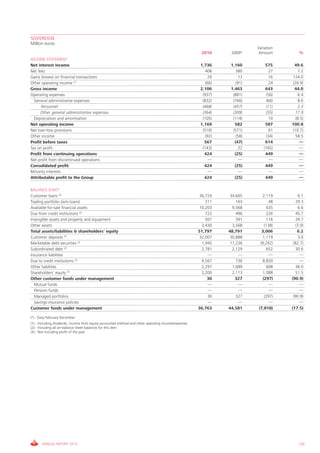
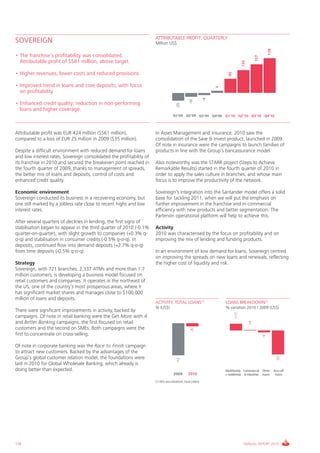
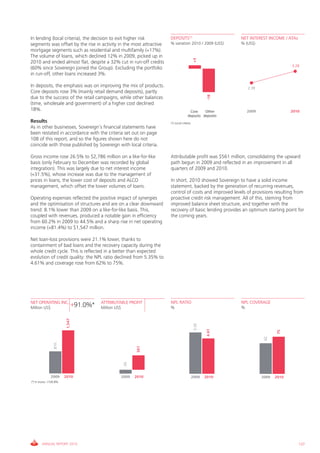
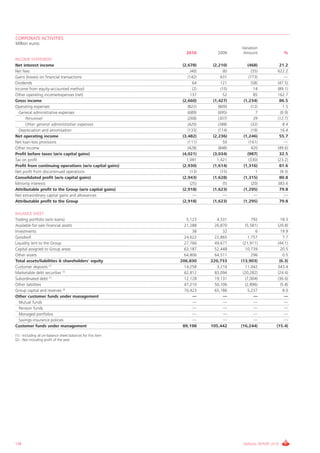
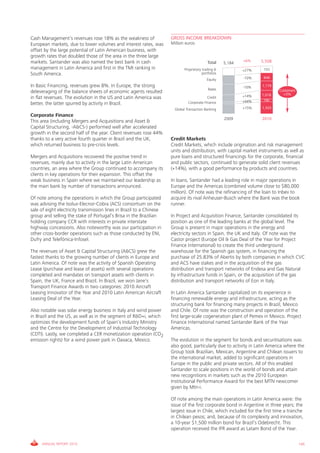
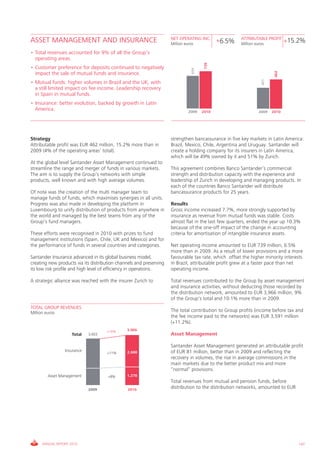
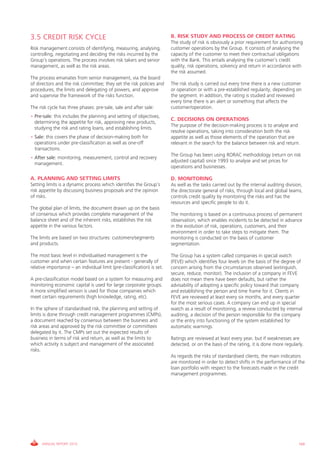
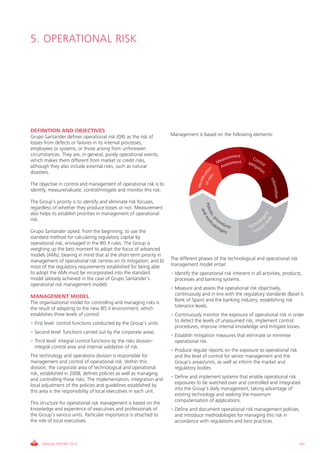
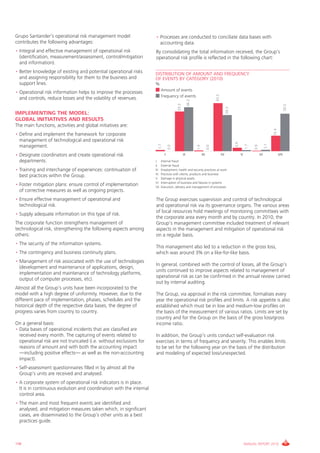
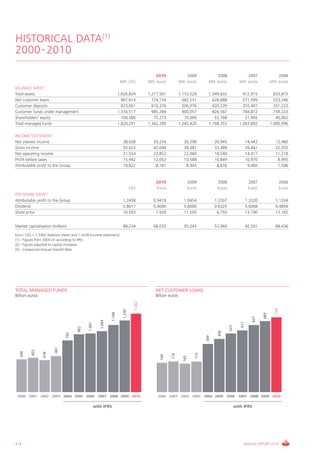
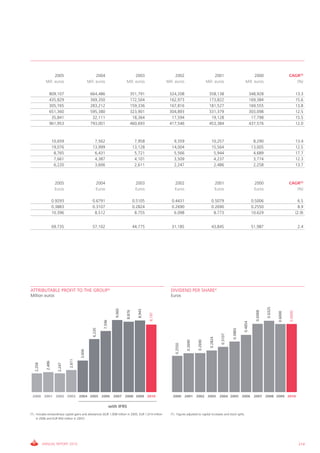
2010   ANNUAL
       REPORT
2010 ANNUAL REPORT


                     Photo: The headquarters of Santander UK, Triton Square, London, UK
2    KEY GROUP FIGURES
  4   LETTER FROM THE CHAIRMAN
 10   LETTER FROM THE CHIEF EXECUTIVE OFFICER
 16   CORPORATE GOVERNANCE
 20   THE SHARE
 22   THE SANTANDER BUSINESS MODEL
 30   SANTANDER’S BUSINESSES IN 2010
 32     Corporate transactions
 34     Continental Europe
 38     United Kingdom
 40     Latin America
 44     United States-Sovereign
 46     Global businesses
 50   CORPORATE SOCIAL RESPONSIBILITY
 54   HUMAN RESOURCES


 58   REPORT ON CORPORATE GOVERNANCE
 61   OWNERSHIP STRUCTURE
 64   BANCO SANTANDER’S BOARD OF DIRECTORS
 80   SHAREHOLDERS’ RIGHTS AND
      THE GENERAL SHAREHOLDERS’ MEETING
 82   BANCO SANTANDER’S SENIOR MANAGEMENT
 84   TRANSPARENCY AND INDEPENDENCE
 86   UNIFIED GOOD GOVERNANCE CODE


 88   FINANCIAL REPORT
 90   CONSOLIDATED FINANCIAL REPORT
108   REPORT BY BUSINESS AREAS
109      1. Main segments or geographic areas
142      2. Secondary segments or businesses


150   RISK MANAGEMENT REPORT
152   EXECUTIVE SUMMARY
154   CORPORATE PRINCIPLES OF RISK MANAGEMENT
158   CORPORATE GOVERNANCE OF THE RISKS FUNCTION
159   INTEGRAL CONTROL OF RISK
161   CREDIT RISK
182   MARKET RISK
197   OPERATIONAL RISK
200   REPUTATIONAL RISK
202   ADJUSTMENT TO THE NEW REGULATORY FRAMEWORK
204   ECONOMIC CAPITAL
207   RISK TRAINING ACTIVITIES


208   APPENDICES
210   THE COMPLIANCE FUNCTION
214   HISTORICAL DATA
216   GENERAL INFORMATION
KEY
FIGURES

BALANCE SHEET AND INCOME STATEMENT*                                                 2010                                    2009                            % 2010/2009                        2008
Total assets                                                                    1,217,501                              1,110,529                                     9.6                  1,049,632
Customer loans (net)                                                              724,154                                682,551                                     6.1                    626,888
Customer deposits                                                                 616,376                                506,976                                   21.6                     420,229
Managed customer funds                                                            985,269                                900,057                                     9.5                    826,567
Shareholders’ funds (after distribution of earnings)                               75,273                                 70,006                                     7.5                     63,768
Total managed funds                                                             1,362,289                              1,245,420                                     9.4                  1,168,355
Net interest income                                                                29,224                                 26,299                                   11.1                      20,945
Gross income                                                                       42,049                                 39,381                                     6.8                     33,489
Net operating income                                                               23,853                                 22,960                                     3.9                     18,540
Profit from continuing operations                                                   9,129                                  9,427                                    (3.2)                     9,030
Attributable profit to the Group                                                    8,181                                  8,943                                    (8.5)                     8,876

RATIOS (%)
Efficiency (with amortization)                                                         43.3                                   41.7                                                                44.6
ROE                                                                                   11.80                                  13.90                                                               17.07
ROA                                                                                    0.76                                   0.86                                                                0.96
RoRWA                                                                                  1.55                                   1.74                                                                1.87
Core capital                                                                             8.8                                    8.6                                                                 7.5
Tier 1                                                                                 10.0                                   10.1                                                                  9.1
BIS ratio                                                                              13.1                                   14.2                                                                13.3
Tangible capital/tangible assets(1)                                                      4.4                                    4.3                                                                 3.6
Ratio of basic financing(2)                                                            79.6                                   76.0                                                                75.1
Lending/deposit ratio                                                                   117                                    135                                                                 150
Non-performing loan (NPL) ratio                                                        3.55                                   3.24                                                                2.04
NPL coverage                                                                              73                                     75                                                                  91

THE SHARE AND CAPITALISATION
Number of shares in circulation (million)                                             8,329                                 8,229                                    1.2                      7,994
Share price (euros)                                                                   7.928                                11.550                                  (31.4)                     6.750
Market capitalisation (million euros)                                                66,033                                95,043                                  (30.5)                    53,960
Shareholders’ funds per share (euros)(3)                                               8.58                                  8.04                                                               7.58
Share price/shareholders’ funds per share (times)(3)                                   0.92                                  1.44                                                               0.89
PER (share price/attributable profit per share) (times)(3)                             8.42                                 11.05                                                               5.53
Attributable profit per share (euros)(3)                                             0.9418                                1.0454                                   (9.9)                    1.2207
Diluted attributable profit per share (euros)(3)                                     0.9356                                1.0382                                   (9.9)                    1.2133
Remuneration per share(3)                                                            0.6000                                0.6000                                    0.0                     0.6325
Total shareholder return (million euros)                                              4,999                                 4,919                                    1.6                      4,812

OTHER FIGURES
Number of shareholders                                                          3,202,324                              3,062,633                                     4.6                  3,034,816
Number of employees                                                               178,869                                169,460                                     5.6                    170,961
  Continental Europe                                                               54,518                                 49,870                                     9.3                     48,467
  United Kingdom                                                                   23,649                                 22,949                                     3.1                     24,379
  Latin America                                                                    89,526                                 85,974                                     4.1                     96,405
  Sovereign                                                                         8,647                                  8,847                                    (2.3)
  Corporate activities                                                              2,529                                  1,820                                    39.0                      1,710
Number of branches                                                                 14,082                                 13,660                                     3.1                     13,390
  Continental Europe                                                                6,063                                  5,871                                     3.3                      5,998
  United Kingdom                                                                    1,416                                  1,322                                     7.1                      1,303
  Latin America                                                                     5,882                                  5,745                                     2.4                      6,089
  Sovereign                                                                           721                                    722                                    (0.1)


  * Million euros
(1) (Capital+Reserves+Minority Interests+Profits-Treasury stock-Dividends-Valuation adjustments-Goodwill-Intangibles)/(Total assets-Goodwill-Intangibles)
(2) (Deposits+Medium and long-term wholesale financing+capital)/Total assets (excluding dividends)
(3) 2008 adjusted to the capital increase with preferential right at the end of 2008


2                                                                                                                                                                           ANNUAL REPORT 2010
Banco Santander distributed among its
shareholders almost EUR 15,000 million in
dividends in the last three years

GROSS INCOME                                                                   NET OPERATING INCOME
Million euros                                                 + 6.8%           Million euros                                   + 3.9%
                                                                2009-2010                                                       2009-2010
                                                42,049


                                                                                                                  23,853
                                       39,381


                                                                                                         22,960
                              33,489


                                                                                                18,540
                            2008 2009 2010                                                     2008 2009 2010


ATTRIBUTABLE PROFIT                                                            TOTAL DIVIDEND PAYOUT
Million euros                                                 – 8.5%           Million euros                                   + 1.6%
                                                                2009-2010                                                       2009-2010


                                                                                                                  4,999
                                       8,943


                                                                                                         4,919
                              8,876


                                                8,181*


                                                                                                4,812


                            2008 2009 2010                                                     2008 2009 2010
    * EUR 8,653 million before the impact of applying Bank of Spain circular
                                3/2010 (-3.2%)


EFFICIENCY                                               + 1.6 p.p.            CORE CAPITAL                                + 0.2 p.p.
%                                                                              %
                                                             2009-2010                                                       2009-2010
                              44.6


                                                43.3


                                                                                                                  8.8
                                                                                                         8.6
                                       41.7


                                                                                                7.5


                            2008 2009 2010                                                     2008 2009 2010


         ANNUAL REPORT 2010                                                                                                                 3
“Grupo Santander’s attributable profit between 2007 and 2010
     totalled EUR 35,060 million, making us the world’s third bank
     in earnings during this period”


    Photo: Mr Emilio Botín addresses the convention of Grupo Santander executives
    at the Bank’s corporate centre in Boadilla del Monte, Spain, in February 2011


4                                                                                   ANNUAL REPORT 2010
LETTER FROM THE CHAIRMAN
Emilio Botín


In a very difficult economic and financial environment, Banco Santander generated
recurring results in 2010 and strengthened its balance sheet with more capital, liquidity
and provisions. This laid the foundations for continued growth in the coming years.

Attributable profit was EUR 8,181 million in 2010, 8.5% less than in 2009.

Thanks to our geographic diversification, the commercial strength of our branch
network, the focus on controlling costs and prudent risk management we have
remained one of the world’s leading banks in terms of profits in the last four years.

Grupo Santander’s total attributable profit in 2007-2010 amounted to EUR 35,060
million, making us the world’s third bank in earnings during this period.

The good performance of the Bank’s businesses enabled the total shareholder return          The good performance of
to be held at EUR 0.60 per share, a figure in line with the objective announced at
the AGM in June 2010. In terms of total remuneration, this meant distributing almost        all the Bank’s businesses
EUR 19,000 million among our shareholders in the last four years.                           enabled total shareholder
All this is particularly important in the current context, as many of our                   remuneration to remain
competitors were forced over the past few years to eliminate or significantly reduce        at EUR 0.60 per share,
their dividend payout.
                                                                                            in line with the objective
The good reception given to Santander Dividendo Elección programme in 2009                  announced at the AGM
—under which Banco Santander gives its shareholders the option to receive part of
the dividend in cash or in new shares— led us to extend the plan and offer it for the       in June 2010
second and third interim dividends charged to 2010’s earnings. A total of 85% of
shareholders opted to receive new shares.


A DEMANDING ECONOMIC, FINANCIAL
AND REGULATORY FUTURE
The global economy is recovering, led by emerging countries. Some developed
economies, such as the US and Germany, are also registering positive growth rates.

International financial reforms, in general terms, are moving in the right direction
and significant steps forward have been taken, although there are still some issues
to be resolved.


     ANNUAL REPORT 2010                                                                                                  5
In our view:
• Basel III will mean enhanced levels of capital and liquidity for banks.
• The contingency and resolution plans (living wills) are a key mechanism
  for enhancing management of banking crises. Banco Santander was the
  first international bank to deliver its living will.
• No regulation can take the place of good supervision, which must be rigorous
  and closely monitored.
• The additional capital requirements imposed on banks which are considered systemic
  must be directly related to risk. The structure of Banco Santander’s subsidiaries limits
  the contagion between the Group’s institutions and minimizes systemic risk.
• In Spain’s case, the restructuring of savings banks is leading to very important steps
  in the right direction.
As a result of all this, I am convinced that the financial sector, which emerges from
the crisis, will be more stable, more balanced and less vulnerable.


A SOLID BASE UPON WHICH
TO CONTINUE GROWING
In the last few years, Banco Santander has managed to be profitable even in the
most difficult economic scenarios and, moreover, has taken advantage of its position
of strength to build a solid base upon which to continue growing, backed by:


BALANCE SHEET STRENGTH

Solid and sustained growth can only be achieved with a healthy balance sheet and             Solid and sustained
high levels of solvency. Banco Santander has:
                                                                                             growth can only
• High and maximum quality solvency ratios: The core capital ratio ended 2010
  at 8.8% and will exceed 9% at the end of 2011, largely due to the Group’s capacity         be achieved with a
  to organically generate capital.                                                           healthy balance sheet
• A balance sheet that withstands the most adverse scenarios: Santander was among            and high levels of
  the best in Europe in terms of profitability and solvency in the stress tests conducted
  on banks during 2010.                                                                      solvency
• A solid liquidity position: The strong capture of deposits via commercial networks
  (EUR 109,000 million in 2010 alone) and our capacity to issue medium- and long-
  term debt in the markets where we are present (EUR 38,000 million in 2010) enable
  Santander to meet its financial obligations and finance customer transactions. Banco
  Santander has no need to issue securities in Spain in 2011 and 2012 to cover its
  expected debt maturities.
• Our non-performing loan (NPL) ratios and coverage are better than the banking
  system’s average in all the countries where we operate: This is due to our strict
  management of risk and conservative policies for provisions. Banco Santander’s
  generic provisions amounted to EUR 5,846 million at the end of 2010.
In line with our criteria of maximum prudence, Banco Santander decided to apply the
Bank of Spain’s new rules on provisions conservatively, charging to the third quarter’s
results EUR 472 million net of tax. Excluding this impact, the Group’s profit in 2010
would have been similar to that in 2009, instead of declining 8.5%.


6                                                                                                       ANNUAL REPORT 2010
GEOGRAPHIC DIVERSIFICATION

Banco Santander’s international strategy in the last few years has been aimed at          Banco Santander’s
attaining a diversified presence with critical mass and high market shares in its main
markets, which currently number 10: Spain, Portugal, Germany, the UK, Brazil, Mexico,     international strategy
Chile, Argentina, the US and Poland. These countries give the Group an appropriate        in the last few years
balance between mature and emerging markets and greater recurrence
in results. Of note are:                                                                  has been aimed at
• Brazil: Its contribution to the Group’s attributable profit was the largest,            attaining a diversified
  at EUR 2,836 million (25% of the total). Economic stability and a still low level       presence with critical
  of “bankarisation” will fuel Santander’s strategic plans to grow in the country.
  Technological integration and unification of the brand in 3,702 branches was            mass and high market
  completed successfully.                                                                 shares in its main markets
• In the UK, Santander has become a leading bank in just six years. The acquisition of
  Abbey in 2004 was the most successful cross-border transaction. The UK contributed
  EUR 1,985 million to the Group’s attributable profit (18% of the total). In 2010,
  we reached an agreement to acquire 318 Royal Bank of Scotland branches to
  expand business with SMEs.
• Spain (15% of the Group’s total profits): In a very difficult year for the Spanish
  economy, the commercial networks were very busy, capturing EUR 32,000 million
  in deposits and leading the channelling of ICO loans, while maintaining the focus
  on the quality of service to customers, for which the “We want to be your Bank”
  strategy of the Santander branch network continued to play a key role. Furthermore,
  the Group’s NPL ratio in Spain (4.2%) remained below the banking system’s average,
  the efficiency ratio remained very competitive and provisions were increased.
  The Group’s loans to the construction and property sectors for real estate
  development were reduced by 27% in 2009 and 2010 to EUR 27,000 million
  (3.7% of the Group’s total lending and 12% of lending in Spain). Grupo Santander’s
  share of loans to this sector is around 10%, well below our average market share
  of 15% for the various businesses in Spain. Bad and substandard loans are 28%
  covered by provisions.
  Grupo Santander has a competitive advantage in Spain as it has two brands,
  Santander (with 2,931 branches) and Banesto (with 1,762 branches). We have no
  intention of closing branches in the near future.
• The United States contributed 7% of the Group’s total profits. The restructuring
  of Sovereign continues. In less than two years of management by Banco Santander,
  it has moved from a loss to a profit of $561 million.
Santander also took advantage of the situation in 2010 to bolster its presence in other
significant markets, such as:
• Mexico: With the purchase of the 25% of Santander Mexico in the hands of Bank
  of America, this country generated 6% of the Group’s profits.
• Germany (4% of the Group’s profits): 173 retail banking branches of the Swedish
  group SEB were acquired.
• Poland: With the acquisition of Bank Zachodni WBK, the country’s third largest bank,
  Banco Santander will enter the retail banking business.
We envisage an additional contribution of these businesses of EUR 750 million to the
Group’s results in 2013. Santander has no need to make further acquisitions in the
coming years.


     ANNUAL REPORT 2010                                                                                                7
Lastly, I would like to point out that in the last three years Banco Santander’s strategy
of expansion and acquisitions has gone hand-in-hand with a policy of selling
businesses and assets. Overall, the amount invested is roughly equal to that received
from the sales (around EUR 14,000 million), with an almost neutral impact on the
Group’s capital.


RETAIL BANKING: FOCUSED ON CUSTOMERS

These years of financial crisis have highlighted the fact that financial institutions with   Banco Santander’s
business more centred on retail banking have shown greater recurrence and less
volatility in their results. Santander’s retail banking businesses generate 76% of the
                                                                                             retail banking businesses
Group’s profits.                                                                             generate 76% of the
Grupo Santander serves almost 100 million customers through its 14,082 branches,             Group’s profits
the largest network of any international bank. This is complemented by a wide range
of multi-channel banking. The quality of customer service, innovation in products and
services and the confidence and security transmitted by the Bank help to capture,
link and retain a growing customer base.

Our customer banking model also has cutting-edge technology, which transforms cost
savings into higher value for customers and shareholders, while the Santander brand,
the third most valued financial brand in the world, today has unprecedented levels of
recognition and renown.


CORPORATE GOVERNANCE AND SUSTAINABILITY
The business model is also supported by:
• Solid corporate governance, which guarantees an appropriate risk profile and a
  long-term business strategy aligned with shareholders’ interests. Mr Ángel Jado
  Becerro de Bengoa joined the board in 2010. His long experience will contribute
  value to the board’s decisions, and
• A corporate social responsibility policy focused on supporting universities.
  We announced last May at the Second International Meeting of Universia Rectors
  in Guadalajara, Mexico, that we will invest EUR 600 million over the next five years
  in higher education. Santander Universities has agreements with 938 universities
  throughout the world, awards 13,000 scholarships and integrates more than
  1,200 universities in the Universia portal.


8                                                                                                         ANNUAL REPORT 2010
THE SANTANDER SHARE
The performance of the Santander share in 2010 did not truly reflect the Bank’s
results or growth prospects. The share ended the year at EUR 7.93, down from
EUR 11.55 in 2009 (-31%). The concerns about the international financial sector,
regulatory uncertainty and, above all, the performance of Spain’s sovereign risk dented
the share price in 2010, although I am sure that when the economic and financial
environment clears up the share will rise and reflect Grupo Santander’s real value.

Nevertheless, Santander still has one of the highest total shareholder return among its   Santander remains
European bank competitors in the medium- and long-term. The dividend yield in 2010
was 6.36%.
                                                                                          one of the banks
                                                                                          with the highest total
Banco Santander is well placed to continue to create shareholder value. Today, we are
a more solvent bank, with a greater degree of leadership in our main markets and          shareholder return
with a stronger growth potential than at the start of the crisis. Furthermore, we have    among its European
the best and most committed management team, led by the best CEO in banking.
                                                                                          competitors in the
Lastly, I would like to thank you again for your support during these years and for       medium- and long-term
the confidence you have placed in Banco Santander. You can rest assured that all of
us who work for Grupo Santander will strive to make this Bank the best investment
for all shareholders.


Emilio Botín
CHAIRMAN


     ANNUAL REPORT 2010                                                                                            9
“Santander is in an excellent position: we are a well diversified banking
      group, with one of the soundest balance sheets in international
      banking, a presence in growing markets and a banking model that
      proves its success year after year”


Photo: Mr Alfredo Sáenz speaks to the convention of Grupo Santander executives
at the Bank’s headquarters in Boadilla del Monte, Spain, in February 2011


10                                                                               ANNUAL REPORT 2010
LETTER FROM THE CHIEF EXECUTIVE OFFICER
Alfredo Sáenz


RESULTS AND SANTANDER SHARE
Grupo Santander posted attributable profit of EUR 8,181 million in 2010, 8.5% less           The stronger balance sheet
than in 2009. Once more, we gave priority to strengthening our balance sheet over
short-term results by applying the Bank of Spain’s 3/2010 Circular very strictly.
                                                                                             is reflected in the core
Excluding the impact of this decision, profit would have been EUR 8,653 million (-           capital ratio, which
3.2%).
                                                                                             increased from 8.6% at
Earnings per share (EPS) were EUR 0.9418, 9.9% less than in 2009. Eliminating                the end of 2009 to 8.8%
the impact of the circular, the EPS would have been EUR 0.9961 (-4.7%).
                                                                                             a year later
Meanwhile, the stronger balance sheet is reflected in the core capital ratio, which
increased from 8.6% at the end of 2009 to 8.8% a year later.

The Santander share price fell 31.4% in 2010, mainly due to the concern over
the sovereign debt crisis in countries on the periphery of the euro zone and the impact
of “risk contagion” on Spain, which is not justified. To the extent that the Spanish
economy and the financial system reach a more balanced situation, it is reasonable
to assume a normalisation of the financial markets.

I am optimistic about the Spanish economy because the private sector is making
progress in its adjustments — raising productivity, achieving cost savings and higher
exports in the face of the fall in domestic demand — the public sector is correcting
its imbalances and, lastly, the financial sector, especially savings banks, is starting to
recognize its losses, to recapitalize and to restructure its cost base.


     ANNUAL REPORT 2010                                                                                               11
RESULTS BY UNITS
To analyse Grupo Santander’s positioning and results, we can divide our markets into
three groups: mature markets where a clear recovery is still pending (Spain and
Portugal); mature markets where the upturn is solid (the UK, the US and Germany) and
emerging markets which are growing strongly (Brazil, Mexico, Chile, Argentina, Uruguay,
Colombia and Poland).

This business portfolio shows very tangibly the advantages of a diversified group:              Our business portfolio
our businesses have different cycles, and this injects stability into the Group’s results.
                                                                                                shows very tangibly the
MATURE MARKETS STILL RECOVERING                                                                 advantages of a diversified
                                                                                                group: our businesses have
Our income statement was hard hit in 2010 by the pressure on results from our retail
banking activity in Spain and Portugal: the combined contribution of the Santander              different cycles, and this
Branch Network, Banesto and our business in Portugal was down by EUR 1,200 million              injects stability into the
from 2009. This was mainly due to the lack of growth in lending because of low solvent
demand, higher provisions because of the economic downturn and the pressure of spreads          Group’s results
on deposits as a result of the low interest-rate environment and liquidity tensions.

Unlike in other markets, the Spanish and Portuguese financial systems have still not
adjusted sufficiently to the new environment, producing a significant deterioration
in the system’s structural profitability.

We are currently at a turning point:
• First, the Spanish financial system is going through a profound restructuring process,
  focused, in particular, on savings banks. As a result of the integration of this sector,
  we expect to see a significant reduction in the number of branches, as well as greater
  rationality in prices. In this context, our objective in Spain is to gain profitable market
  share and maintain a low risk profile.
• Second, we are seeing some upward movement in euro zone interest rates.
  This will have a positive impact on our spreads.
• Third, there is a gradual rise in credit pricing in Spain, which will help normalize our
  spreads and those of the financial system. In the last two years, loans have been
  made at prices which were not consistent with the cost of liquidity. Clearly,
  this situation was not sustainable and we are seeing the beginning of the adjustment.
• Fourth, the credit quality of our portfolio in Spain and Portugal is stabilizing.

Combining these factors, we can expect a “return to the average” profitability of
our businesses in Spain and Portugal over the next two or three years, probably
beginning in the second half of 2011. Our medium-term objective is to recover the
profit temporarily lost in 2010, and we are working on this.


MATURE MARKETS WITH SOLID RECOVERY

Our operations in the UK, the US and Santander Consumer Finance (which generated
54% of its attributable profit in Germany) are once again achieving good results, despite
doing business in markets with moderate growth.
• In the UK, attributable profit rose 10.7%, in local currency, to £1,701 million.
  In this market, we continued to concentrate on gaining market share — particularly
  in segments such as SMEs — managing spreads and continuing to maintain excellent
  credit quality.


12                                                                                                          ANNUAL REPORT 2010
• Over the next few years, our objective is to speed up our growth in segments such as
  companies and SMEs where our presence is lower than our natural market share. The
  integration of the business acquired from Royal Bank of Scotland will enable us to make
  a significant leap forward in this aspect.
• Santander has been one of the few banks in the UK that has lived through the crisis
  without problems and we have continued to make loans to the British economy,
  enabling us to gain profitable market share.
• In the US, Sovereign’s restructuring continues to produce good results. In 2010,
  attributable profit was $561 million, higher than the goal announced at the time of
  the bank’s purchase.
• Sovereign still has a significant potential to improve. During the two previous years, the
  main drivers of growth were the improvement in the efficiency ratio, management of
  spreads and enhanced credit quality. The focus now is on strengthening the bank’s
  commercial capabilities, which will be the driver of growth in the next few years. We
  expect further strong growth in Sovereign’s profit in 2011 to the announced target
  of $750 million.
• Santander Consumer Finance also had a good year. Its attributable profit rose 28.9% to
  EUR 811 million. This was a new record for this unit, which, after two years of declines
  because of the crisis, has comfortably surpassed the profit posted in 2007.
• Santander Consumer Finance’s objectives for the next few years are to complete the
  integrations underway (mainly in Germany), gain profitable market share from weaker
  competitors and continue to manage spreads and loan loss recoveries well.
• We believe that 2011 will be another year of strong growth in this division.


EMERGING MARKETS WITH STRONG GROWTH

Our units in emerging markets continued to generate very good results, reflecting the          Very few international
good economic conditions in the countries where we operate.
                                                                                               banks have such a deep
• In 2010, we returned to double-digit growth in our Latin American businesses.
                                                                                               and high quality presence
• In Brazil, attributable profit of $3,751 million was 10.4% more than in 2009. It would
  have been 24.4% higher excluding the impact of increased minority interests, following       in growth markets as
  the IPO of Santander Brazil in October 2009.                                                 we do
• Latin America excluding Brazil generated attributable profit of $2,604 million, 12.4%
  more than in 2009, with strong growth in loans and deposits in the core markets.
• In Mexico, we obtained attributable profit of $902 million, 22.7% more than in the
  previous year. Chile’s attributable profit was $904 million (+5.4%). Both units registered
  strong growth in business, with double-digit increases in lending and an improvement
  in the cost of credit.
• Moreover, in 2011 we acquired Bank Zachodni WBK, making us one of the leading
  banks in the Polish market. Poland, with almost 40 million inhabitants and a significant
  potential for growth, is a market where we have had a notable presence in consumer
  finance since 2004. Bank Zachodni WBK is an excellent franchise, the third largest bank
  by number of branches. Our objective, announced to the market at the time of the
  purchase, is to achieve a contribution from this business of more than EUR 450 million
  in 2013.

Our positioning in emerging markets will be a very significant driver of growth for the
Group in the next few years. Very few international banks have such a deep and high
quality presence in growth markets as we do.


     ANNUAL REPORT 2010                                                                                                13
THE NEED TO ADAPT TO THE
NEW BANKING ENVIRONMENT
As I commented last year, banking business has changed considerably in the
last few years. The main changes include:
1. In many markets, including the main ones in Continental Europe, the UK and the
   US, we are operating in an environment of deleveraging and low growth in
   lending.
2. Moreover, a new regulatory environment is being designed. One of the main
   implications of this change is the need to operate with much higher capital ratios,
   and with a stricter calculation of risk assets. As a result of these changes, a same
   business could be subject to more than double the capital requirement in less than
   five years.
• To this must be added the pressure on profitability from the new rules on liquidity
  and other effects, such as the new taxes on banks in some countries.
• These new capital and liquidity rules also have a negative impact on western
  economies, in terms of access to and pricing of credit.

We are witnessing profound changes in the banking business. It is vital to adapt to       We are witnessing
the new environment. We have to:
                                                                                          profound changes in the
• Review the real profitability of all our businesses. It makes sense, in those
  businesses that do not justify the capital they consume, to reduce the allocation       banking business. It is vital
  of capital or seek different approaches.                                                to adapt to the new
• Adapt pricing policies, particularly for loans.                                         environment
• Adjust the structure of costs to the revenue-generating prospects of each business.
  In many segments, the international banking sector continues to maintain cost
  structures designed in the pre-crisis environment. Banks that do not generate
  revenues to justify these costs must adjust them to the current scenario.

In short, the new environment could be very negative for those institutions
that continue to operate through inertia, and are not capable of understanding
the changes and adapting. We are very well positioned, and this makes me optimistic
about our future prospects.


14                                                                                                      ANNUAL REPORT 2010
CONCLUSIONS
My message for the coming years is very optimistic. Santander is in an excellent
position: we are a well diversified banking group, with one of the soundest balance
sheets in international banking, a presence in growth markets and a banking model
that proves its success year after year.

In our business in Spain and Portugal, we are at a very low phase of the cycle in
generating profits. However, I am optimistic about our prospects in these markets. We
also have in both cases excellent opportunities to gain profitable market share, taking
advantage of the relative weakness of many competitors.

Moreover, one of our main hallmarks as a bank is our flexibility and the speed with
which we take decisions. This is very valuable in the current environment, where it is
essential to adapt to the sector’s new conditions.

We also have one of the best teams of professionals in the international banking sector.

We have big opportunities ahead, and are working to ensure we take advantage               We have great opportunities
of them. So far, these good prospects are not reflected in the price of the Santander
share.                                                                                     ahead, and are working to
                                                                                           ensure we take advantage
Along these lines, I would like to point out that in a sum-of-its-parts calculation,
the valuations of Grupo Santander today assign a value of close to zero to the Spanish     of them
businesses. As the adjustment capacity of the Spanish private sector, public accounts
and the financial system becomes clear for the market, I have no doubt that the share
price will start to reflect our Group’s good prospects.


Alfredo Sáenz
CHIEF EXECUTIVE OFFICER


     ANNUAL REPORT 2010                                                                                            15
CORPORATE GOVERNANCE


Banco Santander has solid and transparent
corporate governance and aligned with
shareholders’ interests


BANCO SANTANDER’S CORPORATE                                    THE BOARD
GOVERNANCE MODEL                                               OF DIRECTORS

                                                               Banco Santander’s board of directors is the maximum
A balanced and committed board of directors.                   decision-making body, except for matters reserved for the
                                                               annual meeting of shareholders. It is responsible, among
• Of the 20 directors, 14 are non-executive and 6 executive.   other things, for the Bank’s strategy. Its functioning and
                                                               activities are regulated by the Bank’s internal rules and it is
                                                               guided by principles of transparency, efficiency and defence
Equality of shareholders’ rights.                              of shareholders’ interests. The board is closely involved in
                                                               the Bank’s activity and makes an exhaustive analysis of the
• The principle of one share, one vote, one dividend.          most relevant issues and risks.
• No anti-takeover measures in the corporate By-laws.
                                                               Banco Santander’s board is balanced between executive
• Informed participation of shareholders in meetings.          and non-executive directors. All members are recognised for
                                                               their professional capacity, integrity and independence.

Maximum transparency, particularly in remuneration.            After the appointment of Mr Ángel Jado Becerro de Bengoa,
                                                               approved by the annual meeting of shareholders on June 11,
                                                               2010, the board has 20 members, six of whom are executive
A corporate governance model recognised by external            directors and 14 non-executive (10 of them independent).
institutions.
                                                               The board ensures compliance with the best international
• Santander has been in the FTSE4Good and DJSI indices         practices, based on the principle of full equality of shareholders’
  since 2003 and 2000, respectively.                           rights and maximum transparency.


16                                                                                                         ANNUAL REPORT 2010
Grupo Santander City, Boadilla del Monte, Madrid, Spain


REMUNERATION POLICY                                                  REMUNERATION OF DIRECTORS IN 2010
                                                                     In 2010, for the second year in a row, the board agreed to
The remuneration policy for directors and the Bank’s senior          keep unchanged the annual remuneration of its members
management is based on the following three pillars:                  for exercising the functions of supervision and collegiate
                                                                     decision-making. There has been no change in it since 2008.
1. Transparency, as the fundamental principle that the board has
   fostered for years.                                               As regards executive directors, the board decided to maintain
                                                                     with only one exception the fixed remuneration for 2011 and
2. Anticipation and adapting to regulatory changes, given the
                                                                     increase by 10% the variable remuneration for 2010.
   importance that Santander has always attached to rigorous
   management of risk and a remuneration policy consistent
   with it.
3. Involvement of the board, as, at the proposal of the
   appointments and remuneration committee, it approves
   the report on the remuneration policy for directors.

The board submitted for the first time in 2010 the report on the
remuneration policy for directors to a consultative vote at the
ordinary general meeting of shareholders where it received the
favourable vote of 95% of shareholders who were present and
represented.

This measure joined others adopted by the board over the last
decade in order to implement the best international practices in
remuneration matters. In 2002, the Bank pioneered the
publication of the individual remuneration of executive and
non-executive directors and broken down by items, and in 2005
it was the first to present at a general meeting of shareholders
a report by the appointments and remuneration committee.
Since 2007, this report has included the remuneration policy
for directors of the previous and current year. In 2008,
the disclosure of directors’ remuneration became
a statutory obligation.


   THE BOARD OF DIRECTORS IN 2010

  • For the fifth year running, a meeting was dedicated solely        as well as the liquidity of European banks and of Santander
    to the Group’s strategy.                                          and the new rules on capital (Basel III).
  • The second vice-chairman and chief executive officer             • Ana Patricia Botín-Sanz de Sautuola y O’Shea was proposed
    presented to the board eight management reports and the            to the board of Santander UK as chief executive officer
    third vice-chairman, who heads the risks division, presented       of Santander UK. Antonio Basagoiti García-Tuñón was
    seven reports on risks.                                            proposed to the board of Banesto as non-executive
                                                                       chairman of Banesto.
  • The board analysed the businesses in Latin America,
    particularly Brazil, and those in the UK, the Santander Branch
    Network in Spain and Banesto and the Group’s Asia Plan,


     ANNUAL REPORT 2010                                                                                                                        17
CORPORATE GOVERNANCE
BOARD OF DIRECTORS


Director                   Director               Director                              Director                          Director
Lord Terence Burns         Mr Ángel Jado          Ms Ana Patricia Botín-Sanz            MrAntonio Basagoiti               Mr Antonio Escámez Torres
                           Becerro de Bengoa      de Sautuola y O’Shea                  García-Tuñón


        Director               Director        Director                  Director                Fourth vice-chairman         Second vice-chairman and
        Mr Guillermo de        Mr Luis Ángel   Mr Abel Matutes Juan      Mr Rodrigo Echenique    Mr Manuel Soto Serrano       chief executive officer
        la Dehesa Romero       Rojo Duque                                Gordillo                                             Mr Alfredo Sáenz Abad


18                                                                                                                    ANNUAL REPORT 2010
Executive committee
                                                                                                            Risk committee
                                                                                                            Audit and compliance committee
                                                                                                            Appointments and remuneration committee
                                                                                                            International committee
                                                                                                            Technology, productivity and quality committee


Chairman                            Director                 Director                      Director                     Director
Mr Emilio Botín-Sanz de             Ms Isabel Tocino         Mr Javier Botín-Sanz de       Mr Luis Alberto              Assicurazioni Generali S.p.A.
Sautuola y García de los Ríos       Biscarolasaga            Sautuola y O’Shea             Salazar-Simpson Bos          (Mr Antoine Bernheim)


               First vice-chairman                Third vice-chairman             Director                Director                  General secretary
               Mr Fernando de Asúa Álvarez        Mr Matías Rodríguez             Mr Francisco            Mr Juan Rodríguez         and of the board
                                                  Inciarte                        Luzón López             Inciarte                  Mr Ignacio Benjumea
                                                                                                                                    Cabeza de Vaca


               ANNUAL REPORT 2010                                                                                                                       19
THE SHARE


Banco Santander paid a total of EUR 4,999 million in
dividends in 2010 to its more than 3.2 million shareholders


1st                                                                           SHAREHOLDER REMUNERATION
                                                                              Banco Santander assigned EUR 4,999 million to dividends in
     Santander is the euro zone’s largest bank                                2010, 1.6% more than in 2009. The high degree of recurrence
     by market capitalisation                                                 of profits and the soundness of Santander’s capital enabled the
                                                                              Bank to pay out more than EUR 14,700 million in the last three
                                                                              years, making Santander the international bank that most

0.60                                                                          remunerated its shareholders during this period.

                                                                              As part of this remuneration, and due to its success in 2009,
 euros of remuneration per share                                              Santander maintained and increased the Santander Dividendo
                                                                              Elección programme. This scrip dividend offers Banco
                                                                              Santander’s shareholders the possibility of opting to receive
                                                                              an amount equivalent to that of the second and third interim

85%                                                                           dividends in the form of cash or new Santander shares. More
                                                                              than 85% of the Bank’s capital chose to receive shares, up from
                                                                              81% in 2009.
 of the capital opted to receive the second and third interim
 dividends charged to 2010’s earnings in the form of shares                   The board approved in January 2011 a fourth interim dividend
                                                                              of EUR 0.229 per share to be paid in May which, added to the
                                                                              dividends paid in August and the scrip dividend, paid in

3,202,324                                                                     November 2010 and February 2011, brought the total
                                                                              remuneration per share in 2010 to EUR 0.60, the same as
                                                                              in 2009.
 shareholders


REMUNERATION PER SHARE                                                        TOTAL DIVIDEND PAYOUT
Euros                                                                         Million euros
     Santander Dividendo Elección programme

                2009: 0.60 euros                   2010: 0.60 euros
                                                                      0.229


                                                                                                                                                              4,999
                                                                                                                                                      4,919
                                   0.222


                                                                                                                                              4,812
                                                                                                                                      4,070
        0.135


                                           0.135


                                                                                                                              3,256
                          0.123


                                                      0.119
                  0.120


                                                              0.117


                                                                                                                      2,605
                                                                                                              1,837
                                                                                                      1,444
                                                                                              1,376
                                                                                      1,329


     1.08.09 4.11.09 1.02.10 1.05.10 1.08.10 3.11.10 3.02.11 1.05.11                 2001 2002 2003 2004 2005 2006 2007 2008 2009 2010


20                                                                                                                                            ANNUAL REPORT 2010
General meeting of shareholders, June 11,2010, Santander, Cantabria, Spain


      PERFORMANCE OF THE SANTANDER SHARE                                 SHAREHOLDER BASE AND CAPITAL
      Stock markets were very volatile during 2010 because of doubts     The number of Banco Santander shareholders increased by
      on consolidation of the economic recovery. The share ended         140,000 in 2010 to 3,202,324. At the end of the year, 3.0%
      2010 at EUR 7.928, 31.4% lower than a year earlier. This           of the capital stock was in the hands of the board of directors,
      performance did not reflect the results and the Bank’s solid       37.8% with individual shareholders and rest with institutional
      balance sheet, nor the Group’s future prospects. Three factors     investors. Of the total capital stock, 85.5% is located in Europe,
      hit the share:                                                     14.1% in the Americas and 0.4% in the rest of the world
      • The problems of confidence that weighed on the euro zone
                                                                         The interests held by Chase Nominees Limited (10.24%), State
        and in particular on Spain. The Ibex-35 index was the worst
                                                                         Street Bank & Trust (9.52%), EC Nominees Limited (6.45%),
        performer among international markets.
                                                                         Bank of New York Mellon (5.05%), Guaranty Nominees Limited
      • The penalisation of financial stocks.                            (3.73%) and Societé Générale (3.28%), which were the only
                                                                         ones in excess of 3%, were held by them for the account of
      • The uncertainty associated with coming regulatory changes.
                                                                         their clients. The Bank is not aware of any other shareholders
                                                                         holding individual stakes of 3% or more of its capital stock.
      Santander continued to be the largest bank in the euro zone by
      market value, with a capitalisation of EUR 66,033 million at the
                                                                         Banco Santander carried out two capital increases in 2010
      end of 2010. In terms of total shareholder return, Santander is
                                                                         to tend to the conversion of 33,544 bonds (October) and for
      one of the European banks with the best return in the medium-
                                                                         the Santander Dividendo Elección programme (November).
      and long-term.
                                                                         Overall, 100,295,963 new shares were issued.

                                                                         Banco Santander continued in 2010 to strengthen its information
                                                                         and attention channels for its shareholders through seven
                                                                         dedicated offices in Spain, the UK, the US, Brazil, Mexico,
                                                                         Portugal and Chile. These offices tended to 247,057 consultations
                                                                         by telephone, 20,704 e-mails and 14,230 shareholders attended
                                                                         179 forums and events held in various countries.


      COMPARATIVE PERFORMANCE OF THE SANTANDER                           DISTRIBUTION OF THE CAPITAL STOCK BY TYPE OF
      SHARE AND INDICES                                                  SHAREHOLDER
      Data from December 31 2009 to December 31 2010                     Number of shares and %
        Santander                  Dow Jones Stoxx 50
        Dow Jones Stoxx Banks      Ibex 35                               December 2010                                 Shares                            (%)
110                                                                      Board                                  253,156,054                            3.04
                                                                         Institutional                        4,926,897,662                           59.15
100
                                                                         Retail                               3,149,068,382                           37.81
                                                                         Total                              8,329,122,098                           100.00
90


80


70


60
      31/12/09                                              31/12/10
      Base: 100


           ANNUAL REPORT 2010
             ANNUAL REPORT 2010                                                                                                                           21
Commercial focus

THE SANTANDER                                                            Disciplined
                                                                              use of                                            The Santander
BUSINESS MODEL                                                           capital and
                                                                           financial
                                                                                                                                brand
                                                                           strength


Santander’s customer-focused
                                                                              Prudence
model generates a large degree                                                   in risk
                                                                                                                               Geographic
                                                                                                                               diversification
of recurrence in its results
                                                                                                     Efficiency


COMMERCIAL FOCUS
The most lasting customer relationships, which create the most       Quality of service is a priority at Banco Santander, which strives
value, are generated and maintained in branches. Santander has       for maximum customer satisfaction. As well as various local
14,082 branches, more than any other international bank and          initiatives, Santander also has corporate strategies to enhance
mostly distributed in its 10 core markets. The Bank also provides    the quality of service in all countries and channels in which it
services through other around-the-clock channels, such as            operates. A total of 85.7% of customers said they were
online and telephone banking.                                        satisfied, generating greater linkage and loyalty as well
                                                                     as more revenues.
In 2010, Santander stepped up its distribution capacity by
422 branches, mainly as a result of plans of branch openings         Banco Santander has a broad range of financial products and
in high growth countries such as Brazil and Mexico.                  services with which to seek to satisfy customers’ needs. A
                                                                     hallmark of the Bank, in all its markets, is its anticipation and
The customer base has grown significantly in the last few years.     dynamism when launching new products. For example, in 2010
It doubled between 2004 and 2010. At the end of 2010,                the “Depósito Ganador” in Spain, the Santander Zero Current
Santander had 97.2 million customers, distributed as follows:        Account in the UK and the “Conta Integrada” in Brazil for shops
31% in Continental Europe, 26% in the UK and 43% in                  and companies.
the Americas.

Customer linkage and retention are constant objectives of
Banco Santander’s commercial policy. In 2010, the initiatives
launched in various countries with plans to eliminate service fees
are having a very positive impact on retaining customers: in
Spain, the “We want to be your Bank” plan notably increased
customer loyalty.


CUSTOMERS                                                            BRANCHES
Million                                                              Number
                                                                                                                  14,082
                                        97.2


                                                                                                         13,660
                                 92.0


                                                                                                13,390
                          87.2


                         2008 2009 2010                                                        2008 2009 2010


22                                                                                                                         ANNUAL REPORT 2010
THE SANTANDER BRAND


Santander, a strong and attractive
brand positioned among the world’s best


Santander is the brand which embodies the Group’s identity and    In Germany, the branches acquired from the Swedish bank SEB
expresses a corporate culture, an international positioning and   will assume the Santander brand. The Bank will also launch
a strong identity throughout the world. It represents the         various initiatives and corporate and brand marketing strategies
essence, personality and values that make Santander unique:       to strengthen and foster customer satisfaction. The aim is to
dynamism, strength, innovation, leadership, commercial drive,     make the Santander brand increasingly associated with the
quality of service and professional ethics and sustainability.    Bank’s excellent quality of service.

Integral and consistent management of the Santander brand         CORPORATE SPONSORSHIPS
has enabled it to be known throughout the world. Today it         Corporate sponsorships continue to be the best platform
is present in all the brand rankings of the main consultancy      for enhancing the renown of the brand and consolidating
firms, such as Interbrand, Millward Brown and Brand Finance.      the Bank’s positioning at the international level. The five-year
                                                                  alliance with the Formula 1 Ferrari team has been a complete
Progress continued in 2010 in consolidating the brand in key      success. The return on the advertising in the first year covered
markets for the Group. Santander adopted a single brand in        the investment for 2010-2013. This sponsorship has proved
the UK after integrating those of Abbey, Bradford & Bingley       to be an excellent tool for business: the success of the launch
and Alliance & Leicester. In just five years, Santander has       of the Santander-Ferrari card in Spain, Brazil, Mexico and
become a leading brand in UK banking, where it is known by        Portugal is the best proof of this.
more than 90% of the population. In November, Santander also
had a single brand in Brazil following the integration of         In the UK, Santander continued to sponsor the drivers of the
Santander and Banco Real.                                         McLaren Formula 1 team and in Latin America, for the fourth
                                                                  year running, the Bank will sponsor in 2011 the Santander
As regards the challenges for 2011, in Poland the integration     Libertadores Cup. Furthermore, in order to increase the link
and change of brand of the business acquired from AIG will be     with Latin America Santander will be the official bank of the
completed and become Santander Consumer Finance.                  Copa América Argentina 2011, one of the world’s main football
                                                                  championships.


  United Kingdom:
  January and November 2010
  REBRANDING OF ABBEY
  AND BRADFORD & BINGLEY
  REBRANDING OF
  ALLIANCE & LEICESTER


  Brazil:
  November 2010
  UNIFICATION OF THE BANCO REAL
  AND SANTANDER BRAZIL BRAND


       ANNUAL REPORT 2010                                                                                                            23
Banco Santander business model


GEOGRAPHIC DIVERSIFICATION

Banco Santander’s geographic position is    The Bank concentrates on 10 core            Main countries.
balanced between mature and emerging        markets: Spain, Portugal, Germany,          Other countries where Banco Santander has
markets, which contributed 57%              the UK, Brazil, Mexico, Chile, Argentina,   retail banking businesses: Colombia, Peru,
and 43% of profits in 2010, respectively.   the US and, most recently, Poland.          Puerto Rico, Uruguay, Norway, Sweden,
This enables the Bank to maximise                                                       Finland, Denmark, Netherlands, Belgium,
revenues and profits throughout the         The Bank also has global business areas     Austria, Switzerland and Italy.
economic cycle.                             which develop activities in other
                                            countries as well as in the main markets.


 US-SOVEREIGN
 Customers (million)                1.7

 Branches                          721

 Employees                        8,647

 Market share(8)                    3%


 MEXICO
 Customers (million)                9.1

 Branches                         1,100

 Employees                       12,500
                     (1)
 Market share                      15%
           (1)
 Ranking                            3rd


 BRAZIL
 Customers (million)               24.7

 Branches                         3,702

 Employees                       53,900
                     (1)
 Market share                       9%
           (1) (2)
 Ranking                            3rd


 CHILE
 Customers (million)                3.1

 Branches                          504

 Employees                       11,595
                     (1)
 Market share                      19%
           (1)
 Ranking                            2nd


 ARGENTINA
 Customers (million)                2.3

 Branches                          324

 Employees                        6,466

 Market share(1)                   10%

 Ranking(1) (2)                      1st


24                                                                                                        ANNUAL REPORT 2010
UNITED KINGDOM
  Customers (million)                                  25.6

  Branches                                            1,416

  Employees                                         23,649
                     (1)
  Market share                                         11%
              (3)
  Ranking                                                 2nd


  GERMANY(9)
  Customers (million)                                    6.2

  Branches                                              142

  Employees                                           3,483

  Market share(4)                                      13%

  Ranking(5)                                              1st


  POLAND(10)
  Customers (million)                                     1.8

  Branches                                               213

  Employees                                           2,751
                     (6)
  Market share                                          10%
               (7)
  Ranking                                                 2nd


  SPAIN
  Customers (million)                                   14.4

  Branches                                            4,848

  Employees                                         33,694
                     (1)
  Market share                                          15%
               (1)
  Ranking                                                  1st


  PORTUGAL                                                                                              ATTRIBUTABLE PROFIT BY GEOGRAPHIC AREAS
                                                                                                        % of total operating areas                        Continental
  Customers (million)                                    1.9                                                     Rest of Latin America 6%                 Europe 35%
                                                                                                                                                  Spain retail
  Branches                                              759                                                           Chile 6%                    networks 15%
  Employees                                           6,214
                                                                                                           Mexico 6%
  Market share(1)                                      10%                                                                                                  Portugal 4%

  Ranking(1) (2)                                          3rd                                                                                                Germany 4%

                                                                                                                                                              Rest of retail
(1)    Loans, deposits and mutual funds.                                                                                                                      Europe 3%
(2)    Excluding state banks.
(3)    Loans and retail deposits.                                                                        Brazil 25%
(4)    Consumer credits.
(5)    Among independent finance companies.
                                                                                                                                                           Europe global
(6)    In new car sales of individuals.
                                                                                                                                                           businesses 9%
(7)    In institutions specialised in consumer financing.
(8)    In its zone of influence.                                                                                                                    US-Sovereign
(9)    In January 2011, 173 more retail banking branches in Germany were incorporated into the Group.                                               4%
(10)   On March 25 Santander’s takeover of Bank Zachodni WBK was completed.
                                                                                                                                       UK 18%
       This will add 527 retail banking branches in Poland.


          ANNUAL REPORT 2010                                                                                                                                               25
Banco Santander business model


EFFICIENCY


With an efficiency ratio of 43.3%, Santander is
one of the most efficient international banks


Santander has a cutting-edge technological and operational               customer fees. In Spain, the “We want to be your Bank” plan is
platform in international banking, which enables it to achieve           now five years old and more than 4 million linked customers
high productivity and know in detail the overall financial needs         benefit from zero commissions and other advantages. In the UK,
of its customers. The Bank strives to centre all its resources on        the Santander Zero Current Account was launched, which
customer service, improving processes and optimising the                 eliminates commissions for certain services and on overdrafts and
functioning of the support areas.                                        gives free access to Santander ATMs throughout the world to,
                                                                         among others, customers who have a mortgage, an investment
Santander continues to progress in the technological and                 product or their main current account with Santander UK.
operational integration of all its units, which is creating value via
synergies and cost savings. In 2010, all the Bank’s businesses           DATA PROCESSING CENTRES
in the UK were successfully integrated and now operate under             Banco Santander’s technology drive led in 2010 to the
the same brand and IT systems. As for Brazil, the technological          construction of a new data-processing centre in Cantabria,
integration of the commercial networks has already been                  Spain, which will be fully working at the beginning of 2012.
completed. The experience that the Bank has accumulated                  This centre joins those that the Bank already has in Madrid,
in the last few years enables it to execute these integration            London, Querétaro (Mexico), and Campinas in the state of
processes quickly and efficiently.                                       São Paulo, Brazil. These centres have all the infrastructure
                                                                         needed to provide services to customers and manage the
This strategy, combined with the recurrent growth in the Bank’s          three trillion transactions processed every year.
revenues, strict control of costs and very productive branches,
makes Santander one of the most efficient international banks,           The new data-processing centre in Cantabria will reduce
with an efficiency ratio of 43.3%.                                       operational risk to a minimum and will increase by 30% the
                                                                         space for storing data and the Group’s processing servers.
The continuous improvements in efficiency have produced higher           As well as the technological advances incorporated, the design
value-added for customers, as shown by the decisions taken in            and construction take into account the most demanding and
some of the main markets where the Bank has eliminated                   innovative standards in energy efficiency and sustainability.


GRUPO SANTANDER’S DATA-PROCESSING CENTRES


                                                                                                        Milton Keynes (UK)
                                                                                                        16,450 MIPS*
                                                                                                        3,110 servers


     Querétaro (Mexico)
     11,800 MIPS*
     1,686 servers                                                        Cantabria (Spain)
                                                                          Operational as of 2012

                                                                               Boadilla (Spain)            Madrid (Spain)
                                                                               30,368 MIPS*                10,538 MIPS*
                                                                               6,700 servers               1,328 servers


                                                                        Campinas (Brazil)
                                                                        36,642 MIPS*
                                                                        3,530 servers


* MIPS: millions of instructions per second


26                                                                                                                     ANNUAL REPORT 2010
PRUDENCE IN RISK


Banco Santander has better credit quality than
its competitors in the regions where it operates


Prudent risk management has been a hallmark of Banco                  SANTANDER HAS A LOW AND
Santander since it was founded more than 150 years ago.               PREDICTABLE RISK PROFILE
This focus has played a decisive role in the growth in recurrent      Retail banking accounts for 86% of Banco Santander’s risk. As it
earnings and in generating shareholder value.                         is very close to its customers, Santander knows their risks well
                                                                      and this enables it to act rigorously and with anticipation when
Everyone is involved in risk management, from the daily               admitting, monitoring and recovering loans. Santander’s risk
transactions in branches, where many business managers also           profiles are highly diversified and their concentration in
have risk objectives, to senior management, the executive             customers, business groups, sectors, products and countries is
committee and the board, whose risk committee comprises               subject to limits.
five directors and meets for 297 hours a year.
                                                                      Banco Santander has the most advanced risk management
Of note among the corporate risk management principles is             models, such as tools for calculating ratings and internal
that the risk function is independent of business. The head of        scoring, economic capital, price-setting systems via return on
the Group’s Risk Division, Matías Rodríguez Inciarte,                 risk-adjusted capital (RoRAC), use of value at risk (VaR) in market
third vice-chairman and chairman of the risk committee,               risk, and stress testing.
reports directly to the executive committee and to the board.
                                                                      The policy for provisions was very strict in 2010 for bad,
Grupo Santander’s coverage in 2010 was 73% and the NPL                doubtful and substandard loans, with very rigorous criteria
ratio 3.55%. In Spain, the NPL ratio was 4.24% compared to            for their classification.
an average for the sector of 5.83%, while some of the Group’s
units, such as Santander Consumer Finance, Brazil and
Sovereign reduced their ratios during the year.                                                       ***

Credit exposure to the construction and real estate sectors in
Spain represented 3.7% of the Group’s total loans and 12%             Banco Santander’s risk management principles are set out
of total credit in Spain. Santander’s estimated market share of       in greater detail on pages 154-158 of the annual report.
this business is approximately10%, substantially lower than that
of the Group’s total businesses in Spain (15%). All these risks are
appropiately provisioned (coverage of 28%).


NON-PERFORMING LOAN RATIO                                             COVERAGE RATIO
%                                                                     %
                                         3.55


                                                                                                 91
                                  3.24


                                                                                                      75

                                                                                                            73
                           2.04


                          2008 2009 2010                                                        2008 2009 2010


     ANNUAL REPORT 2010                                                                                                                27
Banco Santander business model


DISCIPLINED USE OF CAPITAL
AND FINANCIAL STRENGTH

In an uncertain banking environment, Banco Santander
significantly strengthened its balance sheet


CAPITAL                                                                 LIQUIDITY
The core capital ratio, the main indicator of a bank’s solvency,        Santander finances most of its loans with customer deposits,
increased to 8.8% in 2010. This increase is the result of organic       has wide access to wholesale financing and draws upon a
generation of capital as well as the Santander Dividendo                diverse range of instruments and markets to obtain liquidity.
Elección programme (scrip dividend), which 85% of the Bank’s
capital opted to accept.                                                Banco Santander also continued in 2010 to bolster its liquidity,
                                                                        capturing EUR 109,000 million in deposits and EUR 38,000
During the last few years of financial crisis, Santander raised its     million in medium- and long-term financing. This means
core capital by more than 2.5 p.p., without the need of state           Santander has no need to issue debt in Spain in 2011 and 2012.
aid. This was largely achieved by generating organic capital,
the Santander Dividendo Elección programme (scrip dividend),            Banco Santander’s geographic diversification has also benefited
the listing of Banco Santander Brazil and the capital increase          its liquidity. Strong deleveraging and the capturing of deposits,
with preferential subscription rights in 2008.                          mainly in mature markets, have had a positive impact on
                                                                        liquidity ratios, while growth in lending by the Group’s banks
Santander’s core capital ratio is of very high quality, mainly          in emerging markets was financed by increased deposits.
consisting of capital and reserves.
                                                                                                       ***
Santander applies very strict strategic and financial criteria to its
new acquisitions. These have to be in countries and markets             The main rating agencies affirmed their high ratings for
that Santander knows well, must have a positive impact on               Santander in 2010 (AA). Santander is one of only four
earnings per share and must exceed the cost of capital by the           international banks with an AA rating from the three
third year after the acquisition.                                       main agencies.


CORE CAPITAL                                                            DEPOSITS+MEDIUM-AND LONG-TERM FINANCING/LOANS
%                                                                       %
                                                                                                                 115


                                       8.8
                                 8.6
                                                                                                        106
                                                                                              104


                           7.5


                          2008 2009 2010                                                    2008       2009     2010


28                                                                                                                 ANNUAL REPORT 2010
BANCO SANTANDER AND THE
NEW FINANCIAL REGULATIONS

Banco Santander’s subsidiary structure, financial soundness
and prudence: The best formula for tackling the new economic
scenario and international regulations


The global economy requires an agile, solvent and well                       THE SUBSIDIARY MODEL
supervised financial system to guarantee stability and                       The focus of Santander’s business model is retail banking with
economic growth. Santander has a proactive and constructive                  a low and predictable risk profile and without any complex
position in the design of the new regulatory and international               interconnections. These factors clearly mitigate systemic risk.
supervisory environment, which will be the framework of                      Furthermore, Banco Santander’s international expansion has
activity for banks in the coming years.                                      been carried out through a structure of legally independent
                                                                             subsidiaries. A fundamental element of this model is the
Banco Santander participated during 2010 in the highest level                principle of financial autonomy of local subsidiaries:
international forums, where it set out its position on the key
                                                                             • Capital: Local units have the capital needed to autonomously
issues of financial reform. Banco Santander attaches particular
                                                                               carry out their activity and tend to the regulatory requirements,
importance to close and rigorous supervision; no regulation can
                                                                               without recourse to the parent bank.
take the place of good supervision.
                                                                             • Liquidity: Each subsidiary develops its financial plans, liquidity
The international regulatory debate is currently centred around                projections and financing needs without counting on funds
three main issues:                                                             and guarantees from the parent bank. The ALCO committees
                                                                               coordinate the liquidity position at Group level.
• Implementing the capital and liquidity reforms known as Basel III.
• Specific regulation of institutions considered systemic.                   This autonomy is compatible with strong corporate policies that
                                                                             ensure the Group’s co-ordination in spheres such as technology
• Frameworks for resolving and managing a crisis.
                                                                             and risks.
BASEL III
                                                                             The structure of financially autonomous subsidiaries reduces the
The new Basel III regulations are a very important step for
                                                                             possibilities of systemic risk contagion among the Group’s units.
strengthening the international financial system via more
                                                                             This structure is also submitted to a two-pronged supervision,
demanding and higher quality capital ratios. As regards the
                                                                             by the home supervisor and the local one, and has very positive
new liquidity requirements, it is very important that the final
                                                                             implications with regard to resolving and managing a crisis.
definition reflects the differences associated with the various
banking business models and avoids collaterally penalising
                                                                             Banco Santander, in line with the requirements of the Financial
the flow of loans to the real economy.
                                                                             Stability Board in crisis resolution and management matters,
                                                                             was the first international bank to send its living will to its
                                                                             supervisor. This plan highlights the strength of Banco
                                                                             Santander’s business model and the advantages for the Group
                                                                             of the structure of its subsidiaries.


                                                 III International banking conference, September 15th 2010, Grupo Santander City, Boadilla del Monte, Madrid, Spain.


     ANNUAL REPORT 2010                                                                                                                                          29
SANTANDER’S
      BUSINESSES IN 2010


Santander branch in SMo Paulo, Brazil
GRUPO SANTANDER RESULTS
Santander’s net attributable profit in 2010 was
EUR 8,181 million.

The recurrence of profits, which for the fourth year in a row
were more than EUR 8,000 million, is based on a business
model that focuses on retail banking, geographic diversification
and the strength of Santander’s balance sheet. These results
enabled the Bank, for the second year running, to provide total
shareholder remuneration of EUR 0.60 per share.

The Group’s results are increasingly more geographically
diversified: Continental Europe contributes 35% of profits
(the commercial networks in Spain 15%), Latin America 43%
(Brazil 25%), the UK 18% and Sovereign in the US 4%.

The Group kept up intense activity in 2010. Deposits grew
22% and loans 6%. Gross income increased 6.8%, spurred by
the most commercial revenues such as net interest income,
fee income and insurance, as well as the contribution of the
new units. Costs remained under firm control in almost all
countries in which the Group operates. This, coupled with
revenues, pushed up net operating income by 3.9%.
The efficiency ratio of 43.3% was one of the best among
international banks.

Profit was 8.5% lower than in 2009 because of the Bank’s
decision to apply very prudently and conservatively the Bank of
Spain’s new regulations on provisions, which absorbed EUR 472
million of the third quarter’s net profit.

The credit quality of the Group’s main units improved in 2010,
with falls in net entries of bad loans and in the risk premium.
The NPL ratio rose from 3.24% in 2009 to 3.55%, a slower pace
of growth than in 2009 and 2008. The ratio was lower in Brazil,
Sovereign and Santander Consumer Finance. NPL coverage was
73% and the Group’s generic provisions amounted to EUR
5,846 million.

Santander has a comfortable liquidity position. In 2010 it
increased its deposits by EUR 109,000 million, captured EUR
38,000 million in debt issues and improved the main liquidity
ratios.

Core capital, the main measure of a bank’s solvency, was
8.8% and is expected to surpass 9% in 2011.


                                                                31
CORPORATE TRANSACTIONS

Banco Santander strengthens its presence
in its core markets


GERMANY                                                                UNITED KINGDOM
SEB branches                                                           Royal Bank of Scotland branches
Santander has been operating in Germany for more than                  The UK, which contributed 18% of the Group’s attributable
20 years through a consumer finance business that is a leader          profit in 2010, is one of Santander’s core markets. Santander
in this segment of the market and which contributed 4% of the          entered retail banking in the UK in 2004 when it acquired
Group’s profits in 2010.                                               Abbey. In just six years, it has become one of the leading banks
                                                                       in the country in terms of deposits, efficiency and profitability.
In July, Santander reached an agreement with the Swedish
financial group Skandinaviska Enskilda Banken (SEB Group)              In August 2010, Santander UK reached an agreement to acquire
to acquire its retail banking business in Germany for EUR 555          the part of the business that the Royal Bank of Scotland
million. This operation was completed on January 31, 2011,             conducted via its branches in England and Wales, and of the
with the integration of SEB’s branches into Santander Consumer         NatWest network in Scotland. The price was £1,650 million.
Bank in Germany.


This acquisition will add 173 branches to the Group, offering          The acquisition includes 311 RBS branches in England and
services to one million customers including 10,000 SMEs. It also       Wales, seven of NatWest in Scotland, 40 SME banking centres,
boosts Santander’s balance sheet in Germany with EUR 8,500             four company banking centres and three private banking
million of loans and EUR 4,600 million of deposits. As a result of     centres. The operation affects 1.8 million individual customers,
this operation, Santander will double its number of branches in        244,000 SMEs and 1,200 company banking clients.
Germany, have 7 million customers and EUR 30,000 million in
customer loans. The new branches will operate under the
Santander brand in the first half of 2011.

This acquisition is also strategically very important for the Group,
as it is a natural step toward developing retail banking beyond
consumer finance in Germany, the euro zone’s largest economy
and the European country with the largest volume
of deposits.


 173 branches                                                           318 branches

 1 million customers                                                    1.8 million individual customers

 Investment: EUR 555 million                                            Investment: £ 1,650 million


32                                                                                                                 ANNUAL REPORT 2010
POLAND                                                              MEXICO
Bank Zachodni WBK                                                   Acquisition of 25% of Santander Mexico
Poland is one of east Europe’s most attractive markets due to       Santander is Mexico’s third largest financial group by business
the size of its economy and its good medium- and long-term          volume, with a market share of 13.5% in loans and 15.1% in
prospects. It is a country that Banco Santander knows well          savings, 1,100 branches and 9.1 million customers. It has been
through its experience there since 2004 via Santander               conducting retail banking in the country for 13 years.
Consumer Bank.
                                                                    Banco Santander acquired in 2010 the 25% of Santander
Banco Santander agreed in September to buy Allied Irish Bank’s      Mexico that Bank of America held since 2003. Banco Santander
70.36% stake in Poland’s Bank Zachodni WBK, a transaction           now fully owns Santander Mexico, whose contribution to the
carried out through a takeover bid for all of the capital. In       Group’s profits will increase to 7%.
March 2011 Banco Santander announced completion of the
acquisition, after securing tender acceptances representing


95.67% of the bank's capital. The total amount of the               The purchase cost $2,500 million, a price which valued
operation, including the 50% stake that Allied Irish Bank had in    Santander’s businesses in Mexico at $10,000 million. This
BZ WBK Asset Management (EUR 150 million in cash), was EUR          acquisition will have a positive impact on earnings per share
4,139 million.                                                      of 1.3% as of the first year.

Bank Zachodni, headquartered in Wroclaw, is Poland’s third          This operation strengthened Santander’s commitment to Latin
largest bank by profits (EUR 244 million in 2010) and branches      America and in particular to Mexico, a country where the Group
(527 throughout the country). It has EUR 10,500 million of          has a significant growth potential thanks to the good economic
deposits and EUR 8,700 million of loans (market shares of 6.4%      outlook and the solid, efficient and competitive business model
and 4.7%, respectively). It is Poland’s second best bank in terms   of the Mexican franchise.
of efficiency and has good liquidity and solvency positions.

This acquisition will make a positive contribution to Santander’s
earnings per share right from the start.

This operation enables Santander to enter universal banking in
Poland with force and deepen its geographic diversification in
large emerging markets with high growth potential.


                                                                     Santander in Mexico

 527 branches                                                        1,100 branches

 2.4 million customers                                               9.1 million customers

 Investment: EUR 4,139 million                                       Additional investment: $2,500 million


     ANNUAL REPORT 2010                                                                                                             33
CONTINENTAL EUROPE


Santander strengthens its leadership in its core markets
of Continental Europe and generates a net attributable
profit of EUR 3,885 million


Santander is the leader in retail banking in Spain, via the         ATTRIBUTABLE PROFIT
Santander and Banesto branch networks, and in private               Million euros                                                                       – 22.8%


                                                                                                              5,031
banking. Santander Totta is the largest bank in terms of profits


                                                                                                                       3,885 (1)
in Portugal. Santander is the consumer finance leader in
Germany and, since February 2011, also provides retail
banking services. Santander also has wholesale businesses,
asset management and insurance in Continental Europe.

In 2010, Continental Europe’s revenues were dented by the
weak economic environment, particularly in Spain and Portugal.
Operating costs, meanwhile, remained flat in the main
commercial units. The efficiency ratio was 38.6% and net
operating income was 5.0% lower than in 2009.                                                               2009 2010
                                                                    (1) EUR 4,357 million before the impact of Bank of Spain circular 3/2010 (-13.4%)
The area’s attributable profit was EUR 3,885 million (35% of
the Group’s total). This was 22.8% lower than in 2009 as it was
affected by Santander’s decision to apply very conservatively
and prudently the Bank of Spain’s new regulations on                MANAGED CUSTOMER FUNDS
provisions. This meant reducing the profit generated in Spain       Billion euros                                                                       + 9.6%
by EUR 472 million.
                                                                                                                      352

Activity in 2010 centred on capturing customer funds as
demand for loans was very weak.
                                                                                                             321

For the third year running, Grupo Santander was chosen by the
magazine Euromoney as the Best Bank in Spain (Santander and
Banesto) and in Portugal (where The Banker also awarded it
their prize).


                                                                                                            2009 2010


                                                                                                                                                              Total
                                       Santander                                                         Santander                                      Continental
CONTINENTAL EUROPE                Branch Network          Banesto           Portugal               Consumer Finance                         Rest            Europe

Customers (million)                          9.3              2.5                  1.9                         15.6                          0.4              29.7
Branches (number)                          2,931           1,762                  759                            519                          92             6,063
Employees (number)                        18,893           9,742               6,214                        13,852                       5,817              54,518
Customer loans*                          111,372          75,624             30,102                         63,342                      43,221             323,660
Managed customer funds*                  112,531          98,325             33,927                         38,118                      68,936             351,836
Net operating income*                      2,769           1,376                  650                         3,361                      1,637               9,794
Attributable profit*                       1,243             419                  456                            811                        957              3,885
Efficiency (%)                              42.8            42.8                 45.4                          27.5                        43.1               38.6

(*) Million euros


34                                                                                                                                    ANNUAL REPORT 2010
Branch of Santander in Calle Alcalá, Madrid. Spain


SPAIN - SANTANDER BRANCH NETWORK

The Santander Branch Network                                           Despite the reduced demand for loans,         This achieved two objectives: an increase
contributed EUR 1,243 million to the                                   more than 285,000 lending transactions        in the customer base and strengthening
Group’s results, 38.0% less than in 2009.                              were executed for a total of more than        the Group’s balance sheet and liquidity.
                                                                       EUR 35,000 million. Of note were the          As a result of this strong contribution to
The focus of the strategy of the                                       operations conducted via programmes           customer funds, Santander’s market
Santander Branch Network in 2010 was                                   with state institutions and regional and      share rose by more than 100 b.p. to
on achieving closer, more profitable and                               local governments, and above all the          9.0%.
lasting relations with customers, through                              contribution of the Santander Branch
its 2,931 branches.                                                    Network to the financing programmes           The strategic plan, “We want to be your
                                                                       of the Official Credit Institute (ICO),       Bank” remained in force after five years.
In an environment of low economic                                      where it remained the market leader           It is the main driver behind capturing new
growth, an increase in non-performing                                  with a market share of 18% as a result        customers. The total number of
loans and low interest rates, the                                      of granting more than 50,000 loans,           customers in Spain reached 9.3 million,
Santander Branch Network concentrated                                  especially to SMEs and businesses in          4.2 million of whom benefit from the
in 2010 on intensifying commercial                                     Spain.                                        plan and are exempt from paying service
activity, defending spreads, maintaining                                                                             commissions.
flat costs and active risk management.                                 Customer funds grew much more
The good results of this management led                                strongly, particularly in the first half of   Santander attained these results while
to gross income of EUR 4,841 million.                                  2010 because of the “Depósito Ganador”        keeping costs flat and without reducing
                                                                       and “Cuenta Crecimiento” campaigns.           its installed capacity. Banco Santander’s
The year 2010 was particularly                                         The balance of deposits increased by EUR      non-performing loan ratio at the end of
significant for commercial activity.                                   13,240 million.                               2010 was 4.24%, well below the sector’s
                                                                                                                     average of 5.83%.


ATTRIBUTABLE PROFIT                                                                           CUSTOMERS
Million euros                                                                   – 38.0%       Million                                                  + 0.4 mill.
                                             2,005


                                                                                                                                   9.3
                                                                                                                            8.9
                                                     1,243 (1)


                                           2009 2010                                                                      2009 2010
(1) EUR 1,536 million before the impact of Bank of Spain circular 3/2010 (-23.4%).


        ANNUAL REPORT 2010                                                                                                                                               35
Continental Europe


                                                                                                                  Santander Totta, Lisbon, Portugal


SPAIN - BANESTO                                                         PORTUGAL
Banesto contributed net attributable profit of EUR 419 million in       Net attributable profit was EUR 456 million, 14.2% lower
2010, 43.2% less than in 2009 and largely due to the effort             than in 2009.
made in provisions.
                                                                        Against a background of a sharp slowdown in economic and
Banesto focuses on retail banking services with individual              financial activity, and strong restrictions on Portuguese banks’
customers, SMEs and companies, and together they generate               access to international financing markets, Santander Totta
82% of the bank’s gross income. Its 2.5 million customers are           maintained solid capital and efficiency ratios, as well as higher
tended to in 1,762 branches and through its multi channel               levels of profitability than those of its competitors.
platform. The online bank, ibanesto, has more than 150,000
customers and in 2010 was the leader in capturing funds in              One of the strategic priorities of 2010 was the greater emphasis
direct banking in Spain.                                                placed on capturing funds (+45% in deposits). This, coupled
                                                                        with weak demand for loans by individual customers and
Despite the strong pressures exerted by a difficult economic            companies, produced a better financial structure and enabled
environment, in 2010 Banesto managed to improve its                     Santander Totta to maintain a comfortable liquidity position.
competitive position and was the sector’s reference in efficiency
and risk quality. It also notably bolstered its capital and liquidity   In 2010, Santander Totta launched two innovative products in
position and increased the number of customers and their                the Portuguese market: the “Soluciones Integradas” campaign,
degree of linkage:                                                      which offers a higher return on deposits and also provides
                                                                        access in special conditions to various credit lines; and the
• 270,000 new individual customers and 82,000 companies
                                                                        “Gestor de Pagos y Cobros” which aims to deepen the relation
  and SMEs were captured.
                                                                        with SMEs, the backbone of the Portuguese economy.
• Total private sector funds increased 6.5%.
                                                                        The 6.2% decline in gross income was mainly due to the higher
• The efficiency ratio was 42.8%, a notable figure given the
                                                                        cost of financing, the lower demand for loans and stiffer
  complicated economic context.
                                                                        competition to capture funds. Another of the year’s priorities
• The non-performing loan ratio was 4.11%.                              was rigorous control of operating costs (-0.6%). Risk continued
                                                                        to be actively and prudently managed as well as the focus on
• Capital ratios increased through organic growth, with the
                                                                        loan loss recoveries. At the end of 2010, the non-performing
  core capital ratio reaching 8.3%.
                                                                        loan ratio was 2.90% and coverage 60%.
The magazine Global Finance included Banesto among the
world’s 50 safest banks for the second year running.                    Santander Totta consolidated itself as Portugal’s leading bank
                                                                        in terms of financial strength and solvency. The bank has the
                                                                        highest Tier 1 capital ratio in the sector (11.2%) and obtained
                                                                        the best results in the stress test conducted on banks in
                                                                        Portugal, as well as the best rating of a bank in the country.


36                                                                                                                  ANNUAL REPORT 2010
SANTANDER CONSUMER FINANCE
Santander Consumer Finance is the Group’s division specialised
in consumer finance. Its business model is based on providing
customers with financial solutions via more than 145,000
distributors. Once a relation is started with a customer,
Santander Consumer Finance increases customer linkage and
loyalty by directly offering them other products such as credit
cards and personal loans.

RESULTS IN 2O1O
Santander Consumer Finance generated a record net
attributable profit of EUR 811 million, 28.9% more than
in 2009.

Lending rose 11% to EUR 63,342 million, thanks to strong
commercial activity and integration of the new credit portfolios                                     Branch of Santander Consumer Bank in Austria
in Poland and the US. Deposits increased 16% to EUR 25,950
million.

The efficiency ratio remained at 27.5%, one of the best in its     LENDING BY COUNTRIES
sector, while the non-performing loan ratio reached a turning      %
point and dropped to 4.95%.                                                                           Germany 32%


Santander Consumer USA’s profit was EUR 255 million, spurred
by a sharp rise in lending. The Nordic countries and the UK also        Netherlands 2%
performed well, with significant growth in profits. Santander              Austria 2%
Consumer Spain, in a very weak market, recovered its leadership          Portugal 2%
position in auto finance.                                                     UK 5%                                          US 19%


GERMANY                                                                    Poland 5%
Attributable profit was EUR 435 million, 4% of the Group’s
total. Santander Consumer is the country’s consumer finance            Nordic countries 9%
leader with a market share of 12.8%.                                                                              Spain 12%
                                                                                                 Italy 12%
The acquisition of 173 retail banking branches from the Swedish
group SEB was completed on January 31, 2011. This doubled
the number of Santander’s branches in Germany to 315 and
added more than one million customers.                             LENDING BY SEGMENTS
                                                                   %
OTHER ACQUISITIONS AND INTEGRATIONS                                                            Cars – new 27%
In Poland, approval was given to merge Santander Consumer
Bank and AIG Bank Polska. This transaction increased the
number of Santander Consumer branches in this country to 213.              Credit cards
                                                                                   2%

Santander Consumer USA acquired consumer finance portfolios         Stock Finance 4%
from HSBC and Citi amounting to $7,500 million. An agreement               Others 6%                                        Cars- second hand
was also reached to manage the servicing of $7,200 million of                                                               35%
                                                                   Electrical household
third party funds.                                                            appliances
                                                                                    5%
                                                                            Mortgages 6%

                                                                                             Direct businesses 15%


     ANNUAL REPORT 2010                                                                                                                       37
UNITED KINGDOM


Santander UK posted net attributable profit of EUR 1,985 million,
carried out strong commercial activity and brought all its businesses under
the Santander brand


Santander UK has 1,416 branches serving its 25.6 million      Santander UK generated attributable profit of £1,701 million,
customers. It is the UK’s second largest bank by deposits,    10.7% more than in 2009. Its contribution to the Group’s total
number of branches and mortgages. It completed in 2010 the    profit increased from 16% to 18%.
technological integration and rebranding of the former
branches of Abbey, Alliance & Leicester and Bradford &        The drivers behind the good results were gross income (+3.7%),
Bingley. For the third year running, the magazine Euromoney   strict control of costs, savings and synergies from the integration
named Santander the best bank in the UK, while The Banker     of businesses and a prudent risk policy. The efficiency ratio was
did so for the second time.                                   below 40% (39.4%), one of the best among British banks (the
                                                              average is around 50%) and the non-performing loan ratio was
                                                              1.76%, only 5 b.p. more than in 2009.


                                                              ATTRIBUTABLE PROFIT                                     + 15.0%*
                                                              Million euros
                                                                                                    1.985
                                                                                            1.726


                                                                                          2009 2010
                                                                                      * In sterling: +10.7%


                                                              UNITED KINGDOM
                                                              Customers (million)                                                   25.6
                                                              Branches (number)                                                    1,416
                                                              Employees (number)                                              23,649
                                                              Customer loans*                                                233,856
                                                              Managed customer funds*                                        271,386
                                                              Net operating income*                                                3,567
                                                              Attributable profit*                                                 1,985
                                                              Efficiency (%)                                                        39.4

                                                              (*) Million euros


38                                                                                                            ANNUAL REPORT 2010
BUSINESS STRENGTH                                                 CUSTOMER-FOCUSED
In an environment of low economic and financial activity,         One of the main objectives of Santander UK is to increase
Santander UK was characterised by its business growth.            customer loyalty by offering high value-added products.
                                                                  One of them is the Santander Zero Account, 194,000 of which
The stock of mortgages rose 3% to £166,000 million. Santander     were opened, which waives various service fees for costumers
UK’s market share of new mortgage lending in 2010 was 18%,        with a mortgage. This offer will be extended to customers with
compared to a 14% share for the total stock of its mortgages.     savings accounts as of 2011. Other products are the Zero Credit
Loans to SMEs grew 26%, underscoring Santander UK’s drive         Card and the Loyalty Tracker Bond.
to support the recovery of the UK economy.
                                                                  Santander UK announced in 2010 that, in order to raise its
This growth in lending was done prudently: new mortgages          service quality levels, it would hire 1,000 people to strengthen
had an average loan-to-value of 63%; personal loans were only     customer attention in its branches and would begin to provide
granted to existing customers with a good history of payment      again its call centre service from the UK (provided from India
(these loans fell 24%) and credit growth went hand-in-hand        before). All of this in the framework of an integral plan to make
with a notable rise in managed customer funds.                    Santander UK one of the best banks in terms of customer
                                                                  satisfaction.
Retail deposits rose 7% to £153,500 million. Around one million
current accounts were opened in 2010 for the second straight      BUSINESS INTEGRATION AND EXPANSION
year. Total managed customer funds increased 7% to £233,600       Santander UK integrated during 2010 its three commercial
million.                                                          networks – Abbey, Alliance & Leicester and Bradford & Bingley –
                                                                  under the Santander brand. The technological integration was
                                                                  completed in record time and will enable Santander’s customers
                                                                  in the UK to benefit from access to more than 1,400 branches.

                                                                  Santander UK continued to increase its distribution capacity
                                                                  with the acquisition of 88 branches from Halifax and an
                                                                  agreement with Royal Bank of Scotland to purchase 311 RBS
                                                                  branches in England and Wales and seven NatWest branches
                                                                  in Scotland.


GROSS INCOME AND COSTS (*)                                        EFFICIENCY RATIO
                                                                                                                        – 1.4 p.p.
                                 +7.7


%                                                                 (with amortisations) %


                                                                               40.8
                                        +3.8


                                                                                                                     39.4


                     Gross income Costs
                                                                               2009                                 2010

             (*) Gross income in sterling +3.7% and costs -0.1%


                                                                                                           Santander branch in London, UK


     ANNUAL REPORT 2010                                                                                                               39
LATIN AMERICA


Santander posted net attributable profit of EUR 4,804 million and
consolidated itself as the leading financial franchise in Latin America


The Group has leadership positions in the most dynamic and                         Santander remained committed to the region’s “bankarisation”
solid economies such as Brazil, Mexico, Chile and Argentina,                       and development. The pace of lending continued to quicken
with an overall market share in the region of 10%. Latin                           and reached 15% at the end of 2010, spurred by Brazil, Mexico
America contributes 43% of the Group’s total profits and is                        and Chile. Santander’s market share of loans in the countries
one of the main drivers of Santander’s growth.                                     where it operates is 11.5%.

The Latin American economy recovered strongly in 2010 from                         Under the slogan “Crecer con cliente” the three-year “América
the global financial crisis and, along with Asia, was one of the                   20.13” plan was launched to drive greater growth in revenues
engines of global growth. This recovery was not based solely                       through a larger, more linked and more satisfied customer base.
on a pick up in external demand, but also on the strength
of domestic demand, job creation and an upturn in lending.

Santander has 5,882 branches and 27,550 ATMs for its 40
million customers. The focus of the Group’s commercial strategy
in 2010 was to increase transactional business of corporate
clients and institutions, raise the linkage of medium and high
income segments through the capturing of payroll cheques and
a greater emphasis on attracting customer funds.


ATTRIBUTABLE PROFIT                                                                CUSTOMER LOANS
Million euros                                                       + 25.3%*       Billion euros                                                           + 30.0%*
                                                                                                                                  127
                                         4,804
                                 3,833


                                                                                                                           98


                               2009 2010                                                                                 2009 2010

               (*) Excluding the exchange-rate impact:+10.5%                                             (*) Excluding the exchange-rate impact: +14.7%.


LATIN AMERICA                                      Brazil      Mexico    Chile   Argentina   Uruguay         Colombia Puerto Rico          Peru        Rest        Total

Customers (million)                                 24.7          9.1      3.1       2.3           0.2           0.3            0.5         0.1            0.1      40.3
Branches (number)                                  3,702        1,100     504       324             43            76            121           1            11      5,882
Employees (number)                                53,900       12,500   11,595    6,466            817        1,343         1,820           41       1,044        89,526
Customer loans*                                   71,027       15,156   25,732    3,914       1,013           1,935         4,066          421       4,005       127,268
Managed customer funds*                          137,931       31,622   30,674    5,478       2,468           2,880         8,790          357     15,888        236,087
Net operating income*                              9,037        1,458    1,311      454             76            75            186         11         198        12,805
Attributable profit*                               2,836         682      683       297             67            41             38           7        153         4,804
Efficiency (%)                                      37.0         38.7     36.0     45.1        55.1             59.9         48.7         36.6        54.3          38.4

(*) Million euros


40                                                                                                                                          ANNUAL REPORT 2010
Santander Brazil’s net attributable profit of EUR 2,836 million represented
25% of the Group’s total. The Bank consolidated its position as the country’s
third largest private sector financial institution, with 3,702 branches and 25
million customers

BRAZIL
Santander Brazil carried out its business in 2010 in a favourable
economic environment, as Brazil was one of the economies that
best and most quickly overcame the international crisis. In the
last few years, Brazil’s GDP growth rates have been more than
double those of the main developed economies. Growth in
2010 was 7,5%.

Macroeconomic stability enabled the country to combine high
growth with a shrinking budget deficit and external debt. The
process of “bankarisation” continued, well anchored in the
country’s economic and financial stability, sustained growth and
development of the middle classes.

Santander has invested more than $27,000 million in the last 10
years in Brazil, underscoring its long-term commitment to the
country and making it one of the main foreign investors in
Brazil.

ACTIVITY AND RESULTS
Lending increased 16%. Credit to individual customers rose 18%
and to companies 22%. Such growth is contributing to the
country’s “bankarisation.”

Savings, including mutual funds and deposits, grew 6% in 2010
(demand deposits +16% and mutual funds +12%).

Santander Brazil’s market share of loans is 10.8% (11.5% in
unrestricted lending) and 8.8% in deposits.

The good performance of revenues and costs kept the efficiency
ratio at 37%, while credit quality improved. The non-performing
loan ratio declined to 4.91% from 5.27% in 2009.

In local currency, the Group’s attributable profit increased
10.4% and in terms of continued operations (i.e. excluding the      Torre Santander where 4,500 Santander employees work in São Paulo, Brazil.
minority interests of Santander Brazil after its IPO in October
2009) it was 24.4% higher.


     ANNUAL REPORT 2010                                                                                                                          41
Latin America - Brazil


INTEGRATION OF SANTANDER AND BANCO REAL                                  At the beginning of 2011, the IT platforms of Santander and
The Bank dedicated a large part of its efforts in 2010 to                Real were already integrated, enabling the Group’s 25 million
integrating Santander and Banco Real by implementing the best            customers to access any of Santander’s 3,702 branches.
operational and commercial practices of the two banks and
unifying the brand and the IT platform.                                  Santander aims to become the best bank in Brazil for customer
                                                                         satisfaction, shareholder remuneration, the best bank to work
Right from the first moment of integration, the customers of             for and to have the best corporate reputation in Brazil. The plan
both networks benefited from the best products and services              also includes commitment to grow organically, with the
of each bank, such as “SantanderMaster”, which provides 10               opening of 600 new branches over the next three years.
days of commission-free overdraft and can reduce interest
payments for this item by half; the “Santander Van Gogh”                 Investors from Qatar invested $2,819 million in Banco Santander
spaces in branches with special services for high income                 Brazil in 2010 ($2,719 million by Qatar Holding) through a
customers; the Flex credit cards with five extra days without            subscription of a bond issue which will be exchanged for shares
interest; the “SuperGiro Premium” credit lines to optimise the           in Banco Santander Brazil within three years. This will make
cash flow of SMEs and the “Cuenta Integrada”, also for SMEs              Qatar Holding the owner of a 5% stake in Banco Santander
with point-of-sale terminal to receive credit card payments.             Brazil and enables Banco Santander Brazil to advance in its
                                                                         objective of listing 25% of its capital.
The brand was unified in the last part of the year, with the
incorporation of the logo and Santander’s corporate identity
to Real’s branches and points of customer attention.


ATTRIBUTABLE PROFIT
Million euros
                                                              + 30.9%*   CUSTOMERS
                                                                         Million
                                                                                                                                    + 2.3 mill.
                                           2,836


                                                                                                             24.7
                                                                                                      22.4
                                   2,167


                                 2009 2010                                                           2009 2010
                (*) Excluding the exchange-rate impact: + 10.4%


                                                                                                                    Santander branch in São Paulo, Brazil


42                                                                                                                        ANNUAL REPORT 2010
Advertising of the Santander Libertadores Cup


MEXICO                                                               ARGENTINA
Santander Mexico is the country’s third largest financial group,     Santander Río is a leading franchise with 2.3 million customers
with a market share of 13.5% in loans and 15.1% in bank              and market shares of around 10% in loans and bank savings. It
savings. It has 1,100 branches for its 9.1 million customers. The    generated an attributable profit of $393 million, with a very
magazine Euromoney named it the best bank in Mexico in 2010.         positive performance of all items of the income statement.

Attributable profit was $902 million, 6% of the Group’s total. In    During 2010, 17 branches and all the retail businesses of BNP
local currency, profit growth was 22.7%. The drivers were active     Paribas Argentina were incorporated, strengthening Santander’s
management of spreads on loans and deposits, appropriate             presence in Buenos Aires. Santander will open 50 new branches
management of commissions, control of costs and a focus on           by the end of 2011, most of them in the interior of Argentina.
loans in default, which reduced the requirement for provisions.

Grupo Santander increased its investment in Mexico by $2,500         OTHER COUNTRIES
million by acquiring Bank of America’s 25% stake in Santander
Mexico. After this transaction, and taking into consideration the    Santander Uruguay is the country’s largest private sector bank
country’s good growth prospects, a three-year organic growth         by business volumes and branches. It has a market share of
plan was launched, based on retail banking, linkage of current       17.1% in loans and 16.7% in bank savings and 43 branches.
customers and attracting new ones.                                   The strategy in 2010 centred on linking individual customers
                                                                     and providing special attention to the tailored high-income
                                                                     customer attention model. Greater linkage of SMEs and
CHILE                                                                companies was also sought, fostering greater use of
                                                                     transaction products.
Santander Chile is the leading financial group by total assets and
profits, with market shares of 20.9% in loans and 17.6% in           In Colombia, Santander focused its business on linkage of
bank savings. Attributable profit was $904 million, the efficiency   high and medium income customers and on strengthening
ratio 36.0% and ROE 30.5%.                                           transaction businesses and insurance. The market share in
                                                                     loans was 2.9% and in bank savings 2.8%, respectively.
The strategy in 2010 was to return to business growth, fuelled
again by the development of retail banking and contributing          In Puerto Rico, the Bank continued to be one of the three
to greater “bankarisation.” This was accompanied by improved         main financial institutions by loans, deposits and mutual funds.
levels of customer linkage and the sale of products, particularly    Its positive return makes it stand out from the market, thanks
cards, insurance and mutual funds. Following the earthquake          to appropriate management of prices, discipline in risk and strict
that rocked Chile on February 27, 2010, Santander was one of         control of costs.
the country’s most active companies in supporting its customers
from the very first day after the disaster as well as in the         Activity in Peru centres on companies and tending to the
subsequent reconstruction.                                           Group’s global clients.


     ANNUAL REPORT 2010                                                                                                                       43
UNITED STATES-SOVEREIGN


Sovereign generated net attributable profit of EUR 424 million
and continued to make progress in its integration


Santander conducts retail banking in the US via Sovereign                                 SOVEREIGN: ATTRIBUTABLE PROFIT


                                                                                                                                                                     178
Bank, which has 721 branches, 2,337 ATMs and more than                                    US$ million
8,600 employees serving 1.7 million customers.


                                                                                                                                                               157
                                                                                                                                                      132
Grupo Santander also has consumer finance businesses in the


                                                                                                                                                95
US via Santander Consumer Finance USA1 and has a wholesale
banking office in New York1.

Sovereign is based in Boston and focuses its activity on the US


                                                                                                                                            4
northeast, one of the country’s strongest regions. It has a
noteworthy presence in New York, Massachusetts, Pennsylvania,


                                                                                                                                       -4
                                                                                                                                 -10
Rhode Island, New Hampshire, Connecticut, New Jersey and
Maryland.
                                                                                                                    -25


                                                                                                              Q1’09 Q2’09 Q3’09 Q4’09 Q1’10 Q2’10 Q3’10 Q4’10
When Santander completed the acquisition of Sovereign in
2009, this bank had made a loss during three consecutive years.                            GROSS INCOME AND COSTS*                              EFFICIENCY                 – 15.7 p.p.
Since then the bank’s management has concentrated on                                       US$                                                  RATIO
restoring stability and profitability to commercial business.                                                                                   (with amortisations)
This was achieved in record time; in the fourth quarter of 2009,                                                                                %
less than a year after the acquisition, Sovereign made a profit,
                                                                                                                +26.5


which has increased in every quarter since then.


                                                                                                                                                      60.2


                                                                                                                                                                                44.5
                                                                                                                          -8.1


                                                                                                 Gross income Cost                                     2009                    2010
                                                                                                 (*) On a like-for-like basic


UNITED STATES - SOVEREIGN
Customers (million)                                                                1.7
Branches (number)                                                                 721
Employees (number)                                                              8,647
Customer loans*                                                               36,724
Managed customer funds*                                                       36,763
Net operating income*                                                           1,169
Attributable profit*                                                              424
Efficiency (%)                                                                   44.5

(*) Million euros

1. The results of these businesses are recorded within Santander Consumer Finance and the Global Wholesale Banking division, respectively.


44                                                                                                                                                          ANNUAL REPORT 2010
Branch of Sovereign in Federal Street, Boston, United States


RESULTS IN 2010                                                       ACTIVITY
Sovereign posted attributable profit of $561 million compared         Sovereign continued to optimise its balance sheet and
to a loss of $35 million in 2009.                                     increasing its returns on loans and funds.

These results were supported by solid growth in gross income          New lending grew 13% and the average spread on loans rose
(+26.5%), driven by net interest income as a result of the            28 b.p., in line with the higher cost of liquidity and a stricter risk
repricing of loans and a lower cost of deposits.                      policy. This growth in credit was centred on the more attractive
                                                                      business segments such as residential and multifamily.
Operating costs fell 8.1%, in line with the strategy of cost saving
and generation of synergies derived from Sovereign’s                  The profitability of business banking increased as a result of
integration into Grupo Santander. The efficiency ratio continued      campaigns to increase the degree of linkage of these clients,
to improve quickly to 44.5% in 2010 (down from 74.5% at the           while continuing to reduce the portfolio of higher risk loans.
time of the acquisition).
                                                                      One of the main strategies undertaken during 2010 was Better
Net loan-loss provisions continued to decline and in the fourth       Banking, which aims to drive retail banking by offering better
quarter of 2010 reached their lowest level in the last two years,     products; grouping marketing campaigns in order to obtain
thanks to prudent risk management and the effort made to              greater visibility, attract a larger number of customers and push
recover loans in default. The non-performing loan ratio dropped       commercial actions via incentives for branch employees.
to 4.61% from 5.35% and coverage rose from 62% to 75%.

SOVEREIGN, A BANK IN TRANSFORMATION
The process of transforming Sovereign began immediately after
it was acquired, adopting the business model, organisational
structures and the policies and models of Grupo Santander.
In the first phase, the focus was on stabilising the income
statement, through normalising risk and cost policies. At the
same time, a deeper process of change was begun to streamline
the retail banking model, focusing it mainly on individuals and
SMEs and eliminating or reducing the least profitable business
lines.

This process of transformation will continue in 2011 with
installation of the corporate IT platform Partenón, which will
help to achieve additional synergies in costs and prepare the
Bank for its commercial relaunch.


                                                                                         Branch of Sovereign in Burlington, Massachusetts, United States


     ANNUAL REPORT 2010                                                                                                                               45
GLOBAL BUSINESSES


Banco Santander has global                                             GLOBAL WHOLESALE BANKING
businesses that operate in an                                          Santander Global Banking & Markets provides products and
integrated way with local retail                                       services to satisfy the financial needs of large corporations and
                                                                       institutional investors in 21 countries. It has local and global
franchises                                                             teams (2,638 employees) with deep knowledge about their
                                                                       markets. Tailored solutions cover all financing, investment and
                                                                       hedging needs.


       Business is structured around six areas:

       1. Global transaction banking                                   4. Rates
          Embraces cash management (services associated                   Cover all trading activities in financial markets
          with making and receiving payments and commercial               involving interest and exchange rates.
          financing), trade finance and basic financing for
          institutions and corporations with an international          5. Global equities
          presence.                                                       Involves all businesses related to the equity markets.

       2. Corporate and investment banking                             6. Market making
          Integrates hedging at the global level of financial             Manages the Group’s short and long-term positions
          institutions and large corporations, as well as M&A             in various fixed-income and equity markets.
          and asset and capital structuring teams.

       3. Credit markets
          Groups origination and distribution units for all
          structured credit and debt products.


GLOBAL WHOLESALE BANKING                                               ATTRIBUTABLE PROFIT                                                   – 1.8%
Million euros                                                          Million euros
                                                                                                                     2,698 (1)


Customer loans                                                69,179
                                                                                                             2,748


Customer deposits                                             83,689
Net operating income                                           4,027
Attributable profit                                            2,698
Efficiency (%)                                                  26.9


                                                                                                           2009 2010
                                                                       (1) EUR 2,733 million before the impact of applying Bank of Spain circular 3/2010 (-0.5%)


46                                                                                                                               ANNUAL REPORT 2010
Santander Global Banking & Markets posted net attributable profit
of EUR 2,698 million in 2010, 1.8% less than in 2009


BUSINESS IN 2010                                                        LARGE TRANSACTIONS IN 2010
Santander Global Banking & Markets generated attributable               Santander Global Banking & Markets participated in the year’s
profit of EUR 2,698 million, 24% of the Group’s total operating         largest transactions, covering the needs of its clients in Europe
areas and 1.8% lower than in 2009. Given that 2009 was an               and the Americas. Some examples of this are:
exceptional year with record revenues and profits for this type
                                                                        • Santander was the bookrunner in the largest equity issue
of business because of a highly favourable competitive
                                                                          in the world by the Brazilian oil company Petrobras.
environment, the performance in 2010 was noteworthy.
Santander Global Banking & Markets consolidated in 2010 its             • Santander advised Brisa, the largest manager of motorway
market share and results attained in prior years in a still difficult     concessions in Portugal, on selling its 16.35% stake in Brazil’s
market context.                                                           CCR and placing the rest in the market. This was the largest
                                                                          infrastructure operation in Brazil in 2010.
This positive performance was backed by a customer-focused
                                                                        • Santander Global Banking & Markets was the global
business model, the division’s global scope and its
                                                                          coordinator for the international tranche of the IPO of OHL
interconnection with local units. Other factors were strict
                                                                          Mexico in November, the largest in the Mexican market in
control of risk and the strength of the Group’s capital and
                                                                          the last 10 years ($458 million).
liquidity.
                                                                        • Copec, Chile’s main distributor of fuel and lubricants, acquired
The Global Relationship Model, which unifies management                   Terpel, the Colombian leader in this sector, for $240 million.
of 775 corporations and 158 institutions in the global sphere,            Santander Global Banking & Markets was the sole advisor
continued to be deepened in 2010. This focus on client                    of Copec, the largest merger and acquisition in Chile in 2010.
revenues, which increased 3%, makes Santander’s wholesale
banking business less dependent on the evolution of markets
than its competitors.

To reinforce its leadership positions in its core markets, Santander
Global Banking & Markets made additional investments in 2010
in resources and capacities. This, combined with strict
management of costs, enabled it to maintain an efficiency ratio
of 26.9%, which continues to be the benchmark for its
competitors.


GROSS INCOME BY BUSINESS SEGMENT                                        GROSS INCOME BY GEOGRAPHIC AREA
% of the total                                                          %

                         Transaction banking 27%
                                                                                                                     Europe 50%
                                                                                     US 3%
                                                   Corporate and
                                                   investment banking         Mexico 8%
          Treasury                                 3%
     and portfolios
             14%                                      Credit 19%


                                                                                                                     Rest 5%
          Equities 15%
                                                                                       Brazil 31%
                                                                                                                Chile 4%
                                         Interest rates
                                         and exchange rates
                                         22%


      ANNUAL REPORT 2010                                                                                                                    47
ASSET MANAGEMENT                                                     GLOBAL PRIVATE BANKING
Santander Asset Management covers Grupo Santander’s                  The Global Banking division includes companies specialised
asset management activities and offers a broad range                 in financial advice and wealth management for Grupo
of savings and investment products to meet the needs of              Santander’s high income clients.
clients, distributed globally by all the Group’s networks.
                                                                     It conducts its business in Europe via:
Its activity revolves around three business areas:
                                                                     • Banif in Spain.
• Santander Asset Management for mutual and pension funds,
                                                                     • Santander Private Banking in Switzerland and Italy, Santander
  investment companies and discretional portfolios.
                                                                       Totta in Portugal and Santander Private Banking UK and
• Santander Real Estate, which manages investment products.            Abbey International in the UK.
• Santander Private Equity for venture capital.
                                                                     In the Americas, Santander Private Banking operates in the US,
                                                                     Brazil, Chile and Mexico.
The customer advisory model, based on excellence in the quality
of products and their diversification and transparency in the
                                                                     All Funds Bank, the leader in distributing third party funds,
service and information provided, was enriched in 2010.
                                                                     operates in Spain, Italy, the UK and Latin America.
Santander Asset Management launched in 2010 a new global
                                                                     The Global Private Banking unit achieved the following in 2010:
structure to facilitate the identification of synergies between
countries and which will enable a global management model to         • The corporate IT platform was successfully installed in Spain,
be developed and increase the value-added for customers.               Italy and Mexico and work began in Brazil.
The range of funds continued to be streamlined and merged
                                                                     • In Spain, Banif occupies leadership positions in the private
in order to supply the Group’s units with simple and easy to
                                                                       banking sector.
understand products with high average volumes.
                                                                     • In the UK, the Global Private Banking project entered into
Grupo Santander decided, for solely commercial reasons,                force in Santander UK.
to contribute funds to the Santander Banif Inmobiliario
                                                                     • In Italy, the portfolio of clients of Meliorbanca, the private
investment fund by subscribing to new units and granting
                                                                       banking unit of Banca Emilia Romagna, was acquired.
a two-year liquidity guarantee in order to meet the
reimbursements of participants who so desire it. As a result
of this measure, the suspension of reimbursements was lifted
and the fund is now operating normally.


ASSET MANAGEMENT                                                     GLOBAL PRIVATE BANKING
Million euros                                                        Million euros
Managed assets                                          124,475      Managed assets                                                  97,888
Gross income                                                   292   Gross income                                                       796
Attributable profit                                             81   Attributable profit                                                283
Efficiency (%)                                               55.8    Efficiency (%)                                                     47.8


48                                                                                                                ANNUAL REPORT 2010
Santander- Ferrari card


INSURANCE                                                             MEANS OF PAYMENT
Santander Insurance conducts its business through networks            Santander Cards covers all businesses related to means of
in all the countries where the Group operates. It provides            payment, in order to offer customers the credit and debit
protection for more than 14 million customers.                        cards that best meet their needs. It also supplies point-of-sale
                                                                      terminals for shops. The division manages 83 million cards.
Its strategy is based on covering simple risks and insurance
savings for individuals and households through 14,082 Grupo           This unit operates in 11 mature and emerging countries,
Santander branches throughout the world and alternative               which helps to diversify its business. Its strategy is based on
channels such as the telephone and Internet.                          a global business model, which contributes best practices and
                                                                      methodologies and respects the commercial autonomy of
Total revenues from insurance (gross income + commissions             countries and their knowledge of the market.
received by networks) amounted to EUR 2,688 million, 11%
more than in 2009.                                                    In 2010, the division generated gross income of EUR 3,562
                                                                      million (+10%), in a year of business growth and consolidation
Activity in 2010 centred on:                                          with good risk evolution. A factor at play here was the success
                                                                      of the integrations in Brazil and the UK, which produced
• Consolidating the integration of insurance businesses in Brazil,
                                                                      significant synergies.
  the country that generates the most revenues.
• Accompanying the Group’s strategy in management of                  The main achievements of Santander Cards in 2010 were:
  financial savings through competitive products.
                                                                      • The launch of the first Santander-Ferrari credit card in Spain,
• Improving coverage for consumer finance customers in                  Brazil, Mexico and Portugal with significant success in sales
  Europe.                                                               (in Spain more than 100,000 sold in the first six weeks).
                                                                      • Launch of the acquiring business in Brazil, which will
Banco Santander and the insurer Zurich Financial Services Group
                                                                        accelerate the Bank’s strategy with this country’s SMEs.
reached an agreement in early 2011 to form a strategic alliance
that will jointly develop the bancassurance business in Brazil,
Chile, Mexico, Argentina and Uruguay over the next 25 years.

Under the agreement, Santander will group its insurance firms
in Latin American countries into a holding 51% owned by
Zurich, while Santander will own 49% and receive 100% of the
revenues from commissions on the distribution of products via
the Group’s 5,600 branches in these markets, which will have
a broader and more innovative range of products. Santander
aims to increase its revenues from the distribution of insurance
products in these countries ($972 million in 2010).

The transaction values the insurance business of Grupo
Santander, which is the subject of the transaction, at $3,275
million and will generate capital gains of $1,210 million.
They will be used to strengthen the balance sheet.


INSURANCE                                                             MEANS OF PAYMENT 1
Million euros
Contribution to the Group: profit before tax + commissions   2,491    Total number of credit cards (million)                                                        56
Gross income                                                    790   Total number of debit cards (million)                                                         27
Attributable profit                                             381   Lending (million euros)                                                                    13,490
                                                                      Gross income (million euros)                                                                3,562
                                                                      1. Perimeter of retail banks excluding Banesto, Santander Consumer Finance and Open Bank


      ANNUAL REPORT 2010                                                                                                                                             49
CORPORATE SOCIAL
RESPONSIBILITY

Sustainability, for Banco Santander, means contributing through its activity
to economic and social progress and taking into account the impact of its
business on the environment


Banco Santander business activity contributes to the economic         Sustainability, for Santander, also means knowing how to
progress of local communities, bearing in mind the impact of          respond at each moment to the real needs of stakeholders:
its activity on society and on the environment. The international
                                                                      • shareholders, with maximum transparency in information,
market values and recognises this management. The Santander
                                                                        through channels of continuous and fluid dialogue and
share is present in the world’s main sustainability indexes, the
                                                                        fostering their participation;
DJSI and the FTSE4Good.
                                                                      • customers, offering them the best products and services;
Santander held meetings in 2010 with more than 50 investors
                                                                      • employees, with training and development policies, fostering
and analysts interested in knowing in detail Banco Santander’s
                                                                        equality of opportunity and reconciling work and family life;
sustainability strategy.
                                                                      • suppliers, with transparency in the contract awarding
The sustainability committee is responsible for drawing up the          processes.
Group’s social responsibility strategy which is submitted for the
board’s approval. The committee is chaired by the CEO and             Santander’s activities in this area are always guided by a special
comprises various business and support areas. It meets every six      interest in society and the environment.
months.

At its last meetings, this committee approved significant
strategic projects such as the energy efficiency plan,
the financial education project and the corporate volunteering
programme. It also adopted other important decisions such
as the adherence by Santander Pensiones to the principles of
socially responsible investment and the approval of the
corporate policy on human rights. All of this, together with the
significant role of Santander Brazil and Santander UK as two key      The Bank’s main corporate social responsibility activities
countries for the dissemination of best practices in sustainability   are set out in the Sustainability Report, which is available at
within the Group, enabled Santander to make decisive progress         www.santander.com
and remain one of the leaders in this sphere.


                                                                                     El Bosque, Grupo Santander City, Boadilla del Monte, Madrid, Spain


50                                                                                                                       ANNUAL REPORT 2010
Investment in higher education is the centrepiece
of the Bank’s corporate social responsibility policy


SANTANDER UNIVERSITIES
GLOBAL DIVISION
Investment in higher education is the centrepiece of the
                                                                     938
corporate social responsibility strategy of the Bank, as it is       co-operation agreements with universities
convinced that this is the best way to contribute to the             in 15 countries on four continents
economic and social development of the countries in which it
operates.

The Santander Universities global division, with a team of 2,047
professionals in 14 countries, coordinates and manages Banco
Santander’s commitment to higher education. Its long-term
                                                                     4,629,655
strategic alliance with universities forged over the last 13 years   intelligent university cards
is unique in the world. Banco Santander’s contribution to            in 201 universities
co-operation projects with universities amounted to more than
EUR 100 million in 2010.

Santander co-operates with universities in launching projects
to improve education, internationalisation, geographic mobility,
innovation and the transfer of knowledge to society. The Bank
has agreements with universities in Spain, Portugal, the UK,
                                                                     13,352
Brazil, Mexico, Chile, Argentina, Colombia, Singapore, Puerto        scholarships and aid for study granted in 2010
Rico, Uruguay, the US, China and Russia.

Banco Santander’s co-operation with universities revolves
around the following four pillars:
• Integral cooperation agreements, which put into effect in
  2010 4,149 academic, financial and technological projects
                                                                     1,216
  with universities.                                                 universities grouped
                                                                     in Universia
• Support for international co-operation programmes between
  universities, such as national and international travel
  programmes for students and teachers.
• Fostering co-operation with international academic networks,
  such as the Latin American University Network for the
                                                                     174,728
  Incubation of Companies (Red Emprendia).
                                                                     first jobs via Universia
• Supporting global projects, such as Universia, the largest
  online network of university co-operation in the Spanish- and
  Portuguese-speaking world, and the Miguel de Cervantes
  Virtual Library, the portal with the largest digitalisation of
  Hispanic culture.


     ANNUAL REPORT 2010                                                                                               51
Corporate social responsibility


SANTANDER UNIVERSITIES IN 2010
The main developments in 2010 were:
• The holding of the second meeting of Universia rectors in
  Guadalajara, Mexico, which, with the participation of 1,000
  rectors from 23 countries, gave a decisive push to the Latin
  American Knowledge Space. In this framework, Mr Emilio
  Botín announced Banco Santander’s commitment to invest
  EUR 600 million in 2011-2015 in co-operation projects with
  universities.
• 25 new scholarship programmes were launched, enabling
  2,000 universities to benefit from them. The Santander
  Fórmula programme, the Top Brazil, Top UK and Top USA
  programmes and the ITACA scholarships are examples of
  this co-operation.
• Consolidation of activity in Brazil and Mexico and more
  co-operation with universities in the UK, the US and Singapore
  (these three countries account for 8% of the universities with                 The second meeting of Universia rectors, May 2010, Guadalajara, Mexico
  agreements).
• Strong support to disseminate the Spanish language in                 Santander is firmly committed
  co-operation with the Cervantes Institute, the Real Academia
  de la Lengua and the Fundación Campus Comillas.
                                                                        to investing EUR 600 million
• Publication of the book “La Universidad: una historia ilustrada”      in 2011-2015 in co-operation
  with the participation of 45 authors from 17 countries.               projects with universities
• 174,728 university students obtained their first job via
  Universia in 2010.

In 2011, Santander Universities will strengthen dissemination
of its commitment to universities to all society. It will step up its
co-operation by incorporating German universities to its
network of agreements. It will also put into effect new
Santander scholarship programmes for students studying for
a bachelor’s degree and scholarships for young researchers.
Moreover, It will launch new scholarship programmes to prevent
the abandonment of university studies, foster international travel
by young postgraduate students and researchers and boost the
exchange of students between Asia and Latin America, in
accordance with the commitment made at the second meeting
of Universia rectors.


GROWTH IN AGREEMENTS                                                    GROWTH IN CO-OPERATION PROJECTS
WITH UNIVERSITIES                                                       Number
Number
                                                                                                                             4,149
                                              938


                                                                                                                     3,340
                                        833


                                                                                                             2,820
                                  700


                                                                                                     2,507
                           623


                                                                                             2,010
                     549


                    2006 2007 2008 2009 2010                                               2006 2007 2008 2009 2010


52                                                                                                                                   ANNUAL REPORT 2010
“Pão para todos” project, Santander Totta, Portugal                                            Thousand year old olive trees at Grupo Santander City


SOCIAL ACTIONS                                                        THE ENVIRONMENT
Although the main contribution is investment in higher                Banco Santander is committed to protecting, conserving and
education via Santander Universities, Santander also carries out      recovering the environment. Its activities in this sphere are
in those countries where it operates projects tailored to social      structured around the following elements:
and local economic circumstances and in many cases employees
                                                                      • Measuring the Group’s environmental footprint and drawing
participate as volunteers.
                                                                        up an energy efficiency plan: In 2010, for the second year
                                                                        running, Santander calculated the main items consumed and
In developing these projects the Bank works closely with the
                                                                        emissions in all the Group’s buildings throughout the world in
third sector (NGOs and other non-profit making institutions)
                                                                        order to establish its environmental footprint. A tool was
with whom Santander maintains a fluid and constant dialogue.
                                                                        developed to gather, calculate and consolidate all data in
                                                                        order to standardise management and treatment of
In 2010, the Group’s sustainability committee approved a
                                                                        environmental information. At its meeting in July 2010,
corporate project for volunteering. In order to launch it, the
                                                                        the Group’s sustainability committee approved a strategic
Bank signed a co-operation agreement with UNICEF in order to
                                                                        plan for energy efficiency which set out common objectives
contribute to the schooling of children in Latin America. The co-
                                                                        for improving and reducing the consumption of items in the
operation with UNICEF will include various initiatives in which
                                                                        medium and long term. CO2 emissions are scheduled to be
the Group’s professionals in Spain, first, can participate and then
                                                                        reduced by 3% in the Group’s five main countries and the
those in other countries.
                                                                        whole Group’s energy consumption by 3%.
This initiative joins others in which Santander participates and      • Analysis of social and environmental risk in credit operations:
co-operates in the countries where it operates such as:                 Santander has a systematic global process for analysing social
                                                                        and environmental risks. The corporate units of risk are
• Brazil, with Escola de Brasil, in order to help improve state
                                                                        responsible for evaluating these types of risk in the projects
  schools. More than 2,000 volunteers from the Bank
                                                                        presented by the business areas for approval in accordance
  participate in this.
                                                                        with the Group’s policies.
• The UK, with community days when employees are involved
                                                                      • Developing financial solutions to protect the environment:
  on a voluntary basis in local charities.
                                                                        The promotion and financing of renewable energy projects
• Chile, where employees help to build homes for the poor               via various financial products enables Banco Santander to
  under the “Un techo para Chile” programme.                            maintain its leadership position in this sphere. Of particular
                                                                        note is Banco Santander’s participation in the carbon fund
                                                                        for Spanish companies (FC2E).


Banco Santander committed itself many
years ago to contribute to the cultural,
social and educational development
of the communities in which it operates


       ANNUAL REPORT 2010                                                                                                                        53
HUMAN RESOURCES


Banco Santander’s management of people is based on three pillars:
leadership with talent, knowledge and corporate culture


MANAGEMENT OF PEOPLE                                               The “Santander is you” programme aims to disseminate value
                                                                   offer, in other words all that the Group does for its professionals
Grupo Santander made further progress in 2010 in                   to generate pride in belonging to it through initiatives such
implementing its people management model, focused on               as the “Santander is you” week. The third edition was held in
attracting, developing and being committed to the best talent at   2010 with more than 300 activities related to solidarity,
the international level, in order to support the strategy and      the environment, sport, the promotion of good health and
sustainable business growth. The three pillars are:                wellbeing, which are held in the same week in all countries
                                                                   where Santander operates.
1. Leadership with talent
Santander launched various initiatives to reflect on the type of   Another initiative was the second "Santander is You" race held
leadership needed to ensure its success in the future. One of      in Chile on 3-6 November, 2010. A total of 60 employees from
them is the training programme “Leading the Group’s Growth”        all the Group's divisions, companies and countries took part in
for senior executives and whose 2010 edition revolved around       a relay race in a mountainous area between Santiago de Chile
the concept of the “responsible leader.”                           and Valparaíso under the slogan "Driven by values, Together we
                                                                   are more."
2. Knowledge
Investment in training amounted to EUR 111 million in 2010         Santander also transmits its value offer and the meaning of
(EUR 93.5 million in 2009). The total number of hours spent on     the corporate values that comprise its culture to potential
training was 7.0 million (7.7 million in 2009) and 179,000         employees via “Santander could be you”. The Group, for the
employees were involved (more than 167,000 in 2009).               second year running, visited the main business schools in the US,
                                                                   Europe and Asia in order to identify and recruit the best talent at
The corporate school of retail banking was launched in 2010 as     the international level.
part of the business knowledge school. Its purpose is to gather
and structure retail banking business knowledge, help various      Another way to identify and attract the best international talent
business teams apply this knowledge and support the process of     is the route followed by the talent scholarship programme. This
adapting and integrating new acquisitions. The governing           initiative, in its third edition, selected 33 high potential students
council of this school is chaired by Alfredo Sáenz, Banco          throughout the world and gave them a full training course
Santander’s CEO, and its members are senior executives of the      tailored to the needs of a retail bank.
Bank. This school joins other already existing: the corporate
school of risks, which in 2010 celebrated its fifth anniversary.

3. Culture
Grupo Santander is backed by a solid culture of values:
leadership, innovation, strength, dynamism, commercial focus,
ethics and sustainability. These inspire the work of Santander’s
professionals, while the mission of the human resources division
is to reinforce this culture by disseminating the values and the
advantages of working for Grupo Santander.                         EMPLOYEES
                                                                   Number
                                                                                                                178,869
                                                                                            170,961

                                                                                                      169,460


                                                                                           2008 2009 2010


54                                                                                                                        ANNUAL REPORT 2010
ADVANCES IN OTHER                                                    RECOGNITIONS
HUMAN RESOURCES POLICIES                                             Santander’s corporate culture has become a reference in
                                                                     business circles, underscored by the prizes awarded to the
Santander’s human resources policy has made progress in other
                                                                     Group in the countries where it operates.
issues, such as:
                                                                     •Santander is the first ranked bank, the second European
• The gender equality policy launched in 2009 to develop
                                                                      company and the fifth in the world in the Hay Group’s and
  female talent within the Group was consolidated. In Spain,
                                                                      Fortune’s ranking of leadership in the best companies 2010.
  149 women participated in the Alcanza plan which supports
  the careers of women. Also, under the framework of                 •“Equality in the company 2010” recognition by Spain’s
 “Avanzamos Juntos”, the following steps were taken:                   equality ministry.
  a corporate command panel was created to monitor the
                                                                     • Santander Río was first in the ranking of the best companies
  corporate gender equality policy; an online training course on
                                                                       to work for in Argentina according to Great Place to Work.
  gender quality was launched for more than 16,000 employees
  and training sessions given on gender equality as part of the      • The Ranking Merco Personas recognised Grupo Santander
  corporate programmes for the Group’s senior executives.              as the third best company to work for in Spain in 2010.
• Santander Totta (Portugal) launched "Red en Femenino",             • Santander Totta was the first company in Portugal to obtain
  a communication platform for female executives to share texts,       the responsible family company certificate from the Más
  ideas and experiences and, in the UK, the Santander Prize was        Familia Foundation.
  created under the framework of the prestigious "Opportunity
                                                                     • Santander UK was awarded in 2010 the “Be the Best” and
  Now" prizes, which foster equality of opportunity through
                                                                      “Best Boss” awards which recognise the human resources
  education and learning.
                                                                       policies as a good company to work for.
• Development and mobility: Santander offers its employees
  the opportunity to enhance their knowledge and work abroad
  for four months within their same division via the “Mundo
  Santander” programme. A total of 156 employees benefited
  from this corporate initiative in 2010, bringing the overall
  number to 347 in the three editions of the programme.
• Of note in 2010 among Santander’s many measures to look
  after the health of its employees was the signing of the
  sponsorship, with the Fundación Botín, of the PESA-CNIC
  project, led by the National Council of Cardiovascular Research.
  Thanks to this project, headed by the world renowned
  cardiologist Mr Valentín Fuster, more than 3,000 of the
  Group’s employees in Spain participated in pioneering
  research for early identification of cardiovascular risk.


     ANNUAL REPORT 2010                                                                                                               55
SANTANDER IN 2010

         JANUARY 11
         United Kingdom. The change to the
         Santander brand began in 1,000 branches
         of Abbey and Bradford & Bingley.


                                                                               MAY 31                        JUNE 9
                                                               The second meeting of            Mexico. Acquisition of
                                                             Universia rectors is held in          25% of Santander
                                                                 Guadalajara, Mexico.            Mexico from Bank of
                    JANUARY 18                                                                              America.
                    Help for Haiti. Banco Santander’s
                    executive committee donated
                    EUR 1 million.


     ENERO 2010             FEB/10                  MAR/10      ABR/10                      MAY/10             JUN/10


                                                                                    JUNE 11
                                                                                    Santander, Spain. Banco
                                                                                    Santander holds its AGM.


                       FEBRUARY 4
                       Grupo Santander City. The
                       Bank announced an
                       attributable profit of EUR
                       8,943 million in 2009.


56                                                                                               ANNUAL REPORT 2010
SEPTEMBER 10
                                             Poland. Agreement to buy
                                             Bank Zachodni WBK.


JULY 12
Germany. Santander acquires
the retail banking businesses of
the Swedish commercial
banking group SEB.

                                                                             NOVEMBER 14
                                                                             Abu Dhabi. Santander
                                                                             completes the first year of its
                                                                             alliance with the Scuderia
                                                                             Ferrari, with an advertising
                                                                             return of EUR 270 million.


JUL/10             AGO/10           SEP/10              OCT/10                    NOV/10                       DICIEMBRE 2010


 JULY 23
 Spain. Santander is among                     SEPTEMBER 15
 the best in solvency and                      Grupo Santander City. Third
 profitability in the stress test              international banking
 on European banks.                            conference held.

                                                                                            NOVEMBER 4
                                                                                            Brazil. Unification of the Santander
                                                                                            and Banco Real brands.


                   AUGUST 4
      UK. Agreement to acquire
     318 Royal Bank of Scotland
                     branches.


         ANNUAL REPORT 2010                                                                                                        57
CORPORATE GOVERNANCE REPORT


Photo Pereda Building, Grupo Santander City, Boadilla del Monte, Madrid, Spain
61   1. OWNERSHIP STRUCTURE
64   2. BANCO SANTANDER’S BOARD OF DIRECTORS
80   3. SHAREHOLDERS RIGHTS AND THE GENERAL
        SHAREHOLDERS’ MEETING
82   4. BANCO SANTANDER’S SENIOR MANAGEMENT
84   5. TRANSPARENCY AND INDEPENDENCE
86   6 UNIFIED GOOD GOVERNANCE CODE
MAIN ACTIVITIES OF THE BOARD IN 2010 ON MATTERS RESERVED THERETO


         GENERAL STRATEGIES OF THE BANK
         • During 2010, the board held twelve meetings. Two of them were devoted, as has been the practice
           every year since 2006, to solely discussing the Group’s strategy.

         DIVIDENDS
         • In 2010 the board maintained the same compensation per share as in financial year 2009, i.e.,
           0.60 euro.

         CONTROL OF ACTIVITIES AND RISK MANAGEMENT
         • During 2010, the chief executive officer submitted to the board eight management reports, and the
           third vice-chairman and head of the risk division submitted seven risk reports.
         • Each of the heads of internal and external audit reported to the board at three and two meetings,
           respectively.
         • The board analysed the business in Latin America (particularly Brazil) and in the United Kingdom,
           the Santander España and Banesto branch networks and the Group’s Asia Plan, as well as the liquidity
           of European banks and of Banco Santander and the new capital standards, BIS III.

         DIRECTOR REMUNERATION POLICY
         • In 2010, in line with the best international practices, the board submitted for the first time the report
           regarding the director remuneration policy to the shareholders at the general shareholders’ meeting
           held on 11 June, as a separate item on the agenda and as a consultative matter; 94.943% of the votes
           were in favour of the report.

         BYLAW-MANDATED PAYMENTS
         • In 2010, for the second consecutive year, the board resolved to maintain the same amounts as in the
           prior year for the annual allocation to which the board members are entitled for the performance of
           supervisory and collective decision-making duties, such that they have remained unchanged since 2008.

         REMUNERATION OF EXECUTIVE DIRECTORS
         • The board decided not to change the fixed remuneration payable to executive directors in 2011,
           with only one exception, and to increase by 10% the variable remuneration for 2010. The variable
           remuneration or bonus payable to executive directors as a whole for 2010 came to 170% of the fixed
           remuneration. In addition, the average deferred variable remuneration vis-à-vis the total variable
           remuneration of executive directors stands at 51.9%. Both parameters are within those approved by the
           board at the proposal of the appointments and remuneration committee, which were submitted to a
           consultative vote of the shareholders at the general shareholders’ meeting held on 11 June 2010.

         FINANCIAL INFORMATION PERIODICALLY PUBLISHED BY THE BANK
         • The board approved the quarterly financial information, the annual accounts, and the management
           report for 2009, in addition to other documents such as the annual report, the sustainability report,
           the Pillar III disclosures report, the annual corporate governance report, and the reports of the audit
           and compliance committee and the appointments and remuneration committee.

         APPOINTMENT OF MEMBERS OF SENIOR MANAGEMENT
         • The appointment of Ms Ana Patricia Botín-Sanz de Sautuola y O’Shea as chief executive officer
           of Santander UK and of Mr Antonio Basagoiti García-Tuñón as non-executive chairman of Banesto
           was proposed to the boards of directors of Santander UK and Banesto, respectively.
         • The executive vice president of the Bank Mr Jorge Morán Sánchez was appointed as country head
           in charge of all of the Group’s businesses in the United States of America.


60                                                                                                      ANNUAL REPORT 2010
“We have an experienced board of directors which also has a balanced
 composition of executive and non-executive directors.”
 Emilio Botín, Chairman. General shareholders’ meeting, 11 June 2010


 1. OWNERSHIP STRUCTURE

 NUMBER OF SHARES                                                                             SHAREHOLDERS’ AGREEMENTS AND
 AND SIGNIFICANT INTERESTS                                                                    OTHER SIGNIFICANT AGREEMENTS
 NUMBER OF SHARES                                                                             Section A.6 of the annual corporate governance report, which
 During financial year 2010, the Bank carried out two capital                                 forms part of the management report, contains a description of
 increases that became effective on 7 October and 2 November,                                 the shareholders’ agreement (pacto parasocial) executed in
 and pursuant to which there were issued 11,582,632 and                                       February 2006 by Mr Emilio Botín-Sanz de Sautuola y García de
 88,713,331 new shares, representing 0.139% and 1.065%,                                       los Ríos, Ms Ana Patricia Botín-Sanz de Sautuola y O’Shea,
 respectively, of the Bank’s share capital at year-end 2010.                                  Mr Emilio Botín-Sanz de Sautuola y O’Shea, Mr Francisco Javier
 The first increase was carried out in order to accommodate the                               Botín-Sanz de Sautuola y O’Shea, Simancas, S.A., Puente San
 conversion of 33,544 mandatorily convertible bonds (Valores                                  Miguel, S.A., Puentepumar, S.L., Latimer Inversiones, S.L. and
 Santander), and the second one within the framework of the                                   Cronje, S.L. Unipersonal providing for the syndication of the
 Santander Dividendo Elección (scrip dividend) programme.                                     shares of the Bank held by them or in respect of which they
                                                                                              have voting rights. Such agreement was also reported to the
 The Bank’s share capital at 31 December 2010 was represented                                 National Securities Market Commission (Comisión Nacional del
 by 8,329,122,098 shares, whose value per the listing price on                                Mercado de Valores) (CNMV) as a material fact and is described
 Spain’s Electronic Trading System (continuous market) of the                                 in the public records thereof.
 Spanish stock exchanges at such date was 66,033 million euros.

 All shares carry the same economic, voting and related rights.

 SIGNIFICANT INTERESTS
 No shareholder held significant interests (of more than 3% of
 the share capital* or interests that would permit a significant
 influence on the Bank) at 31 December 2010.

 The interests held by Chase Nominees Limited (10.24%),
 State Street Bank & Trust (9.52%), EC Nominees Ltd. (6.45%),
 The Bank of New York Mellon (5.05%), Guaranty Nominees
 Limited, (3.73%) and Société Générale (3.28%), which were the
 only ones in excess of 3%, were held by them on behalf of
 their customers. The Bank is not aware of any of them holding
 individual stakes of 3% or more of its share capital.

 Bearing in mind the current number of board members (20),
 the percentage of capital needed to exercise the right to
 appoint a director in accordance with article 243 of the Spanish
 Companies Law (Ley de Sociedades de Capital) is 5.00%.


 * Limit set by Royal Decree 1362/2007, of 19 October, for purposes of the annual corporate
   governance report.


         ANNUAL REPORT 2010                                                                                                                               61
TREASURY SHARES                                                                                         Authorisation
                                                                                                        The current authorisation for transactions in treasury shares
KEY DATA                                                                                                arises from resolution no. 5 adopted by the shareholders acting
At 31 December 2010, the Bank held 22,292,972 treasury                                                  at the general shareholders’ meeting held on 11 June 2010,
shares, representing 0.268% of its share capital; at 31                                                 item II) of which reads as follows:
December 2009, it held 2,584,249 treasury shares, representing
0.031% of the Bank’s share capital at such date.                                                       “To grant express authorisation for the Bank and the
                                                                                                        subsidiaries comprising the Group to acquire shares
The following table sets out the monthly average percentages                                            representing the capital stock of the Bank for any valuable
of treasury stock in 2010 and 2009.                                                                     consideration permitted by Law, within the limits of and
                                                                                                        subject to any legal requirements, up to a maximum limit
                                                                                                        —including the shares they already hold— of a number of
MONTHLY AVERAGE1                                                                                        shares equivalent to 10 per cent of the capital stock existing
percentages of treasury shares2                                        2010                   2009      at any given time, or to such greater percentage as may be
                                                                                                        established by Law during the effectiveness of this
January                                                                0.200                 1.195      authorisation, which shares shall be fully paid-in, at a
February                                                               0.523                 1.795      minimum price per share equal to the par value and a
March                                                                  0.335                 1.807      maximum price of up to 3 per cent over the last listing price
                                                                                                        for transactions in which the Bank does not act for its own
April                                                                  0.328                 2.820
                                                                                                        account on the Electronic Market of the Spanish Stock
May                                                                    0.603                 1.982      Exchanges (including the block market) prior to the acquisition
June                                                                   0.482                 1.250      in question. This authorization may only be exercised within
July                                                                   0.382                 0.413      five years from the date on which the general shareholders’
                                                                                                        meeting is held. The authorisation includes the acquisition
August                                                                 0.253                 0.695
                                                                                                        of shares, if any, that must be conveyed directly to the
September                                                              0.285                 0.525      employees and management of the Company, or that must
October                                                                0.360                 0.617      be conveyed as a result of the exercise of the options
November                                                               0.544                 0.496
                                                                                                        they hold.”
December                                                               0.525                 0.414      Treasury stock policy
1. Further information in this regard can be found in section A.8 of the annual corporate governance    At its meeting of 11 June 2010, the board of directors adopted
report, which forms part of the management report, and in the capital and treasury stock section of     the current resolution on treasury share policy, which is
this latter report.
                                                                                                        published on the Group’s website (www.santander.com) and
2. Monthly average of daily positions of treasury stock.
                                                                                                        which governs aspects such as the purposes thereof, persons
                                                                                                        authorised to carry out treasury share transactions, general
The transactions in treasury stock carried out by companies                                             guidelines, prices, time limits and reporting obligations.
belonging to the consolidated Group in the interest thereof
during financial year 2010 consisted of the acquisition of                                              The aforementioned policy excludes the use of treasury shares
794,732,640 shares, equal to a nominal amount of 397.4                                                  as a defensive mechanism.
million euros (actual amount of 7,372.0 million euros), and the
sale of 774,974,286 shares in the nominal amount of 387.5
million euros (actual amount of 7,169.0 million euros).

The average purchase price of shares of the Bank in financial
year 2010 was 9.28 euros per share, and the average sales price
of shares of the Bank in such financial year was 9.25 euros per
share. The effect on equity (net of taxes) generated by
transactions carried out during the financial year with shares
issued by the Bank was equal to 18 million euros worth of loss,
which was recorded in the Group’s equity section under
“Shareholders’ equity – Reserves”.


62                                                                                                                                                ANNUAL REPORT 2010
RESOLUTIONS IN EFFECT REGARDING THE POSSIBLE ISSUANCE
OF NEW SHARES OR OF BONDS CONVERTIBLE INTO SHARES
The additional authorised capital amounts to 2,038,901,430.50      2. Delegation to the board of directors of the power to issue
euros, pursuant to the authorisation of the shareholders acting       convertible and/or exchangeable fixed-income securities,
at the 19 June 2009 annual general shareholders’ meeting.             with the issuance or issuances coming to the total maximum
The period available to the Bank’s directors to carry out and         amount of 7 billion euros or the equivalent thereof in another
make capital increases up to such limit expires on 19 June 2012.      currency. The period available to the directors of the
Such resolution gives the board the power to exclude pre-             Bank within which to implement this resolution expires on
emptive rights in whole or in part, pursuant to the provisions        11 June 2015.
of article 159.2 of the Companies Law (Ley de Sociedades
                                                                   3. Capital increase by a nominal amount of 500 million euros,
Anónimas) (now, article 506 of the new Companies Law (Ley de
                                                                      with delegation to the board of directors of the broadest
Sociedades de Capital)).
                                                                      powers such that, within one year of the date on which the
                                                                      aforementioned shareholders’ meeting was held, it may set
At 31 December 2010, the aforementioned limit had not
                                                                      the date and the terms and conditions applicable to such
been used.
                                                                      increase as to all matters not provided for by the
                                                                      shareholders. If the board does not exercise the powers
In addition, the shareholders acting at the annual general
                                                                      delegated thereto within the period established by the
shareholders’ meeting held on 11 June 2010 approved the
                                                                      shareholders for implementation of this resolution, such
following resolutions in connection with the content of this
                                                                      powers shall be rescinded.
section:

1. Two share capital increases, in each case in the maximum
   amount of one thousand million euros, within the
   shareholder compensation scheme —scrip dividend—
   (Santander Dividendo Eleccción) whereby the Bank offers the
   shareholders the possibility of opting for an amount equal to
   the second and the third dividend on account of dividends for
   financial year 2010, respectively, in cash or in new shares.
  For such purposes, the Bank’s executive committee, at its
  meetings of 2 November 2010 and 1 February 2011,
  approved the implementation of the aforementioned capital
  increases with a charge to voluntary reserves from
  undistributed profits, which had in turn been approved by the
  shareholders at the general shareholders’ meeting of 11 June
  2010.
  The number of shares having a nominal value of 0.5 euro
  each which were issued in each case under the two capital
  increases by means of a scrip issue was 88,713,331 and
  111,152,906, accounting for 1.05% and 1.32% of the
  current share capital of the Bank, respectively.


     ANNUAL REPORT 2010                                                                                                            63
2. BANCO SANTANDER’S                                                                                     Mr Emilio Botín-Sanz de Sautuola y García de los Ríos
   BOARD OF DIRECTORS*                                                                                   Chairman
                                                                                                         Executive director

                                                                                                         Born in Santander (Spain) in 1934. Joined the board in 1960.
                                                                                                         Graduate in Economics and Law.
                                                                                                         Committees
                                                                                                         Executive (chairman)
                                                                                                         International (chairman)
                                                                                                         Technology, productivity and quality (chairman)


Mr Fernando de Asúa Álvarez                                                                              Mr Alfredo Sáenz Abad
First vice-chairman                                                                                      Second vice-chairman and chief executive officer
Non-executive (independent) director                                                                     Executive director

Born in Madrid (Spain) in 1932. Joined the board in 1999.                                                Born in Getxo, Biscay (Spain) in 1942. Joined the board in 1994.
Graduate in Economics, Information Technology, Business                                                  Graduate in Economics and Law.
Administration and Mathematics.
                                                                                                         Other significant positions: former chief executive officer and
Other significant positions: former chairman of IBM Spain, of                                            first vice-chairman of Banco Bilbao Vizcaya, S.A. and chairman
which he is currently honorary chairman. He is a non-executive                                           of Banco Español de Crédito, S.A. (Banesto).
vice-chairman of Técnicas Reunidas, S.A.
                                                                                                         Committees
Committees                                                                                               Executive
Executive                                                                                                International
Risk (vice-chairman)                                                                                     Technology, productivity and quality
Audit and compliance
Appointments and remuneration (chairman)
Technology, productivity and quality


Mr Matías Rodríguez Inciarte                                                                             Mr Manuel Soto Serrano
Third vice-chairman                                                                                      Fourth vice-chairman
Executive director                                                                                       Non-executive (independent) director

Born in Oviedo (Spain) in 1948. Joined the board in 1988.                                                Born in Madrid (Spain) in 1940. Joined the board in 1999.
Graduate in Economics, and Government Economist.                                                         Graduate in Economics and Business.
Other significant positions: former minister of the Presidency of                                        Other significant positions: non-executive vice-chairman
the Spanish Government (1981-1982). He is the chairman of the                                            of Indra Sistemas, S.A. and non-executive director of Cartera
Príncipe de Asturias Foundation, non-executive chairman of                                               Industrial REA, S.A. He was formerly the chairman of Arthur
Banco Santander Totta and a non-executive director of Banesto,                                           Andersen’s Global Board and a manager for EMEIA (Europe,
of Sanitas, S.A. de Seguros and of Financiera Ponferrada, S.A.,                                          Middle East, India and Africa) for the same firm.
SICAV.
                                                                                                         Committees
Committees                                                                                               Audit and compliance (charmain)
Executive                                                                                                Appointmens and remuneration
Risk (chairman)                                                                                          Technology, productivity and quality


* Unless otherwise specified, the main activity of the members of the board is that carried out at the
  Bank in their capacity as directors, whether executive or non-executive.
.


64                                                                                                                                                 ANNUAL REPORT 2010
Mr Antonio Basagoiti García-Tuñón                                      Ms Ana Patricia Botín-Sanz de Sautuola y O'Shea
Non-executive director                                                 Executive director


Born in Madrid (Spain) in 1942. Joined the board in 1999.              Born in Santander (Spain) in 1960. Joined the board in 1989.
Graduate in Law.                                                       Graduate in Economics.
Main activity: non-executive chairman of Banesto.                      Main activity: chief executive officer of Santander UK plc. She
                                                                       joined the Bank after a period at JP Morgan (1981-1988). She has
Other significant positions: former chairman of Unión Fenosa.
                                                                       been executive vice president of Banco Santander, S.A. since 1992,
He is a proprietary non-executive vice-chairman of Faes Farma,
                                                                       and was executive chairwoman of Banesto from 2002 to 2010.
S.A. and non-executive director of Pescanova, S.A.
                                                                       Other significant positions: she is a non-executive director of
Committees                                                             Assicurazioni Generali S.p.A. and a member of the International
Executive                                                              Advisory Board of the New York Stock Exchange and of the board
Risk                                                                   of Georgetown University.
Technology, productivity and quality
                                                                       Committees
                                                                       Executive
                                                                       International
                                                                       Technology, productivity and quality


Mr Guillermo de la Dehesa Romero                                       Mr Rodrigo Echenique Gordillo
Non-executive (independent) director                                   Non-executive (independent) director

Born in Madrid (Spain) in 1941. Joined the board in 2002.              Born in Madrid (Spain) in 1946. Joined the board in 1988.
Government Economist and head of office of Banco de España             Graduate in Law, and Government Attorney.
(on leave of absence).                                                 Other significant positions: former chief executive officer
Main activity: international advisor to Goldman Sachs International.   of Banco Santander, S.A. (1988-1994).
Other significant positions: former state secretary of Economy,        Committees
general secretary of Trade and chief executive officer of Banco        Executive
Pastor, S.A. He is currently a non-executive director of Campofrío     Audit and compliance
Food Group, S.A. and of Amadeus IT Holding, S.A., chairman of          Appointments and remuneration
the Centre for Economic Policy Research of London, a member            International
of the Group of Thirty of Washington, chairman of the board of
trustees of IE Business School and non-executive chairman of Aviva
Vida y Pensiones, S.A. de Seguros y Reaseguros.
Committees
Executive
Appointments and remuneration
International


Mr Antonio Escámez Torres                                              Mr Francisco Luzón López
Non-executive (independent) director                                   Executive director

Born in Alicante (Spain) in 1951. Joined the board in 1999.            Born in Cañavate, Cuenca (Spain) in 1948. Joined the board
Graduate in Law.                                                       in 1997. Graduate in Economics and Business.
Other significant positions: chairman of Fundación Banco               Other significant positions: former chairman of Argentaria and
Santander, non-executive chairman of Santander Consumer                member of the board of directors of Banco Bilbao Vizcaya, S.A.
Finance, S.A., of Open Bank, S.A. and of Arena Media                   He is a non-executive director of Industria de Diseño Textil, S.A.
Communications España, S.A., and non-executive vice-chairman           (Inditex), global vice-chairman of Universia and second vice-
of Attijariwafa Bank.                                                  chairman of the Royal Board of Trustees of the National Library.
Committees                                                             Committees
Executive                                                              Executive
Risk                                                                   International
International
Technology, productivity and quality


     ANNUAL REPORT 2010                                                                                                                 65
Banco Santander´s board


Assicurazioni Generali S.p.A.                                       Mr Javier Botín-Sanz de Sautuola y O'Shea
Non-executive director                                              Non-executive (proprietary) director

Joined the board in 1999. Represented by:                           Born in Santander (Spain) in 1973. Joined the board in 2004.
                                                                    Graduate in Law.
Mr Antoine Bernheim
Born in Paris (France) in 1924. Graduate in Law and Sciences.       Main activity: chairman and chief executive officer of JB Capital
Post-graduate degree in Private and Public Law.                     Markets, Sociedad de Valores, S.A.
Main activity: honorary chairman of Assicurazioni Generali.
Joined the board of Assicurazioni Generali in 1973, acting as
chair from 1995 to 1999 and then again from September 2002
to April 2010.
Other significant positions: he is vice-chairman of LVMH.


Lord Burns (Terence)                                                Mr Ángel Jado Becerro de Bengoa
Non-executive director                                              Non-executive (independent) director

Born in Durham (United Kingdom) in 1944. Joined the board           Born in Santander (Spain) in 1945. Appointed as director at
in 2004. Graduate in Economics.                                     the Bank’s general shareholders' meeting held on 11 June 2010.
                                                                    Graduate in Law.
Main activity: non-executive chairman of Santander UK plc
and of Alliance & Leicester plc.                                    Other significant positions: director of Banco Santander from
                                                                    1972 to 1999. He has been a director of Banco Banif, S.A. since
Other significant positions: he is non-executive chairman of
                                                                    2001.
Channel Four Television Corporation. He has been permanent
secretary of the UK Treasury, chairman of the Financial Services
and Markets Bill Joint Committee of the British Parliament,
non-executive chairman of Marks and Spencer Group plc and
of Glas Cymru Ltd (Welsh Water), and non-executive director of
British Land plc, of Legal & General Group plc and of Pearson
Group plc.


Mr Abel Matutes Juan                                                Mr Juan Rodríguez Inciarte
Non-executive (independent) director                                Executive director

Born in Ibiza (Spain) in 1941. Joined the board in 2002. Graduate   Born in Oviedo (Spain) in 1952. Member of the board since
in Law and Economics.                                               2008. Graduate in Economics. Joined the Group in 1985
Main activity: chairman of Grupo de Empresas Matutes.               as director and executive vice president of Banco Santander
                                                                    de Negocios. In 1989, he was appointed executive vice
Other significant positions: former Spanish Foreign Minister        president of Banco Santander, S.A. From 1991 to 1999 he was
and European Union Commissioner for Loans and Investment,           a director of Banco Santander, S.A.
Financial Engineering and Policy for Small and Medium-Sized
Enterprises (1989), North-South Relations, Mediterranean Policy     Other significant positions: he is vice-chairman of Santander UK
and Relations with Latin America and Asia (1989), Transport and     plc and a director of Alliance & Leicester plc and of Santander
Energy, and the Euroatom Supply Agency (1993).                      Consumer Finance, S.A.
Committees                                                          Committee
Audit and compliance                                                Risk
International


66                                                                                                             ANNUAL REPORT 2010
Mr Luis Ángel Rojo Duque                                            Ms Isabel Tocino Biscarolasaga
Non-executive (independent) director                                Non-executive (independent) director

Born in Madrid (Spain) in 1934. Joined the board in 2005.           Born in Santander (Spain) in 1949. Joined the board in 2007.
Graduate in Law, Doctor in Economics, Government Economist,
                                                                    Main activity: full professor at Universidad Complutense de
and holder of honorary doctorates from the universities of
                                                                    Madrid. Doctor in Law. She has undertaken graduate studies in
Alcalá de Henares and Alicante.
                                                                    business administration at IESE and the Harvard Business School.
Other significant positions: at the Bank of Spain he was head
                                                                    Other significant positions: former Spanish Minister for the
of the research department, deputy governor and governor.
                                                                    Environment, former chairwoman of the European Affairs
He has been a member of the governing council of the
                                                                    Committee and of the Foreign Affairs Committee of the Spanish
European Central Bank, vice-chairman of the European
                                                                    Congress and former chairwoman for Spain and Portugal and
Monetary Institute, a member of the United Nations Planning
                                                                    former vice-chairwoman for Europe of Siebel Systems. She is
and Development Committee and Treasurer of the International
                                                                    currently an elected member of the Spanish State Council
Association of Economics. He is a member of the Royal
                                                                    and a member of the Royal Academy of Doctors.
Academy of Moral and Political Sciences and of the Royal
Spanish Academy of Language.
Committees
Audit and compliance
Appointments and remuneration.


Mr Luis Alberto Salazar-Simpson Bos
Non-executive (independent) director

Born in Madrid (Spain) in 1940. Joined the board in 1999.
Graduate in Law and holder of a Degree in Treasury and Tax
Law.
Main activity: chairman of France Telecom España, S.A.
Committees
Audit and compliance
Technology, productivity and quality


Mr Ignacio Benjumea Cabeza de Vaca                                  Mr Jaime Pérez Renovales
General secretary and secretary of the board                        Deputy general secretary and deputy secretary of the board

Born in Madrid (Spain) in 1952. Joined the Group in 1987, as        Born in Madrid (Spain) in 1968. He was the head of cabinet
general secretary and secretary of the board of Banco Santander     of the second vice president of the Spanish Government and
de Negocios. He was appointed general secretary and secretary       Minister of Economy. He joined the Group in 2003 as secretary
of the board of Banco Santander, S.A. in 1994. Graduate in Law,     of the board of Banesto. In March 2009 he was appointed
ICADE-E3, and Government Attorney.                                  executive vice president of Banco Santander, deputy general
Other significant positions: he is executive vice president of      secretary and deputy secretary of the board. Graduate in Law
Banco Santander, S.A., a non-executive director of Sociedad         and Economics and Business (ICADE-E3), and Government
Rectora de la Bolsa de Valores de Madrid, S.A., Bolsas y Mercados   Attorney.
Españoles, Sociedad Holding de Mercados y Sistemas Financieros,     Other significant positions: director of Santander Seguros y
S.A. and La Unión Resinera Española, S.A.                           Reaseguros, Compañía Aseguradora, S.A.
Secretary of committees
Executive
Risk
Audit and compliance
Appointments and remuneration
International
Technology, productivity and quality


     ANNUAL REPORT 2010                                                                                                            67
RE-ELECTION OF DIRECTORS                                                                                    At the 2011 annual general shareholders’ meeting, scheduled
                                                                                                            for 16 and 17 June 2011 on first and second call, respectively,
AT THE 2011 ANNUAL GENERAL                                                                                  the re-election of the following directors will be proposed:
SHAREHOLDERS’ MEETING                                                                                       Ms Ana Patricia Botín-Sanz de Sautuola y O’Shea (executive
                                                                                                            director), Mr Rodrigo Echenique Gordillo (independent non-
Pursuant to article 55 of the Bylaws* and article 22 of the                                                 executive director), Lord Burns (non-executive director, neither
Rules and Regulations of the Board,* directors are appointed                                                proprietary nor independent) and Assicurazioni Generali S.p.A.
to five-year terms (the maximum term being six years under                                                  (non-executive director, neither proprietary nor independent),
Spanish law) and one-fifth of the board is renewed each year.                                               whose professional profiles, together with a description of their
                                                                                                            activities, appear on the preceding pages.
An amendment of the Bylaws and of the Rules and Regulations
of the Board is being contemplated in order to reduce the                                                   The re-election will be submitted separately to a vote of the
directors’ term of office to three years.                                                                   shareholders at the general shareholders’ meeting (article 21.2
                                                                                                            of the Rules and Regulations for the General Shareholders’
                                                                                                            Meeting). In view of the fact that this election practice has been
                                                                                                            followed since the 2005 annual general shareholders’ meeting,
                                                                                                            the election of all of the current directors has been submitted to
                                                                                                            a separate vote at a general shareholders’ meeting.

* The Bylaws and the Rules and Regulations of the Board of Banco Santander are published on the
Group’s website, www.santander.com.


                                                                                                                                   C                                               V                                                                P                                                                  I
                                                                                                                          Committee chairman                   Committee vice-chairman                                                          Proprietary                               Independent
COMPOSITION AND STRUCTURE OF THE BOARD OF DIRECTORS
                                                                                                                                                                                   N
                                                                                                                                         Non-executive, neither proprietary nor independent


                                                          BOARD OF DIRECTORS                                                                                                                                COMMITTEES


                                                                                                                                                                                                                                                                 remuneration committee


                                                                                                                                                                                                                                                                                                                           6. Technology, productivity
                                                                                                                                                                                                                                                                                          5. International committee


                                                                                                                                                                                                                                                                                                                              and quality committee
                                                                                                                                                                                                                                    3. Audit and compliance
                                                                                                                                                                                   1. Executive committee


                                                                                                                                                                                                                                                              4. Appointments and
                                                                                                                                                                                                              2. Risk committee
                                                                                                                                                                   Non-executive


                                                                                                                                                                                                                                       committee
                                                                                                                                                   Executive


Chairman                                                                 Mr Emilio Botín-Sanz de Sautuola y García de los Ríos (1)                                                     C                                                                                                     C                                     C
First vice-chairman                                                      Mr Fernando de Asúa Álvarez                                                                   I                                            V                                                  C
Second vice-chairman and chief executive officer                         Mr Alfredo Sáenz Abad
Third vice-chairman                                                      Mr Matías Rodríguez Inciarte (3)                                                                                                           C
Fourth vice-chairman                                                     Mr Manuel Soto Serrano                                                                        I                                                                     C
Members                                                                  Assicurazioni Generali S.p.A.                                                              N
                                                                         Mr Antonio Basagoiti García-Tuñón                                                          N
                                                                         Ms Ana Patricia Botín-Sanz de Sautuola y O’Shea (1)
                                                                         Mr Javier Botín-Sanz de Sautuola y O’Shea (1) (2)                                           P
                                                                         Lord Burns (Terence)                                                                       N
                                                                         Mr Guillermo de la Dehesa Romero                                                              I
                                                                         Mr Rodrigo Echenique Gordillo                                                                 I
                                                                         Mr Antonio Escámez Torres                                                                     I
                                                                         Mr Ángel Jado Becerro de Bengoa                                                               I
                                                                         Mr Francisco Luzón López
                                                                         Mr Abel Matutes Juan                                                                          I
                                                                         Mr Juan Rodríguez Inciarte
                                                                         Mr Luis Ángel Rojo Duque                                                                      I
                                                                         Mr Luis Alberto Salazar-Simpson Bos                                                           I
                                                                         Ms Isabel Tocino Biscarolasaga                                                                I
                                                                         Total

General secretary and secretary of the board                             Mr Ignacio Benjumea Cabeza de Vaca
Deputy general secretary and deputy secretary of the board               Mr Jaime Pérez Renovales

1. Mr Emilio Botín-Sanz de Sautuola y García de los Ríos has the right to vote, at the general              2. Mr Javier Botín-Sanz de Sautuola y O'Shea is a proprietary non-executive director because on the
   shareholders’ meeting, 91,866,035 shares owned by Fundación Marcelino Botín (1.10% of the                   board of directors he represents 2.146% of the share capital, representing the aggregate interests
   share capital), 8,096,742 shares owned by Mr Jaime Botín-Sanz de Sautuola y García de los Ríos,             owned by Fundación Marcelino Botín, Mr Emilio Botín-Sanz de Sautuola y García de los Ríos,
   9,042,777 shares owned by Mr Emilio Botín-Sanz de Sautuola y O’Shea, 9,118,823 shares owned                 Ms Ana Patricia Botín-Sanz de Sautuola y O'Shea, Mr Emilio Botín-Sanz de Sautuola y O'Shea,
   by Ms Ana Patricia Botín-Sanz de Sautuola y O’Shea and 9,469,213 shares owned by Mr Javier                  Mr Jaime Botín-Sanz de Sautuola y García de los Ríos, Ms Paloma O’Shea Artiñano and his own
   Botín-Sanz de Sautuola y O’Shea. Accordingly, this table includes the direct and indirect interests of      interest.
   each of the two last named, who are directors of the Bank, but in the column showing the total
   percentage of share capital that such interests represent they are computed together with those          3. Mr Matías Rodríguez Inciarte has the right to vote 78,644 shares owned by two of his children.
   owned or also represented by Mr Emilio Botín-Sanz de Sautuola y García de los Ríos.


68                                                                                                                                                                                                                                ANNUAL REPORT 2010
POWERS AND DUTIES                                                                                         discharge thereof; the appointment, remuneration and,
                                                                                                            if appropriate, removal of the other members of senior
  The basic responsibility of the board of directors is to supervise                                        management and the determination of the basic terms of their
  the Group, delegating the day-to-day management thereof to                                                contracts, as well as the creation or acquisition of interests in
  the appropriate executive bodies and the various management                                               special purpose entities or in entities registered in countries or
  teams.                                                                                                    territories regarded as tax havens. On the matters mentioned
                                                                                                            in this paragraph, the executive committee may make any
  The Rules and Regulations of the Board (article 3) reserve thereto                                        appropriate decisions, by delegation of the board and
  the power to approve general policies and strategies and, in                                              whenever justified by reasons of urgency.
  particular, strategic plans, management objectives and the annual
  budget, corporate governance, corporate social responsibility and                                         The Bylaws (article 40) as well as the aforementioned Rules and
  dividend and treasury stock policies, the general risk policy, and                                        Regulations (article 5) establish the board’s obligation to ensure
  the policies for the provision of information to and for                                                  that the Bank faithfully complies with applicable law, observes
  communication with the shareholders, the markets and the public                                           usage and good practices of the industries or countries where it
  opinion, which power cannot be delegated.                                                                 does business and abides by the social responsibility principles
                                                                                                            that it has voluntarily accepted.
  The board also reserves for itself, and likewise cannot delegate,
  decisions regarding the acquisition and disposition of                                                    In addition, the board of the Bank plays a special role in the
  substantial assets (except when the decisions come within the                                             Group’s risk management. Fifteen of its 20 members are
  purview of the shareholders at a general shareholders’                                                    members of at least one of the three board committees with
  meeting) and major corporate transactions; the determination                                              powers in the area of risks: the executive committee, the risk
  of the remuneration of each director and the approval of the                                              committee and the audit and compliance committee. Of these
  contracts governing the performance by the directors of duties                                            15 directors, one is the first vice-chairman of the Bank, who is a
  other than those of a director, including executive duties, as                                            member of all three committees, and another 4 directors sit on
  well as the remuneration to which they are entitled for the                                               two of the committees with powers in the area of risks.


                                                                     SHAREHOLDING AT 31 DECEMBER 2010


                                                                                                                                                                           Date of last
                                                                                                                                                                       proposal of the
                                                                                                                                                                        appointments
                                              Shares                                 % of share          Date of first    Date of last                               and remuneration
     Direct             Indirect         represented                   Total            capital         appointment      appointment          Expiration date (4)           committee

  8,191,268        42,916,473            109,005,554          160,113,295                   2.146       04.07.1960 (5)     21.06.2008     First six months of 2013          16.04.2008
     61,135            50,641                      -              111,776                   0.001         17.04.1999       11.06.2010     First six months of 2015          21.04.2010
    952,729         1,259,475                      -            2,212,204                   0.027       11.07.1994 (5)     11.06.2010     First six months of 2015          21.04.2010
    967,600            83,578                 78,644            1,129,822                   0.014       07.10.1988 (5)     19.06.2009     First six months of 2014          27.04.2009
     61,500           364,752                      -              426,252                   0.005         17.04.1999       19.06.2009     First six months of 2014          27.04.2009
     75,000        56,089,940                      -           56,164,940                   0.674         17.04.1999       23.06.2007     First six months of 2012          19.03.2007
    708,246                 -                      -              708,246                   0.009         26.07.1999       23.06.2007     First six months of 2012          19.03.2007
  5,094,687         4,024,136                      -            9,118,823                   0.000       04.02.1989 (5)     17.06.2006     First six months of 2011          18.04.2006
  4,793,481         4,675,732                      -            9,469,213                   0.000         25.07.2004       11.06.2010     First six months of 2015          21.04.2010
     30,102            27,001                      -               57,103                   0.001         20.12.2004       17.06.2006     First six months of 2011          18.04.2006
        102                 -                      -                  102                   0.000         24.06.2002       19.06.2009     First six months of 2014          27.04.2009
    658,758             9,398                      -              668,156                   0.008         07.10.1988       17.06.2006     First six months of 2011          18.04.2006
    757,594                 -                      -              757,594                   0.009         17.04.1999       23.06.2007     First six months of 2012          19.03.2007
  1,877,500         4,950,000                      -            6,827,500                   0.082         11.06.2010       11.06.2010     First six months of 2015          21.04.2010
  1,226,852            53,339                      -            1,280,191                   0.015       22.03.1997 (5)     23.06.2007     First six months of 2012          19.03.2007
    124,969         2,319,463                      -            2,444,432                   0.029         24.06.2002       19.06.2009     First six months of 2014          27.04.2009
  1,367,626                 -                      -            1,367,626                   0.016       28.01.2008 (5)     21.06.2008     First six months of 2013          21.01.2008
          1                 -                      -                    1                   0.000         25.04.2005       21.06.2008     First six months of 2013          16.04.2008
    253,205             5,713                      -              258,918                   0.003         17.04.1999       21.06.2008     First six months of 2013          16.04.2008
     39,860                 -                      -               39,860                   0.000         26.03.2007       11.06.2010     First six months of 2015          21.04.2010
27,242,215       116,829,641            109,084,198          253,156,054                    3.039


  4. However, and pursuant to the provisions of article 55 of the Bylaws, one-fifth of the board will
     be renewed each year, based on length of service and according to the date and order of the
     respective appointment. An amendment of the Bylaws and of the Rules and Regulations of
     the Board is being contemplated in order to reduce the directors’ term of office to three years.

  5. The date on which they were appointed for the first time as executive directors coincides with
     their first appointment as a director.


          ANNUAL REPORT 2010                                                                                                                                                        69
COMMITMENT AND EXPERIENCE OF THE BOARD


                                                                                   The directors have, on average, thirteen years’ experience
                                                                                   working on the Bank’s board
BOARD’S INTEREST IN THE BANK’S CAPITAL                                             EXPERIENCE OF THE BOARD
Data as of the end of 2010
                                                                                                               More than 15 years
                                                                                                               5
 2,007               million euros
                                                                                                                                                  0 to 4 years
                                                                                                                                                  3
 stock market value


 253,156,054                                3.039%
                                            of share capital

 number of shares of the board
                                                                                                                                                    5 to 9 years
                                                                                                                                                    5

 7,928               euros
                                                                                         10 to 14 years
                                                                                         7

 stock price                                                                       The 10 independent non-executive directors have an average
                                                                                   of 9.6 years’ experience on the board.
                                                                                   In the case of the 6 executive directors, their experience
                                                                                   exceeds 21 years on average.


     CORPORATE GOVERNANCE OF RISK MANAGEMENT

• Mr Matías Rodríguez Inciarte, third
  vice-chairman of the Bank and chairman of              AVERAGE ATTENDANCE RATE AT MEETING OF THE COMMITTEES OF THE BOARD
  the risk committee, reports directly to the            %
  executive committee and to the board, which
  guarantees the independence of the risk                   Executive committee
  function.                                                 Risk committee
• The risk committee held 99 meetings in 2010,              Audit and compliance committee
                                                                                                                                                     92.7


  each of which lasted approximately 3 hours.
                                                                                                                92.5


                                                                                                                                                              92.2
                                                                                                                              92.0
                                                                                90.5
                                                          89,1


                                                                                                                                           89.5


                                                                                                                                                                      90.7
                                                                                                                       90.9


• The executive committee held 55 meetings in
                                                                                                        90.3


                                                                                                                                                                             89.1


  2010 and devoted a significant amount of
                                                                         88,3
                                                                  88,2


                                                                                        87.1


  time to discussions on risks.
                                                                                               86.2


• Of the 20 members currently making up the
  board, 15 sit on at least one of the three
  committees with powers and duties in the
  area of risks: executive committee, risk
  committee, and audit and compliance
                                                                 2006                  2007                    2008                   2009                           2010
  committee.

NUMBER OF DIRECTORS PARTICIPATING IN THE EXECUTIVE,                                    NUMBER OF MEETINGS OF THE EXECUTIVE , THE RISK
THE RISK AND THE AUDIT AND COMPLIANCE COMMITTEES                                       AND THE AUDIT AND COMPLIANCE COMMITTEES


                                                                                       Committees                              2006               2007      2008     2009 2010
                                                                                       Executive committee                            51            55        59       56           55
                                                                                       Risk committee                                100            98       102       99           99
                                                    1 director is a                    Audit and compliance committee                 12            13        11       11           11
     10                                             member of all 3
     out of the                                     committees                         Total meetings                                163           166       172      166      165
     20 directors
     participate
     in at least 1
     of the 3                                   4 directors
     committees                                 participate in 2 of
                                                the 3 committees


70                                                                                                                                                  ANNUAL REPORT 2010
SIZE AND COMPOSITION OF THE BOARD
The Bank believes that the current size and composition of the               INDEPENDENT NON-EXECUTIVE DIRECTORS
board reflect the principles of representativeness of the                    Independent non-executive directors account for 50% of
ownership structure and equilibrium in governance of the Bank,               the Board.
also taking into account the size, complexity and geographical
diversity of the Group.                                                      Article 6.2.c) of the Rules and Regulations of the Board includes
                                                                             the definition of independent director established in the Unified
In 2006, the shareholders acting at a general shareholders’                  Code. In the light thereof, taking into account the circumstances
meeting approved a bylaw amendment whereby the maximum                       of each case, and upon the prior report of the appointments
number of directors was reduced from 30 to 22, with the                      and remuneration committee, the board considers the following
minimum remaining at 14.                                                     to be independent non-executive directors: Mr Fernando de
                                                                             Asúa Álvarez, Mr Manuel Soto Serrano, Mr Guillermo de la
Pursuant to article 6.3 of the Rules and Regulations of the                  Dehesa Romero, Mr Rodrigo Echenique Gordillo, Mr Antonio
Board, the appointments and remuneration committee, at its                   Escámez Torres, Mr Ángel Jado Becerro de Bengoa, Mr Abel
meeting of 16 March 2011, verified the status of each director.              Matutes Juan, Mr Luis Ángel Rojo Duque, Mr Luis Alberto
Its proposal was submitted to the board, which approved it at                Salazar-Simpson Bos and Ms Isabel Tocino Biscarolasaga.
its meeting of 21 March 2011 and established the composition
of the board upon the terms set forth below.                                 At 31 December 2010, the average length of service of
                                                                             independent non-executive directors in the position of board
Of the 20 directors currently sitting on the board of directors,             member was 9.6 years.
6 are executive and 14 are non-executive. Of the 14 non-
executive directors, 10 are independent, 1 is proprietary and                Taking the board as a whole, the average length of service is
3 are, in the opinion of the board, neither proprietary nor                  13 years, which is greater than that of independent
independent.                                                                 non-executive directors due to the longer continuity in office
                                                                             of executive directors (21.3 years).
EXECUTIVE DIRECTORS
Pursuant to the Rules and Regulations of the Board (article                  OTHER NON-EXECUTIVE DIRECTORS
6.2.a)), the following are executive directors: Mr Emilio Botín-             Lord Burns is a non-executive, non-proprietary director. Since he
Sanz de Sautuola y García de los Ríos, Mr Alfredo Sáenz Abad,                currently receives remuneration in his capacity as non-executive
Mr Matías Rodríguez Inciarte, Ms Ana Patricia Botín-Sanz de                  chairman of the Group’s subsidiaries, Santander UK plc and
Sautuola y O’Shea, Mr Francisco Luzón López and Mr Juan                      Alliance & Leicester plc, in the opinion of the board of directors
Rodríguez Inciarte.                                                          and upon a prior report of the appointments and remuneration
                                                                             committee, he cannot be classified as an independent director.
PROPRIETARY NON-EXECUTIVE DIRECTORS
Since 2002, the standard used by the appointments and                        The same applies to Mr Antonio Basagoiti García-Tuñón, who,
remuneration committee and the board of directors as a                       in his capacity as non-executive chairman of Banesto, receives
necessary but not sufficient condition to designate or consider a            remuneration in addition to his remuneration as a director of
director as a non-executive proprietary director (as expressly set           Banco Santander.
forth in article 6.2.b) of the Rules and Regulations of the Board
of Directors) is that he/she hold at least 1% of the share capital           In the opinion of the board, upon a prior report of the
of the Bank. This percentage was set by the Bank exercising its              appointments and remuneration committee, the non-executive
powers of self-regulation.                                                   director Assicurazioni Generali S.p.A. cannot be classified as
                                                                             proprietary in view of the fact that its interest in the Bank’s
Taking into account the circumstances of the case, and upon the              capital has decreased below 1%, which is the limit set by article
prior report of the appointments and remuneration committee,                 6.2.b) of the Rules and Regulations of the Board as a minimum
the board believes that Mr Javier Botín-Sanz de Sautuola y O’Shea            in order for the directors holding or representing such
is a proprietary non-executive director.                                     percentage interest to be considered proprietary directors.


COMPOSITION OF THE BOARD


                                                Independent
       Proprietary                              non-executive directors 10
     non-executive                              50%
        directors 1
                5%

             Other
     non-executive
        directors 3
              15%


                                Executive directors 6
                                30%


     ANNUAL REPORT 2010                                                                                                                       71
EXECUTIVE CHAIRMAN AND                                                 SUCCESSION PLANS FOR THE
CHIEF EXECUTIVE OFFICER                                                CHAIRMAN AND THE CHIEF EXECUTIVE
The Bank has chosen to have an executive chairman because it           OFFICER
believes that it is the position that best suits its circumstances.
                                                                       Succession planning for the main directors is a clear element of
                                                                       the good governance of the Bank, tending to assure an orderly
The chairman of the board is the highest-ranking officer of the
                                                                       leadership transition at all times. Along these lines, article 24 of
Bank (article 48.1 of the Bylaws and article 8.1 of the Rules and
                                                                       the Rules and Regulations of the Board provides that:
Regulations of the Board) and accordingly, all the powers which
may be delegated under the Law, the Bylaws and the Rules and
                                                                      “In the cases of withdrawal, announcement of renunciation or
Regulations of the Board have been delegated to him. He is
                                                                       resignation, disability or death of the members of the board
responsible for directing the Bank’s management team, always
                                                                       of directors or its committees or withdrawal, announcement
in accordance with the decisions and standards set by the
                                                                       of renunciation or resignation of the chairman of the board of
shareholders acting at a general shareholders’ meeting and by
                                                                       directors or of the managing director or directors, as well as
the board within their respective purview.
                                                                       from other positions on such bodies, at the request of the
                                                                       chairman of the board of directors or, in his absence, at the
The chief executive officer, acting by delegation from and
                                                                       request of the highest-ranking vice-chairman, the
reporting to the board of directors and the chairman, as the
                                                                       appointments and remuneration committee will be convened
highest-raking officer of the Bank, is charged with the conduct
                                                                       in order for such committee to examine and organise the
of the business and the highest executive duties.
                                                                       process of succession or replacement in an orderly manner
                                                                       and to present the corresponding proposal to the board of
There is a clear separation of duties between the executive
                                                                       directors. Such proposal shall be communicated to the
chairman, the chief executive officer, the board and the
                                                                       executive committee and subsequently submitted to the
committees thereof, as well as various checks and balances,
                                                                       board of directors on the following meeting scheduled to be
which assure proper equilibrium in the corporate governance
                                                                       held by the board’s annual calendar of meetings or at such
structure of the Bank. The following are some particularly
                                                                       extraordinary meeting as may be called if deemed necessary.”
important aspects:
• The board and its committees exercise supervisory and control        Article 44.2 of the Bylaws sets out interim replacement rules for
  duties over the actions of both the chairman and the chief           the temporary performance (in cases of absence, inability to act
  executive officer.                                                   or indisposition) of the duties of the chairman of the board in
                                                                       the absence of the vice-chairmen.
• The first vice-chairman, who is an independent non-executive
  director, is the chairman of the appointments and
                                                                       The board determines the numerical sequence for such purpose
  remuneration committee and acts as coordinator of non-
                                                                       every year based on the directors’ seniority. In this regard, at its
  executive directors.
                                                                       meeting of 11 June 2010, the board unanimously resolved to
• The powers delegated to the chief executive officer are              assign the following order of priority for the temporary
  the same as those delegated to the chairman, which powers            performance of the duties of chairman in the absence of the
  do not include, in either case, those reserved by the board          vice-chairmen of the board:
  for itself.
                                                                       1) Mr Rodrigo Echenique Gordillo
                                                                       2) Ms Ana Patricia Botín-Sanz de Sautuola y O’Shea
                                                                       3) Mr Francisco Luzón López
                                                                       4) Assicurazioni Generali S.p.A.
                                                                       5) Mr Antonio Escámez Torres
                                                                       6) Mr Luis Alberto Salazar-Simpson Bos
                                                                       7) Mr Antonio Basagoiti García-Tuñón
                                                                       8) Mr Guillermo de la Dehesa Romero
                                                                       9) Mr Abel Matutes Juan
                                                                       10) Mr Javier Botín-Sanz de Sautuola y O’Shea
                                                                       11) Lord Burns
                                                                       12) Mr Luis Ángel Rojo Duque
                                                                       13) Ms Isabel Tocino Biscarolasaga
                                                                       14) Mr Juan Rodríguez Inciarte
                                                                       15) Mr Ángel Jado Becerro de Bengoa


72                                                                                                                  ANNUAL REPORT 2010
SECRETARY OF THE BOARD                                                CONDUCT OF MEETINGS
The Bylaws (article 45.2) include among the duties of the             In 2010, the board was kept continuously and fully informed of
secretary those of caring for the formal and substantive legality     the running of the various business areas of the Group through
of the activities of the board, safeguarding observance of the        the eight management reports and seven risks reports presented
good governance recommendations assumed by the Bank,                  by the chief executive officer and the third vice-chairman in
and ensuring that governance procedures and rules are                 charge of the risk division, respectively, at the twelve meetings
observed and regularly reviewed.                                      held during the financial year. In addition, the board analysed in
                                                                      detail the business in Latin America (particularly Brazil) and in
The secretary of the board is the general secretary, who also         the United Kingdom, the Santander España and Banesto branch
acts as secretary of all of the committees of the board.              networks and the Group’s Asia Plan, as well as the liquidity of
                                                                      European banks and of Banco Santander and the new capital
Article 17.4.d) of the Rules and Regulations of the Board             standards, BIS III.
provides that the appointments and remuneration committee
must report on proposals for the appointment or withdrawal            During the year, the board of directors also addressed other
of the secretary of the board prior to submission thereof to          matters that come within its area of supervision, as are the
the board.                                                            compliance function, the sustainability policy and the definition
                                                                      of the Group’s structure and off-shore centres.

PROCEEDINGS OF THE BOARD                                              Finally, the board was informed of the conclusions of the
                                                                      external and internal audits and of the Group’s internal control
There were twelve meetings during financial year 2010.                model.

The board holds its meetings in accordance with an annual
calendar. The Rules and Regulations of the Board provide that         STRATEGY MEETINGS
the board shall hold not less than nine annual ordinary meetings.
The board shall also meet whenever the chairman so decides,           In addition to the ordinary meetings, the board held specific
acting on his own initiative or at the request of not less than       meetings to discuss Santander’s strategy. For such purpose,
three directors (article 46.1 of the Bylaws).                         the directors held two meetings in 2010: the first one, on
                                                                      18 May, and the second one, on 18 and 19 December.
When directors cannot attend a meeting personally, they may
give a proxy to any other director, in writing and specifically for   Among the matters discussed were:
each meeting, to represent them for all purposes at such meeting.
                                                                      • The economic environment and the situation of the financial
                                                                        industry, with special focus on the Spanish credit system
Any member of the board may propose the inclusion of any
                                                                        (banks and savings associations).
other item not included in the draft agenda that the chairman
proposes to the board (article 46.2 of the Bylaws).                   • The challenges and management priorities of Santander’s
                                                                        businesses in the United Kingdom: integration of acquired
Meetings of the board shall be validly held when more than              businesses, regulatory framework, and strengthening of the
one-half of its members are present in person or by proxy.              franchise and the distribution network.
                                                                      • Banco Santander’s living will.
Except in instances in which a greater majority is specifically
required pursuant to legal provisions, the Bylaws or the Rules        • The future regulation of the capital and liquidity of financial
and Regulations of the Board, resolutions are adopted by                institutions.
absolute majority of the directors attending in person or by
proxy. In the event of a tie, the chairman has a tie-breaking vote.


     ANNUAL REPORT 2010                                                                                                                   73
TRAINING OF DIRECTORS AND                                           SELF-EVALUATION BY THE BOARD
ORIENTATION PROGRAMME                                               As in prior financial years, a self-evaluation was performed with
                                                                    the support of Spencer Stuart on the basis of a questionnaire
As a result of the self-evaluation of the board carried out in
                                                                    and personal interviews with the directors, and also included
2005, an on-going director training programme was put
                                                                    —in line with the recommendation of the Unified Code and the
in place.
                                                                    provisions of the Rules and Regulations of the Board— a special
                                                                    section for the individual evaluation of the chairman, the chief
Seven meetings were held in 2010 with the attendance of an
                                                                    executive officer and the other directors.
average of thirteen directors, who devoted approximately one
hour and a half to each session. Various issues were reviewed in
                                                                    The process of self-evaluation by the board focused on the
depth at such meetings in connection with the management of
                                                                    organisation, proceedings and content of board and committee
risks, especially standardised risks, business lines, capital and
                                                                    meetings, a comparison with other international banks,
solvency, the causes of the collapse of some banks, and the
                                                                    and open questions on issues related to the future (strategy,
technology of Santander.
                                                                    internal and external factors).
The Rules and Regulations (article 21.7) provide that the board
                                                                    The directors highlighted the following as strengths of the
shall make available to new directors an information programme
                                                                    Group’s corporate governance: knowledge of the banking
providing quick and adequate understanding of the Bank and its
                                                                    business, experience, balance between executive and non-
Group, including its governance rules. This programme was thus
                                                                    executive directors, dedication of board members, and
made available to the newest directors.
                                                                    involvement in risk control.

                                                                    In the opinion of the directors, these strengths have enabled
                                                                    the Group to become a benchmark for management amid the
                                                                    current crisis and to capitalise on the business opportunities
                                                                    that have arisen.

                                                                    Furthermore, in connection with the organisation, proceedings
                                                                    and content of board meetings, the following aspects were
                                                                    highlighted: high level of strategic debate; composition of the
                                                                    board and directors’ expertise; director training programme;
                                                                    excellent operation of the chairman/chief executive officer team;
                                                                    promotion of debate; high level of commitment on the part
                                                                    of the directors; and involvement of the board in the control of
                                                                    credit risk, among others, including reputational, operational
                                                                    and technological risks.


                                                                    APPOINTMENT, RE-ELECTION
                                                                    AND RATIFICATION OF DIRECTORS
                                                                    The proposals for appointment, re-election and ratification of
                                                                    directors, regardless of the status thereof, that the board of
                                                                    directors submits to the shareholders for consideration at a
                                                                    general shareholders’ meeting, as well as the appointment
                                                                    decisions made by the board itself in the exercise of its powers
                                                                    to make interim appointments (cooptación) as permitted by law,
                                                                    must, in turn, be preceded by the corresponding proposal of the
                                                                    appointments and remuneration committee.

                                                                    Although the proposals of such committee are not binding,
                                                                    the Rules and Regulations of the Board provide that if the board
                                                                    does not follow them, it must give reasons for its decision.

                                                                    Currently, all directors have been appointed or re-elected at the
                                                                    proposal of the appointments and remuneration committee.


74                                                                                                             ANNUAL REPORT 2010
REMUNERATION                                                         REPORT ON THE DIRECTOR REMUNERATION POLICY
                                                                     As provided in the Bylaws (article 59.1), the board of directors
REMUNERATION SYSTEM                                                  annually approves a report on the director remuneration policy,
Article 58 of the Bylaws provides that the directors shall have      which sets forth the standards and grounds that determine the
the right to receive, in consideration for the performance of        remuneration for the last and current financial year, making such
their duties as board members and as a share in the profits for      report available to the shareholders on occasion of the call to
each financial year, remuneration equal to 1% of the Bank’s net      the annual general shareholders’ meeting.
profits for the respective financial year, although a director may
agree to reduce such percentage. In exercise of its powers, the      In 2010, such report was submitted for the first time to the
board set the amount for financial year 2010 at 0.183% of the        shareholders at the general shareholders’ meeting held on
Bank’s profits for the year. This percentage was calculated by       11 June 2010, as a separate item on the agenda and as a
including in the numerator not only the annual allocation, but       consultative matter; 94.943% of the votes were in favour
also the attendance fees accrued by the directors during the         of the report.
financial year, as provided in such article 58.
                                                                     TRANSPARENCY
The remuneration of directors is approved by the board at the        Pursuant to the Bylaws (article 59.2), the annual accounts
proposal of the appointments and remuneration committee,             includes itemised information on the remuneration received by
except for such remuneration as consists of the delivery of          each director, with a statement of the amounts for each item of
shares or options thereon, or that is paid under other               remuneration. The report also sets forth, on an individual basis
remuneration systems established by reference to the value of        for each item, the remuneration for the executive duties
the shares of the Bank, the approval of which, under the Law         entrusted to the executive directors of the Bank.
and the Bylaws, is within the purview of the shareholders acting
at a general shareholders’ meeting, at the proposal of the board     All such information is contained in note 5 to the Group’s
made after a report of the appointments and remuneration             legal report.
committee.

The Group’s policy provides that only executive directors may be
beneficiaries of remuneration systems consisting of the delivery
of shares or rights thereon.

BOARD’S REMUNERATION IN 2010
In 2010, for the second consecutive year, the board resolved to
maintain the same amounts as in the prior year for the annual
allocation to which the board members are entitled for the
performance of supervisory and collective decision-making
duties, such that they have remained unchanged since 2008.

With regards to the executive directors, the board has agreed to
keep with only one exception the fixed remuneration for 2011
and to increase the variable remuneration by 10% for 2010.

ANTICIPATION OF AND ADAPTATION
TO THE REGULATORY FRAMEWORK
For some years, the board of directors, at the proposal of
the appointments and remuneration committee, has initiated
measures based on the need for a remuneration system that
fosters rigorous risk management. This initiative, together with
continuous monitoring of the recommendations of the principal
domestic and international bodies in this area, has allowed the
Bank to apply the principles contained in many of the more
recent guidelines, on some occasions even before they go
into effect.

One example of this is the deferred shares portion of variable
remuneration that the Bank’s board approved in 2007 and that
the Financial Stability Board included among the principles for
sound compensation practices announced in 2009.


     ANNUAL REPORT 2010                                                                                                             75
DUTIES OF DIRECTORS, RELATED-PARTY                                    COMMITTEES OF THE BOARD
TRANSACTIONS AND CONFLICTS OF
INTEREST                                                              GENERAL
                                                                      The board has set up, as decision-making committees,
DUTIES                                                                an executive committee, to which it has delegated general
The duties of the directors are governed by the Rules and             decision-making powers, and a risk committee, to which it
Regulations of the Board, which conform both to the provisions        has delegated powers specifically relating to risks.
of current Spanish law and to the recommendations of the
Unified Good Governance Code.                                         The board also has the following committees with supervisory,
                                                                      reporting, advisory and proposal-making powers: the audit and
The Rules and Regulations expressly provide for the duties            compliance committee, the appointments and remuneration
of diligent management, fidelity in furtherance of the Bank’s         committee, the international committee, and the technology,
interests, loyalty, secrecy and inactivity in the event of            productivity and quality committee.
knowledge of confidential information.
                                                                      EXECUTIVE COMMITTEE
The duty of diligent management includes the directors’ duty to       The executive committee is a basic instrument for the corporate
inform themselves adequately of the running of the Bank and to        governance of the Bank and its group. Its duties and
dedicate to their duties the time and effort needed to carry them     composition are established in the Bylaws (article 51) and in the
out effectively. The directors must inform the appointments and       Rules and Regulations of the Board (article 14).
remuneration committee of their other professional obligations,
and the maximum number of boards of directors on which they           There are currently 10 directors sitting on the committee,
may sit is governed by the provisions of Law 31/1968 of 27 July.      of whom 5 are executive and 5 are non-executive directors.
                                                                      Of the latter, 4 are independent and 1 is neither proprietary
RELATED-PARTY TRANSACTIONS                                            nor independent.
To the best of the Bank’s knowledge, no member of the board
of directors, no person represented by a director and no              The executive committee proposes to the board those decisions
company of which such persons, or persons acting in concert           that are within its exclusive purview. It also reports to the board
with them or through nominees therein, are directors, members         on the matters dealt with and the resolutions adopted by
of senior management or significant shareholders, in financial        making the minutes of its meetings available to the directors
year 2010 and to the date of publication of this report, has          (article 14.7 of the Rules and Regulations of the Board), among
carried out unusual or significant transactions with the Bank.        other ways of reporting.

CONTROL MECHANISMS                                                    RISK COMMITTEE
As provided in the Rules and Regulations of the Board (article 30),   It is governed by the Bylaws (article 52) and the Rules and
directors must inform the board of any conflict of interest,          Regulations of the Board (article 15), which define the
whether direct or indirect, that they may have with the interests     composition and duties of this committee, including within its
of the Bank. If the conflict relates to a transaction, the director   powers and duties the responsibilities set forth in the Unified
may not carry it out without the approval of the board, following     Code regarding risk control and management.
a report of the appointments and remuneration committee.
                                                                      The committee is currently made up of five directors, of whom
The director involved must refrain from participating in the          two are executive and three are non-executive. Of these three
discussion and voting on the transaction to which the conflict        non-executive directors, two are independent and one is neither
refers.                                                               proprietary nor independent. Its chairman is a vice-chairman
                                                                      with executive duties pursuant to the Rules and Regulations of
In the case of directors, the body in charge of resolving any         the Board (article 15.1).
disputes is the board of directors itself.
                                                                      Pages 150 to 207 of this annual report contain broad
SPECIFIC SITUATIONS OF CONFLICT                                       information regarding the risk committee and the Group’s risk
In financial year 2010 there were 39 cases in which directors,        policies, the responsibility for which (article 3 of the Rules and
including those who are members of senior management,                 Regulations of the Board) is part of the board’s general duty
abstained from participating and voting in the discussions of the     of supervision.
board of directors or of the committees thereof.

The breakdown of the 39 cases is as follows: on 16 occasions,
the situation of conflict was due to proposals for appointment,
re-election and renewal of powers of the directors; on 13
occasions, the matter under consideration was the approval of
terms of remuneration; on 5 occasions, the situation arose from
the annual verification of the status of the directors made by the
appointments and remuneration committee at its meeting of
17 March 2010 pursuant to article 6.3 of the Rules and
Regulations of the Board; on 4 occasions, proposals were
discussed regarding the financing of companies related to various
directors; and on one occasion, the matter at hand was the
approval of a corporate social responsibility activity in favour of
a foundation chaired by a director.


76                                                                                                                 ANNUAL REPORT 2010
AUDIT AND COMPLIANCE COMMITTEE                                          During financial year 2010, none of the members of the
As provided in the Bylaws (article 53) and the Rules and                appointments and remuneration committee was an executive
Regulations of the Board (article 16), the audit and compliance         director, member of senior management or employee of the
committee must be made up of non-executive directors, the               Bank, and no executive director or member of the senior
majority of whom must be independent. Its chairman shall be             management of the Bank sat on the board (or on the
an independent director. It is currently composed of                    remuneration committee) of companies that employed
independent non-executive directors only.                               members of the appointments and remuneration committee.

Its duties, listed in the above-mentioned provisions, conform to        The Rules and Regulations of the Board establish the duties of
the recommendations of the Unified Code for audit committees            this committee, including all those recommended by the Unified
and the internal audit function.                                        Code for appointments and remuneration committees.

The coordination required by the best international practices           Since 2004 the appointments and remuneration committee has
between the activities of the risk committee and those of the           published an activities report which, since 2006, also includes
audit committee is guaranteed within the Group because, on              the report on director remuneration policy.
the one hand, the general secretary is the secretary of both
the risk committee and the audit and compliance committee,              TECHNOLOGY, PRODUCTIVITY AND
and on the other hand, because of the presentations                     QUALITY COMMITTEE
regarding risk management made at the audit and compliance              The technology, productivity and quality committee (article 13
committee.                                                              of the Rules and Regulations of the Board) is responsible for
                                                                        studying and reporting on the plans and actions relating to
Specifically, during the last financial year, the third vice-chairman   information and application programming systems, investments
and chairman of the risk committee reported to the audit and            in computer equipment, design of operational processes to
compliance committee, at its meeting of 21 April, regarding the         improve productivity, and programmes to improve service quality
status of risks within the Group, submitting a detailed                 and measurement procedures, as well as programs relating to
presentation on the following issues:                                   resources and costs.

1. Principles governing risk management.                                It is made up of eight directors, three executive and five
                                                                        non-executive directors. Of the latter, four are independent
2. Reference indicators (review of the Group’s balance sheet,
                                                                        and 1 is neither proprietary nor independent.
   credit risk and market risk).
3. Principal risks, delinquency, and features of the main               INTERNATIONAL COMMITTEE
   portfolios.                                                          The international committee (article 13 of the Rules and
4. Other issues, such as stress test on credit portfolios,              Regulations of the Board) is responsible for monitoring the
   real estate risk in Spain and structured financing.                  progress of the Group’s strategy and the activities, markets and
                                                                        countries in which the Group wishes to operate through direct
                                                                        investments or through the deployment of specific business.
Moreover, other presentations were made in 2010 regarding               The committee is informed of the commercial initiatives and
specific risk issues.                                                   strategies of the various Group units and of any new projects
                                                                        presented to it. It also reviews the progress of financial
The report prepared by the audit and compliance committee               investments and business as well as the international economic
regarding its activities in 2010, which is distributed together         climate so that it can make, where appropriate, suitable
with the annual report, contains detailed information on internal       proposals to correct country risk limits, their structure and
control systems and risk management.                                    returns and their allocation by business and/or unit.

APPOINTMENTS AND REMUNERATION COMMITTEE                                 The committee is made up of eight directors, four executive
The Bylaws (article 54) and the Rules and Regulations of the            directors and four independent non-executive directors.
Board (article 17) provide that this committee is also to be
made up exclusively of non-executive directors and that its
chairman shall be an independent director, as is in fact the case.
All its current members are independent non-executive
directors.


COMMITTEES OF THE BOARD
                                                                                                               Audit and      Appointments
                                                                            Executive          Risk          compliance    and remuneration
                                                                           committee      committee           committee          committee

No. of members                                                                    10              5                   5                    5
Executive                                                                          5              2                    -                   -
Non-executive                                                                      5              3                   5                    5
No. of meetings                                                                   55             99                  11                    9
Hours*                                                                           285            297                  55                 28
(*) Estimated hours of average dedication per director.


        ANNUAL REPORT 2010                                                                                                              77
INTERNATIONAL ADVISORY BOARD
     The international advisory board, established in 1997 and
     governed by article 18 of the Rules and Regulations of the Board,
     cooperates with the board in the design, development and,
     if applicable, implementation of the overall business strategy by
     contributing ideas and suggesting business opportunities.

     During 2010, the international advisory board held two
     meetings, during which the following issues were discussed,
     among others: the situation in the US, Spain and the rest of
     Europe, the Bank’s living will, Santander’s image plan and
     sporting sponsorships, the Group’s results and the prospects
     thereof, with special focus on the integration of the main
     businesses acquired over the last years.

     The international advisory board is made up of leading Spanish
     and foreign personalities who are not members of the Bank’s
     board.

     It is currently composed of the following 8 members,
     representing 6 nationalities:


     Chairman          Mr Antonino Fernández,
                       former chairman of Grupo Modelo in Mexico
     Members           Mr Bernard de Combret,
                       chairman of Total Trading Geneve
                       Mr Carlos Fernández González,
                       chairman and executive vice president
                       of Grupo Modelo in Mexico
                       Mr Santiago Foncillas,
                       former chairman of Grupo Dragados
                       Mr Richard N. Gardner,
                       former US ambassador to Spain
                       Mr Francisco Pinto Balsemâo,
                       former prime minister of Portugal
                       Sir George Mathewson,
                       former chairman of the Royal Bank of Scotland
                       Mr Fernando Masaveu,
                       chairman of Grupo Masaveu
     Secretary         Mr Ignacio Benjumea Cabeza de Vaca


78                                                 ANNUAL REPORT 2010
ATTENDANCE AT MEETINGS OF                                                                                      ATTENDANCE AT BOARD MEETINGS
                                                                                                               %
THE BOARD OF DIRECTORS AND
ITS COMMITTEES IN 2010


                                                                                                                                                                    97.1
                                                                                                                                               92.7


                                                                                                                                                                              91.9

                                                                                                                                                                                     90.1
                                                                                                                                                          90.2
Pursuant to the Rules and Regulations of the Board (article
20.1), absences from meetings must be limited to unavoidable
cases. The average attendance rate at board of directors’
meetings in financial year 2010 was 90.1%.


                                                                                                                                             2006 2007 2008 2009 2010


                                                                                                              The attendance rate as present at meetings of the board has
                                                                                                              exceeded 90% in each of the last five years.


ATTENDANCE AT MEETINGS OF THE BOARD OF DIRECTORS AND ITS COMMITTEES IN 2010

                                                                                               Decision-making                                                                 Reporting

                                                                                                                                                                 Appointments               Technology,
                                                                                                                                      Audit and                          and                productivity
                                                                              Board        Executive                   Risk          compliance                  remuneration                and quality   International

Average attendance                                                          90.13%            92.18%              90.71%                  89.09%                           91.11%              100.00%         100.00%

Individual attendance
Mr Emilio Botín-Sanz de Sautuola y García de los Ríos                         12/12             50/55                     –                           –                          –                  2/2             1/1

Mr Fernando de Asúa Álvarez                                                   12/12             53/55                96/99                  11/11                             9/9                   2/2                   –

Mr Alfredo Sáenz Abad                                                         12/12             53/55                     –                           –                          –                  2/2             1/1

Mr Matías Rodríguez Inciarte                                                  12/12             55/55                99/99                            –                          –                    –                   –

Mr Manuel Soto Serrano                                                        11/12                   –                   –                 11/11                             9/9                   2/2                   –

Assicurazioni Generali S.p.A. (1)                                               9/12                  –                   –                           –                          –                    –                   –

Mr Antonio Basagoiti García-Tuñón                                             12/12             53/55                93/99                            –                          –                  2/2                   –

Ms Ana Patricia Botín-Sanz de Sautuola y O’Shea                               12/12             45/55                     –                           –                          –                  2/2             1/1

Mr Javier Botín-Sanz de Sautuola y O’Shea                                     11/12                   –                   –                           –                          –                    –                   –

Lord Burns (Terence)                                                            9/12                  –                   –                           –                          –                    –                   –

Mr Guillermo de la Dehesa Romero                                              12/12             52/55                     –                           –                       9/9                     –             1/1

Mr Rodrigo Echenique Gordillo (2)                                             12/12             49/55                     –                           –                       8/9                     –             1/1

Mr Antonio Escámez Torres                                                     10/12             53/55                88/99                            –                          –                  2/2             1/1

Mr Ángel Jado Becerro de Bengoa (3)                                               5/5                 –                   –                           –                          –                    –                   –

Mr Francisco Luzón López                                                      10/12             44/55                     –                           –                          –                    –             1/1

Mr Abel Matutes Juan                                                          11/12                   –                   –                   9/11                               –                    –             1/1

Mr Juan Rodríguez Inciarte                                                    12/12                   –              73/99                            –                          –                    –                   –

Mr Luis Ángel Rojo Duque                                                        3/12                  –                   –                   8/11                            6/9                     –                   –

Mr Luis Alberto Salazar-Simpson Bos                                           11/12                   –                   –                 10/11                                –                  2/2                   –

Ms Isabel Tocino Biscarolasaga                                                12/12                   –                   –                           –                          –                    –                   –


Note: the denominator refers to the number of meetings held during the year during which a director served as such or as a member of the respective committee.

(1) Represented on the board of the Bank by Mr Antoine Bernheim.
(2) Appointed as a member of the audit and compliance committee on 20 December 2010. From such date through the end of the year, this committee held no meetings.
(3) Appointed as a director by the shareholders at the general shareholders’ meeting held on 11 June 2010. He accepted his appointment on such date, and from then on, the board held 5 of its 12 meetings in the year.


         ANNUAL REPORT 2010                                                                                                                                                                                          79
3. SHAREHOLDER RIGHTS AND
   THE GENERAL SHAREHOLDERS’ MEETING


ONE SHARE, ONE VOTE, ONE DIVIDEND
NO DEFENSIVE MECHANISMS CONTEMPLATED IN THE BYLAWS


The Bank has eliminated all defensive mechanisms in                    ENCOURAGEMENT OF INFORMED
the Bylaws, fully conforming to the one share, one vote,
one dividend principle.                                                PARTICIPATION OF SHAREHOLDERS
                                                                       AT SHAREHOLDERS’ MEETINGS
The Bylaws of Banco Santander provide for only one class
of shares (ordinary shares), granting all holders thereof the          Noteworthy measures adopted by the Bank to encourage
same rights.                                                           informed participation of the shareholders at shareholders’
                                                                       meetings include the following:
There are no non-voting or multiple-voting shares, or preferences
                                                                       • Shareholders may attend meetings even if they hold only
in the distribution of dividends, or limitations on the number of
                                                                         one share.
votes that may be cast by a single shareholder, or quorum
requirements or qualified majorities other than those established      • Absence of a share blocking system to identify the persons
by law.                                                                  who are entitled to attend shareholders’ meetings. The only
                                                                         requirement is for any number of shares to be registered in
Any person is eligible for the position of director, subject only        the name of the shareholder five days prior to the date of the
to the limitations established by law.                                   meeting.
                                                                       • Remote attendance by means of data transmission and
                                                                         exercise of voting rights by postal correspondence, physical
QUORUM AT THE ANNUAL GENERAL                                             means and electronic communication.
SHAREHOLDERS’ MEETING HELD IN 2010                                     • Shareholders may exercise their right to receive information
                                                                         by sending an e-mail to the address
The informed participation of shareholders at general                    junta.accionistas@santander.com after the date the general
shareholders’ meetings is an objective expressly acknowledged            shareholders’ meeting is called.
by the board (article 31.3 of the Rules and Regulations of the         • Separate voting on matters such as the appointment of
Board).                                                                  directors and on articles or groups of articles which are
                                                                         substantially independent in the event of amendments to
The quorum at the 2010 annual general shareholders’ meeting              the Bylaws or to the Rules and Regulations for the General
was 55.854%, above 50% for the fourth consecutive year,                  Shareholders’ Meeting, except in the case of voting on the
despite the increase in the number of the Bank’s shareholders            full text of the Bylaws or of the Rules and Regulations for the
by almost 900 thousand over the last four years and its high             General Shareholders’ Meeting.
free float.


QUORUM AT THE ANNUAL GENERAL MEETINGS
% of capital present and by proxy
                                    56.6


                                                                55.8
                                                 54.6
                  54.3
     46.0


2006            2007            2008           2009             2010


80                                                                                                                ANNUAL REPORT 2010
• In addition, it is planned that the annual accounts and the            GENERAL SHAREHOLDERS’ MEETING
  corporate management of the Bank and its consolidated
  group, all for financial year 2010, be put to a vote under             HELD IN 2010
  separate items on the agenda at the 2011 annual general
  shareholders’ meeting.                                                 INFORMATION ON THE CALL TO MEETING,
                                                                         THE ESTABLISHMENT OF A QUORUM, ATTENDANCE,
• Granting of proxy to any person, whether or                            PROXY-GRANTING AND VOTING
  not a shareholder.
• Attendance of a notary to prepare the minutes of                       Annual general shareholders’ meeting of 11 June 2010
  the meeting.                                                           Notice of the call to meeting was published on 4 May, 38 days
                                                                         prior to the date of the meeting. A total of 326,826
The Bank usually calls general shareholders’ meetings by giving          shareholders attended, in person or by proxy, with
advance notice in excess of the minimum mandatory 30 days’               4,596,121,057 shares. The quorum was thus 55.854% of the
notice, and makes available to the shareholders, through the             share capital of the Bank.
Group’s website and from the date of publication of the
announcement, all relevant information, including the proposed           The average percentage of affirmative votes upon which the
resolutions submitted to the shareholders at the meeting.                proposals submitted by the board were approved was 96.937%.

                                                                         The following data are stated as percentages of the Bank’s
                                                                         share capital:
INFORMATION PROVIDED TO THE
SHAREHOLDERS AND COMMUNICATION                                           MEETING OF 11 JUNE 2010
WITH THEM                                                                Physically present                                                                     0.364% 1
                                                                         By proxy                                                                             34.840% 2
On occasion of the 2010 annual general shareholders’ meeting,
the chairman once again sent a letter to all shareholders inviting       Remote votes                                                                         20.651% 3
them to suggest the matters they would like to see dealt with,           Total                                                                                 55.854%v
without prejudice to their rights to receive information and
                                                                         (1) Of such percentage (0.364%), 0.002% is the percentage of share capital that attended by remote
make proposals.                                                              means through the Internet.
                                                                         (2) The percentage of share capital that granted proxies through the Internet was 0.015%.
849 letters and e-mails were received, all of which were                 (3) Of such percentage (20.651%), 20.647% is the percentage of votes cast by postal mail and
                                                                             0.004% is the percentage of electronic votes.
duly answered.

During 2010, the Bank held 661 meetings with investors and               Resolutions adopted at the shareholders’ meeting
maintained an on-going relationship with analysts and rating             held in 2010
agencies, which entailed personal contact with more than 1,350           The full text of the resolutions adopted at the 2010 annual
investors/analysts. For the third consecutive year, the                  general shareholders’ meeting is available on the websites of
department of relations with investors and analysts was chosen           both the Group (www.santander.com) and the CNMV
by investors (buy side) as the best IR Team in the financial             (www.cnmv.es).
industry in Europe, according to the survey conducted by the
specialised magazine Institutional Investor. The department also
continued to inform the main investors and analysts of the
Group’s policies in the area of corporate social responsibility.

Santander has continued to strengthen the channels for
shareholder information and service through the seven
Shareholder’s Offices it has in significant markets in which it is
present (Spain, United Kingdom, United States of America,
Brazil, Mexico, Portugal and Chile).

CHANNELS FOR SHAREHOLDER INFORMATION AND SERVICE
Telephone service lines                             247,057 questions
Shareholder’s mailbox                         20,704 e-mails answered
                                                 127,706 subscriptions

Forums                                             14,230 participants
                                                            179 held

Web                                                   1,430,542 visits
Letters                                      692,091 letters answered

Finally, in compliance with recommendations of the National
Securities Market Commission (Comisión Nacional del Mercado
de Valores or CNMV) on meetings with analysts and investors,
both notices of meetings and the documentation to be used
thereat are being published sufficiently in advance.


      ANNUAL REPORT 2010                                                                                                                                                 81
4. BANCO SANTANDER’S
   SENIOR MANAGEMENT


COMPOSITION
The Bank is managed at the highest level through the executive
vice presidents, under the control of the chairman and the chief
executive officer. Accordingly, the chairman, the chief executive
officer and the following executive vice presidents make up the
Bank’s senior management, regardless of their positions, if any,
on the board of directors:

BANCO SANTANDER’S SENIOR MANAGEMENT

America                                                                                          Mr Francisco Luzón López
                                                                                                 Mr Marcial Portela Álvarez
                                                                                               Mr Jesús Mª Zabalza Lotina
Internal Audit                                                                                      Mr Juan Guitard Marín
Global Wholesale Banking                                                                         Mr Adolfo Lagos Espinosa
                                                                                             Mr Jorge Maortua Ruiz-López
Global Private Banking, Asset Management and Insurance                                            Mr Javier Marín Romano
Banesto                                                                                           Mr José García Cantera*
Communication, Corporate Marketing and Research                                   Mr Juan Manuel Cendoya Méndez de Vigo
Unites States of America                                                                          Mr Jorge Morán Sánchez
                                                                                             Mr Juan Andrés Yanes Luciani
Strategy and Asia                                                                               Mr Juan Rodríguez Inciarte
Financial and Investor Relations                                                          Mr José Antonio Álvarez Álvarez
Financial Accounting and Control                                                            Mr José Manuel Tejón Borrajo
Human Resources                                                                               Mr José Luis Gómez Alciturri
Santander Branch Network - Spain                                                               Mr Enrique García Candelas
Risk                                                                                          Mr Matías Rodríguez Inciarte
                                                                                              Mr Javier Peralta de las Heras
                                                                                              Mr José María Espí Martínez
Consumer Financing                                                           Ms Magda Salarich Fernández de Valderrama
Santander Totta                                                                          Mr Nuno Manuel da Silva Amado
Santander UK                                                              Ms Ana Patricia Botín-Sanz de Sautuola y O’Shea
                                                                                                  Mr José María Nus Badía
General Secretariat                                                                Mr Ignacio Benjumea Cabeza de Vaca
                                                                                                  Mr César Ortega Gómez
                                                                                                 Mr Jaime Pérez Renovales
Technology and Operations                                                             Mr José María Fuster van Bendegem
* Chief executive officer of Banesto (he is not an executive vice president of Banco Santander).


In addition, Mr Ramón Tellaeche Bosch, a deputy executive vice
president of the Bank, is the head of the Means of Payment
division, and Mr José Antonio Villasante Cerro, also a deputy
executive vice president of the Bank, is the head of the
Santander Universidades global division.


82                                                                                                                             ANNUAL REPORT 2010
REMUNERATION
Information on the remuneration of executive vice presidents
is provided in note 5 of the Group’s legal report.


RELATED-PARTY TRANSACTIONS
AND CONFLICTS OF INTEREST
RELATED-PARTY TRANSACTIONS
To the knowledge of the Bank, no member of senior
management who is not a director, no person represented by
a member of senior management who is not a director, and no
company in which such persons or persons with whom they act
in concert or who act through nominees therein are directors,
members of senior management or significant shareholders,
has made any unusual or significant transaction with the Bank
during financial year 2010 and through the date of publication
of this report.

CONFLICTS OF INTEREST
The control mechanisms and the bodies in charge of resolving
this type of situation are described in the Code of Conduct in
Securities Markets, which is available on the Group’s website
(www.santander.com).


     ANNUAL REPORT 2010                                          83
5. TRANSPARENCY
   AND INDEPENDENCE


FINANCIAL INFORMATION AND OTHER                                     In addition, the Rules and Regulations of the Board establish
                                                                    limits upon hiring the audit firm for the provision of services
SIGNIFICANT INFORMATION                                             other than audit services that could jeopardise the
                                                                    independence thereof. In this connection, the audit and
FINANCIAL INFORMATION                                               compliance committee approves non-audit services provided to
Pursuant to the provisions of its Rules and Regulations (article    the Group by the auditor, which, in 2010, related mainly to the
34.2), the board has taken the necessary actions to ensure that     issuance of securities, tax advice, work related to capital
the quarterly and semi-annual financial information and the         requirements, preparation of financial studies and due diligence.
other information made available to the markets is prepared
following the same principles, standards and professional           The Rules and Regulations impose on the board the duty to
practices as are used to prepare the annual accounts. To such       make public the overall fees paid by the Bank to the auditor for
end, the aforementioned information is reviewed by the audit        services other than audit services. The information for financial
and compliance committee prior to the release thereof.              year 2010 is contained in note 48 of the Group’s legal report.
As regards the annual accounts, they are reported on by the audit   The Rules and Regulations determine the mechanisms to be
and compliance committee and certified by the head of financial     used to prepare the accounts such that there is no room for
accounting prior to the preparation thereof by the board.           qualifications in the auditor’s report. Nevertheless, the Bylaws
                                                                    as well as the Rules and Regulations also provide that, whenever
OTHER SIGNIFICANT INFORMATION                                       the board believes that its opinion must prevail, it shall provide
Pursuant to the provisions of the Code of Conduct in Securities     an explanation, through the chairman of the audit and
Markets, the compliance division is responsible for                 compliance committee, of the content and scope of the
communicating to the CNMV the significant information               discrepancy and shall endeavour to ensure that the auditor
generated in the Group.                                             informs in this regard. The annual accounts of the Bank and of
                                                                    the consolidated Group for financial year 2010 are submitted
Such communication shall be simultaneous to the release of          without qualifications.
significant information to the market or the media, as soon as
the decision in question is made or the resolution in question      At its meeting of 15 March 2011, the audit and compliance
has been signed or carried out. Significant information shall be    committee received from the auditor a written confirmation of
disseminated in a true, clear, complete and equitable fashion       its independence in respect of the Bank and the entities directly
and on a timely basis and, whenever practicable, such               or indirectly related thereto, as well as information regarding
information shall be quantified.                                    additional services of any kind provided to such entities by the
                                                                    auditors or by entities related thereto, pursuant to the provisions
In financial year 2010, the Bank published 85 material facts,       of Law 19/1988, of 12 July, on the Audit of Accounts.
which are available on the websites of the Group and the CNMV.
                                                                    At its meeting of 15 March 2011, such committee issued a
                                                                    report setting forth a favourable opinion regarding the
RELATIONSHIP WITH THE AUDITOR                                       independence of the auditors and passing, among other
                                                                    matters, upon the provision of the additional services mentioned
INDEPENDENCE OF THE AUDITOR                                         in the preceding paragraph.
The shareholders acting at the general shareholders’ meeting
of 11 June 2010 approved the re-election of Deloitte, S.L. as       The aforementioned report, issued prior to the audit report,
auditor for one year, with the affirmative vote of 98.430% of       has the content provided by the Securities Market Law (Ley del
the capital present in person or by proxy.                          Mercado de Valores).

The Bank has mechanisms in place to preserve the
independence of the auditor; worth noting is the obligation
of the board to refrain from hiring audit firms in which the fees
intended to be paid to them for any and all services are more
than two per cent of the total income thereof during the last
financial year.


84                                                                                                              ANNUAL REPORT 2010
INTRA-GROUP TRANSACTIONS                                          The announcement of the call to the 2011 annual general
                                                                  shareholders’ meeting will be viewable as from the date of
There were no intra-group transactions in financial year 2010     publication thereof, together with the information relating
that were not eliminated in the consolidation process and that    thereto, including proposed resolutions and mechanisms for
are not part of the ordinary course of business of the Bank or    the exercise of the rights to receive information, to grant proxies
of the companies of its Group as regards the purpose and          and to vote, as well as an explanation of the mechanisms for
conditions thereof.                                               the exercise of such rights by means of data transmission.

WEBSITE                                                           A new practice is that the announcement of the call to the 2011
                                                                  annual general shareholders’ meeting shall include the rules
Since 2004, the Group’s website (www.santander.com) has           applicable to the electronic shareholders’ forum that the Bank
disclosed in the Information for Shareholders and Investors       will make available on its website (www.santander.com) in order
section of the main menu all information required under article   to facilitate communication among the shareholders prior to
528 of the restated text of the Companies Law (Ley de             the meeting.
Sociedades de Capital) and under Order ECO/3722/2003, thus
carrying out the resolution adopted by the board at its meeting
of 23 January 2004.

The website contents are presented with specific sections for
institutional investors and shareholders and the information is
accessible in Spanish, English and Portuguese.

The following information is available on such website:
• The Bylaws.
• The Rules and Regulations for the General Shareholders’
  Meeting.
• The Rules and Regulations of the Board.
• The professional profiles of and other information regarding
  the directors, as proposed by Recommendation 28 of the
  Unified Code.
• The annual report.
• The annual corporate governance report.
• The Code of Conduct in Securities Markets.
• The General Code of Conduct.
• The sustainability report.
• The reports of the audit and compliance committee and the
  appointments and remuneration committee.
• The Santander-Banesto relationship framework established
  by application of recommendation 2 of the Unified Code.


             ANNUAL REPORT 2010                                                                                                    85
6. UNIFIED GOOD
   GOVERNANCE CODE


In 2007, Banco Santander carried out a process of adjustment        NUMBER OF MEMBERS OF
to the Unified Good Governance Code, approved by the
National Securities Market Commission (Comisión Nacional del        THE BOARD OF DIRECTORS
Mercado de Valores or CNMV) on 22 May 2006, based on the
                                                                    Although the current number of directors (20) exceeds the
principle of self-regulation, which was completed in 2008 with
                                                                    maximum number of 15 proposed by recommendation 9,
the approval of new Bylaws and, in 2009, with new Rules and
                                                                    the board believes that its size is commensurate to the scale,
Regulations of the Board.
                                                                    complexity and geographical diversification of the Group. In the
                                                                    opinion of the board, the manner in which it operates, sitting
Banco Santander follows practically all of the recommendations
                                                                    both as a full body and through committees —with delegated
of the Unified Code, and does not follow (i.e., does not adopt in
                                                                    supervisory, advisory, reporting and proposal-making powers—,
full) a small number of them (3 out of 58). Such
                                                                    guarantees its effectiveness and the participation of its
recommendations from which the Bank departs are described
                                                                    members.
in the following sections, together with the rationale for the
board’s position.


86                                                                                                            ANNUAL REPORT 2010
INDEPENDENT DIRECTORS                                               determined by the board following a report of the appointments
                                                                    and remuneration committee, with just cause being deemed to
The board believes that its unity is essential to determine its     exist whenever such director fails to perform the duties inherent
composition. All the directors must act in furtherance of the       in his position or if he becomes subject to any of the
interests of the Bank and of its shareholders and are equally       circumstances that deprive him of independence. In this case,
responsible for the decisions of the board. The board believes      the decision of the board not to adopt recommendation 31 is
that independence must apply to judgment, be an attribute of        also based on the fact that there may be reasons of corporate
all the directors, and be based on the probity, integrity,          interest which, in the opinion of the board itself, may lead to a
reputation and professionalism of each of them. In the opinion      proposal for withdrawal from the board for reasons other than
of the board, it would be contrary to such principles to            those contemplated in the recommendation.
establish a different treatment for independent directors than
for other directors.                                                The board has also not deemed it appropriate to adopt
                                                                    recommendation 29 to the effect that the term of office of
Accordingly, it believes that it would not be in keeping with the   independent directors be limited to a maximum of 12 years, as this
aforementioned principles to adopt the recommendation that          would lead to having to dispense with the services of directors
the board of directors not propose the withdrawal of any            whose continuation on the board serves the corporate interest
independent director prior to the expiration of the term fixed by   because of their qualifications, contribution and experience,
the bylaws for which he was appointed, except for just cause,       without such continuation affecting their independence.


     ANNUAL REPORT 2010                                                                                                             87
ECONOMIC AND FINANCIAL REVIEW


Photo: The headquarters of Santander UK, Triton Square, London, UK
88                                                                   ANNUAL REPORT 2010
90   CONSOLIDATED FINANCIAL REPORT

108   INFORMATION BY SEGMENTS
109      1. Principal segment or geographic areas
142      2. Secondary segments or by business
ECONOMIC AND
FINANCIAL REVIEW


GENERAL BACKGROUND
The global economy recovered strongly in 2010 from the                  Analysing in greater detail the main economies where the
recession in 2009 (-0.6%) and grew by around 5%, higher than            Group operates, the US economy grew 2.9% in 2010, following
the average of the decade before the world crisis (+4%). This           accelerated growth in the fourth quarter of 2.6% annualized,
recovery, which was firmer in the first half of the year, was           spurred by private consumption and the external sector (higher
fuelled, on the one hand, by the monetary and fiscal stimulus           exports and lower imports). Despite some weaknesses related to
measures adopted in the large developed economies to offset             the property sector and medium-sized banks, the extension of
weak domestic demand and, on the other, by the greater                  tax advantages, the incipient improvement in the labour market
growth capacity of emerging economies, particularly in Asia and         and the better financial position of companies point to
Latin America, which were less leveraged and with fewer                 continued economic expansion. Core inflation of less than 1%
growth restrictions and less affected by the downturn.                  (0.8%) and an unused surpluss from the producing capacity
                                                                        close to 6% of GDP enabled the Federal Reserve to launch a
These differences led to a two-speed recovery, with a faster            new programme of quantitative easing (purchase of $600 billion
pace of growth in emerging than in developed economies, a               of debt in eight months) and hold its key interest rate. These
trend which held until the last part of 2010 and the beginning          trends are not expected to change in the short term.
of 2011. However, the positive surprises in US and German
growth paint a panorama of a more solid recovery and more               Latin America benefited from a favourable external environment
balanced among regions in 2011, although still with                     (higher raw material prices and capital inflows) and from
uncertainties.                                                          stronger domestic demand. The region grew by more than an
                                                                        estimated 6% in 2010, with record growth in the second
• The US economy ended 2010 with signs of more buoyant                  quarter of 7.8%, largely due to the big economies.
  domestic demand (consumption and investment), although still
  incipient. In Germany, growth in the manufacturing sector,            Brazil’s growth slowed in the second half of 2010 and ended
  spurred by external demand, is also feeding through to                the year at 7.5% (-0.7% in 2009). This strong expansion put
  domestic demand via job creation and confidence. Meanwhile,           pressure on inflation which reached 5.6% in the fourth quarter,
  in the rest of Europe, the uncertainty over the fiscal situation in   well above the Bank of Brazil’s central objective of 4.5%.
  countries on the periphery of the euro zone such as Greece            Although the central bank held its Selic rate in the second half
  and the bail-out of the Irish banking system added in the             of the year in order to avoid a greater appreciation of the real
  second half of the year more risk to the euro zone.                   (the rate had risen by 2 p.p. to 10.75%), the evolution of
                                                                        inflation and its expectations led the bank to lift the Selic rate
• Emerging economies continue to grow strongly, driven by               at the beginning of 2011 (to 11.75% in mid March). This trend
  greater international trade, capital inflows, higher oil prices       is likely to continue in the coming months. The real
  and the strength of their domestic demand.                            strengthened during 2010 to BRL 1.66/$1.

     This strength, however, raises two challenges for its              Mexico, which surprised in the fourth quarter with high growth
     sustainability. On the one hand, the rise in inflation in many     (4.6%), grew by around 5.5% for the whole year, due to greater
     countries already growing above their potential and, on the        demand for its exports to the US and the pick up in domestic
     other, the large capital inflows which are strengthening their     demand. Inflation rose a little (4.4% in December), but is not
     currencies more than desired, particularly Latin America’s.        threatening growth, enabling the Bank of Mexico to hold its
     The economic policies of these countries face a complicated        rate at 4.5% since the end of 2009. As a result of these trends,
     challenge of controlling inflation without appreciating their      the peso appreciated to MXN 12.4/$1.
     currencies.


90                                                                                                                 ANNUAL REPORT 2010
SUMMARY OF 2010 FOR
                                                                       GRUPO SANTANDER
Chile’s growth was also surprisingly strong (7.2% year-on-year         Grupo Santander generated an attributable profit of EUR 8,181
in the third quarter) and around 5.4% for the whole of 2010.           million in 2010. This was the fourth consecutive year, since the
Inflation rose because of higher oil and some food prices (3% in       onset of the global crisis, that Santander’s profit exceeded EUR
December). After raising its interest rates to 3.25% in November       8,000 million (EUR 35,060 million in all). High and recurring
(0.5% at the beginning of the year), the Bank of Chile called a        generation of earnings make Santander the third bank in the
temporary halt to rises, which picked up again in 2011 to 3.5%.        world and the leading international one by the profits posted
The peso’s appreciation (CLP 468/$1) led to the launch of a            during this period, clearly above its competitors who have
programme to buy dollars in the currency markets in order to try       higher levels of assets and capital.
to moderate the strength of the peso.
                                                                       In a complex environment in the many markets where it
The euro zone grew by 1.7% in 2010, following a fourth                 operates, Santander again proved the resistance of its business
quarter (1.1% annualized) that maintained the tone and pointed         model, which, with a differentiated management, is adapted to
to stronger growth in early 2011. Inflation, which rose because        the various markets and environments and enables it to
of higher oil prices, ended the year at 2.2%, above the target of      generate high recurring profits while also preparing the income
the European Central Bank (ECB) which, however, held its repo          statement for the coming years.
rate at 1% in 2010.
                                                                       The drivers behind this model are a focus on the customer and
Rising oil prices at the beginning of 2011 are putting pressure        on retail business, geographic diversification and continuous
on inflation, leading the European Central Bank to tighten its         efforts to improve commercial efficiency, prudent risk
anti-inflation stance. All of this increases the probability of a      management and discipline in capital and liquidity, all of which
preventive rise in interest rates in the first half of 2011 in order   is strengthened by the Santander brand, recognized as one of
to anchor inflation expectations. The euro strengthened in the         the world’s main financial brands.
last months of 2010 to EUR/$1.34 and is maintaining this trend
in 2011 because of the new interest rate expectations.                 Six key features sum up management of Grupo Santander in
                                                                       2010:
European activity continues to be largely backed by Germany
(3.5% GDP growth for the whole year). Of note is the better            1) Solid generation of profits. Attributable profit of EUR
performance in manufactures, exports and investment which,                8,181 million was 8.5% lower than in 2009 and earnings per
according to the latest data on confidence and the good level of          share were EUR 0.9418.
job creation, is already feeding through to domestic demand.
                                                                          The profit includes the impact of the EUR 693 million (EUR
The Spanish economy did better than expected in 2010, with                472 million after tax) allowance resulting from the new Bank
zero growth in the third quarter and 0.2% in the fourth. Growth           of Spain regulations on provisions (Circular 3/10) and their
for the whole year was 0.1% negative. Consumption declined in             application under criteria of maximum prudence. Excluding
the second half of the year (purchases were brought forward in            this effect, attributable profit would have been EUR 8,653
the first half because of the rise in VAT as of July), while the          million (-3.2%) and earnings per share EUR 0.9961.
external sector led growth.
                                                                          The income statement reflects the diversification and focuses
The slightly better growth figure, however, was not sufficient to         of management adapted to each market:
create jobs and the unemployment rate topped 20%. Higher oil
prices and taxes (tobacco) pushed up inflation to 3% in                   – Profits grew strongly in emerging markets (Brazil and the
December, a trend that intensifies at the beginning of 2011.                rest of Latin America), which recovered pre-crisis business
                                                                            levels. There was also growth in developed countries with
The UK ended 2010 with a sharp deceleration in growth (-2.1%                still weak macroeconomic environments but which are
annualized in the fourth quarter), largely due to severe weather            benefiting from their business moment (restructuring in the
conditions, after a good third quarter (+2.9%). Growth for the              UK and the US, consumer business ahead of the cycle). All
whole year was 1.4%, a trend which is likely to be maintained.              of this is offsetting the sharp fall in profits in Spain and
Inflation continued to be high (3.7%), partly due to the rise in            Portugal, affected by intense processes of deleveraging.
indirect taxes and sterling’s slide.
                                                                          – Of note was the consistency of basic revenues. Active
In this context, the Bank of England held its base rate at 0.5%             management of spreads was vital here to soften the
throughout the year, although inflationary pressures make a rise            impact of low growth in lending, with interest rates at
in the rate more probable in the first half of 2011. Sterling               lows, particularly in developed markets, and higher
strengthened a little against the euro (EUR 1/£0.86).                       financing costs. Gross income rose 6.8% and net interest
                                                                            income 11.1%.


     ANNUAL REPORT 2010                                                                                                                   91
– Good management of total operating costs which                  5) High shareholder remuneration. The total shareholder
       increased 2.0% excluding a small perimeter effect and the          return in 2010 was EUR 0.60 per share, including the scrip
       impact of exchange rates. The efficiency ratio of 43.3%            dividends, the same as in 2009. A total of EUR 4,999 million
       was at the level of the best of our peers.                         was distributed among shareholders.

     – Strict management of risk reduced provisions for possible          Recurring profits and solid capital are the keys to making
       loan losses in the large units and countries except for            Santander the international bank that best remunerated its
       Spain. Recurring provisions (excluding the impact of the           shareholders in the last three years (more than EUR 14,700
       regulatory change) were 8.5% lower excluding the                   million).
       perimeter and exchange rate effects.
                                                                       6) Better strategic positioning of the Group. Santander
2) Improved trend in credit quality ratios. Non-performing                continued to combine organic growth initiatives with various
   loan (NPL) entries and the risk premium for both the Group             agreements to boost its presence in emerging and mature
   as a whole and for the large business units dropped.                   countries, enabling it to end the year in a well diversified
                                                                          position and with greater growth potential.
     This produced a notably slower rate of growth in the Group’s
     NPL ratio, which ended 2010 at 3.55% (up 0.31 p.p.                   Among the first was:
     compared to more than one point in 2009). Of note was the
     trend in Santander Consumer Finance, Brazil and Sovereign.           – The agreement to acquire 25% of the minority interests in
     Coverage remained virtually stable at 73%. The NPL ratio in            Mexico, an operation completed in September.
     Spain was 4.24% and coverage 58%.
                                                                          – Purchase of Bank Zachodni WBK, the third largest Polish
3) Significant improvement in the financing structure                       bank by branches and profits. Once the Polish authorities
   and in the Group’s liquidity ratios. The loan-to-deposit                 have authorized this operation, an acquisition offer for all
   ratio was 117%, down from 135% in 2009 and 150% in                       of the bank’s capital was made. After its completion, the
   2008. This was made possible by the strategy to capture                  Group’s participation will be 95.67%.
   retail funds, which aimed to gain market share and improve
   the financing structure with more stable deposits. This                As regards developed countries
   strategy increased the Group’s deposits by EUR 109,400
   million, well above the rise in lending (+EUR 41,600 million),         – The retail business of Skandinaviska Enskilda Banken (SEB
   which was more stable as a result of the deleveraging                    Group) in Germany was acquired. This operation was
   process in mature markets.                                               completed in January 2011 and enables the Group to
                                                                            almost double its branch network in Germany.
     The Group also developed a very conservative policy in
     medium-and long-term issues, which exceeded the year’s               – Agreement was reached with The Royal Bank of Scotland
     maturities.                                                            to acquire 311 RBS branches in England and Wales and
                                                                            seven NatWest branches in Scotland, as well as 40 banking
4) Further rise in solvency. The Group’s core capital ratio at              centres for SMEs, four centres for company banking and
   the end of 2010 was 8.80%, above 2009’s 8.61%. The                       three for private banking. This agreement is yet another
   generation of free capital, thanks to solid results and                  significant strategic step for Santander UK, as it increases
   management of risk assets, together with the positive impact             our distribution and cross-selling capacity, and accelerates
   of the two scrip dividends, which were accepted by 84% and               growth in the SMEs segment, where the Group’s market
   87% of shareholders respectively, enabled the Group to                   share is lower than that corresponding to its presence.
   improve its core capital for the fourth year in a row.
                                                                          These operations, which will be completed, for the most
     The ratio is very solid, as befits our business model and risk       part, during 2011, paint a profile of strong growth for
     profile and places us in a comfortable position to meet the          Santander in the coming years. The units in emerging
     new Basel requirements and the stricter ones recently                countries, those with the best macroeconomic outlook,
     approved by Spain's regulators.                                      today account for around 45% of the Group’s profits (in a


EXCHANGE RATES: 1 EURO / CURRENCY PARITY
                                                                                              2010                                  2009
                                                                        Year-end            Average           Year-end            Average

US$                                                                       1.3362            1.3228              1.4406             1.3906
Pound sterling                                                            0.8608            0.8570              0.8881             0.8901
Brazilian real                                                            2.2177            2.3262              2.5113             2.7577
New Mexican peso                                                         16.5475           16.6997             18.9223            18.7756
Chilean peso                                                            625.2748          673.9214            730.7444           775.2659
Argentine peso                                                            5.3074            5.1737              5.4761             5.1760
Colombian peso                                                        2,565.5040        2,507.2221          2,949.6285         2,984.2729
Uruguayan peso                                                           26.5904           26.4588             28.1637            31.2598


92                                                                                                                 ANNUAL REPORT 2010
pro forma statement including Poland), developed countries       RATING AGENCIES
   with faster prospects of recovery produce about 40% and the
   rest, in markets still undergoing adjustments, generate less     The Group’s AA rating for long-term debt with the four main
   than 20%.                                                        agencies was affirmed in the latest reviews, making Santander
                                                                    one of the few international banks with such a rating or higher
The main developments of geographic areas were as follows:          with all of them.

• Continental Europe: attributable profit of EUR 3,885              The main features of the latest reviews are set out below.
  million, 22.8% less than in 2009 and hit by the environment
  of low growth and deleveraging and by the Bank of Spain’s         • Standard & Poor’s affirmed in July 2010 the AA rating, valuing
  new regulations on provisions. Excluding this, profit was           the strength of the Bank’s business, the high degree of
  13.4% lower. The profits of the three commercial networks           geographic diversification, the soundness of business shares in
  were lower but that of Santander Consumer Finance was               core markets, the success and good execution of the strategy,
  28.9% higher.                                                       the strong resistance of net operating income and the
                                                                      Group’s solid capitalisation. The continued negative outlook
• United Kingdom: attributable profit £1,701 million (EUR             reflects the difficult macroeconomic situation in Spain and
  1,985 million), 10.7% more than in 2009. This was the sixth         globally.
  straight year of double-digit growth in profits. The efficiency
  ratio was 39.4%, clearly better than our competitors in the       • In September, Fitch Ratings affirmed Banco Santander’s AA
  UK.                                                                 rating and maintained the stable outlook, valuing the strategic
                                                                      sense of the acquisitions as they were mainly in markets
• Latin America: attributable profit of EUR 4,804 million             where the Bank is already present. It also affirmed that the
  (+25.3%). In local currency, and excluding the impact of            businesses incorporated complement the fundamental activity
  minority interests and discontinued operations, profit              of retail banking and provide the Group with greater
  increased 17.0%, due to net interest income (+6.2%), costs          geographic diversification.
  (+4.5%) rising below the inflation rate and lower needs for
  provisions (-19.5%).                                                Fitch also stressed the strength of the retail franchises in core
                                                                      markets, the quality of management and their strategy, the
   Both the area as a whole as well as the main countries, led        robustness of profits, the diversification and good mix of
   by Brazil, ended 2010 with lending growth of around 15% or         business and the quality of the risk systems.
   higher. All began the year with negative growth rates.
                                                                    • DBRS confirmed in February 2011 the AA rating, and stable
• Sovereign: attributable profit of EUR 424 million ($561             outlook, following the presentation of the Group’s results and
  million) compared to losses in 2009. Since its incorporation to     emphasizing the strong international diversification and high
  the Group, Sovereign’s contribution has improved quarter            level of efficiency.
  after quarter, backed by a good evolution of revenues, costs
  and provisions, which has enabled the bank to exceed the          • On March 24, 2011, under the review with negative outlook
  targets announced at the time of the purchase.                      of 30 Spanish banks last December, Moody's reaffirmed the
                                                                      Aa2 rating of Banco Santander's senior debt due to its strong
Corporate Activities: covers a series of centralised activities       financial strength.
and acts as the Group’s holding. As a result its contribution to
results is usually negative.                                        RATING AGENCIES
                                                                                                      Long          Short       Financial
The area made a loss of EUR 2,918 million in 2010 compared                                            term           term       strength
to a loss of EUR 1,632 million in 2009. This was mainly due to      Standard & Poor’s                   AA           A1 +
lower net interest income and to losses in financial                Fitch Ratings                       AA            F1 +           A/B
transactions, basically in hedging positions of exchange rates      Moody’s                            Aa2              P1            B-
and to lower revenues from hedging interest rates in financings     DBRS                                AA        R1(high)
of a structural nature.


     ANNUAL REPORT 2010                                                                                                                93
GRUPO SANTANDER. RESULTS                                                                   Grupo Santander showed in 2010 its capacity to produce
                                                                                           recurring profits in a difficult environment. Geographic
                                                                                           diversification and differentiated management on the basis of
• The Group once again showed its capacity to generate                                     each market’s conditions resulted in an attributable profit of
  recurring profits: more than EUR 8,000 million a year in                                 EUR 8,181 million, 8.5% less than in 2009. Earnings per share
  the last four years of crisis                                                            were EUR 0.9418.
• The income statement reflects the management’s focal
                                                                                           In order to better interpret the results, several aspects need to
  points:
                                                                                           be taken into account.
     – Gross income at a record high, due to resistance to
       the cycle in developed markets and recovery in                                      • The first is the impact on results of the change in the Bank
       emerging markets.                                                                     of Spain’s regulations on provisions, which came into force
                                                                                             on September 30. These regulations unify and accelerate the
     – Flexibility in costs and generation of synergies.                                     calendars for provisions for all bad loans, and this meant a
                                                                                             one-off and extraordinary provision in the third quarter (in
     – Active managemengt of risks and recoveries.                                           the units in Spain) of EUR 693 million. Its after tax impact on
                                                                                             attributable profit was EUR 472 million.
• Profits benefiting from diversification: double-digit
  growth in the UK, Latin America, Sovereign and                                              The Group has been prudent, both in the criteria used for
  Santander Consumer Finance.                                                                 applying the Circular as well as charging all of the provision
                                                                                              to the year’s profits, without offsetting its impact through
                                                                                              the release of generic provisions.


INCOME STATEMENT
Million euros
                                                                                                                                Variation
                                                                                            2010                2009             Amount                    %                2008

Net interest income                                                                       29,224              26,299               2,926                11.1             20,945
Dividends                                                                                     362                 436                  (74)            (17.0)                553
Income from equity-accounted method                                                             17                  (1)                 17                 —                 117
Net fees                                                                                    9,734               9,080                 654                 7.2              9,020
Gains (losses) on financial transactions                                                    2,606               3,423                (817)             (23.9)              2,597
Other operating income/expenses                                                               106                 144                  (38)            (26.2)                258
Gross income                                                                              42,049              39,381               2,668                  6.8            33,489
Operating expenses                                                                       (18,196)            (16,421)             (1,775)                10.8           (14,949)
  General administrative expenses                                                        (16,256)            (14,825)             (1,431)                 9.7           (13,580)
     Personnel                                                                             (9,330)             (8,450)               (879)               10.4             (7,758)
      Other general administrative expenses                                                (6,926)             (6,374)               (552)                8.7             (5,822)
  Depreciation and amortisation                                                            (1,940)             (1,596)               (344)               21.5             (1,370)
Net operating income                                                                      23,853              22,960                  893                 3.9            18,540
Net loan-loss provisions                                                                 (10,258)              (9,484)               (774)                8.2             (6,601)
Impairment losses on other assets                                                            (471)               (402)                 (69)              17.3                 (91)
Other income                                                                               (1,072)             (1,311)                 239             (18.2)               (426)
Profit before taxes (w/o capital gains)                                                   12,052              11,764                  288                 2.4            11,421
Tax on profit                                                                              (2,923)             (2,336)               (587)               25.1             (2,391)
Profit from continuing operations (w/o capital gains)                                       9,129               9,427               (299)               (3.2)              9,030
Net profit from discontinued operations                                                        (27)                 31                 (58)                —                  319
Consolidated profit (w/o capital gains)                                                     9,102               9,458               (356)               (3.8)              9,349
Minority interests                                                                             921                 516                 405               78.6                 473
Attributable profit to the Group (w/o capital gains)                                        8,181               8,943               (762)               (8.5)              8,876
Net extraordinary capital gains and allowances (1)                                               —                  —                    —                 —                    —
Attributable profit to the Group (2)                                                        8,181               8,943               (762)               (8.5)              8,876

EPS (euros) (2) (3)                                                                      0.9418              1.0454            (0.1036)                 (9.9)            1.2207
Diluted EPS (euros) (3)                                                                  0.9356              1.0382            (0.1026)                 (9.9)            1.2133

Pro memoria:
  Average total assets                                                                1,190,361           1,099,018               91,343                  8.3           970,413
  Average shareholders' equity                                                           69,334              64,335                4,999                  7.8            51,986
(1).- In 2008 and 2009 extraordinary capital gains and extraordinary allowances for the same amount are included, and thus the net amount is zero.
(2).- In 2010, before the impact from the application of Bank of Spain’s Circular 3/2010, attributable profit to the Group EUR 8,653 million (-3.2%) and EPS EUR 0.9961 (-4.7%).
(3).- 2008 data have been adjusted to the capital increase with preemptive rights at the end of 2008.


94                                                                                                                                                   ANNUAL REPORT 2010
• There is a small positive perimeter impact from the                                         against the euro. The impact with regard to the euro was
  consolidation of 11 months of Sovereign by global                                           around +8 p.p. for the whole Group, +4 p.p. in the United
  integration in 2009 and the incorporation into Santander                                    Kingdom, 16 p.p. in Latin America and 5/6 p.p. in Sovereign.
  Consumer Finance of Triad, HSBC and AIG portfolios, and a
  small negative impact of around one percentage point from                                   This positive effect in the operating areas was partly offset in
  the sale of Banco de Venezuela in 2009. This bank’s results                                 Corporate Activities by the losses recorded in hedging
  in the months when it consolidated have been eliminated                                     positions.
  from the various items of the income statement and
  recorded in discontinued operations.                                                     The performance of the income statement and comparisons
                                                                                           with 2009 was as follows:
• There was also a negative effect of some 5 percentage
  points from higher minority interests, the net effect between                            Net interest income continued to be the main driver of
  the placement of Banco Santander Brazil shares, mainly in                                revenue growth. It increased 11.1% to EUR 29,224 million.
  October 2009, and the acquisition, in September 2010, of                                 This was due to a moderate increase in volumes and
  the minority interests of Santander Mexico in the hands of                               appropriate management of spreads in all units, adapted in
  Bank of America.                                                                         each case to the particular circumstances of markets.

• Lastly, the comparison of gross income and expenses is                                   The spreads on loans for the Group as a whole increased from
  affected by the evolution of the average exchange rates of                               3.1% to 3.4%, mainly due to the UK and Sovereign, as well as
  sterling, the dollar and the main Latin American currencies                              consumer businesses and wholesale banking.


QUARTERLY
Million euros
                                                                                                                   2009                                                    2010
                                                                               Q1           Q2           Q3           Q4                Q1           Q2             Q3        Q4

Net interest income                                                        6,039        6,617        6,822        6,820             7,122        7,378        7,396        7,329
Dividends                                                                      87         153            94         102                 47         144            60         111
Income from equity-accounted method                                           (13)          10             1           2                 3             5            5           4
Net fees                                                                   2,164        2,374        2,291        2,252             2,326        2,483        2,481        2,445
Gains (losses) on financial transactions                                     862          977          777          806               724          567          599          715
Other operating income/expenses                                                80           16           19           29                38           38           22            9
Gross income                                                               9,221      10,147       10,004       10,010            10,260       10,614       10,563       10,613
Operating expenses                                                        (3,967)      (4,087)      (4,086)      (4,282)           (4,263)      (4,548)      (4,687)      (4,698)
  General administrative expenses                                         (3,587)      (3,681)      (3,679)      (3,877)           (3,812)      (4,070)      (4,206)      (4,168)
      Personnel                                                           (2,059)      (2,106)      (2,095)      (2,190)           (2,182)      (2,317)      (2,408)      (2,421)
      Other general administrative expenses                               (1,529)      (1,575)      (1,583)      (1,687)           (1,629)      (1,753)      (1,798)      (1,746)
  Depreciation and amortisation                                             (379)        (405)        (407)        (405)             (451)        (478)        (481)        (531)
Net operating income                                                       5,254        6,060        5,918        5,728             5,997        6,066        5,876        5,915
Net loan-loss provisions                                                  (2,209)      (2,417)      (2,574)      (2,284)           (2,436)      (2,483)      (2,935)      (2,404)
Impairment losses on other assets                                             (25)       (241)          (42)         (94)              (57)         (63)         (41)       (310)
Other income                                                                (278)        (232)        (418)        (382)             (331)        (362)        (364)          (16)
Profit before taxes (w/o capital gains)                                    2,742        3,171        2,883        2,967             3,173        3,158        2,535        3,186
Tax on profit                                                               (614)        (629)        (559)        (535)             (734)        (680)        (634)        (874)
Profit from continuing operations (w/o capital gains)                      2,128        2,542        2,325        2,432             2,439        2,477        1,901        2,311
Net profit from discontinued operations                                         67          (6)           (7)        (23)              (12)           (1)          (4)        (10)
Consolidated profit (w/o capital gains)                                    2,195        2,536        2,318        2,409             2,427        2,476        1,897        2,301
Minority interests                                                              99         113            97         207               212          246          262          201
Attributable profit to the Group (w/o capital gains)                       2,096        2,423        2,221        2,202             2,215        2,230        1,635        2,101
Net extraordinary capital gains and allowances (1)                              —           —             —            —                 —            —            —            —
Attributable profit to the Group (2)                                       2,096        2,423        2,221        2,202             2,215        2,230        1,635        2,101

EPS (euros) (2)                                                          0.2472       0.2846       0.2588       0.2547            0.2553       0.2574       0.1884       0.2408
Diluted EPS (euros)                                                      0.2460       0.2831       0.2584       0.2508            0.2537       0.2558       0.1854       0.2406
(1).- In 2009 extraordinary capital gains and extraordinary allowances for the same amount are included, and thus the net amount is zero.
(2).- In Q3'10, before the impact from the application of Bank of Spain’s Circular 3/2010, attributable profit to the Group EUR 2,107 million and EPS EUR 0.2429.


       ANNUAL REPORT 2010                                                                                                                                                       95
NET INTEREST INCOME
Million euros
                                                     +11.1%         NET FEES
                                                                    Million euros
                                                                                                                                     +7.2%
                                                      2010-2009                                                                       2010-2009


                                            29,224


                                                                                                                  9,734
                                  26,299
                        20,945


                                                                                                        9,080
                                                                                             9,020
                      2008       2009      2010                                             2008      2009       2010


Spreads on deposits were affected by the lower interest rates       Gross income increased 6.8% to EUR 42,049 million.
in the commercial units and the Group’s policy of giving            Excluding the perimeter and exchange-rate impact, it declined
priority to capturing deposits and liquidity, particularly in the   2.2% due to Corporate Activities as operating areas repeated
European units, as in Latin America spreads are much more           the figure of 2009.
stable. The higher cost of wholesale financing is also reflected.
                                                                    The favourable evolution of revenues was due to the progress
Net fee income increased 7.2%, with a favourable                    (excluding the exchange-rate impact) in the UK, Brazil and
performance of those from insurance, cards, administration of       Sovereign, which offset the lower contributions of Continental
accounts and pension funds.                                         Europe, more affected by the conditions of the market in
                                                                    which activity is conducted, and the rest of Latin America,
If to net interest income and fee income we add revenues            where two factors were at play. The first was the weakness of
from insurance activity (+11.5%), the most commercial and           business volumes in the first half of the year and the second,
recurring revenues increased 10.1% to EUR 39,336 million.           the change of mix toward low risk products, which meant
Apart from Continental Europe, all areas evolved positively.        lower revenues but also a reduced cost of credit. The evolution
                                                                    of revenues thus needs to be seen jointly with provisions.
Dividends received dropped from EUR 436 million in 2009 to
EUR 362 million, largely due to the reduced ones following the      Operating expenses rose 2.0% excluding the perimeter and
placement of Visanet, as well as some companies bringing            exchange-rate effects.
forward payment of dividends to the fourth quarter. Income by
the equity accounted method was EUR 17 million compared to          All units in continental Europe and the UK reduced their costs
a loss of EUR 1 million in 2009.                                    a little. Sovereign’s reduction was the largest because of
                                                                    synergies, while Brazil’s and Mexico’s increased at a slower
Gains on financial transactions declined 23.9%, due to              pace than the inflation rate. The only noteworthy rises were in
Corporate Activities, where the cost of hedging exchange rates      Chile, because of the impact of the earthquake, the signing of
is recorded, and to lower results in some Latin American            a collective bargaining agreement and business dynamics,
countries (due to the sale of portfolios in 2009). Good             Argentina (collective agreement at rates of 23%) and Global
performance of revenues from wholesale businesses in Europe,        Banking and Markets (investments made to consolidate
mainly from customers.                                              positions reached in 2009 in its main markets).


NET FEES
Million euros
                                                                                                     Variation
                                                                    2010            2009              Amount                   %               2008

Commissions from services                                           5,632           5,267                  366                6.9         4,799
Mutual & pension funds                                              1,267           1,178                   89                7.5         1,627
Securities services                                                   784             774                   10                1.3           732
Insurance                                                           2,051           1,861                  190               10.2         1,862
Net fees                                                            9,734           9,080                  654                7.2         9,020


96                                                                                                                        ANNUAL REPORT 2010
GROSS INCOME AND EXPENSES
Million euros
                                                                                         NET OPERATING INCOME                                              +3.9%
                                                                                         Million euros                                                     2010-2009


                                                               42,049
                                   39,381


                                                                                                                                         23,853
       33,489


                                                                                                                              22,960
                                                                                                                   18,540
                                                                               18,196
                                                   16,421
                       14,949


   Gross inc. Expenses          Gross inc. Expenses         Gross inc. Expenses

                2008                        2009                        2010                                      2008       2009       2010


The efficiency ratio including amortisations was 43.3%                                   perimeter and exchange-rate effects, provisions declined
(38.7% excluding them). Good evolution in the UK and,                                    8.5%.
particularly, at Sovereign where in just two years the ratio
improved from 74.5% at the time of its integration into the                              This reduction was due to lower provisions in Latin America
Group to 44.5% (close to the Group’s average).                                           (-19.5% excluding the forex impact), which is beginning to
                                                                                         benefit from the improvement in the economic cycle and the
Revenue growth and control of expenses lifted net operating                              change of mix of products, and the good trend in the UK
income by 3.9% to EUR 23,853 million, all of it due to the                               and Sovereign.
operating areas. Eliminating the favourable perimeter and
exchange rate impact, costs were almost the same as in 2009,                             Spain and Portugal, on the other hand, still required higher
thanks to Brazil, the UK and Sovereign.                                                  provisions in 2010 because of the increase in bad loans and
                                                                                         the Bank of Spain’s Circular.
This underscored the Group’s capacity to keep on generating
revenues in the current difficult environment and absorb the                             Net operating income after provisions was EUR 13,595
larger provisions resulting from the environment and changes                             million. Of note by units were the strong rises (all excluding the
in regulations. Net operating income was 2.3 times more than                             forex impact) in the UK (+15.0%), Brazil (+16.6%), Latin America
the provisions made during the period. Provisions represented                            excluding Brazil (+11.7%), Santander Consumer Finance
3.4% of the Group’s loans.                                                               (+31.5%) and Sovereign (from EUR 11 million to EUR 659
                                                                                         million). Decline in Spain and Portugal.
Loan-loss provisions increased 8.2% to EUR 10,258 million,
due to the change in regulations. Excluding this and the                                 Asset impairment losses and other results and


OPERATING EXPENSES
Million euros
                                                                                                                            Variation
                                                                                         2010              2009              Amount                  %           2008

Personnel expenses                                                                       9,330            8,450                 879                10.4        7,758
General expenses                                                                         6,926            6,374                 552                 8.7        5,822
  Information technology                                                                   798              786                  12                 1.6          668
  Communications                                                                           670              632                  39                 6.1          609
  Advertising                                                                              634              594                  39                 6.6          632
  Buildings and premises                                                                 1,553            1,405                 148                10.6        1,167
  Printed and office material                                                              178              209                 (31)              (14.8)         173
  Taxes (other than profit tax)                                                            376              313                  63                20.2          284
  Other expenses                                                                         2,718            2,436                 282                11.6        2,290
Personnel and general expenses                                                          16,256           14,825               1,431                 9.7       13,580
Depreciation and amortisation                                                            1,940            1,596                 344                21.5        1,370
Total operating expenses                                                                18,196           16,421               1,775                10.8       14,949


      ANNUAL REPORT 2010                                                                                                                                               97
NET LOAN-LOSS PROVISIONS
Million euros
                                                                                                                 Variation
                                                                     2010                    2009                 Amount                           %                2008

Non performing loans                                                11,457                 10,516                       942                      9.0               7,306
Country-risk                                                             2                   (117)                      119                       —                  100
Recovery of written-off assets                                      (1,201)                  (915)                     (287)                    31.3                (805)
Total                                                              10,258                   9,484                       774                      8.2               6,601


provisions, which reflect allowances for possible                   operations (impact of the sale of Banco de Venezuela) and
contingencies, were EUR 1,543 million negative compared to          minority interests (placement of shares of Banco Santander
EUR 1,713 million also negative in 2009. In 2010 there were         Brazil and purchase of 25% of Santander Mexico), was 8.5%
larger allowances in operating areas, while in 2009 the             lower at EUR 8,181 million.
centralised ones (premises, pensions and others such as
Metrovacesa) were larger.                                           Earnings per share were EUR 0.9418, 9.9% lower than in
                                                                    2009. Despite this, the Group’s solid financial position and
Profit before tax was EUR 12,052 million, up 2.4%. This did         recurring profits since the start of the crisis enabled us to
not feed through to attributable profit, however, because of        maintain shareholder remuneration in 2010 at EUR 0.60 per
the higher tax charge and minority interests, which together        share.
absorbed around 5 p.p. of growth each one.

After the tax charge, the profit from continued operations was
3.2% lower.

Attributable profit, after incorporating discontinued


PROFIT BEFORE TAX                                      +2.4%        ATTRIBUTABLE PROFIT TO THE GROUP                                                         -8.5%
Million euros                                          2010-2009    Million euros                                                                             2010-2009
                                                                                                                     8,943
                                                                                                        8,876
                                              12,052


                                                                                                                                  8,181
                                    11,764
                          11,421


                        2008       2009      2010                                                     2008        2009         2010(1)

                                                                    (1) Before the impact from the application of Bank of Spain’s Circular 3/2010: 8,653 million


98                                                                                                                                         ANNUAL REPORT 2010
BALANCE SHEET
Million euros
                                                                                         Variation
                                                                  2010          2009      Amount           %          2008
ASSETS
Cash on hand and deposits at central banks                      77,785        34,889       42,896      122.9        45,781
Trading portfolio                                              156,762       135,054       21,707       16.1       151,817
   Debt securities                                              57,871        49,921        7,951       15.9        43,896
   Customer loans                                                  755        10,076       (9,321)     (92.5)          684
   Equities                                                      8,850         9,248         (398)       (4.3)       6,272
   Trading derivatives                                          73,069        59,856       13,212       22.1        95,815
   Deposits from credit institutions                            16,216         5,953       10,263      172.4         5,150
Other financial assets at fair value                            39,480        37,814        1,667         4.4       25,817
   Customer loans                                                7,777         8,329         (551)       (6.6)       8,973
   Other (deposits at credit institutions, debt securities
     and equities)                                               31,703        29,485        2,218        7.5        16,844
Available-for-sale financial assets                              86,235        86,621         (386)      (0.4)       48,920
   Debt securities                                               79,689        79,289          399        0.5        42,548
   Equities                                                       6,546         7,331         (785)    (10.7)         6,373
Loans                                                           768,858       736,746      32,112         4.4       699,615
   Deposits at credit institutions                               44,808        57,641     (12,833)     (22.3)        64,731
   Customer loans                                               715,621       664,146      51,475         7.8       617,231
   Debt securities                                                8,429        14,959       (6,530)    (43.7)        17,653
Investments                                                         273           164          108      65.9          1,323
Intangible assets and property and equipment                     14,584        11,774        2,810      23.9         10,289
Goodwill                                                         24,622        22,865        1,757         7.7       18,836
Other                                                            48,901        44,602        4,300         9.6       47,233
Total assets                                                 1,217,501     1,110,529     106,971          9.6    1,049,632

LIABILITIES AND SHAREHOLDERS' EQUITY
Trading portfolio                                               136,772       115,516       21,255      18.4        136,620
   Customer deposits                                              7,849         4,658        3,191      68.5          4,896
   Marketable debt securities                                       365           586         (221)    (37.7)         3,570
   Trading derivatives                                           75,279        58,713       16,566      28.2         89,167
   Other                                                         53,279        51,559        1,719        3.3        38,987
Other financial liabilities at fair value                        51,020        42,371        8,648      20.4         28,639
   Customer deposits                                             27,142        14,636       12,506      85.4          9,318
   Marketable debt securities                                     4,278         4,887          (609)   (12.5)         5,191
   Due to central banks and credit institutions                  19,600        22,848       (3,248)    (14.2)        14,130
Financial liabilities at amortized cost                         898,969       823,403       75,566        9.2       770,008
   Due to central banks and credit institutions                  79,537        73,126        6,410        8.8        79,795
   Customer deposits                                            581,385       487,681       93,703       19.2       406,015
   Marketable debt securities                                   188,229       206,490     (18,261)       (8.8)      227,642
   Subordinated debt                                             30,475        36,805       (6,330)    (17.2)        38,873
   Other financial liabilities                                   19,343        19,300             43      0.2        17,681
Insurance liabilities                                            10,449        16,916       (6,467)    (38.2)        16,850
Provisions                                                       15,660        17,533       (1,873)    (10.7)        17,736
Other liability accounts                                         23,717        20,919         2,798      13.4        19,777
Total liabilities                                            1,136,586     1,036,659       99,927         9.6      989,630
Shareholders' equity                                             77,334        71,832         5,502       7.7        65,887
   Capital stock                                                  4,165         4,114             50       1.2        3,997
   Reserves                                                      66,258        61,071         5,187        8.5       55,707
   Attributable profit to the Group                               8,181         8,943          (762)     (8.5)        8,876
   Less: dividends                                               (1,270)       (2,297)        1,027    (44.7)        (2,693)
Equity adjustments by valuation                                  (2,315)       (3,165)           850   (26.9)        (8,300)
Minority interests                                                5,896         5,204            692     13.3         2,415
Total equity                                                    80,914        73,871         7,044        9.5       60,001
Total liabilities and equity                                 1,217,501     1,110,529     106,971          9.6    1,049,632


      ANNUAL REPORT 2010                                                                                                  99
DISTRIBUTION OF TOTAL ASSETS BY GEOGRAPHIC SEGMENT
GRUPO SANTANDER. BALANCE SHEET                                           December 2010

Activity reflected the current market context:
                                                                                              Sovereign 4% Other 3%
• Lower demand for loans in Europe, mainly Spain and                          Other Latin America 3%
  Portugal.                                                                              Chile 3%
                                                                                                                           Spain 27%
• Double-digit rise in lending in Latin America after falls in                      Mexico 4%
  2009.
• In capturing of funds, preference for deposits, mainly in                       Brazil 13%
  Europe.
                                                                                                                                Portugal 4%
Core capital (8.8%) rose for the fourth year running and                                                                    Germany 3%
very solid, in accordance with the Group's business model
and our risk profile.                                                                                                     Other
                                                                                                                          Europe 7%
Further rise in shareholders’ equity per share to EUR 8.58                         United Kingdom 29%
(+EUR 0.54).


Total managed funds at the end of 2010 amounted to EUR                   Lending
1,362,289 million, of which EUR 1,217,501 million (89%) were             The Group’s net lending amounted to EUR 724,154 million, 6%
on-balance sheet and the rest off-balance sheet mutual and               higher than in 2009 and 1% more after eliminating the
pension funds and managed portfolios.                                    exchange rate impact.

In order to correctly interpret this information, it is necessary to     Lending to the public sector increased 24% in the year and that
take into account two positive effects. The first was the                to other resident sectors dropped 2%. Secured loans, the lowest
exchange rate impact from the appreciation of currencies                 risk part of the portfolio and with the largest share (59%),
against the euro over the last 12 months (with end of period             increased 2%, while the commercial portfolio was similar to
rates): 17% for the Chilean peso, 14% for the Mexican peso,              2009 and other loans declined 8%.
13% for the Brazilian real, 8% for the dollar and 3% for sterling.
The second was a small rise in the perimeter due to the                  Lending to the non-resident sector grew 10%, due to the
acquisitions of Santander Consumer Finance.                              favourable impact of the perimeter and forex effects.

The impact of both on growth in customer balances was 5 p.p.             The geographic distribution (main segments) was very different
positive in loans and in customer funds.                                 by markets.


CUSTOMER LOANS
Million euros
                                                                                                     Variation
                                                                          2010            2009        Amount               %               2008

Public sector                                                            12,137          9,803          2,335           23.8            7,668
Other residents                                                         217,497        222,355         (4,858)          (2.2)         230,783
  Commercial bills                                                       11,146         11,134              11           0.1           14,874
  Secured loans                                                         127,472        125,397          2,076            1.7          123,566
  Other loans                                                            78,879         85,824         (6,945)          (8.1)          92,343
Non-resident sector                                                     514,217        468,267         45,950            9.8          400,903
  Secured loans                                                         311,048        286,381         24,667            8.6          229,761
  Other loans                                                           203,168        181,886         21,283           11.7          171,142
Gross customer loans                                                   743,851        700,424         43,427             6.2         639,354
Loan-loss allowances                                                     19,697         17,873           1,824          10.2           12,466
Net customer loans                                                     724,154        682,551         41,603             6.1         626,888
Pro memoria: Doubtful loans                                              27,908         24,027           3,880          16.1           13,968
    Public sector                                                            42             18              25         138.5                1
    Other residents                                                      12,106          9,898           2,208          22.3            6,208
    Non-resident sector                                                  15,759         14,111           1,648          11.7            7,759


100                                                                                                                   ANNUAL REPORT 2010
GROSS CUSTOMER LOANS                                             +6.2%*      GROSS CUSTOMER LOANS
Billion euros                                                    2010-2009
                                                                             % o/ operating areas. December 2010


                                                    744
                                                                                                           Sovereign 5%
                                                                                  Other Latin America 2%


                                             700
                                                                                              Chile 4%
                                                                                        Mexico 2%
                                   639
                                                                                      Brazil 10%                                  Spain 32%


                                                                                                                                 Portugal 4%
                                                                                                                               Germany 3%
                                2008        2009   2010                         United Kingdom 32%
                                                                                                                          Other Europe 6%
(*) Excluding exchange rate impact: +2.4%


Spain and Portugal’s lending fell by 4% and 7%, respectively,                In the specific case of Grupo Santander, 94% of mortgages are
due to deleveraging and the selective growth policy followed by              for the first residence, the portfolio has a large concentration in
the Group in these countries. Santander Consumer Finance’s                   the lowest tranches of loan-to-value (85% with an LTV lower
lending increased 11%.                                                       than 80%) and the NPL ratio is very low (2.2%).

Gross lending in Spain amounted to EUR 235,993 million, with                 Loans to SMEs and companies not related to the construction
an adequate structure (see below).                                           and real estate sectors amounted to EUR 94,406 million,
                                                                             virtually the same as in 2009.
Loans to public administrations rose 24% to EUR 12,137 million.
                                                                             Loans to the construction and real estate sectors,
Lending to individuals amounted to EUR 91,240 million, of                    distinguishing between those without a real estate purpose
which EUR 61,387 million were household mortgages. These                     and those directly related (with the greatest risk) which stood
are the healthiest part and with the least risk of further                   at EUR 27,334 million.
deterioration of the portfolio in Spain because of the
different features of this product compared to similar ones in               This figure represents only 3.7% of the Group’s lending and
other countries. For example, the principle is amortised as of               12% of its total loans in Spain, a notably lower proportion
the first day, the borrower’s responsibility extends to all their            than that of its competitors (more than 16%). Moreover, it is
assets and almost all loans are for the first residence, where               12% lower than in 2009 and 27% below 2008, a sharper fall
the customer has ownership with a very low expected loss.                    than that of the rest of the portfolio and reflecting the
                                                                             Group’s strategy of reducing the exposure to this higher risk
                                                                             segment.

                                                                             In Portugal, the fall in lending was mainly to large companies,
LOAN PORTFOLIO IN SPAIN
Billion euros
                                                                             where there was a shift from loans to capital markets. In
                                                                             addition, balances in construction and real estate, which
                                                                             represent only 3% of lending, declined 10% in 2010.
                                             254


    Total
                                                           245


                                                                   236


    Public Sector                            7                               Balances to individuals increased a little (+1% in mortgages).
                                                           10
                                                                   12
    Household mortgages                      65
                                                           64
                                                                   61
                                                                             Santander Consumer Finance’s balance increased 11%, due to
    Other loans to
                                                                             organic growth and the integration of the portfolios acquired in
                                             33                              the US and Poland, as commented on in greater retail in the
    individuals                                            31      30
                                                                             section on this area. New loans increased 9%, a significant
                                                                             change of trend, as 2009 evolution showed a downward trend.
    Companies (without
                                             98            95      95
    construction & real estate)
                                                                             In the United Kingdom, the balance of lending was very similar
                                                                             to 2009. In local criteria, residential mortgages in a still
                         No real estate
    Construction
    & real estate    {   purposes
                         Real estate
                         purposes
                                             13
                                             38

                                            2008
                                                           13
                                                           31

                                                          2009
                                                                   11
                                                                   27
                                                                 2010
                                                                             depressed market grew 3% and loans to SMEs 26%, while
                                                                             personal loans dropped 24%, continuing with the policy of
                                                                             reducing this type of loans.


        ANNUAL REPORT 2010                                                                                                                     101
CREDIT RISK MANAGEMENT*
Million euros
                                                                                                                  Variation
                                                                               2010             2009               Amount                     %               2008

Non-performing loans                                                          28,522           24,554                3,969                  16.2         14,191
NPL ratio (%)                                                                   3.55             3.24              0.31 p.                                 2.04
Loan-loss allowances                                                          20,748           18,497                2,251                 12.2          12,863
  Specific                                                                    14,901           11,770                3,131                 26.6           6,682
  Generic                                                                      5,846            6,727                 (881)               (13.1)          6,181
NPL coverage (%)                                                                  73               75                 (3 p.)                                 91
Credit cost (%) **                                                              1.56             1.57             (0.01 p.)                                1.16

Ordinary non-performing and doubtful loans ***                                18,061           17,641                 420                    2.4         10,626
NPL ratio (%) ***                                                               2.28             2.35             (0.07 p.)                                1.53
NPL coverage (%) ***                                                             115              105                10 p.                                  121
* Excluding country-risk
** Net specific allowance / computable assets
*** Excluding mortgage guarantees

Note: NPL ratio: Non-performing loans / computable assets


Lending in Latin America gradually accelerated in year-on-year                Risks
terns and ended 2010 with growth of 15% excluding the                         The still weak economy in some markets caused non-performing
exchange-rate effect. These comments also applied to Brazil,                  loans (NPL) ratios to rise because of the increase in the Group’s
Mexico and Chile whose growth rates were 16%, 15% and                         bad and doubtful loans and the slower pace of growth in lending.
14%, respectively (negative rates in 2009).
                                                                              However, the pace of growth in non-performing loans
Sovereign’s loans declined 2% in dollars, affected by the                     decelerated, as active management produced a good evolution
reduction of the portfolio in run-off (-32% in 2010 and -62%                  in NPL entries and in the risk premium for the whole Group and
since Sovereign joined the Group). This resulted in a reduction               for the main business units. Bad and doubtful loans amounted to
from $9,700 million to $4,000 million. In addition, the focus                 EUR 28,522 million at the end of 2010, 16% more than in 2009
during 2010 was on new loans and renewals, concentrating on                   and compared to growth of 130% in 2008 and 73% in 2009.
the most attractive mortgage segments (residential and
multifamily), which grew 17%.                                                 Grupo Santander’s NPL ratio stood at 3.55% at the end of
                                                                              2010, 31 b.p. more than a year earlier and much lower than in
These changes are reflected in the lesser share of lending in                 2008 and 2009 when the increase was more than 100 b.p. in
Europe and the increase in Latin America. At the end of 2010,                 each year.
Continental Europe accounted for 45% of the Group’s total
lending (32% Spain), the UK 32%, Latin America 18% (10%                       Provisions to cover the NPLs amounted to EUR 20,748 million,
Brazil) and Sovereign 5%. The respective figures a year earlier               of which EUR 5,846 million were generic provisions. Total
were 47% for Continental Europe, 33% for the UK, 15% for                      provisions have increased by almost EUR 8,000 million in the last
Latin America and 5% for Sovereign.                                           two years. Coverage at 73% was very similar to 2009 (75%).


                                                                               LOAN-LOSS ALLOWANCES                                                +12.2%
                                                                               Million euros                                                         2010-2009
                                                                                                                                20,748
                                                                                                                     18,497


NON-PERFORMING LOANS
Million euros
                                          2010              2009     2008
                                                                                                         12,863


Balance at beginning of year           24,554           14,191       6,179
  Net additions                        13,478           18,234      13,000
  Increase in scope of consolidation      257            1,033       2,089
  Exchange differences                  1,147              890        (871)
  Write-offs                         (10,913)           (9,795)     (6,206)
Balance at year-end                   28,522           24,554      14,191
                                                                                                        2008       2009        2010


102                                                                                                                                      ANNUAL REPORT 2010
NET NPLs ENTRIES(1). TOTAL GROUP                                               -26.1%       NET NPLs ENTRIES(1). MAIN UNITS
                                                                                            Base 100: 2009
Billion euros                                                                   2010-2009


                                                                                             SAN + Banesto                        SCF          United Kingdom           Latin America


                                               18.2


                                                                                                  100


                                                                                                                            100


                                                                                                                                                  100


                                                                                                                                                                             100
                                                          13.5
                                   13.0


                                                                                                          94


                                                                                                                                        87


                                                                                                                                                                                     81
                                                                                                                                                           42
                                2008        2009       2010                                   2009      2010             2009       2010        2009     2010              2009    2010
(1) Excluding perimeter and exchange rate impact                                            (1) Excluding perimeter and exchange rate impact


The Group’s NPL ratio in Spain was 4.24%, well below the                                    standard, 100% of which is also up to date with payments. This
sector’s average, and coverage 58%. The ratio rose by 83 b.p.,                              means that 75% of doubtful and substandard loans are up to
much lower than the increase in 2009.                                                       date with payments, while both have appropriate levels of
                                                                                            coverage via provisions and guarantees.
More than 80% of the portfolio (including mortgages and
companies) had an excellent NPL ratio of 3% or lower. Of note                               Portugal’s NPL ratio was 2.90% at the end of 2010 (+63 b.p.)
were mortgages to buy a home whose ratio was 2.2%, which                                    and coverage was 60%.
compares very well with the sector. This ratio was 2.5% in 2009
                                                                                            Santander Consumer Finance’s NPL ratio was 4.95% and
and its improvement underscored the quality of the portfolio.
                                                                                            coverage 128%, improvements of – 44 b.p. and +31 p.p.
                                                                                            respectively
As regards loans to the construction and real estate
development sectors, the NPL ratio for loans not related to real                            The UK’s NPL ratio was 1.76% (+5 b.p.) and coverage 46% (+2
estate was 4.4%, in line with the average ratio of the portfolio,                           p.p.). The mortgage portfolio is focused on first residence loans
while that for loans with a real estate purpose was 17.0%.                                  and has a high quality of risk in terms of loan-to-value (average
                                                                                            of 51%) and a NPL ratio of 1.41%.
This ratio reflects, on the one hand, the larger volumes of bad
loans in this segment and, on the other, the anticipative policy                            Brazil’s NPL ratio was 4.91% (-36 b.p.) and improved for the
followed by the Group, which is reflected in the fact that 50%                              fourth straight quarter. Coverage remained at around 100%.
of the EUR 4,636 million of doubtful loans are up to date with                              Latin America excluding Brazil had a NPL ratio of 3.07% (2.96%
payments. In addition, EUR 4,932 million was recorded as sub                                at the end of 2009), with coverage of 110%.


NPL RATIO                                             NPL COVERAGE                          NPL RATIO IN SPAIN
%                                                     %                                     %
                                                                                                                                                                           No real estate
                                                                                                                                                        Construction
                                                                                                                                                                       {   purposes: 4.4%
                                 3.55


                                                                                                                                                  13.3 & real estate       Real estate
                       3.24


                                                                                                                                                                           purposes: 17.0%
                                                                  91


                                                                                                                         8.7
             2.04


                                                                         75


                                                                                73


                                                                                                                          3.4                     4.2 Total portfolio Spain
                                                                                            3.3                                                   3.0 Other portfolio
                                                                                                                             2.5
                                                                                            2.0                                                   2.2 Household mortgages
                                                                                            1.9                           2.4
                                                                                            1.5
          2008       2009      2010                              2008   2009   2010           2008                     2009                    2010


        ANNUAL REPORT 2010                                                                                                                                                                103
CUSTOMER FUNDS UNDER MANAGEMENT
Billion euros
                                                                   +9.5%*        CUSTOMER FUNDS UNDER MANAGEMENT
                                                                                 % o/ operating areas. December 2010
                                                                   2010-2009


                                                    985
                                                                                                              Sovereign 4%


                                             900
                                                                                     Other Latin America 4%
                                                   145    +0.9%
                                827

                                                                                                 Chile 3%
                                            144                                            Mexico 4%
             Other             131                 269     -6.4%
                                                                                                                                 Spain 30%
             Other on
             balance                        288
                               318
             sheet                                                                        Brazil 15%

                                                   571    +21.9%
             Deposits                       468
                               378                                                                                                Portugal 4%
             w/o REPOs
                                                                                                                                Germany 3%
                                                                                                                              Other Europa 2%
                              2008          2009   2010                                     United Kingdom 31%
(*) Excluding exchange rate impact: +5.3%


Sovereign's NPL ratio was 4.61% and coverage 75%. Both ratios                    Customer funds under management
were better than in 2009 and better than the forecasts made at                   Total managed funds at the end of 2010 amounted to EUR
the beginning of the year.                                                       985,269 million, 10% more than in 2009.

More detailed information on credit risk, particularly real estate               After deducting the perimeter and forex effects, growth was 5%
risk in Spain, the control and monitoring systems and the                        and distributed as follows: 17% rise in deposits without repos
internal models for calculating provisions are included in the                   (demand deposits: +4%; time: +36%), the balance of repos,
section on risk management in this report.                                       marketable securities and subordinated debt declined 6% and
                                                                                 the aggregate of mutual and pension funds hardly changed.

                                                                                 The sharp rise in deposits reflects the focus on capturing
                                                                                 customer funds by all the Group’s units, using two strategies.


CUSTOMER FUNDS UNDER MANAGEMENT
Million euros
                                                                                                                 Variation
                                                                                  2010                 2009       Amount          %               2008

Public sector                                                                     9,655           13,293         (3,638)      (27.4)         13,720
Other residents                                                                 161,096          126,189         34,907        27.7         117,776
  Demand deposits                                                                67,077           61,000          6,077        10.0          51,300
  Time deposits                                                                  81,145           49,177         31,968        65.0          46,783
  REPOs                                                                          12,873           16,012         (3,138)      (19.6)         19,693
Non-resident sector                                                             445,625          367,495         78,131        21.3         288,734
  Demand deposits                                                               210,490          195,823         14,668          7.5        151,774
  Time deposits                                                                 197,590          148,485         49,105        33.1         115,620
  REPOs                                                                          30,623           18,403         12,220         66.4         17,187
  Public Sector                                                                   6,922            4,784           2,138        44.7          4,153
Customer deposits                                                              616,376          506,976       109,400          21.6        420,229
Debt securities                                                                 192,872          211,963       (19,091)         (9.0)       236,403
Subordinated debt                                                                30,475           36,805         (6,330)      (17.2)         38,873
On-balance-sheet customer funds                                                839,723          755,744         83,979         11.1        695,506
Mutual funds                                                                    113,510          105,216           8,293         7.9         90,306
Pension funds                                                                    10,965           11,310            (345)       (3.0)        11,128
Managed portfolios                                                               20,314           18,364           1,950        10.6         17,289
Savings-insurance policies                                                          758            9,422         (8,664)      (92.0)         12,338
Other customer funds under management                                          145,547          144,313           1,234          0.9       131,061
Customer funds under management                                                985,269          900,057         85,213           9.5       826,567


104                                                                                                                          ANNUAL REPORT 2010
MUTUAL FUNDS
Million euros
                                                                                                 Variation
                                                                       2010          2009         Amount               %           2008

Spain                                                                 34,310        40,616         (6,306)         (15.5)         44,694
Portugal                                                               3,209         3,982           (773)         (19.4)          3,031
United Kingdom                                                        14,369        10,937          3,432           31.4           7,180
Latin America                                                         61,621        49,681         11,940           24.0          35,400
Total                                                               113,510       105,216           8,293            7.9         90,306


• The strategy in developed countries was one of deleverage,          Sovereign’s deposits declined 4% in dollars, due to the bank’s
  with growth in deposits much greater than that of loans. This       policy of reducing high cost balances. Low cost retail deposits
  closed the commercial gap significantly.                            increased 3% and more expensive ones dropped 18%.

• In emerging countries, the strategy was to self-finance the         Continental Europe accounted for 39% of managed customer
  larger relative rise in lending with a very similar increase in     funds (30% Spain), the UK 31%, Latin America 26% (Brazil
  deposits.                                                           15%) and Sovereign 4%. The respective figures in 2009 were
                                                                      40% for Continental Europe, 31% for the United Kingdom, 23%
Continental Europe increased its deposits excluding repos 31%.        for Latin America and 6% Sovereign.

In Spain, which accounts for three out of every four of               As well as capturing large volumes of funds in 2010, the Group,
Continental Europe’s deposits, the increase was 21%, due to           for strategic reasons, maintained an active policy of issuing
the strategy of growth and customers’ preference for this type        securities in the international fixed income markets (EUR 37,981
of product. This produced a gain in market share in demand            million).
deposits (+1.4 p.p.) and in time deposits (+1.7 p.p.). Mutual and
pension funds declined 13%, impacted by the deposit capturing         The Group issued, respectively, EUR 27,225 million, EUR 10,613
campaign.                                                             million and EUR 143 million of senior debt, covered bonds and
                                                                      subordinated debt.
Santander Consumer Finance’s deposits excluding repos
increased 16%, while in Portugal they rose 45% and mutual and         This issuing activity shows the capacity of the Group via its
pension funds declined 16%.                                           parent bank Banco Santander and its main subsidiaries to access
                                                                      the different institutional markets in the countries where it
In the UK, customer deposits excluding repos increased 6% in          operates: Spain, with Banesto, Portugal, the UK, Chile, Brazil
sterling and mutual funds rose 27%.                                   and Mexico.

In Latin America, savings rose 8% excluding the forex impact.         As regards securitisations, the Group’s subsidiaries placed in the
Mexico’s grew 14%, Brazil’s 6% and Chile’s 2%. The strategy in        market a total of EUR 19,174 million (the UK with EUR 12,873
these countries was similar: double digit growth in demand            million).
deposits, more moderate in mutual funds (except for Chile) and
lower balances in time deposits (except for Mexico), anticipating     Issues of senior debt, covered bonds and subordinated debt that
the next interest rate movements in markets.                          matured in 2010 were EUR 22,390 million, EUR 3,550 million


PENSION FUNDS
Million euros
                                                                                                 Variation
                                                                       2010          2009         Amount               %           2008

Spain                                                                 9,650         9,912            (262)           (2.6)        9,734
   Individuals                                                        8,161         8,429            (268)           (3.2)        8,381
   Collective plans                                                     262           266                (4)         (1.5)          236
   Group employee plans                                               1,227         1,217               10            0.8         1,117
Portugal                                                              1,315         1,398              (83)          (5.9)        1,394
Total                                                                10,965        11,310           (345)           (3.0)        11,128


      ANNUAL REPORT 2010                                                                                                             105
and EUR 3,753 million, respectively. The whole of the Series V of    LOANS / DEPOSITS. TOTAL GROUP
the preferential shares of Santander Finance Capital (EUR 1,000      %
million) were amortised.


                                                                                            150
The Group successfully completed in the first quarter a purchase


                                                                                                    135
offer for a series of subordinated debt issues. This meant the
acceptance and subsequent cancellation of issues for the


                                                                                                            117
following nominal amounts: EUR 181 million, ₤1,309 million
and US$ 1,632 million.

This capturing of stable funds, via deposits and issues, combined
with the reduced growth in lending, enabled the credit / deposit
ratio to be lowered to 117% (135% in 2009 and 150% in
2008). The ratio of deposits plus medium and long-term
financing over loans increased to 115% (106% in 2009),                                    2008    2009    2010
underscoring the appropriate structure of financing the Group’s
lending.

More detailed information on management of financing in
markets, the management framework of liquidity and the
Group’s structural liquidity position is set out on the section on   The rise in the trading portfolio was largely due to derivatives
risk management in this report, under the heading                    whose increase was similar in assets and liabilities, because of
“management of financing and liquidity risk.”                        the evolution of the market value, mainly of interest rate swaps.

Other items of the balance sheet                                     This growth does not mean an increase in risk, as it is normal
Total goodwill was EUR 24,622 million at the end of 2010, split      practice in these products to require collateral for the positive
between Europe and the Americas. Goodwill increased by EUR           mark to market. The balance at the end of 2010 was EUR
1,757 million in 2010, mainly due to the impact of exchange          73,069 in assets and EUR 75,279 in liabilities.
rates, which have their counterparty in their positive impact on
valuation adjustments.

Of note in the rest of the items were:

Cash on hand and deposits in central banks rose from EUR
34,889 million to EUR 77,785 million, mainly in the UK and
Brazil and in both cases due to the tougher regulations on
liquidity requirements established by the respective central
banks.


106                                                                                                               ANNUAL REPORT 2010
SHAREHOLDERS' EQUITY AND MINORITY INTERESTS
Million euros
                                                                                                                       Variation
                                                                                 2010                   2009            Amount                      %                   2008

Capital stock                                                                    4,165              4,114                   50                     1.2                  3,997
Additional paid-in surplus                                                      29,457             29,305                  152                     0.5                 28,104
Reserves                                                                        36,993             31,796                5,197                   16.3                  28,024
Treasury stock                                                                    (192)                (30)               (163)                 546.2                    (421)
Shareholders' equity (before profit and dividends)                             70,423             65,186                 5,237                     8.0                59,704
Attributable profit                                                              8,181              8,943                 (762)                   (8.5)                 8,876
Interim dividend distributed                                                    (1,270)            (1,285)                  15                    (1.2)                (1,711)
Interim dividend not distributed                                                (2,060)            (2,837)                 777                  (27.4)                 (3,102)
Shareholders' equity (after retained profit)                                   75,273             70,006                 5,267                     7.5                63,768
Valuation adjustments                                                           (2,315)            (3,165)                 850                  (26.9)                 (8,300)
Minority interests                                                               5,896              5,204                  692                   13.3                   2,415
Total equity (after retained profit)                                           78,854             72,045                 6,809                     9.5                57,883
Preferred shares and securities in subordinated debt                             7,352              7,745                 (393)                   (5.1)                 8,673
Total equity and capital with the nature of financial liabilities              86,207             79,791                 6,416                     8.0                66,555


Shareholders’ equity and solvency ratios                                        The BIS ratio was 13.1%, Tier I 10.0% and core capital rose for
Total shareholders’ equity after retained earnings, was 8%                      the fourth year running to 8.8%. This improvement was due to
higher at EUR 75,273 million (+EUR 5,267 million), mainly due                   the free generation of capital and the scrip dividend, which
to the increase in reserves.                                                    comfortably offset the negative impact of the acquisition of
                                                                                minority interests in Mexico.
Two capital increases were carried out in 2010. In the first one,
11,582,632 shares were issued in October to tend to the                         This core capital is of very high quality, very solid and adjusted
exchange of 33,544 Valores Santander and in the second                          to our risk profile, as underscored by the results of the stress
88,713,331 shares were issued for November’s scrip dividend, in                 tests conducted by the Committee of European Banking
which 84% of the capital opted to receive the amount                            Supervisors (CEBS) and the Bank of Spain last July.
equivalent to the second interim dividend in shares.
                                                                                Lastly, of note is the high and sustained capacity to generate
Including valuation adjustments, minority interests and                         retained profits, after deducting dividends in accordance with
preference shares, total net equity and capital with the nature of              the Group's pay-out policy. At the end of 2010, shareholders’
financial liabilities increased 8% to EUR 86,207 million (+EUR                  equity per share was EUR 8.58 (+EUR 0.54), which is added to
6,416 million) at the end of 2010. Valuation adjustments were                   the rise in the last four years.
EUR 850 million higher because of the favourable impact of the
appreciation of currencies against the euro.

As regards capital ratios, Grupo Santander’s eligible
shareholders’ equity, in accordance with the criteria of the Bank
for International Settlements (BIS II), amounted to EUR 79,276
million (EUR 30,885 million surplus and 64% above the
minimum requirement).

COMPUTABLE CAPITAL AND BIS II RATIO                                              CAPITAL RATIOS (BIS II)
Million euros                                                                    %
                                                2010        2009       2008
                                                                                                                14.2
                                                                                           13.3


                                                                                                                                   13.1


Core capital                                   53,205     48,366     38,968
Basic capital                                  60,617     56,615     46,894
Supplementary capital                          20,670     24,309     25,225                                                                               BIS Ratio
                                                                                                                       10.1               10.0
Deductions                                     (2,011)    (1,221)    (3,816)                      9.1
Computable capital                            79,276     79,704     68,302                                                                                Tier I
                                                                                                                       8.6                8.8
Risk-weighted assets                          604,885    561,684    514,003
                                                                                                  7.5

BIS II ratio                                     13.1       14.2       13.3                                                                               Core capital
  Tier I (before deductions)                     10.0       10.1        9.1
  Core capital                                    8.8        8.6        7.5

Shareholders' equity surplus (BIS II ratio)    30,885     34,769     27,182               2008                 2009                2010


       ANNUAL REPORT 2010                                                                                                                                                  107
DESCRIPTION OF THE SEGMENTS
Grupo Santander maintained in 2010 the general criteria used in        In addition, Sovereign’s figures are recorded on their own. This
2009, with the following exceptions:                                   bank began to be consolidated by global integration in
                                                                       February 2009, after its acquisition had gone ahead.
• The annual adjustment to the Global Customer Relationship
  Model was made. This does not mean any changes in the                Secondary level (or business). This segments the activity of the
  principal (geographic) segments, but it does affect the figures      operating units by the type of business. The reported
  for Retail Banking and Global Wholesale Banking.                     segments are:

• Exit of Open Bank from the Santander Consumer Finance                • Retail Banking. This covers all customer banking
  division, as it is being managed in a differentiated way outside       businesses (except those of Corporate Banking, managed
  this sphere.                                                           through the Global Customer Relationship Model). Because
                                                                         of their relative importance details are provided by the main
None of these changes was significant for the Group and do not           geographic areas (Continental Europe, United Kingdom and
alter its figures. The figures for 2009 were restated and include        Latin America) and Sovereign, as well as by the main
the changes in the affected areas.                                       countries. The results of the hedging positions in each
                                                                         country are also included, conducted within the sphere of
With the sale of Banco de Venezuela, effective in July 2009, this        each one’s Assets and Liabilities Committee.
bank’s results for 2009 were eliminated from the various lines of
the income statement and recorded in discontinued operations.          • Global Wholesale Banking (GBM). This business reflects
                                                                         the revenues from Global Corporate Banking, Investment
The financial statements of each business area have been drawn           Banking and Markets worldwide including all treasuries
up by aggregating the Group’s basic operating units. The                 managed globally, both trading and distribution to
information relates to both the accounting data of the                   customers (always after the appropriate distribution with
companies in each area as well as that provided by the                   Retail Banking customers), as well as equities business.
management information systems. In all cases, the same general
principles as those used in the Group are applied.                     • Asset Management and Insurance. This includes the
                                                                         contribution of the various units to the Group in the design
In accordance with the IFRS, the business areas are structured           and management of mutual and pension funds and
into two levels:                                                         insurance. The Group uses, and remunerates through
                                                                         agreements, the retail networks that place these products.
Principal level (or geographic). The activity of the Group’s             This means that the result recorded in this business is net (i.e.
operating units is segmented by geographical areas. This                 deducting the distribution cost from gross income).
coincides with the Group’s first level of management and
reflects its positioning in the world’s three main currency areas      As well as these operating units, which cover everything by
(euro, dollar and sterling). The segments reported on are:             geographic area and by businesses (their totals are the same),
                                                                       the Group continues to maintain the area of Corporate
• Continental Europe. This covers all retail banking business          Activities. This area incorporates the centralised activities
  (including Banif, the specialised private bank), wholesale           relating to equity stakes in industrial and financial companies,
  banking and asset management and insurance conducted in              financial management of the structural exchange rate position
  Europe with the exception of the United Kingdom. Given the           and of the parent bank’s structural interest rate risk, as well as
  importance of some of these units, the financial information         management of liquidity and of shareholders’ equity through
  of the Santander Branch Network, Banesto, Santander                  issues and securitisations.
  Consumer Finance (including Santander Consumer USA) and
  Portugal is also set out.                                            As the Group’s holding entity, this area manages all capital
                                                                       and reserves and allocations of capital and liquidity. It also
• United Kingdom. This includes retail and wholesale banking,          incorporates amortisation of goodwill but not the costs related
  asset management and insurance conducted by the various              to the Group’s central services except for corporate and
  units and branches of the Group in the country.                      institutional expenses related to the Group’s functioning.

• Latin America. This embraces all the Group’s financial
  activities conducted via its subsidiary banks and subsidiaries. It
  also includes the specialised units of Santander Private Banking,
  as an independent and globally managed unit, and New York’s
  business. Because of their specific importance, the financial
  statements of Brazil, Mexico and Chile are also provided.


108                                                                                                                ANNUAL REPORT 2010
1. PRINCIPAL SEGMENTS OR GEOGRAPHIC
INCOME STATEMENT
Million euros
                                                                              Net operating income                           Attributable profit to the Group
                                                                     2010         2009      Amount               %         2010         2009      Amount            %

Continental Europe                                                   9,794     10,312          (519)        (5.0)          3,885       5,031      (1,146)       (22.8)
o/w: Santander Branch Network                                        2,769       3,240          (470)      (14.5)          1,243       2,005          (762)      (38.0)
     Banesto                                                         1,376       1,551          (175)      (11.3)            419          738         (319)      (43.2)
     Santander Consumer Finance                                      3,361       2,972           389         13.1            811          629          182         28.9
     Portugal                                                          650         726            (75)     (10.4)            456          531           (75)     (14.2)
United Kingdom                                                       3,567       3,231           337        10.4           1,985       1,726           259        15.0
Latin America                                                      12,805      11,071         1,734         15.7           4,804       3,833           971        25.3
o/w: Brazil                                                          9,037       7,376        1,660          22.5          2,836       2,167            669        30.9
     Mexico                                                          1,458       1,542            (84)       (5.5)           682          495           188        37.9
     Chile                                                           1,311       1,196            115         9.7            683          563           120        21.3
Sovereign                                                            1,169         582           587       100.8             424         (25)          449           —
Operating areas                                                    27,335      25,196         2,139           8.5        11,099      10,565            533          5.0
Corporate Activities                                                (3,482)     (2,236)      (1,246)         55.7         (2,918)     (1,623)      (1,295)         79.8
Total Group                                                        23,853      22,960            893          3.9          8,181       8,943         (762)        (8.5)


RATIOS
%
                                                                     Efficiency ratio(1)                 ROE                   NPL ratio*             NPL coverage*
                                                                     2010         2009        2010             2009        2010         2009        2010         2009

Continental Europe                                                    38.6        36.4       14.15         18.78            4.34        3.64           71          77
o/w: Santander Branch Network *                                       42.8        39.2       17.38         26.65            5.52        4.38           52          65
     Banesto                                                          42.8        39.9        9.43         17.24            4.11        2.97           54          64
     Santander Consumer Finance                                       27.5        27.3       10.31          9.06            4.95        5.39          128          97
     Portugal                                                         45.4        42.8       20.34         25.38            2.90        2.27           60          65
United Kingdom                                                        39.4        40.8       22.72         29.62            1.76        1.71           46          44
Latin America                                                         38.4        37.3       22.66         23.67            4.11        4.25          104         105
o/w: Brazil                                                           37.0        37.0       23.11         25.64            4.91        5.27          101          99
     Mexico                                                           38.7        34.2       19.52         18.43            1.84        1.84          215         264
     Chile                                                            36.0        33.2       30.53         32.29            3.74        3.20           89          89
Sovereign                                                             44.5        60.2       14.87            —             4.61        5.35           75          62
Operating areas                                                       38.9        38.3       18.42         21.02            3.53        3.21           75          76
Total Group                                                           43.3        41.7       11.80         13.90            3.55        3.24           73          75

(1) With amortisations
* Santander Branch Network is the retail banking unit of Banco Santander S.A. The NPL ratio of Banco Santander S.A. at the end of December 2010 stood at 4.24% (3.41% in
  December 2009) and NPL coverage was 54% (73% in December 2009).


OPERATING MEANS
                                                                                                                               Employees                Branches
                                                                                                                           2010         2009        2010         2009

Continental Europe                                                                                                      54,518 49,870              6,063        5,871
o/w: Santander Branch Network                                                                                            18,893  19,064            2,931        2,934
     Banesto                                                                                                              9,742   9,727            1,762        1,773
     Santander Consumer Finance                                                                                          13,852   9,362              519          310
     Portugal                                                                                                             6,214   6,294              759          763
United Kingdom                                                                                                          23,649 22,949              1,416        1,322
Latin America                                                                                                           89,526 85,974              5,882        5,745
o/w: Brazil                                                                                                              53,900  50,961            3,702        3,593
     Mexico                                                                                                              12,500  12,466            1,100        1,093
     Chile                                                                                                               11,595  11,751              504          498
Sovereign                                                                                                                 8,647   8,847              721          722
Operating areas                                                                                                        176,340 167,640            14,082       13,660
Corporate Activities                                                                                                      2,529   1,820
Total Group                                                                                                            178,869 169,460            14,082       13,660


       ANNUAL REPORT 2010                                                                                                                                           109
CONTINENTAL EUROPE
Million euros
                                                                                                                               Variation
                                                                                                        2010          2009      Amount               %
INCOME STATEMENT
Net interest income                                                                                   10,957       11,456          (499)          (4.4)
Net fees                                                                                                3,748        3,787            (38)         (1.0)
Gains (losses) on financial transactions                                                                  843          609           234           38.3
Other operating income (1)                                                                                397          364             33           9.1
Gross income                                                                                          15,946       16,217          (271)          (1.7)
Operating expenses                                                                                     (6,152)      (5,904)         (248)           4.2
  General administrative expenses                                                                      (5,513)      (5,335)         (179)           3.3
      Personnel                                                                                        (3,429)      (3,306)         (123)            3.7
      Other general administrative expenses                                                            (2,084)      (2,028)           (56)           2.8
  Depreciation and amortisation                                                                          (639)        (569)           (70)         12.2
Net operating income                                                                                    9,794      10,312          (519)          (5.0)
Net loan-loss provisions                                                                               (4,190)      (3,111)      (1,079)           34.7
Other income                                                                                             (192)        (151)           (41)         26.9
Profit before taxes                                                                                     5,412        7,050      (1,638)         (23.2)
Tax on profit                                                                                          (1,417)      (1,882)           464        (24.7)
Profit from continuing operations                                                                       3,995        5,169      (1,174)         (22.7)
Net profit from discontinued operations                                                                    (14)         (45)            31       (69.3)
Consolidated profit                                                                                     3,981        5,124      (1,143)         (22.3)
Minority interests                                                                                          96           93              3           3.4
Attributable profit to the Group                                                                        3,885        5,031      (1,146)         (22.8)

BALANCE SHEET
Customer loans (2)                                                                                    323,660      322,026         1,634             0.5
Trading portfolio (w/o loans)                                                                          57,690       50,764         6,926            13.6
Available-for-sale financial assets                                                                    23,843       20,132         3,711            18.4
Due from credit institutions (2)                                                                       66,925       90,530      (23,605)          (26.1)
Intangible assets and property and equipment                                                            4,965        5,054            (88)          (1.7)
Other assets                                                                                           22,160       21,955           204             0.9
Total assets/liabilities & shareholders' equity                                                      499,243      510,461      (11,217)            (2.2)
Customer deposits (2)                                                                                 247,715      198,144        49,571            25.0
Marketable debt securities (2)                                                                         48,413       50,610        (2,196)           (4.3)
Subordinated debt (2)                                                                                   1,740        2,079          (339)         (16.3)
Insurance liabilities                                                                                     933       10,287        (9,354)         (90.9)
Due to credit institutions (2)                                                                         77,029      117,509      (40,480)          (34.4)
Other liabilities                                                                                      95,993      105,366        (9,373)           (8.9)
Shareholders' equity (3)                                                                               27,420       26,466           953              3.6
Other customer funds under management                                                                 53,968       70,289      (16,322)          (23.2)
  Mutual funds                                                                                         37,519       44,598        (7,079)         (15.9)
  Pension funds                                                                                        10,965       11,310          (345)           (3.0)
  Managed portfolios                                                                                    5,484        5,499            (15)          (0.3)
  Savings-insurance policies                                                                               —         8,882        (8,882)       (100.0)
Customer funds under management                                                                      351,836      321,122        30,714              9.6

(1).- Including dividends, income from equity-accounted method and other operating income/expenses
(2).- Including all on-balance sheet balances for this item
(3).- Not including profit of the year


110                                                                                                                             ANNUAL REPORT 2010
ACTIVITY                                    LOANS / DEPOSITS
CONTINENTAL EUROPE                                                   % variation 2010 / 2009                     %

• Commercial strategy: capturing deposits given priority


                                                                                                 +31.1
  and continued selective growth in loans.
• Revenues affected by the weak economic environment,                                                                  163
  reduced activity and low interest rates.
• Control of expenses, with commercial units as a whole
  flat on a like-for-like basis.                                                                                                                            131


                                                                                      +0.5
• Provisions affected by the Bank of Spain Circular
  (negative after tax impact on profits of EUR 472 million).                                                         2009                                 2010
                                                                                     Loans Deposits*
                                                                     (*) W/o REPOs


                                                                     NET OPERATING INC.                          ATTRIBUTABLE PROFIT
                                                                     Million euros
                                                                                                         -5.0%   Million euros
                                                                                                                                                       -22.8%
Attributable profit was EUR 3,885 million, 22.8% less than in


                                                                                       10,312
2009 and impacted by the application of the Bank of Spain's


                                                                                                 9,794
Circular (-13.4% excluding its impact).


                                                                                                                                    5,031
Continental Europe includes all activities carried out in this


                                                                                                                                               3,885
geographic area: retail banking, global wholesale banking, asset
management and insurance.

Strategy
In an environment that still remains weak, the Group’s strategy
focused on capturing deposits, which, combined with low
demand for loans, is reflected in the rapid improvement in the                       2009       2010                             2009 2010(1)
gap between credits and deposits; managing spreads on loans                                                      (1) Before the impact from the application of Bank of
                                                                                                                    Spain’s Circular 3/2010: 4,357 million; -13.4%
in a context of very low interest rates; control of costs and risk
management centred on recoveries. Meanwhile, the sale of
products and services was strongly aimed at capturing and
linking customers.

Activity                                                             Operating expenses increased slightly because of a perimeter
Lending remained virtually unchanged from 2009, due to lower         effect in Santander Consumer Finance and an increase in costs
demand in Spain and Portugal, partly offset by the growth in the     at Global Banking & Markets, as the Santander Branch Network,
business of Santander Consumer Finance.                              Banesto and Portugal reduced their costs a little. Provisions for
                                                                     loan losses increased 34.7%, due to the environment and
Deposits (without repos) increased 31%, fuelled by the strategy      applying the Bank of Spain’s new regulations, whose impact is
of capturing deposits in the networks in Spain and Portugal.         fully reflected in Continental Europe, (-13.4% excluding this
                                                                     impact).
The strategy aimed, on the one hand, to bolster the Group’s
liquidity position (the credit/deposits ratio improved by 32 p.p.)
and, on the other, increase the market share by capturing and
linking high-income customers. The Group improved its market
share of deposits in Spain in 2010, after capturing more than
100,000 customers. This also had a favourable impact on
transactions, according to the National Service of Electronic
Settlement.
                                                                     NPL RATIO                                   NPL COVERAGE
Growth in mutual funds and pension funds remained affected           %                                           %
by the strategy of greater preference for deposits. Total funds
                                                                                                 4.34


(deposits, mutual and pension funds) increased 22%.
                                                                                       3.64


Results
                                                                                                                                    77


Gross income fell 1.7% due to the decline in net interest income
                                                                                                                                               71


in the three large networks. The repricing of mortgages and the
higher cost of funds was almost offset by the better evolution of
Santander Consumer Finance and higher gains on financial
transactions from wholesale business.

                                                                                     2009       2010                             2009       2010


     ANNUAL REPORT 2010                                                                                                                                         111
CONTINENTAL EUROPE. MAIN UNITS
Million euros
                                                                     Santander                                             Santander
                                                                Branch Network                          Banesto      Consumer Finance                      Portugal
                                                                 2010       Var (%)           2010       Var (%)       2010      Var (%)          2010      Var (%)
INCOME STATEMENT
Net interest income                                              3,682         (9.0)          1,521       (12.9)       3,663       13.4            724         (8.7)
Net fees                                                         1,080          (9.0)           617           1.6        955       11.8            357           3.9
Gains (losses) on financial transactions                           110        (14.0)            196          18.9          (6)    (60.1)             67       (17.3)
Other operating income (1)                                          (31)         1.4              69          8.0          22        4.7             42       (17.4)
Gross income                                                     4,841         (9.1)          2,403         (7.0)      4,634       13.3          1,190         (6.2)
Operating expenses                                              (2,072)         (0.8)        (1,027)         (0.4)    (1,273)      13.8           (540)         (0.6)
  General administrative expenses                               (1,910)         (1.0)          (904)         (0.6)    (1,156)      13.9           (467)         (0.3)
      Personnel                                                 (1,234)         (0.1)          (666)         (2.4)      (595)      17.3           (321)          1.1
      Other general administrative expenses                       (676)         (2.7)          (237)          4.8       (561)       10.5          (146)         (3.2)
  Depreciation and amortisation                                   (161)           1.9          (124)          0.8       (117)       13.3            (73)        (2.4)
Net operating income                                             2,769       (14.5)           1,376       (11.3)       3,361       13.1            650       (10.4)
Net loan-loss provisions                                        (1,091)       127.1            (709)         87.0     (2,017)        2.6          (110)         20.8
Other income                                                          25           —             (29)        26.3       (143)     215.0              20       132.4
Profit before taxes                                              1,703       (38.0)             637       (44.5)       1,201       25.1            560       (12.9)
Tax on profit                                                     (460)       (38.0)           (161)       (51.7)       (339)       23.9          (104)         (6.5)
Profit from continuing operations                                1,243       (38.0)             476       (41.6)         861       25.5            457       (14.2)
Net profit from discontinued operations                               —            —               —           —          (14)    (69.3)              —           —
Consolidated profit                                              1,243       (38.0)             476       (41.6)         847       32.1            457       (14.2)
Minority interests                                                     0      (33.7)               57      (26.0)          37     192.2                1      (41.9)
Attributable profit to the Group                                 1,243       (38.0)             419       (43.2)         811       28.9            456       (14.2)

BALANCE SHEET
Customer loans (2)                                             111,372          (3.4)       75,624            0.2      63,342      11.4          30,102          (6.8)
Trading portfolio (w/o loans)                                       —             —          6,575           (4.1)      1,146      (0.5)          1,741          35.4
Available-for-sale financial assets                                 —             —          9,025           15.2         558      16.1           6,458          67.0
Due from credit institutions (2)                                   214        937.3         17,103         (27.2)       8,016      17.2           3,401        (39.6)
Intangible assets and property and equipment                     1,201          (0.9)        1,374           (3.5)        889       4.3             480          (1.3)
Other assets                                                       481        (13.0)         7,520            2.6       2,892       3.2           7,091          45.7
Total assets/liabilities & shareholders' equity               113,268          (3.2)      117,222           (4.2)     76,844       11.4         49,272            1.7
Customer deposits (2)                                           85,667          18.3        59,721             7.5     25,950      16.1          21,727          45.4
Marketable debt securities (2)                                      —             —         27,684           (7.4)     11,717      58.4           7,544        (35.4)
Subordinated debt (2)                                               —             —          1,304           (2.7)        428      (7.9)              0        (99.9)
Insurance liabilities                                               —             —             —               —          —         —               79        (98.4)
Due to credit institutions (2)                                     457          18.2        13,422         (26.9)      25,864      (6.4)         16,818          23.0
Other liabilities                                               20,089        (45.8)        10,611         (17.7)       4,273      15.3           1,171        (11.7)
Shareholders' equity (3)                                         7,056          (1.8)        4,480             3.4      8,611      15.5           1,933            9.7
Other customer funds under management                          26,864          (7.2)         9,616        (12.9)           24        —            4,655       (54.3)
  Mutual funds                                                  20,347          (6.1)        5,712         (22.5)          19        —            3,209        (19.4)
  Pension funds                                                  6,132          (1.1)        1,337           (5.6)          5        —            1,315          (5.9)
  Managed portfolios                                                —             —            117             1.7         —         —              131            7.1
  Savings-insurance policies                                       385        (64.9)         2,450           14.8          —         —               —       (100.0)
Customer funds under management                               112,531          11.0        98,325             0.5     38,118       26.1         33,927          (8.5)

(1).- Including dividends, income from equity-accounted method and other operating income/expenses
(2).- Including all on-balance sheet balances for this item
(3).- Not including profit of the year


112                                                                                                                                        ANNUAL REPORT 2010
ACTIVITY                                    LOANS / DEPOSITS
SANTANDER BRANCH NETWORK                                           % variation 2010 / 2009                     %

• Successful strategy to capture deposits, with market


                                                                                              +18.3
  share gains in demand deposits, time deposits and
  mutual funds.
                                                                                                                     159
• Lower gross income due to reduced lending and low
  official interest rates.
• Flat expenses in the last three years.
                                                                                                                                                          130
• Better non-performing loans than the sector and higher
  provisions due to the Bank of Spain Circular.


                                                                                   -3.4
• Best Bank in Spain prize from Euromoney.                                    Loans Deposits                        2009                                2010


Attributable profit was EUR 1,243 million, 38.0% lower than in     and Cuenta Crecimiento. The direct results were an
2009 (-23.4% excluding the application of the Bank of Spain's      improvement in the financing structure (the lending/deposits
Circular 3/2010).                                                  ratio was improved by 29 p.p.), and a significant gain in market
                                                                   share of more than 100 b.p.
Banking was conducted in 2010 in an unfavourable
environment, with strong pressures from the markets and            The growth in deposits was accompanied by an improvement in
continued weak economic activity. Non-performing loans             the market share of mutual funds of 130 b.p., as their evolution
continued to rise and interest rates remained at low levels.       was better than the market’s. Funds managed by Santander
                                                                   declined 6% compared to a fall of 15% for the sector. As a
Strategy                                                           result, the Group recovered leadership in mutual funds with a
In this environment, the Santander Branch Network focused on       market share of 18.5%.
capturing deposits, defending spreads, controlling expenses and
risk management, which together with capturing, linking and        In lending, the overall balance dropped 3% because of the slight
retaining customers, were the main priorities. It was also very    fall in mortgages and the double-digit reduction in balances
active in selling new products and services, tailored to           with a real estate purpose. Balances with institutions increased
customers’ needs and aimed at specific segments.                   21%, with businesses 5% and with large companies 5%.

The Cuenta con Nosotros was launched for individual                Of note in the sphere of public institutions was the plan to
customers. It offers up to eight products and is very focused on   capture civil servants. Their number reached 125,000 (+10,500
capturing and linking customers from the start. The Santander      in 2010).
Ferrari card, aligned with the global brand strategy, was also
launched for individual customers, and in just six weeks 100,000   As regards the ICO lending programme for businesses and
were sold.                                                         SMEs, the Santander network held its leadership position
                                                                   (market share of 18%), after formalising 53,000 operations
The Cuenta Bienvenida Negocios was launched for companies,         amounting to more than EUR 3,800 million.
particularly SMEs and businesses. This product boosts the level
of new customer transactions.

In personal banking, Santander Select, a new business model
based on an integral service for customers, was marketed. It is
offered through 370 specialised managers and provides a range      NET OPERATING INC.                          ATTRIBUTABLE PROFIT
of specific products including the Fondos Select, which combine    Million euros
                                                                                                      -14.5%   Million euros
                                                                                                                                                     -38.0%
investments in own and third party products.
                                                                                    3,240


                                                                                             2,769


All these measures are part of the We want to be your Bank
                                                                                                                                  2,005


strategic plan, launched five years ago and which has benefited
4.2 million customers, who don't pay any service fees. This plan
                                                                                                                                             1,243


is thriving, as shown by the copies of it launched by our
competitors during 2010.

Activity
The strategy was mainly focused on capturing customer funds.
Deposits rose 18%, with demand deposits up 13% (setting us
                                                                              2009          2010                               2009 2010(1)
apart in the sector) and time deposits up 25%, reflecting the
                                                                                                               (1) Before the impact from the application of Bank
success of the campaign with the products Depósito Ganador                                                        of Spain’s Circular 3/2010: 1,536 million; -23.4%


     ANNUAL REPORT 2010                                                                                                                                         113
Results                                                              BANESTO
The results in 2010 reflect the impact of the Bank of Spain’s
new regulations on provisions (anticipation and simplification of
calendars) in the third quarter. This one-off charge amounted to     • The balance sheet and the capital and liquidity positions
EUR 402 million recorded in specific provisions for loan losses.       were strengthened.
As no generic provisions were released, the whole charge was         • Revenue growth benefited from the capturing and
made against the unit’s results. The impact on profits, net of         linking of individual customers and SMEs.
tax, was EUR 293 million.
                                                                     • Very disciplined expenses, which continued to decline.
After absorbing this impact, attributable profit was EUR 1,243       • Good evolution of credit risk quality, better than that of
million, 38.0% lower than in 2009 (-23.4% excluding the                our competitors, and higher provisions because of the
change in regulations).                                                Bank of Spain’s Circular.
Gross income was 9.1% lower at EUR 4,841 million. This was           • Best Bank in Spain prize from Euromoney.
due to net interest income, affected by the lower demand for
loans, the repricing of mortgages and the higher cost of funds
resulting from stiffer competition for deposits, as well as to net
fee income and gains on financial transactions, where those          Banesto’s attributable profit was EUR 419 million, 43.2% lower
most directly linked to activity (securities, commercial bills and   than in 2009 (-28.1% excluding application of the Bank of
derivatives) declined. Those linked to transfers, domiciling,        Spain's Circular), while provisions notably strengthened the
factoring and confirming increased, as well as those from            Group’s financial position.
pension funds.
                                                                     Strategy
Operating expenses were 0.8% lower. This reduction was               These results were due to the involvement of all employees in
achieved without reducing installed capacity, enabling business      selecting priorities focused on capturing and linking customers
to be strengthened and a gain in market share. The efficiency        in order for Banesto to be the reference bank for individuals and
ratio, including amortisations, was 42.8% and 39.5% excluding        companies. The three pillars of the strategy were: defence of
them.                                                                revenues, cost control and prudent risk management.

Net operating income of EUR 2,769 million underscored                These policies went hand in hand with the quality of service as
Santander’s capacity to generate recurring results even in the       the foundation of the value offer. Banesto improved its
most difficult environments.                                         standards of quality during 2010, as shown, among other
                                                                     things, by having attained the best rating of Spanish banks in
This figure was almost three times higher than the provisions        the EFQM evaluation conducted by the Excellence Club in
made during 2010 (EUR 1,091 million) including the EUR 402           Management.
million resulting from the change in the Bank of Spain’s
regulations, and four times the recurring provisions (EUR 689        This was made possible, among other circumstances, by the
million excluding this impact).                                      competitive advantage provided by Banesto’s technology
                                                                     capacity whose innovative solutions are a differential factor over
Active management of non-performing loans was reflected in a         our competitors, as well as by the Bank’s financial strength.
15% fall in gross entries and a recovery ratio of around 70%.
The NPL ratios of Banco Santander parent bank (4.24%) and of         All of these factors enabled Banesto to become more efficient,
the Santander Branch Network (5.52%), excluding wholesale            improve its procedures and products and launch new initiatives,
activity, were lower than the sector’s. Coverage for Banco           such as the Nómina iPad, IPF Selección and the Banesto
Santander parent bank was 54% and 52% for the Network.               Fidelidad programme for greater customer linkage.

                                                                     As in the rest of segments, Banesto’s figures were drawn up
                                                                     again in accordance with the criteria set out on page 108 of this
                                                                     report. The figures presented here, therefore, do not coincide
                                                                     with those published by Banesto itself.
NPL RATIO                          NPL COVERAGE
%                                  %
                                                                     Activity
                                                                     The evolution of the balance sheet was consistent with the
                    5.52


                                                                     management policy developed in 2010. Capturing and linking
            4.38


                                                                     customers was one of the priorities in 2010. The customer base
                                               65


                                                                     grew significantly. Deposits excluding repos increased 18% and
                                                     52


                                                                     time deposits rose by an even stronger 36%. Off-balance sheet
                                                                     managed funds were 13% lower than in 2009.


          2009     2010                      2009   2010


114                                                                                                             ANNUAL REPORT 2010
ACTIVITY                          LOANS / DEPOSITS                NET OPERATING INC.                        ATTRIBUTABLE PROFIT
% variation 2010 / 2009           %                               Million euros
                                                                                                   -11.3%   Million euros
                                                                                                                                              -43.2%


                                                                                  1,551


                                                                                           1,376
                         +17.7        136


                                                                                                                              738


                                                                                                                                        419
                                                          127
                 +0.2


                Loans Deposits*       2009               2010                2009         2010                              2009 2010(1)
(*) W/o REPOs                                                                                               (1) Before the impact from the application of Bank
                                                                                                               of Spain’s Circular 3/2010: 531 million; -28.1%


In 2010 demand for loans was lower. In this context, Banesto      Net operating income dropped 11.3% to EUR 1,376 million.
continued its policy of selective growth. Customer loans at the
end of 2010 stood at EUR 75,624 million, almost the same as a     Net loan-loss provisions rose 87.0% to EUR 709 million, due, on
year earlier.                                                     the one hand, to the rise in non-performing loans, although
                                                                  Banesto’s are increasing at a slower pace than the banking
Non-performing loans (NPLs) continued to rise because of the      system’s as a whole, and, on the other, the impact of the
weak economic environment. The NPL ratio was 4.11% and            change in the Bank of Spain’s regulations, which meant a
coverage 54%.                                                     charge against earnings of EUR 178 million (EUR 112 million
                                                                  after tax)
Results
Net interest income was 12.9% lower at EUR 1,521 million.         Profit before tax was EUR 637 million. Attributable profit after
Management of spreads and of the balance sheet largely offset     taxes and minority interest was EUR 419 million, 43.2% lower
the impact of slower business growth.                             than in 2009 (-28.1% excluding the impact of the extraordinary
                                                                  charge).
Net fee income amounted to EUR 617 million, 1.6% more than
in 2009. The business model, backed by growth in the customer
base and linkage, is producing continuous improvement in
transactions and boosting revenue from services and insurance
(+2.7% in 2010). Revenue from management of mutual and
pension funds, however, dropped 5.8%.                             NPL RATIO                                 NPL COVERAGE
                                                                  %                                         %
Gains on financial transactions, whose main component is still
                                                                                           4.11


distribution of treasury products to customers, increased 18.9%
to EUR 196 million.
                                                                                  2.97


                                                                                                                              64


                                                                                                                                        54

Gross income was 7.0% less at EUR 2,403 million.

As a result of disciplined cost control, operating expenses
declined 0.4% to EUR 1,027 million and together with revenue
produced an efficiency ratio of 42.8%, (37.6% excluding
amortisations).
                                                                             2009         2010                              2009      2010


        ANNUAL REPORT 2010                                                                                                                               115
ACTIVITY                                   REDUCED FINANCING RECOURSE
SANTANDER CONSUMER FINANCE                                           % variation 2010 / 2009                    TO THE PARENT BANK
                                                                                                                Billion euros
• Rise in revenues, due to higher volumes, management of
  prices, fee income from the incorporation of portfolios in


                                                                                               +16.1
  the US and a still low cost of financing.
• Lower expenses on a like-for-like basis.


                                                                                                                       15
                                                                                     +11.4
• Lower specific provisions because of the sharp fall in the
  risk premium (to levels of the second quarter of 2008).


                                                                                                                                  9
• Improved quality of the credit portfolio, with a lower NPL
  ratio and higher coverage.
• The business of AIG in Poland was incorporated in the                                                                                            0 Target
  second half of 2010 and the unit in Russia sold.                              Loans Deposits                      2009       2010                in 2012


Attributable profit was EUR 811 million, 28.9% more than in          Activity
2009 (+31.8% excluding the impact of the Bank of Spain’s             Lending amounted to EUR 63,342 million, 11% more than in
Circular).                                                           2009 because of organic growth and the portfolios integrated
                                                                     in the US and Poland. The area also manages the servicing of
Strategy                                                             EUR 6,000 million of third parties in the US.
The focus was on organic growth and cross-selling, backed by
brand agreements and greater penetration in the used card            New lending (EUR 24,650 million) was on a very positive trend,
segment, which offset the decline in new car sales in Europe.        as it began the year with negative growth rates and ended it up
There was also a notable effort in risk control, admission and       9%. The main engine of lending was auto finance for used cars
recoveries, which enhanced credit quality.                           (+25% y-o-y), which offset the weakness in other segments,
                                                                     particularly new vehicles (+1%) although this segment
The area also continued to actively manage its businesses:           performed better than the market (-5% y-o-y in Europe).
expansion into high potential markets and exit from
businesses without critical mass, such as the sale of the unit in    Activity was stronger in the US (new loans doubled), Spain
Russia.                                                              (+18%), the UK (+16% in sterling) and Nordic countries (+13%
                                                                     in local currency). All of this offset the 10% fall in new loans in
Of note was the consolidation in Poland of AIG Bank, making          Germany because of the end of the scrappage scheme (new car
Santander Consumer Poland one of the leaders in consumer             sales fell 23%).
finance, and the acquisition in the US of the portfolios of third
parties at a discount, which improved the quality of the portfolio   Customer deposits increased 16% to EUR 25,950 million, fuelled
and increased the profile of the target customers of Santander       by the capacity to capture funds in Germany and the
Consumer USA.                                                        incorporation of Poland. In addition, and as part of the strategy
                                                                     developed by the Group to optimise the use of liquidity,
Significant progress was also made in the integration of new         Santander Consumer Finance stepped up the volume of issues
units. Of note in Germany, was the integration of GE                 and sharply reduced its recourse to the Group’s parent bank in
combined with the migration to the Partenón corporate                order to attain total self-financing in 2012.
platform of most of the business modules. This process is
expected to be completed this year. This will be the operating       Results
base for integrating the retail business of SEB acquired in          These actions were clearly reflected in the income statement:
January 2011.
                                                                     • Gross income increased 13.3%, backed by the most basic


NEW LENDING BY COUNTRIES                                             NET OPERATING INC.                         ATTRIBUTABLE PROFIT
%                                                                    Million euros
                                                                                                       +13.1%   Million euros
                                                                                                                                                   +28.9%
                        Austria 2% Netherlands 2%
                                                                                              3,361


                  Portugal 2%
                                                                                     2,972


      United Kingdom 7%
                                                                                                                                             811


          Poland 3%
                                                    Germany 36%
                                                                                                                                  629


 Nordic countries
           15%


            Italy 13%                                                           2009         2010                               2009 2010(1)
                                                                                                                (1) Before the impact from the application of Bank
                                             USA 12%                                                               of Spain’s Circular 3/2010: 829 million; +31.8%
                        Spain 8%


116                                                                                                                           ANNUAL REPORT 2010
revenues: net interest income (+13.4%), due to the rise in the     PORTUGAL
    average portfolio and management of spreads and fee income
    (+11.8%), due to greater activity and servicing in the US.
                                                                       • Revenues dented by low interest rates, reduced activity
                                                                         and strong competition for liquidity.
• Higher expenses (+13.8%) due to the expansion in Poland and
  the US. At constant perimeter and exchange rates, they were          • Lower expenses for the second year running.
  1.4% lower, due to control and the synergies obtained from
  the integration of GE, particularly in Germany.                      • Prudent management in risks and provisions.
                                                                       • Improvement in the commercial gap and in the balance
• The efficiency ratio was 27.5%, much better than that of its           sheet structure as a result of the large rise in deposits and
  competitors, and net operating income was 13.1% higher.                selective growth in lending
• Stable loan-loss provisions (+2.6% y-o-y) pushed up growth in        • Best bank in Portugal prize from Global Finance,
  net operating income after provisions to 33.6% (+0.5% in 2009).        Euromoney and The Banker.

    The provisions reflect the impact of the more demanding
    regulatory requirements in Spain (+EUR 26 million) and the         Santander Totta’s attributable profit of EUR 456 million was
    higher generic provisions from larger volumes and portfolios.      14.2% lower than in 2009.
    Both were offset by lower specific provisions from the enhanced
    credit quality. The non-performing loan ratio declined from        Activity was conducted in a very difficult environment, due to
    5.39% to 4.95% and coverage rose by 31 p.p. to 128%.               the economic downturn, the drop in investment and private
                                                                       consumption, the persistence of the sovereign debt crisis and
• In the rest of items, lower negative impact of discontinued          the lack of liquidity.
  operations and higher minority interests in Poland.
                                                                       Strategy
The trends for the whole area were similar in individual countries,    In this environment, Santander maintained solid capital ratios,
though with varying degrees of intensity. Germany, which               an efficiency ratio of 45.4% and a high return on equity of more
generates the largest profits, increased its contribution to the       than 20%. In all of them, Santander Totta was better than its
Group by 6.9% in an environment of weak activity, thanks to            competitors.
management of spreads, lower costs (-0.9%) and stable provisions.
                                                                       One of the main strategic priorities in 2010 was the stronger
Santander Consumer USA, the second largest contributor,                focus on capturing funds in order to gain market share, capture
increased its attributable profit 54.7% in dollars. The main factors   and link customers and improve the balance sheet structure
behind this were larger volumes (organic generation and                with more stable funds. Various products were marketed such
integration of portfolios), higher revenues from servicing and the     as the DP Vencedor, the DP Ganhador, the DP Champion and
lower cost of credit from the improved quality of the portfolio.       the Super Poupança Ídolos with very attractive returns, within a
                                                                       strategy of differentiating Santander from its rivals.
The evolution was also very positive in Nordic countries (+69.6%
in attributable profit) and the UK (doubled), albeit from low          Risks and recoveries continued to be actively managed, in line
bases. In both cases the better results were due to greater            with the cycle of deterioration in credit quality indicators. This
activity and lower provisions.                                         management enabled Santander Totta to maintain better ratios
                                                                       than the system’s, according to the latest available figures.
In other countries, Spain’s performance was still weak, reflected
in lower revenues, which the area is offsetting with lower costs       Throughout 2010, Santander Totta again received some of the
and provisions clearly below those of 2009 (-29.3%) due to the         main prizes, such as Best Bank in Portugal from Global Finance,
better credit quality. Lastly, the business volume in Poland after     Euromoney and The Banker. The prizes singled out various
the integration of AIG Bank was larger (in December EUR 3,300          aspects related to growth, profitability, efficiency, solvency, cost
million in loans and EUR 1,000 million in deposits).                   control and risks in a complicated environment.

                                                                       Activity
                                                                       The main development was the 45% growth in deposits which,
NPL RATIO                           NPL COVERAGE                       combined with the 7% fall in lending, produced a big
%                                   %
                                                                       improvement in the loan / deposit ratio (from 216% to 139%)
                                                                       and in the financing structure of the balance sheet, key
                                                                       elements in an environment of significant restrictions in
                                                                       financing in international markets.
                                                      128
             5.39


                     4.95


                                                                       The evolution of funds reflected the intense activity of
                                               97


                                                                       campaigns under a strategy focused on capturing deposits. They
                                                                       increased, largely due to time deposits, while mutual and
                                                                       pension funds declined 16%.

                                                                       Gross lending amounted to EUR 30,634 million. Its main
                                                                       components were mortgages to individuals (EUR 16,452 million)
           2009     2010                      2009   2010


       ANNUAL REPORT 2010                                                                                                                117
ACTIVITY                           LOANS / DEPOSITS                   NET OPERATING INC.                      ATTRIBUTABLE PROFIT
% variation 2010 / 2009            %                                  Million euros
                                                                                                     -10.4%   Million euros
                                                                                                                                           -14.2%
                    +45.4

                                       216


                                                                                      726


                                                                                              650


                                                                                                                              531


                                                                                                                                     456
                                                             139
            -6.8


           Loans Deposits              2009                 2010                 2009        2010                        2009       2010


and loans to SMEs (EUR 9,481 million). The most problematic           The efficiency ratio was 45.4% and net operating income
balances – those related to construction and real estate              10.4% lower at EUR 650 million.
development – only amounted to EUR 1,169 million (less than
4% of total lending).                                                 Loan-loss provisions increased 20.8% to EUR 110 million,
                                                                      reflecting a prudent policy of adjusting to the economic cycle
Total lending was 7% lower, due to a 10% reduction in balances        with higher NPL ratios. The ratio of Santander Totta inched up
with the construction and real estate development sectors and         to 2.90% and coverage was 60%.
to large companies, a segment where there has been a shift
from lending to financing via issues of securities. Mortgages and     On a like-for-like basis (i.e. local criteria), Santander Totta’s
balances with small firms rose a little.                              performance was better than the sector’s and its NPL ratios
                                                                      lower, according to the latest available figures.
Lastly, its investment in Portuguese bonds, as part of its ordinary
management of assets and liabilities, amounted to EUR 2,364           Profit before tax was EUR 560 million, 12.9% lower. Attributable
million at the end of 2010.                                           profit was EUR 456 million, down 14.2%.

Results
Net interest income was 8.7% lower at EUR 724 million, due to
the reduced business volumes, the strong competition for
deposits and the higher cost of financing. Moreover, in 2009 net
interest income benefited from results relating not only to the
lag between the evolution of Euribor and the repricing of loans,
but also to results obtained in hedging the sensitivity of the net
interest margin.
                                                                      NPL RATIO                               NPL COVERAGE
Net fee income increased 3.9% to EUR 357 million, due to the          %                                       %
increase from credit cards, mutual funds, asset management,
insurance and GBM. Gains on financial transactions dropped
                                                                                              2.90


17.3% to EUR 67 million.
                                                                                      2.27


                                                                                                                              65


Income accounted for by the equity method was lower and
                                                                                                                                     60


revenue from insurance was higher at EUR 37 million.

Gross income declined 6.2% to EUR 1,190 million. Rigorous
control of operating expenses continued to be a strategic
priority, and particularly important at a time of weaker revenues.
Costs evolved better than the sector (-0.3% in general expenses                  2009        2010                        2009       2010
and -2.4% in amortisations)


118                                                                                                                     ANNUAL REPORT 2010
REST OF EUROPE
The rest of businesses in this geographic area (GBM, asset
management, insurance and Banif) generated attributable
profit of EUR 957 million, 15.2% lower than in 2009 (-10.9%
excluding the impact of the Bank of Spain’s Circular).

The attributable profit of Global Wholesale Banking, the main
unit included here (95% of total profits), dropped 9.0% to
EUR 914 million.

Gross income was stable, which was noteworthy given that
the first half of 2009 was exceptional, given the market
conditions. 2009 was a record year in revenues and profits.
Costs increased because of investments made to consolidate
positions attained in 2009 in target businesses.

Provisions increased because of the environment, the reduced
use of generic provisions and the impact of the Bank of
Spain’s Circular.

The attributable Profit of Asset Management and insurance
was 4.2% lower, in line with gross income performance.

The latter was 4.6% lower due to the net of two factors. On
the one hand, lower fee income from the decline in
management of mutual and pension funds, under the Group’s
strategy in developed countries, which gave priority to
liquidity, and customers’ preference for attractive offers in
deposits. And, on the other hand, higher revenues from
insurance.


     ANNUAL REPORT 2010                                         119
UNITED KINGDOM
Million euros
                                                                                                                            Variation
                                                                                                        2010        2009     Amount              %
INCOME STATEMENT
Net interest income                                                                                    4,431       3,934        497           12.6
Net fees                                                                                                 957         993        (36)          (3.6)
Gains (losses) on financial transactions                                                                 465         506        (41)          (8.2)
Other operating income (1)                                                                                 29         27           2            5.8
Gross income                                                                                           5,882       5,460        422             7.7
Operating expenses                                                                                    (2,315)     (2,229)       (85)            3.8
  General administrative expenses                                                                     (2,029)     (1,997)       (32)            1.6
      Personnel                                                                                       (1,209)     (1,170)        (40)           3.4
      Other general administrative expenses                                                             (819)       (827)          8           (0.9)
  Depreciation and amortisation                                                                         (286)       (233)        (53)         22.7
Net operating income                                                                                   3,567       3,231        337           10.4
Net loan-loss provisions                                                                                (760)       (881)       121          (13.8)
Other income                                                                                              (85)         17      (103)             —
Profit before taxes                                                                                    2,722       2,367        355           15.0
Tax on profit                                                                                           (737)       (641)        (96)         15.0
Profit from continuing operations                                                                      1,985       1,726        259           15.0
Net profit from discontinued operations                                                                     —          —           —             —
Consolidated profit                                                                                    1,985       1,726        259           15.0
Minority interests                                                                                           0          0           0            —
Attributable profit to the Group                                                                       1,985       1,726        259           15.0

BALANCE SHEET
Customer loans (2)                                                                                    233,856     227,713     6,144             2.7
Trading portfolio (w/o loans)                                                                          45,187      41,245     3,941             9.6
Available-for-sale financial assets                                                                       204         897      (693)         (77.3)
Due from credit institutions (2)                                                                       29,137      28,745       392             1.4
Intangible assets and property and equipment                                                            2,323       1,424       899           63.1
Other assets                                                                                           42,063      24,522    17,540           71.5
Total assets/liabilities & shareholders' equity                                                      352,769     324,546    28,223              8.7
Customer deposits (2)                                                                                 184,548     166,607    17,941            10.8
Marketable debt securities (2)                                                                         64,326      58,611     5,714             9.7
Subordinated debt (2)                                                                                   8,143       8,577      (433)           (5.1)
Insurance liabilities                                                                                       1           3         (2)        (64.4)
Due to credit institutions (2)                                                                         54,159      57,879    (3,721)           (6.4)
Other liabilities                                                                                      29,831      26,946     2,885            10.7
Shareholders' equity (3)                                                                               11,762       5,923     5,838            98.6
Other customer funds under management                                                                 14,369      10,937      3,432           31.4
  Mutual funds                                                                                         14,369      10,937     3,432            31.4
  Pension funds                                                                                            —           —          —              —
  Managed portfolios                                                                                       —           —          —              —
  Savings-insurance policies                                                                               —           —          —              —
Customer funds under management                                                                      271,386     244,731    26,655            10.9

(1).- Including dividends, income from equity-accounted method and other operating income/expenses
(2).- Including all on-balance sheet balances for this item
(3).- Not including profit of the year


120                                                                                                                         ANNUAL REPORT 2010
ACTIVITY                                  LOANS / DEPOSITS
UNITED KINGDOM                                                         % variation 2010 / 2009 (sterling)        %
• Double-digit growth in profits for the sixth straight year.
• Larger number of products and services offered: market


                                                                                                     +7.4
  share gains in mortgages and loans to SMEs.
                                                                                                                       137
• Further improvement in the efficiency ratio (39.4%): better
  than the competitors in the UK.


                                                                                          +3.8
• The non-performing loan ratio performed better than the
  market.                                                                                                                                              127
• Change of brand completed in 2010 and agreement
  reached to acquire 318 RBS branches and 40 corporate
  centres.                                                                             Loans* Deposits               2009                             2010

• Best Bank in the UK prize from The Banker and Euromoney              (*) w/o REPOs


Santander UK generated an attributable profit of EUR 1,985             Among the measures to achieve this was the agreement in
million, 15.0% higher than in 2009. In sterling, the profit was        August with the Royal Bank of Scotland (RBS) to acquire 311 of
£1,701 million (+10.7%, the sixth straight year of double digit        its branches in England and Wales and seven of NatWest in
growth).                                                               Scotland, as well as 40 banking centres for SMEs, four company
                                                                       banking centres and three private banking centres. This
Economic environment                                                   agreement is another important strategic step for Santander UK,
GDP growth for the whole year was 1.4%, a trend which is               as it increases its distribution and cross-selling capacity and
likely to be maintained in the coming quarters. Inflation was          accelerates business growth in the segment of SMEs.
3.7%, partly due to the rise in indirect taxes and sterling’s slide.
In this context, the Bank of England held its base rate at 0.5%.       Lastly, as envisaged, brand unification was completed in 2010.
                                                                       The Group now operates in the UK with 1,416 Santander brand
Retail lending for the sector remained almost unchanged (+1%)          branches.
with lending to companies declining 4-5%. Customer deposits
grew at a slower pace to end the year at 3%.                           Activity
                                                                       All figures are in sterling, and as with the other segments,
Strategy                                                               figures have been restated according to the criteria on page 108
Thanks to the developments of recent years, Santander UK has           of this report. This means that the figures given below may not
attained significant market shares in core segments such as            coincide with those published by Santander UK on the basis of
mortgages (13.9%), deposits (10.2%) and current accounts               local criteria.
(9.2%).
                                                                       The main components of lending are residential mortgages
The strategy in 2010 focused mainly on strengthening the               (85% of total loans), personal loans (2%) and credits to
relationship with customers via greater linkage, increasing the        companies (13%, with SMEs accounting for 4%). The portfolio
range of products and services with special offers for existing        of mortgages is high quality, as there is no exposure to self-
customers, including:                                                  certified mortgages or subprime and buy-to-let loans account
                                                                       for less than 1%.
• The Loyalty Tracker Bond, which provides customers with one
  of the best interest rates. More than £1,300 million of
  deposits were captured since the launch in August 2010.

• The Santander Zero Account, which is free of certain services
  commissions and on account overdrafts for customers with a           NET OPERATING INC.                        ATTRIBUTABLE PROFIT
  mortgage, an investment product or whose main current                Million euros
                                                                                                       +10.4%*   Million euros
                                                                                                                                                    +15.0%*
  account is with Santander UK. More than 194,000 accounts
  were opened since the launch in January 2010.
                                                                                                   3,567
                                                                                          3,231


• Exemption of the 3% transfer commission in the Zero Credit
                                                                                                                                            1,985


  Card for customers with a mortgage or a current account.
                                                                                                                                   1,726


• Free access to the close to 4,300 ATMs of the Santander
  Branch Network in Spain for all Santander UK customers.

We continued to work to make Santander UK a universal bank
offering all types of services and products.
                                                                                       2009       2010                           2009      2010
                                                                       (*) In sterling: +6.3%                    (*) In sterling: +10.7%


     ANNUAL REPORT 2010                                                                                                                                  121
Furthermore, the structure of the balance sheet has improved in     In Retail Banking, there was a positive impact from greater
recent years, both from the standpoint of the loan/deposits ratio   retention of mortgages and customers’ preference for variable
(+ 10 p.p. in 2010) as well as exiting from non-strategic assets,   rate mortgages. In addition, growth in bank account liability
which is commented on later.                                        balances and hedging strategies helped to reduce the impact of
                                                                    lower interest rates on deposits. In SMEs and corporations,
Loans to customers (local criteria) amounted to £195,431            prudent management of spreads and growth in loans and
million at the end of 2010, 3% more than in 2009, due to 3%         deposits, also helped to lift net interest income.
growth in residential mortgages and 26% in loans to SMEs.
                                                                    Net fee income was lower than in 2009, in line with the market
Gross mortgages granted in 2010 amounted to £24,200 million,        trend in the UK. In retail business, revenue was reduced by the
8% less than in 2009 and reflecting the lower activity, while the   lower cancellation of mortgages and the policy of reducing
market share of 18% was in line with that in 2009. The focus on     UPLs. The change in the mix from structured products to
providing loans to low risk customers continued. The loan-to-       managed customer funds also continued, reducing current
value (LTV) of the stock remained unchanged at 51%.                 revenues but producing higher fees in the future.

A share of new loans above that corresponding to that of our        Gains on financial transactions declined 11.6%, as the market
branch network, combined with a good rate of retention,             situation in 2009 was not repeated in 2010 and there were
produced a further improvement in the share of the stock of         losses in the sale of the portfolio of Alliance & Leicester, which
mortgages (from 13.5% to 13.9%).                                    has been discontinued.

Santander UK continued to boost lending to SMEs via its             Operating expenses were virtually flat in 2010 (-0.1%). The
network of regional business centres. The stock of these loans      savings obtained from the integration of Alliance & Leicester
reached £8,500 million (market share of 3.6%, +0.9 p.p. since       were reinvested in growth in Corporate Banking and Global
the end of 2009).                                                   Banking & Markets.

On the other hand, under the policy of reducing UPLs pursued        The goal of achieving £180 million of cost savings from
over the last few years, the volume of these loans was 24%          synergies from the acquisition of A&L for 2011 remains
lower than in 2009 at £3,300 million.                               unchanged. We continued to eliminate overlapping in back
                                                                    office and support functions in all businesses. By the end of
The non-performing loan ratio ended 2010 at 1.76%, 0.11 p.p.        2010, over 90% of the target had been met.
less than in March 2010 as of when it declined. The stock of
foreclosed properties remained very low at 0.05% of the total       Loan-loss provisions were 17.0% lower than in 2009, thanks to
portfolio. The evolution, in general, was better than the sector,   the better evolution of retail products, mainly mortgages, which
according to the Council of Mortgage Lenders (CML).                 enabled high coverage levels to be maintained.

Santander UK continued to dispose of non-strategic assets (-21%     The combined effect of higher revenues, stable costs and lower
since 2009 and -37% since 2008). A&L’s treasury portfolio           provisions was a 15.0% rise in net operating income after
dropped by £10,000 million since the end of 2008 (-66%),            provisions. This did not fully feed through to attributable profit
£4,500 million of it in 2010.                                       because of the establishment, in the fourth quarter, of a £74
                                                                    million provision for possible contingencies.
Retail deposits increased 7% to £153,500 million, with a net
inflow of £9,600 million during 2010 and backed by all business
areas. The opening of more than 450,000 current accounts in
the second half of 2010 brought the total number close to one
million for the year, similar to that in 2009.

The sale of credit cards was also good. The number reached
435,000 (+13%), with the focus on existing customers.

Results
Santander UK continued to perform well, spurred by revenue          NPL RATIO                          NPL COVERAGE
                                                                    %                                  %
growth, strict control of costs and lower needs for provisions.
Profit was 10.7% higher at EUR 1,985 million (£1,701 million).

Gross income increased to EUR 5,041 million, strongly fuelled by
                                                                                        1.76
                                                                                1.71


net interest income (+8.5%).
                                                                                                                          46
                                                                                                                   44


The increase in net interest income reflects the balanced growth
of loans and deposits. The higher spread on loans was partly
offset by the higher cost of the deposit capturing campaign.
Moreover, the increased cost of funds and of liquid assets,
stemming from the new liquidity requirements, mainly in the
second half of the year, partly offset the strength of the core               2009     2010                       2009   2010
activity adding pressure to the net interest income which will
continue in 2011.


122                                                                                                             ANNUAL REPORT 2010
LATIN AMERICA
Million euros
                                                                                                                              Variation
                                                                                                        2010         2009      Amount          %
INCOME STATEMENT
Net interest income                                                                                   14,778       11,959       2,820       23.6
Net fees                                                                                                4,661        3,925        736       18.7
Gains (losses) on financial transactions                                                                1,410        1,663       (253)     (15.2)
Other operating income (1)                                                                                 (74)        121       (195)         —
Gross income                                                                                          20,776       17,668       3,108       17.6
Operating expenses                                                                                     (7,971)      (6,597)    (1,373)      20.8
  General administrative expenses                                                                      (7,193)      (6,032)    (1,161)      19.3
      Personnel                                                                                        (3,955)      (3,210)      (745)      23.2
      Other general administrative expenses                                                            (3,238)      (2,822)      (416)       14.7
  Depreciation and amortisation                                                                          (778)        (566)      (212)       37.5
Net operating income                                                                                  12,805       11,071       1,734       15.7
Net loan-loss provisions                                                                               (4,687)      (4,970)        283       (5.7)
Other income                                                                                             (747)        (673)        (74)      11.0
Profit before taxes                                                                                     7,371        5,428      1,943       35.8
Tax on profit                                                                                          (1,717)      (1,257)      (460)       36.6
Profit from continuing operations                                                                       5,654        4,171      1,483       35.6
Net profit from discontinued operations                                                                      —           90        (90)   (100.0)
Consolidated profit                                                                                     5,654        4,261      1,393       32.7
Minority interests                                                                                         850          428        422       98.5
Attributable profit to the Group                                                                        4,804        3,833        971       25.3

BALANCE SHEET
Customer loans (2)                                                                                    127,268       97,901     29,367       30.0
Trading portfolio (w/o loans)                                                                          31,580       22,521      9,059       40.2
Available-for-sale financial assets                                                                    30,697       29,154      1,543        5.3
Due from credit institutions (2)                                                                       21,632       22,146       (515)      (2.3)
Intangible assets and property and equipment                                                            4,880        3,926        954       24.3
Other assets                                                                                           57,186       38,105     19,082       50.1
Total assets/liabilities & shareholders' equity                                                      273,243      213,753     59,490        27.8
Customer deposits (2)                                                                                 137,848      108,122     29,726       27.5
Marketable debt securities (2)                                                                         15,376        8,411      6,964       82.8
Subordinated debt (2)                                                                                   5,683        4,888         794      16.3
Insurance liabilities                                                                                   9,515        6,627      2,888       43.6
Due to credit institutions (2)                                                                         38,026       32,765      5,262       16.1
Other liabilities                                                                                      45,989       34,994     10,996       31.4
Shareholders' equity (3)                                                                               20,805       17,946      2,859       15.9
Other customer funds under management                                                                 77,180       62,759     14,421        23.0
  Mutual funds                                                                                         61,621       49,681     11,940       24.0
  Pension funds                                                                                            —            —           —         —
  Managed portfolios                                                                                   14,800       12,538      2,262       18.0
  Savings-insurance policies                                                                              758          540         218      40.4
Customer funds under management                                                                      236,087      184,181     51,906        28.2

(1).- Including dividends, income from equity-accounted method and other operating income/expenses
(2).- Including all on-balance sheet balances for this item
(3).- Not including profit of the year


       ANNUAL REPORT 2010                                                                                                                      123
NET OPERATING INC.                               ATTRIBUTABLE PROFIT
LATIN AMERICA                                                           Million euros
                                                                                                           +15.7%*       Million euros                      +25.3%*
• Strong business, reflected in a faster pace of activity,


                                                                                                  12,805
  particularly in lending.


                                                                                        11,071


                                                                                                                                                    4,804
• Control of expenses, whose growth was below that of
  inflation.


                                                                                                                                         3,833
• Intense management of early bad loans and of their
  recovery, reflected in a notable decline in loan-loss
  provisions.
• On a like-for-like basis, attributable profit was 17.0% higher
  in local currency.
                                                                                       2009      2010                                  2009        2010
• Best bank in the region by The Banker and Euromoney.                  (*) Excluding exchange rate impact: -0.6%        (*) Excluding exchange rate impact: +10.5%


Santander generated attributable profit of EUR 4,804 million,           The global economic recovery, and in particular the dynamism
25.3% more than in 2009 (+10.5% excluding the exchange-rate             of Asian economies, is fuelling Latin American exports. The
impact). On a like-for-like basis, excluding the business in            trade surplus was more than 1% of GDP. The current account
Venezuela sold in 2009 and the impact of higher minority                deficit, which had dropped sharply in 2009, widened in 2010
interests (net of the placement of Santander Brazil shares in           but at 1.5% of GDP was comfortably financed by direct
2009 and the acquisition of the minority interests of Santander         investment flows (+27%).
Mexico in September 2010), profit from continued operations
increased 35.6% (+17.0% excluding the exchange rate impact).            In the current context of abundant global liquidity, Latin
                                                                        America has become one of the preferred destinies for
The trends in 2010 were upward quarter after quarter in all             investors. Comfortable current account positions and significant
items of the income statement and there was a notable pick up           inflows of capital are strengthening the region’s currencies in
in lending in almost all countries.                                     nominal terms and producing a build up of international
                                                                        reserves, which have already topped $560,000 million.
Economic environment
After showing in 2008 and 2009 a considerable resistance to the         The evolution of public accounts is also good, spurred by
external shocks emanating from the difficult economic                   growth in tax revenues. The budgets for 2011 aim to further
environment, Latin American economies registered a solid recovery       improve the situation and reduce the level of public debt,
in 2010. Average GDP growth was around 6.5%. This growth was            although it is already low (around 30% of GDP on average).
increasingly due to domestic demand, particularly investment and
private consumption, which are replacing the drive from restocking      In the countries where Santander operates, banking business is
and from the fiscal and monetary policies in 2009.                      picking up (+16% excluding Puerto Rico). Lending by the
                                                                        region’s banking systems increased 19% excluding the forex
Inflation remained moderate at close to 5% on average,                  impact. Loans to individuals rose 21% (cards: +10%; consumer
although in some countries inflationary pressures were in               credits: +19% and mortgages: +29%), while loans to companies
evidence and central banks took measures to counter them.               and institutions rose 18%.
Interest rates began to rise in Chile, Brazil and Peru, by 275 b.p.,
200 b.p. and 175 b.p. respectively, while in Mexico and                 Savings maintained their growth (+15%), rising more quickly in
Colombia, where inflation was moderate, monetary stimuluses             the second half after the deceleration in 2009. In general terms,
have not yet begun to be withdrawn.                                     and considering the financial systems with the greatest weight,
                                                                        Brazil grew the most and Chile more moderately.


LATIN AMERICA. INCOME STATEMENT
Million euros
                                                                            Gross                            Net operating                         Attributable
                                                                          income                                   income                  profit to the Group
                                                                2010       Var (%)                         2010     Var (%)                      2010         Var (%)

Brazil                                                         14,352         22.7                   9,037            22.5                   2,836              30.9
Mexico                                                          2,380           1.6                  1,458            (5.5)                    682              37.9
Chile                                                           2,048         14.4                   1,311              9.7                    683              21.3
Puerto Rico                                                       363           8.9                    186            12.5                      38              13.2
Colombia                                                          187         17.3                      75            11.3                      41              24.1
Argentina                                                         827         16.4                     454              8.9                    297              31.5
Uruguay                                                           169         17.4                      76            14.4                      67              30.3
Rest                                                              167        (15.3)                     46           (29.9)                     21             (80.7)
Subtotal                                                      20,493          17.9                  12,643            16.0                   4,665              26.9
Santander Private Banking                                         283          (2.5)                   162             (7.2)                   139             (10.7)
Total                                                         20,776          17.6                  12,805            15.7                   4,804              25.3


124                                                                                                                                  ANNUAL REPORT 2010
Because of their impact on business and on converting figures       Main focuses of management in 2010
into euros, the evolution of interest rates and exchange rates is
commented on:                                                       1 Management by type of customer, with greater emphasis
                                                                      on linkage via transactions, particularly with companies
– Average short-term interest rates, based on the region’s            and institutions.
  average weighted rate, fell between 2009 and 2010,
  although they increased in some countries as of the second        2 Focus on greater linkage of high and medium income
  half of 2010.                                                       customers and payrolls.

– The evolution of results in euros is affected by average          3 Greater emphasis on growth in savings and maintaining
  exchange rates. In global terms, Latin American currencies          high levels of liquidity.
  appreciated against the dollar, while the dollar, the reference
  currency in Latin America, strengthened 5% against the euro.      4 Consolidation of the policy of integral management of
  The Brazilian real strengthened against the euro on average         customer lending in all its phases (admission,
  from 2.76 to 2.33, the Mexican peso from 18.8 to 16.7 and           management, monitoring and recovery).
  the Chilean peso from 775 to 674.
                                                                    5 Selective growth in lending, with particular attention on
Strategy                                                              consumer credit and maximising the profitability of
The return to a more favourable economic environment in the           shareholders’ equity.
region energised the financial systems. In this context, the
Group reacted agilely, stepping up activity and, consequently,      6 Strengthen service strategies and multichannel distribution
the generation of gross income through management of                  in order to improve productivity and the quality of service.
spreads and development of fee-generating businesses. At the
same time, the Group’s basic values were preserved, such as         7 Strict control of costs and investments.
prudence in granting loans, strong recovery activity and
efficiency in costs.                                                8 Integration in Brazil.

In Brazil, Banco Real’s integration into the Group and the IPO of
Santander Brazil in the second half of 2009, in order to finance
its strategic plan, gave the strategy in this country some
distinguishing features.                                            Results
                                                                    Net interest income increased 6.2%, due to greater volumes,
At the end of 2010, the Group had 5,882 traditional branches        the change of mix toward lower risk products and defending
and points of banking attention and 27,550 ATMs.                    spreads in an environment of lower interest rates than in 2009.

The number of customers increased by 2.7 million to 40.3            Net fee income rose 3.1%, driven by that from insurance activity
million. The Group is placing more emphasis on linking              (+18%), mutual funds (+14%), cards (+10%), cash management
customers than capturing them.                                      (+8%) and foreign trade (+7%). On the other hand, income
                                                                    from the administration of accounts was lower. Also, there was
The Group continued to receive some of the main prizes              a negative impact from regulatory changes.
awarded to banks in the region.
                                                                    Revenue from banking activity increased 5.1%.
The main developments in business and results in 2010 are set
out below. All percentage changes exclude the exchange-rate         Gains on financial transactions dropped 27.0%, largely due to
impact.                                                             large capital gains in securities portfolios in 2009 that were not
                                                                    repeated in 2010.
Activity
The year-on-year pace of lending accelerated as of the
beginning of the year and growth ended at 15%. Cards                LOANS                                SAVINGS
(excluding Mexico) grew 28%, commercial bills (companies in all     % y-o-y variation w/o forex impact   % y-o-y variation w/o forex impact
their range and institutions) 19%, mortgages 14% and
consumer credit 13%. Loans to individuals increased 14%, those
                                                                                          +14.7


to SMEs 17% and to companies overall 25%.
                                                                                                                               +8.1


Savings (deposits excluding repos + mutual funds) increased 8%.
Demand deposits grew 16%, mutual funds 9% and time
deposits barely 1%.
                                                                                                                      -2.5


The market shares in the countries where we operate are 11.4%
                                                                                 -10.4


in loans, 10.0% in deposits and 9.8% for total banking business.


                                                                               2009      2010                       2009       2010


     ANNUAL REPORT 2010                                                                                                                       125
Operating expenses rose 4.5%. In Brazil, Mexico, Colombia,                               Net operating income after provisions increased 14.8%,
Uruguay and Puerto Rico, costs grew in line with or below their                          profit from continued operations 17.0% and attributable
respective inflation rates. In Argentina, they increased 26.9%                           profit 10.5%, the latter as a result of the sale of Banco de
due to the renegotiation of the collective bargaining agreement                          Venezuela and the negative net impact of higher minority
(+23%) in a context of significant growth in inflation. In Chile,                        interests.
the impact of the earthquake and the signing of a collective
agreement produced an increase of 7.8%.                                                  By segments and excluding both impacts, Retail Banking’s
                                                                                         attributable profit was 32.8% higher, Wholesale Banking’s
The efficiency ratio remained at around 38%.                                             declined 8.5%, notably influenced by a very good results in
                                                                                         2009, and Asset Management and Insurance’s rose 9.5%.
The better macroeconomic environment and outlook, together
with active risk management and a notable improvement in risk
premiums (from 4.8% in 2009 to 3.6% in 2010), is beginning to
be reflected in provisions (-19.5%). The NPL ratio declined 14
b.p., from 4.25% to 4.11%, while coverage was stable at 104%.


NET INTEREST INCOME /                    NET OPERATING INC. +                            NPL RATIO                        NPL COVERAGE
PROVISIONS                               AFTER LLPs          33.1%*                      %                                %
% o/ ATAs                                Million euros


                                                                                                     4.25
                     5.77


                                                                                                             4.11
                                                                    8,118


 5.72


                                                                                                                                      105
                        Net interest


                                                                                                                                             104
                         income


 3.34
                                                          6,101


                     3.94


 2.38
                            Provisions
                    1.83

2009                2010                                2009      2010                            2009      2010                    2009    2010
                                         (*) Excluding exchange rate impact : +14.8%


RECOGNITION AS THE BEST BANK IN THE PRIZES AWARDED DURING 2010
                                                                            The Banker                      Euromoney              Global Finance

Region                                                                          ⎷                                   ⎷
Mexico                                                                                                              ⎷
Chile                                                                                                               ⎷                       ⎷
Argentina                                                                       ⎷                                   ⎷
Uruguay                                                                         ⎷                                   ⎷                       ⎷
Puerto Rico                                                                     ⎷


126                                                                                                                                ANNUAL REPORT 2010
LATIN AMERICA. MAIN UNITS
Million euros
                                                                                            Brazil              Mexico                 Chile
                                                                              2010        Var (%)     2010      Var (%)     2010      Var (%)
INCOME STATEMENT
Net interest income                                                        10,490            27.7     1,638         7.7     1,514       27.3
Net fees                                                                     3,001           20.7       568        11.5       411       15.4
Gains (losses) on financial transactions                                       975            7.4       177      (46.6)         90     (57.3)
Other operating income (1)                                                    (114)            —          (3)    (83.3)         33       (3.3)
Gross income                                                               14,352            22.7     2,380         1.6     2,048       14.4
Operating expenses                                                          (5,316)          22.9      (922)       15.2      (737)      24.0
  General administrative expenses                                           (4,807)          20.9      (815)       14.2      (651)      23.6
      Personnel                                                             (2,592)          27.0      (430)       12.0      (409)       27.5
      Other general administrative expenses                                 (2,215)          14.4      (385)       16.7      (242)       17.6
  Depreciation and amortisation                                               (509)          45.9      (107)       23.6        (85)      27.1
Net operating income                                                         9,037           22.5     1,458       (5.5)     1,311         9.7
Net loan-loss provisions                                                    (3,709)           5.3      (469)     (38.9)      (323)     (22.7)
Other income                                                                  (746)          13.4        (29)      14.5         31     (11.2)
Profit before taxes                                                          4,582           43.4       960       28.1      1,019       25.4
Tax on profit                                                               (1,207)          33.0      (148)       57.1      (159)       40.4
Profit from continuing operations                                            3,375           47.5       812       23.9        860       22.9
Net profit from discontinued operations                                          —             —           —         —           —         —
Consolidated profit                                                          3,375           47.5       812       23.9        860       22.9
Minority interests                                                              539         345.4        130     (19.2)        177       29.9
Attributable profit to the Group                                             2,836           30.9       682       37.9        683       21.3

BALANCE SHEET
Customer loans (2)                                                          71,027           31.7     15,156       31.9     25,732      32.8
Trading portfolio (w/o loans)                                               11,529           42.9     13,004       43.6      3,532      40.8
Available-for-sale financial assets                                         21,257           12.6      3,716       (8.0)     2,825        0.3
Due from credit institutions (2)                                            10,863           (4.4)     4,478     (14.0)      2,349      (7.2)
Intangible assets and property and equipment                                 3,813           29.2        401         9.3       374        6.4
Other assets                                                                41,775           73.4      4,394       20.3      3,987      51.6
Total assets/liabilities & shareholders' equity                           160,264            34.4    41,148        21.7    38,799       28.4
Customer deposits (2)                                                       75,669           27.7     21,144       33.2     18,108      23.8
Marketable debt securities (2)                                               9,164           99.8        363      (13.2)     5,590      75.6
Subordinated debt (2)                                                        4,372           13.9         —     (100.0)      1,100      35.3
Insurance liabilities                                                        8,857           43.3        303       34.0        332      67.7
Due to credit institutions (2)                                              24,211           79.8      7,489      (14.3)     5,555     (11.2)
Other liabilities                                                           26,384           24.0      7,858       29.0      5,926      71.6
Shareholders' equity (3)                                                    11,608             8.9     3,991       66.1      2,187      29.6
Other customer funds under management                                      48,727            28.3    10,114        22.8      5,875      10.3
  Mutual funds                                                              43,942           27.3     10,005        22.8     5,806        9.8
  Pension funds                                                                 —               —         —           —         —          —
  Managed portfolios                                                         4,205           38.6         —           —         —          —
  Savings-insurance policies                                                   580           40.1        109        25.1        69       78.3
Customer funds under management                                           137,931            30.5    31,622        28.6    30,674       28.1

(1).- Including dividends, income from equity-accounted method and other operating income/expenses
(2).- Including all on-balance sheet balances for this item
(3).- Not including profit of the year


       ANNUAL REPORT 2010                                                                                                                 127
NET OPERATING INC.                          ATTRIBUTABLE PROFIT
BRAZIL                                                                Million euros
                                                                                                     +22.5%*      Million euros
                                                                                                                                                     +30.9%*
• Lending continued to grow and ended the year at double


                                                                                                 9,037
    digits.


                                                                                                                                             2,836
•   Revenues: new record of net interest income (which rose


                                                                                       7,376
    for the twelfth straight quarter) and fee income.
•   Expenses: rise slower than that of inflation.


                                                                                                                                   2,167
•   Loan-loss provisions: lower thanks to improved
    performance of NPLs.
•   Net operating income after provisions was 16.6% higher
    and profit before minority interests increased 24.4%.
                                                                                     2009      2010                              2009      2010
                                                                      (*) Excluding exchange rate impact: +3.3%   (*) Excluding exchange rate impact: +10.4%


Grupo Santander in Brazil generated attributable profit of EUR       Strategy
2,836 million, 30.9% more than in 2009 (+10.4% in local              The Santander Brazil plan centres on the integration process,
currency). On a like-for-like basis, excluding minority interests,   which since the onset has been focused on improving the
the increase was 24.4% in local currency.                            operational and commercial practices, extracting the best from
                                                                     each bank, pursuing greater efficiency and capturing synergies.
Santander Brazil is the third largest private sector bank in terms
of assets, with a market share of 9%. It operates in the main        The new products included the Conta Integrada for shops and
regions, with 3,702 branches and points of banking attention,        companies, Santander bonds to capture funds in the domestic
18,312 ATMs and 24.7 million customers, of whom 10 million           market and provide greater stability to balance sheets by
have current accounts.                                               extending maturities, and the launch of three cards, Santander
                                                                     Elite Premium, Santander Style Platinum and Santander
Economic environment                                                 Ferrari. Various alliances were also forged, such as GetNet to
The economy continued to grow on a sustained basis. Growth           strengthen business with companies and the creation of
for the whole year was around 7.5%. This was a substantial           Credlmob21 with Century21 to supply mortgages.
improvement over 2009 (-0.6%).
                                                                     Further progress was made in integrating the platform of credit
This improvement was due to the greater confidence of                cards, in insurance, in the training of the network’s teams and
businessmen and consumers, the significant reduction of the          unification of the brand was completed, with incorporation of
unemployment rate, already at minimum levels. It was 5.3% at         the Santander brand to branches, points of banking attention,
the end of 2010, down from an average of 9.4% for the                mini-branches, electronic service points, points of public
previous five years and to the improved conditions in the credit     attention and kiosks of the Real brand. Finally, the retail
market.                                                              networks were integrated.

Inflation was 5.6%, above the central bank’s target of 4.5%.         Lastly, Santander Brazil became a reference bank in corporate
The key Selic rate ended 2010 at 10.75% (+200 b.p.). The             governance in the country, as it is the only large private sector
Monetary Policy Committee in 2011 raised it to 11.75%                bank to attain level 2 in this sphere from BM&FBOVESPA. Since
because of inflationary pressures.                                   the end of 2009 the bank has been consolidating its
                                                                     management in order to create and improve its corporate
Total lending in Brazil grew at a faster pace. It increased 20.5%    governance mechanisms and guarantee the principles of
(+21.5% state banks). State banks’ share of lending was              transparency, equity, rendition of accounts and corporate social
41.9%, followed by private sector Brazilian banks (40.7%) and        responsibility.
foreign banks (17.4%).
                                                                     Activity
Loans to individuals (33% of the total) grew 19%, spurred by         As in the rest of the segments, Brazil’s figures have been
credits linked to the depositing of payroll cheques in accounts      restated in accordance with the criteria set out on page 108 of
and auto finance, that to companies (33% of the total) rose          this report. This means that the figures here do not coincide
15% and directed credit (including BNDES, rural and housing,         with those published locally.
34%) continued to grow at a faster pace than to the rest of
segments (+27%).                                                     Both lending and savings grew strongly. Lending began the year
                                                                     with negative growth and then gradually picked up and ended
Savings, including mutual and pension funds, increased 16%.          2010 up 16% and with significant rises in all segments. Growth
Mutual funds rose 17%, followed by demand deposits +                 was largely due to the 22% rise in loans to businesses and
savings (+16%) and time deposits (+14%).                             companies and the 18% rise to individuals (+27% in mortgages
                                                                     and cards). Lending to large companies increased 9%.

                                                                     On the funding side, demand deposits grew 16% and mutual


128                                                                                                                         ANNUAL REPORT 2010
LOANS                                             LOANS, BREAKDOWN                              SAVINGS                              SAVINGS, BREAKDOWN
% y-o-y variation w/o forex impact                % var. 2010 / 2009 w/o forex impact           % y-o-y variation w/o forex impact   % var. 2010 / 2009 w/o forex impact


                                                                                                                                              +15.5
                      +16.3


                                                                                                                       +6.5
                                                                              +22.3


                                                                                                                                                                            +12.4
                                                       +18.1


                                                                                         +8.9
                                                                  +8.8


                                                                                                             -0.3
             -5.0


                                                                                                                                                             -6.8
            2009      2010                         Individuals Consumer Businesses Corporate               2009      2010                  Demand           Time           Mutual
                                                                Finance +companies +GBM                                                                                    funds


funds 12%. Time deposits, on the other hand, under a policy                                     +2.0%), clearly below the inflation rate. This evolution was
based on the environment for rises in interest rates in 2010 and                                compatible with the opening of 109 points of customer
reduction in institutional balances of very low return, declined                                attention and the hiring of more employees, as the synergies
7%. Overall, savings increased 6%.                                                              obtained (BRL 1,862 million) were higher than forecast (BRL
                                                                                                1,600 million).
The bank’s market share in loans is 10.8% (11.5% for
unrestricted lending) and 8.8% in deposits.                                                     Provisions for loan losses were 11.2% lower than in 2009, due
                                                                                                to the improvement in the risk premium and in the NPL ratio.
Results                                                                                         The ratio dropped from 5.27% to 4.91%, while coverage
As regards results, (and always in local currency) the main                                     increased to 101%.
component of growth was net interest income (+7.7%),
which has risen every quarter for the last three years. The                                     Profit before minority interests was EUR 3,375 million, 24.4%
trend of fee income was also good. Excluding regulatory                                         more than in 2009 in local currency.
changes, it rose 6%, fuelled by revenue from credit cards,
insurance and mutual funds, which registered double-digit                                       Attributable profit, after higher minority interests (EUR 539
growth.                                                                                         million compared with EUR 121 million in 2009) because of the
                                                                                                listing in the second half of 2009, was EUR 2,836 million
This positive performance, however, was not fully reflected in                                  (+10.4% in local currency and +30.9% in euros).
gross income (+3.5%), due to the fall in gains on financial
transactions (-9.4%), affected by greater wholesale banking                                     Retail Banking’s profit was 34.2% higher and that of GBM was
revenues in 2009 and the recording in the third quarter of the                                  18.9% lower because of reduced gains on financial
capital gains obtained in the Visanet green shoe (EUR 95                                        transactions.
million), which were assigned to generic provisions.
                                                                                                The efficiency and recurrence ratios were 37.0% and 62.4%,
Operating expenses increased 3.7% (personnel and general,                                       respectively, and ROE was 23.1%.


NET INTEREST INCOME /                             NET OPERATING INC.                            NPL RATIO                            NPL COVERAGE
PROVISIONS                                        AFTER LLPs         +38.3%*                    %                                    %
% o/ ATAs                                         Million euros
                                                                                                              5.27


                                                                                                                      4.91


 7.65
                                                                             5,328


                                                                                                                                                                     101


                              7.53
                                                                                                                                                       99


                                 Net interest
                                  income
 4.37
                                                                   3,854


                              4.87


 3.28
                                     Provisions
                              2.66

2009                      2010                                  2009       2010                             2009     2010                             2009          2010
                                                  (*) Excluding exchange rate impact: +16.6%


        ANNUAL REPORT 2010                                                                                                                                                          129
NET OPERATING INC.                                 ATTRIBUTABLE PROFIT
MEXICO                                                                Million euros                             -5.5%*   Million euros                  +37.9%*
• Faster growth in lending, increasing at double-digits.


                                                                                      1,542


                                                                                                1,458


                                                                                                                                                  682
• Basically flat costs (growth below inflation).


                                                                                                                                         495
• Emphasis on integral management of risk, with lower
  provisions.

• Net operating income after loan-loss provisions rose
  13.5%, despite lower gains on financial transactions.
                                                                                    2009       2010                                    2009     2010
                                                                      (*) Excluding exchange rate impact: -15.9%         (*) Excluding exchange rate impact: +22.7%


Attributable profit was EUR 682 million, 37.9% higher than in         September, giving Santander 99.9% of the capital. Positive
2009 (+22.7% in local currency).                                      impact on results of EUR 64 million.

Santander is the third largest banking group in Mexico by             Activity
business volume, with a market share in loans of 13.5% and            Lending began the year with negative growth rates and ended
15.1% in savings. It has 1,100 branches and 9.1 million               up 15%, with a very good evolution in individuals, SMEs and
customers.                                                            companies. Mortgages and loans to individuals grew 17%
                                                                      (especially for new homes, +107 b.p. in market share) and
Economic environment                                                  consumer credit grew 9%. Lending via cards dropped 16%,
The economy expanded 5.5% in 2010. Domestic demand grew               partly for market reasons and partly due to applying very
6.1%, thanks to the recovery in private consumption and               rigorous criteria.
investment in fixed capital and in building up stocks, while
exports continued to grow in real terms at high rates.                Savings increased 14%, with demand and time deposits
                                                                      growing 20% and 16%, respectively, and mutual funds 7%.
Job creation is a very important factor in this evolution (close to
732,000 created).                                                     Results
                                                                      In results (local currency), gross income declined 9.6%, strongly
Inflation rose in the last months to 4.4% in December, although       impacted by gains on financial transactions which were half
it was still within the central bank’s range. After the inflation     those in 2009 when there were significant capital gains in the
spike brought on mainly by food and energy prices, the rate           securities portfolios.
eased in January 2011 to 3.8% and is expected to come down
to around 3.5%. In this context, the Bank of Mexico is expected       Net interest income was 4.2% lower, in line with growth more
to keep its key rate stable for most of 2011.                         tilted toward products and segments with lower spreads (sharp
                                                                      reduction in the last few years in volumes related to cards), but
Growth in banking business recovered in 2010. Lending rose 7%
(consumer and cards: +2%) and savings 15%.

Strategy
The strategy centred on accelerating business dynamics and
revenue generation, as well as continuing to deepen the already
established priorities: strengthen the franchise via greater
relations with customers and more transactions, and bolster
integral management of risk, particularly in recovering loans in
                                                                      LOANS                                              SAVINGS
an irregular situation.                                               % y-o-y variation w/o forex impact                 % y-o-y variation w/o forex impact
                                                                                                        +15.4


New products and services were offered in 2010 for particularly
attractive segments such as high-income customers. Of note
was the success in insurance. The bank’s mission is not only to
                                                                                                                                                    +13.9


extend “bankarisation” but also the idea of “protection”.

In accordance with this strategy, the Group significantly
increased the number of linked customers, while recovery of
                                                                                                                                         +1.8


bad loans continued to be a priority in all segments.
                                                                                       -11.2


The agreement with Bank of America to acquire its stake of
24.9% in Santander Mexico for $2,500 million materialised in                         2009       2010                                   2009       2010


130                                                                                                                                  ANNUAL REPORT 2010
NET INTEREST INCOME /                           NET OPERATING INC.
PROVISIONS                                      AFTER LLPs         +27.7%*                   CHILE
% o/ ATAs                                       Million euros
                                                                                             • Double-digit growth in loans, after negative rates in
 4.05                       4.04
                               Net interest
                                                                                               2009.
                                income
                                                                                             • Expenses rose because of the impact of the earthquake,


                                                                         989
 2.01                                                                                          the signing of a collective bargaining agreement and
                            2.88
                                                                                               faster business growth.


                                                                775
 2.04
                                                                                             • Significant decline in provisions, thanks to consolidation
                                   Provisions
                                                                                               of the risk management model.
                            1.16
                                                                                             • Net operating income after loan-loss provisions increased
2009                        2010                              2009     2010
                                                (*) Excluding exchange rate impact: +13.5%
                                                                                               10.4%.

                                                                                             NET OPERATING INC.                          ATTRIBUTABLE PROFIT
                                                                                             Million euros
                                                                                                                               +9.7%*    Million euros
                                                                                                                                                                         +21.3%*
also with a lower risk premium. The stability of the key interest
rate at 4.50% gave rise to a drop of 52 b.p. in the average
spread on deposits and on loans of 113 b.p.


                                                                                                                       1,311


                                                                                                                                                                   683
Fee income was 0.8% lower, still affected by the fall in card


                                                                                                              1,196
business. Excluding this, income from other products grew 10%


                                                                                                                                                         563
(+32% from insurance).

Operating expenses increased 2.5%, below inflation (4.4%).

Net loan-loss provisions declined 45.7%, from around EUR 225
million in the first half of 2009 to almost EUR 100 million in the                                         2009       2010                             2009      2010
second half of 2010. Net operating income after provisions                                   (*) Excluding exchange rate impact: -4.7%   (*) Excluding exchange rate impact: +5.4%
increased 13.5%.

Attributable profit was 22.7% higher in local currency at EUR
682 million. Retail Banking’s profit increased 29.5%, Global                                 Attributable profit was EUR 683 million in 2010, 21.3% higher
Wholesale Banking’s 11.0% and Asset Management and                                           than in 2009 (+5.4% in local currency).
Insurance’s 22.5%. Excluding the impact of the minority
interests acquired, profit from continued operations was                                     Santander is the largest financial group in Chile in terms of
10.2% higher.                                                                                assets and results. Its market shares are 20.9% in loans and
                                                                                             17.6% in savings. It has 504 branches and 3.1 million
The efficiency ratio was 38.7%, the recurrence ratio 69.7% and                               customers.
ROE 19.5% The NPL ratio was unchanged at 1.84% and
coverage an excellent 215%.                                                                  Economic environment
                                                                                             The economy, hit by the earthquake in the early part of the year,
                                                                                             recovered strongly. GDP growth was more than 5% in the first
                                                                                             nine months and domestic demand, also reflecting the
                                                                                             reconstruction programmes, rose by around 16%. Both private
                                                                                             consumption and investment in fixed capital and in stocks grew
                                                                                             strongly. Inflation rose during the year and ended at 3.0%.

NPL RATIO                                       NPL COVERAGE
                                                                                             The central bank took preventative action, lifting interest rates
%                                               %                                            (+275 b.p.).

                                                                                             Lending began to recover at the start of the year and rose 9%,
                                                                                             fuelled by mortgages and commercial credit. Savings increased
                                                               264


                                                                         215


                                                                                             9% (+21% in demand deposits).

                                                                                             Strategy
                     1.84
             1.84


                                                                                             Santander Chile concentrated on taking advantage of the
                                                                                             economic recovery. It managed spreads well in an environment
                                                                                             of interest rates at maximum levels. Issues such as strengthening
                                                                                             customer linkage through all channels, recovery management
                                                                                             and costs are still very much on the agenda.
            2009    2010                                     2009      2010


        ANNUAL REPORT 2010                                                                                                                                                           131
The number of insurance policies, a risk-free product and one             NET INTEREST INCOME /                           NET OPERATING INC.
generating fee income, amounted to more than 5.0 million and              PROVISIONS                                      AFTER LLPs                     +27.0%*
consumer loans totalled more than 1 million. Payrolls, a very             % o/ ATAs                                       Million euros
binding product, increased 9% and helped to enhance the                                               4.40
                                                                           4.25
quality of the customer base and future business prospects. The                                          Net interest
                                                                                                          income


                                                                                                                                                   988
number of cards reached 1.7 million. Of note was the renewal
of the card co-branding alliance with LAN, Chile’s main airline,           2.76
and various new alliances, which have made Santander the clear


                                                                                                                                          778
                                                                                                      3.46
leader in the country’s means of payment market. Meanwhile,
the rise in transactions and customer linkage sustained the                1.49
growth of these revenues in an adverse environment.                                                          Provisions
                                                                                                      0.94
In addition, management of the effects of the earthquake, from            2009                        2010                              2009     2010
social and business standpoints, was in the centre of the                                                                 (*) Excluding exchange rate impact: +10.4%
strategy.

Activity
Stronger economic growth and the positive impact of                       Net fee income rose 0.3%. Of note was the 29% rise from asset
reconstruction accelerated growth in lending (+14%), with all             management, 28% from securities and 16% from insurance,
products and segments performing well. Mortgages grew 12%,                which offset the falls in administration of accounts, foreign
consumer credit 17% and cards 32%, while in segments growth               trade and cash management. Gains on financial transactions
was more than 15% to individuals, SMEs and companies.                     dropped from EUR 210 million to EUR 90 million, as there were
                                                                          capital gains not repeated in 2010.
Savings rose 2%, with demand deposits up 17%, time deposits
down 2% and mutual funds down 6%.                                         Operating expenses increased 7.8%, higher than inflation, and
                                                                          impacted by the earthquake and the signing of the collective
The bank reached several milestones in fixed-income markets. In           bargaining agreement, while provisions declined 32.8%. The
April, Santander Chile was the first bank in the region to issue a        rate at which they fell accelerated during the year, thanks to risk
floating rate short-term note, a market reserved for high-grade           management.
issuers. In September, the bank placed the first ever international
bond in Chilean pesos by a private company. Lastly, in December           Attributable profit was 5.4% higher at EUR 683 million. Retail
the bank was the first Chilean issuer to make an issue in the             Banking’s profit (76% of the total in Chile) rose 14.9%, Asset
Swiss market. All these bonds attained the best risk rating of a          Management and Insurance’s 1.2% and Global Wholesale
Latin American company (Aa3/AA-).                                         Banking’s dropped 24.6%, due to lower gains on financial
                                                                          transactions.
Results
In results (and always in local currency), gross income slid              The efficiency ratio was 36.0%, the recurrence ratio was 63.0%
slightly (-0.5%), although with a differentiated performance by           and ROE 30.5%. The NPL ratio was 3.74% and coverage 89%.
lines. Net interest income grew 10.6%, backed by the recovery
in lending and higher inflation than in 2009. Interest rates,
although higher in the last part of the year, were lower than in
2009. This impacted on the spread (-78 b.p.).


LOANS                                SAVINGS                              NPL RATIO                                       NPL COVERAGE
% y-o-y variation w/o forex impact   % y-o-y variation w/o forex impact   %                                               %
                      +13.6


                                                                                               3.74
                                                                                       3.20
                                                           +2.0


                                                                                                                                                   89
                                                                                                                                          89
                                                  -3.0
             -6.3


           2009      2010                       2009      2010                        2009    2010                                      2009     2010


132                                                                                                                                  ANNUAL REPORT 2010
ARGENTINA                                                                          URUGUAY
Attributable profit amounted to EUR 297 million in 2010,                           Attributable profit amounted to EUR 67 million in 2010,
31.5% higher than in 2009 (+31.4% in local currency).                              30.3% higher than in 2009 (+10.3% in local currency).

Santander Río is one of the country’s leading banks, with                          Santander is the largest private sector bank in the country in
market shares of 9.8% in lending and 10.1% in savings. It has                      terms of profits, number of branches (43) and business (market
324 branches and 2.3 million customers.                                            share of 17.1% in lending and 16.7% in deposits and mutual
                                                                                   funds). It has 258,000 customers.
The economy grew by close to 9%, driven by buoyant
domestic demand. Inflation spurted in the first half to 11%                        The economy expanded 8.8% year-on-year in the first nine
from 7.7% at the end of 2009, but in the second half it was                        months, one of the fastest growing in the region. Growth was
stable. Interest rates remained at around 11%.                                     fuelled by domestic demand, which rose in line with GDP, and
                                                                                   exports (+11% in real terms).
Market indicators were very positive (lower yield on bonds,
4.3% depreciation of the peso against the dollar) after the                        Moody’s revised Uruguay’s sovereign rating from Ba3 to Ba1,
reopening of the debt exchange (adherence of 66%) and the                          an increase of two notches and only one away from
improved sovereign rating.                                                         investment grade. The rating agency said the reason for the
                                                                                   upward revision was the improvement in fiscal and debt
The pace of growth in savings and lending in the whole                             indicators, combined with an outlook of continuous
financial system was 27% and 35%, respectively. The quality of                     improvement.
the balance sheet continued to improve and high levels of
liquidity were maintained.                                                         Growth in the financial system’s lending and deposits was
                                                                                   18% and 16%, respectively.
The Group’s strategy focused on taking advantage of the
strengths of its commercial franchise, with greater importance                     The Group’s strategy focused on taking advantage of the
attached to customer linkage and transaction banking and                           synergies from the Santander/ABN merger, fostering retail
selective growth in lending, with particular attention paid to                     business and expanding and linking the customer base.
managing the whole risk cycle and control of costs.                                Another element was to boost attention to the high income
                                                                                   segment via the Van Gogh project.
Lending rose 38% in local currency and savings 34%. Of note
was the 42% growth in demand deposits. These increases                             Lending increased 23% in local currency, higher than the
were higher than the market’s and produced gains in the                            sector and deposits rose 14%.
market shares of these three items.
                                                                                   Gross income increased 2.7%, operating expenses remained
Gross income rose 16.4%, net interest income 15.2% and fee                         almost flat and provisions continued to be insignificant thanks
income 22.3%. Operating expenses were 26.9% higher,                                to the bank’s exceptional credit quality. The NPL ratio was only
impacted by the new collective bargaining agreement (+23%),                        0.22% and the level of coverage was very high, underscoring
and loan-loss provisions declined 59.0%. Attributable profit                       one of the bank’s strengths.
was EUR 297 million, as already mentioned.
                                                                                   Attributable profit was 10.3% higher at EUR 67 million
The efficiency ratio was 45.1%, the recurrence ratio 90.6%                         (+30.3% in euros).
and ROE 61.8%. The NPL ratio was 1.69% and coverage
149%. Both of these ratios were better than in 2009.                               The efficiency ratio is 55.1% and the recurrence ratio 33.6%.


ACTIVITY                              ATTRIBUTABLE PROFIT                          ACTIVITY                              ATTRIBUTABLE PROFIT
% var. 2010 / 2009 w/o forex impact   Million euros
                                                                       +31.5%*     % var. 2010 / 2009 w/o forex impact   Million euros
                                                                                                                                                         +30.3%*
             +37.8


                                                                 297


                                                                                                +22.8
                       +33.6


                                                                                                                                                    67
                                                       226


                                                                                                          +13.6


                                                                                                                                          51


           Loans     Savings                         2009      2010                           Loans     Savings                         2009      2010
                                      (*) Excluding exchange rate impact: +31.4%                                         (*) Excluding exchange rate impact: +10.3%


      ANNUAL REPORT 2010                                                                                                                                              133
COLOMBIA                                                                          PUERTO RICO
Attributable profit was EUR 41 million in 2010, 24.1% higher                      Attributable profit was 7.6% higher in dollars at EUR 38 million,
than in 2009 (+4.2% in local currency).                                           due to the 4.0% rise in basic revenues and almost flat costs and
                                                                                  provisions. The efficiency ratio was 48.7%, the recurrence ratio
The Group has 76 branches, 297,000 customers and a 2.9%                           42.6%, the NPL ratio 10.6% and coverage 58%.
share in lending and 2.8% in savings.
                                                                                  Santander Puerto Rico has 121 branches, 514,000 customers
The economy grew 4.1% in the first nine months year-on-year                       and market shares of 9.3% in loans, 10.2% in deposits and
compared to zero growth in 2009. Inflation, after remaining at                    22.6% in mutual funds.
close to 2.5% for almost all the year, rose in December to end
at 3.2%. The central bank held its key rate at 3% after cutting                   The economy remained in recession, affecting both the growth
it by 50 b.p. in April 2010.                                                      of the financial system and its profitability.

The Group concentrated on credit risk management and                              The bank continued to position itself as one of the three main
selective growth in lending, preserving adequate levels of                        financial institutions in lending, deposits and mutual funds. It
liquidity. It also strengthened transaction businesses and paid                   made further efforts to bolster recovery of loans in an irregular
close attention to controlling costs.                                             situation and grow selectively in lending to individuals and
                                                                                  companies.
Lending rose 12%, with loans to individuals increasing 26%
and those to companies 18%. Savings increased 15%, with                           In 2010, the Group fully owned the subsidiary, following its
demand deposits up 29%, mutual funds 11% and time                                 delisting
deposits only rose 4%.

Basic revenues increased 7.1%, fuelled by net interest income
(+6.2%) and by fee income (+9.7%). Gains on financial                             ACTIVITY                              ATTRIBUTABLE PROFIT
transactions were halved because of losses in 2010 in the                         % var. 2010 / 2009 w/o forex impact   Million euros
                                                                                                                                                        +13.2%*
derivatives portfolio.

Operating expenses were 2.2% higher, below inflation, and
                                                                                                         +0.2


provisions were 27.9% lower thanks to good credit quality.


                                                                                                                                                   38
The NPL ratio was 1.56% and coverage 200%, both figures


                                                                                                                                         33
better than in 2009.

Profit before tax increased 14.8% and attributable profit only
                                                                                               -3.0


rose 4.2%, because of the higher tax charge.
                                                                                             Loans     Savings                         2009      2010
                                                                                                                        (*) Excluding exchange rate impact: +7.6%
The efficiency ratio is 59.9% and the recurrence ratio 48.4%.

                                                                                  PERU
                                                                                  Attributable profit was EUR 7 million (EUR 4 million in 2009
ACTIVITY                              ATTRIBUTABLE PROFIT
% var. 2010 / 2009 w/o forex impact   Million euros
                                                                      +24.1%*     and only EUR 1 million in 2008).

                                                                                  The Peruvian economy surged 8.8%, making it one of the
                                                                                  most dynamic in the region. The domestic drivers were the
                       +15.2


                                                                                  improvement in household and business confidence, growth in
                                                                                  lending and job creation. In this context, activity was focused
             +11.7


                                                                 41


                                                                                  on companies and tending to the Group’s global customers.
                                                       33


                                                                                  ACTIVITY                              ATTRIBUTABLE PROFIT
                                                     2009      2010               % var. 2010 / 2009 w/o forex impact   Million euros
                                                                                                                                                        +72.7%*
           Loans     Savings          (*) Excluding exchange rate impact: +4.2%
                                                                                                         +69.1
                                                                                               +52.2


                                                                                                                                                   7
                                                                                                                                         4


                                                                                                                                       2009      2010
                                                                                             Loans     Savings          (*) Excluding exchange rate impact: +54.0%


134                                                                                                                                 ANNUAL REPORT 2010
SOVEREIGN
Million euros
                                                                                                                           Variation
                                                                                                      2010       2009*      Amount         %
INCOME STATEMENT
Net interest income                                                                                   1,736      1,160         575      49.6
Net fees                                                                                                408         380          27       7.2
Gains (losses) on financial transactions                                                                  29         13          16    124.0
Other operating income (1)                                                                               (66)       (91)         24    (26.9)
Gross income                                                                                          2,106      1,463         643      44.0
Operating expenses                                                                                     (937)      (881)        (56)       6.4
  General administrative expenses                                                                      (832)      (766)        (66)       8.6
      Personnel                                                                                        (468)      (457)        (11)       2.3
      Other general administrative expenses                                                            (364)      (309)        (55)     17.9
  Depreciation and amortisation                                                                        (105)      (114)          10      (8.5)
Net operating income                                                                                  1,169        582         587     100.8
Net loan-loss provisions                                                                               (510)      (571)          61    (10.7)
Other income                                                                                             (92)       (58)        (34)     58.5
Profit before taxes                                                                                     567        (47)        614         —
Tax on profit                                                                                          (143)          22      (165)        —
Profit from continuing operations                                                                       424        (25)        449         —
Net profit from discontinued operations                                                                    —          —           —        —
Consolidated profit                                                                                     424        (25)        449         —
Minority interests                                                                                         —          —           —        —
Attributable profit to the Group                                                                        424        (25)        449         —

BALANCE SHEET
Customer loans (2)                                                                                    36,724     34,605      2,119         6.1
Trading portfolio (w/o loans)                                                                            211        163           48     29.3
Available-for-sale financial assets                                                                   10,203      9,568         635        6.6
Due from credit institutions (2)                                                                         722        496         226      45.7
Intangible assets and property and equipment                                                             507        391         116      29.7
Other assets                                                                                           3,430      3,568        (138)      (3.9)
Total assets/liabilities & shareholders' equity                                                      51,797     48,791       3,006         6.2
Customer deposits (2)                                                                                 32,007     30,888      1,119         3.6
Marketable debt securities (2)                                                                         1,945     11,236     (9,292)     (82.7)
Subordinated debt (2)                                                                                  2,781      2,129         652      30.6
Insurance liabilities                                                                                     —          —            —         —
Due to credit institutions (2)                                                                         9,567        736      8,830          —
Other liabilities                                                                                      2,297      1,689          608     36.0
Shareholders' equity (3)                                                                               3,200      2,113      1,088       51.5
Other customer funds under management                                                                     30       327        (297)    (90.9)
  Mutual funds                                                                                            —          —            —         —
  Pension funds                                                                                           —          —            —         —
  Managed portfolios                                                                                      30        327        (297)    (90.9)
  Savings-insurance policies                                                                              —          —            —         —
Customer funds under management                                                                      36,763     44,581     (7,818)     (17.5)

(*).- Data February-December
(1).- Including dividends, income from equity-accounted method and other operating income/expenses
(2).- Including all on-balance sheet balances for this item
(3).- Not including profit of the year


       ANNUAL REPORT 2010                                                                                                                  135
ATTRIBUTABLE PROFIT. QUARTERLY
SOVEREIGN                                                             Million US$


                                                                                                                                                            178
• The franchise’s profitability was consolidated.


                                                                                                                                                 157
  Attributable profit of $561 million, above target.


                                                                                                                                      132
• Higher revenues, lower costs and reduced provisions.


                                                                                                                           95
• Improved trend in loans and core deposits, with focus


                                                                                                                     4
  on profitability.


                                                                                                                -4
                                                                                                    -10
• Enhanced credit quality: reduction in non-performing


                                                                                        -25
  loans and higher coverage.
                                                                                     Q1’09 Q2’09 Q3’09 Q4’09 Q1’10 Q2’10 Q3’10 Q4’10


Attributable profit was EUR 424 million ($561 million),               In Asset Management and Insurance, 2010 saw the
compared to a loss of EUR 25 million in 2009 ($35 million).           consolidation of the Save & Invest product, launched in 2009.
                                                                      Of note in insurance were the campaigns to launch families of
Despite a difficult environment with reduced demand for loans         products in line with the Group’s bancassurance model.
and low interest rates, Sovereign consolidated the profitability of
its franchise in 2010 and secured the breakeven point reached in      Also noteworthy was the STARR project (Steps to Achieve
the fourth quarter of 2009, thanks to management of spreads,          Remarkable Results) started in the fourth quarter of 2010 in
the better mix of loans and deposits, control of costs and            order to apply the sales culture in branches, and whose main
enhanced credit quality.                                              focus is to improve the productivity of the network.

Economic environment                                                  Sovereign’s integration into the Santander model offers a solid
Sovereign conducted its business in a recovering economy, but         base for tackling 2011, when we will put the emphasis on
one still marked by a jobless rate close to recent highs and low      further improvement in the franchise and in commercial
interest rates.                                                       efficiency with new products and better segmentation. The
                                                                      Partenón operational platform will help to achieve this.
After several quarters of declines in lending, the first signs of
stabilisation began to appear in the third quarter of 2010 (-0.1%     Activity
quarter-on-quarter), with slight growth to companies (+0.3% q-        2010 was characterised by the focus on profitability and on
o-q) and stabilisation in consumer credits (-0.5% q-o-q). In          improving the mix of lending and funding products.
deposits, continued flow into demand deposits (+2.7% q-o-q)
from time deposits (-0.5% q-o-q).                                     In an environment of low demand for loans, Sovereign centred
                                                                      on improving the spreads on new loans and renewals, reflecting
Strategy                                                              the higher cost of liquidity and risk.
Sovereign, with 721 branches, 2,337 ATMs and more than 1.7
million customers, is developing a business model focused on
retail customers and companies. It operates in the northeast of
the US, one of the country’s most prosperous areas, where it
has significant market shares and manages close to $100,000
million of loans and deposits.
                                                                      ACTIVITY. TOTAL LOANS(1)                           LOANS BREAKDOWN(1)
                                                                      % (US$)                                            % variation 2010 / 2009 (US$)
There were significant improvements in activity, backed by
                                                                                                                                +17


campaigns. Of note in retail banking were the Get More with 4
and Better Banking campaigns, the first focused on retail
                                                                                                                                            +0


customers and the second on SMEs. Both campaigns were the
                                                                                                     -1


first to concentrate on cross-selling.
                                                                                                                                                       -6


Of note in corporate banking was the Race to Finish campaign
to attract new customers. Backed by the advantages of the
Group’s global customer relation model, the foundations were
                                                                                                                                                                   -32
                                                                                         -12


laid in 2010 for Global Wholesale Banking, which already is
doing better than expected.                                                                                              Multifamily Commercial Other             Run-off
                                                                                      2009         2010                  + residential & industrial loans          loans

                                                                      (1) W/o securitisations, local criteria


136                                                                                                                                    ANNUAL REPORT 2010
In lending (local criteria), the decision to exit higher risk          DEPOSITS(1)                          NET INTEREST INCOME / ATAs
segments was offset by the rise in activity in the most attractive     % variation 2010 / 2009 (US$)        % (US$)
mortgage segments such as residential and multifamily (+17%).
The volume of loans, which declined 12% in 2009, picked up in


                                                                                             +3
2010 and ended almost flat, despite a 32% cut in run-off credits
                                                                                                                                     3.28
(60% since Sovereign joined the Group). Excluding the portfolio
in run-off, other loans increased 3%.

In deposits, the emphasis was on improving the mix of products.                                                 2.39
Core deposits rose 3% (mainly retail demand deposits), partly


                                                                                                     -18
due to the success of the retail campaigns, while other balances
(time, wholesale and government) of a higher cost declined
18%.                                                                                   Core     Other           2009                 2010
                                                                                      deposits deposits
Results                                                                (1) Local criteria
As in other businesses, Sovereign’s financial statements have
been restated in accordance with the criteria set out on page
108 of this report, and so the figures shown here do not
coincide with those published by Sovereign with local criteria.

Gross income rose 26.5% to $2,786 million on a like-for-like           Attributable profit was $561 million, consolidating the upward
basis (only February to December was recorded by global                path begun in 2009 and reflected in an improvement in all
integration). This was largely due to net interest income              quarters of 2009 and 2010.
(+31.5%), whose increase was due to the management of
prices in loans, the lower cost of deposits and ALCO                   In short, 2010 showed Sovereign to have a solid income
management, which offset the lower volumes of loans.                   statement, backed by the generation of recurring revenues,
                                                                       control of costs and improved levels of provisions resulting from
Operating expenses reflected the positive impact of synergies          proactive credit risk management. All of this, steming from
and the optimisation of structures and are on a clear downward         improved balance sheet structure, and together with the
trend: 8.1% lower than 2009 on a like-for-like basis. This,            recovery of basic lending provides an optimum starting point for
coupled with revenues, produced a notable gain in efficiency           the coming years.
from 60.2% in 2009 to 44.5% and a sharp rise in net operating
income (+81.4%) to $1,547 million.

Net loan-loss provisions were 21.1% lower, thanks to
containment of bad loans and the recovery capacity during the
whole credit cycle. This is reflected in a better than expected
evolution of credit quality: the NPL ratio declined from 5.35% to
4.61% and coverage rose from 62% to 75%.


NET OPERATING INC.                         ATTRIBUTABLE PROFIT         NPL RATIO                            NPL COVERAGE
Million US$
                                 +91.0%*   Million US$                 %                                    %
                         1,547


                                                                                             5.35


                                                                                                     4.61


                                                                                                                               75
                                                                                                                        62
                 810


                                                                 561
                                                          -35


               2009     2010                             2009   2010                        2009    2010               2009   2010
(*) In euros: +100.8%


        ANNUAL REPORT 2010                                                                                                               137
CORPORATE ACTIVITIES
Million euros
                                                                                          Variation
                                                                 2010           2009       Amount               %
INCOME STATEMENT
Net interest income                                            (2,678)       (2,210)         (468)           21.2
Net fees                                                            (40)            (6)         (35)        622.2
Gains (losses) on financial transactions                          (142)          631          (773)             —
Dividends                                                            64          121            (58)        (47.5)
Income from equity-accounted method                                   (2)         (15)           14         (89.1)
Other operating income/expenses (net)                              137             52            85         162.7
Gross income                                                   (2,660)       (1,427)       (1,234)           86.5
Operating expenses                                                (822)         (809)           (12)           1.5
  General administrative expenses                                 (689)         (695)              7          (0.9)
      Personnel                                                   (268)         (307)             39        (12.7)
      Other general administrative expenses                       (420)         (388)           (32)           8.4
  Depreciation and amortisation                                   (133)         (114)           (19)          16.4
Net operating income                                           (3,482)       (2,236)       (1,246)           55.7
Net loan-loss provisions                                          (111)             50        (161)             —
Other income                                                      (428)         (848)           420         (49.6)
Profit before taxes (w/o capital gains)                        (4,021)       (3,034)         (987)           32.5
Tax on profit                                                    1,091         1,421          (330)         (23.2)
Profit from continuing operations (w/o capital gains)          (2,930)       (1,614)       (1,316)           81.6
Net profit from discontinued operations                             (13)          (15)             1          (9.3)
Consolidated profit (w/o capital gains)                        (2,943)       (1,628)       (1,315)           80.8
Minority interests                                                  (25)            (5)         (20)        383.6
Attributable profit to the Group (w/o capital gains)           (2,918)       (1,623)       (1,295)           79.8
Net extraordinary capital gains and allowances                        —             —             —             —
Attributable profit to the Group                               (2,918)       (1,623)       (1,295)           79.8

BALANCE SHEET
Trading portfolio (w/o loans)                                    5,123         4,331             792          18.3
Available-for-sale financial assets                             21,288        26,870         (5,581)        (20.8)
Investments                                                         38            32               6          19.9
Goodwill                                                        24,622        22,865          1,757            7.7
Liquidity lent to the Group                                     27,766        49,677       (21,911)         (44.1)
Capital assigned to Group areas                                 63,187        52,448        10,739            20.5
Other assets                                                    64,806        64,511             296           0.5
Total assets/liabilities & shareholders' equity               206,830       220,733       (13,903)           (6.3)
Customer deposits (1)                                           14,258         3,216        11,042          343.4
Marketable debt securities (1)                                  62,812        83,094       (20,282)         (24.4)
Subordinated debt (1)                                           12,128        19,131         (7,004)        (36.6)
Other liabilities                                               47,210        50,106         (2,896)          (5.8)
Group capital and reserves (2)                                  70,423        65,186           5,237           8.0
Other customer funds under management                               —             —               —             —
  Mutual funds                                                      —             —               —             —
  Pension funds                                                     —             —               —             —
  Managed portfolios                                                —             —               —             —
  Savings-insurance policies                                        —             —               —             —
Customer funds under management                                89,198       105,442       (16,244)         (15.4)

(1).- Including all on-balance sheet balances for this item
(2).- Not including profit of the year


138                                                                                        ANNUAL REPORT 2010
CORPORATE ACTIVITIES                                                  Management of the exposure to exchange-rate
                                                                      movements, both from investments in the shareholders' equity
                                                                      of units in currencies other than the euro as well as that
• This area’s losses were EUR 1,295 million more than in              regarding the results generated for the Group by each of the
  2009 because of:                                                    units, also in various currencies, is conducted too on a
• Gains on financial transactions were EUR 773 million                centralised basis.
  lower, basically losses in hedging positions against the
  profits of 2009.                                                    This management (dynamic) is carried out by exchange-rate
                                                                      derivative instruments, optimising at each moment the
• Net interest income was down EUR 468 million because                financial cost of hedging.
  of the higher cost of financing.
                                                                      In this sense, hedging of net investments in the
• The net of the rest of the income statement had an                  shareholders' equity of businesses abroad aims to
  almost neutral impact.                                              neutralise the impact on them of converting to euros the
                                                                      balances of the main consolidated entities whose functional
The area made a loss of EUR 2,918 million in 2010 compared            currency is not the euro.
to a loss of EUR 1,632 million in 2009. This was mainly due to
lower net interest income and the losses on financial                 The Group considers it necessary to immunise the impact
transactions, as later explained.                                     which, in situations of high volatility in the markets, sharp
                                                                      movements in exchange rates would have on these exposures
Corporate Activities covers, on the one hand, a series of             of a permanent nature. The investments which are currently
centralised activities to manage the structural risks of the          covered are those in Brazil, the UK, Mexico and Chile, and the
Group and of the parent bank. It coordinates and/or executes          instruments used are spot contracts, FX forwards or tunnel
the necessary activities for managing interest rates, exposure        options.
to exchange-rate movements and measures to obtain the
required levels of liquidity in the Group. On the other, it acts as   The objective of the hedging is set as part of the shareholders'
the Group’s holding, managing global capital as well as that of       equity of the unit equivalent to a percentage of risk-weighted
each of the units.                                                    assets, which can be changed,

As regards interest rate management, this activity is                 Meanwhile, exposures of a temporary nature (i.e. those
conducted on a coordinated basis by all the units, but this           regarding the results which the Group’s units will
business only registers the part relative to the balance sheet of     contribute over the next 12 months), when they are in
the parent bank, via the ALCO portfolios (at the volume levels        currencies other than the euro, are also covered on
and duration considered optimum at each moment).                      centralised basis. These results, generated in the local
                                                                      currencies of the units, are hedged with exchange-rate
These portfolios, which normally take the form of sovereign           derivatives. The objective is to establish the euros resulting
bonds of European countries, aim to mitigate the impact of            from the exchange rate at the beginning of the year. These
interest rate movements on the balance sheet of retail                policies immunise both the investment in the shareholders'
banking, structurally sensitive by maturities to these                equity as well as the contribution to results of the various
movements and managing to maintain recurrent results                  units.
recorded as net interest income.
                                                                      The impact of the hedging is in gains/losses on financial
In order to achieve these goals, and in so far as market interest     transactions, and the hedging of results compensates, in the
rate changes are envisaged, the Group’s financial management          opposite way, the greater or lesser value in euros from the
can decide to immunise the net interest income of these               contribution of businesses.
portfolios to possible adverse movements in results by hedging
interest rates.


     ANNUAL REPORT 2010                                                                                                             139
Management of structural liquidity aims to finance the              Lastly, and more marginally, the equity stakes that the Group
Group’s recurrent activity in optimum conditions of maturity        takes within its policy of optimising investments is reflected in
and cost. The decisions whether to go to the wholesale              corporate activities. Since 2009 following Cepsa’s disposal, this
markets to capture funds and cover stable and permanent             item was significantly reduced.
liquidity needs, the type of instrument used, the structure by
maturity dates, as well as management of the associated risks       The area made a loss of EUR 2,918 million in 2010 compared
of interest rates and exchange rates of the various financing       to a loss of EUR 1,632 million in 2009. This was mainly due to
sources, are also conducted on a centralised basis.                 two factors.

The overriding objective of this activity is to maintain an         First, the deterioration of net interest income from the higher
appropriate liquidity profile by diversifying the sources of        financial costs resulting from the increase in the cost of credit.
financing and controlling short-term financing (diversity in        Second, the losses from financial transactions, basically in
maturities, currencies and markets) and medium-and long-            hedging positions of exchange rates (due to the appreciation
term.                                                               of the main currencies, whose positive impact is reflected in
                                                                    the operating areas), compared to revenue in 2009 from the
Logically, the objectives that the Group wants to cover may or      net results of hedging interest rates in financings.
may not coincide with the financing provided to the units and
which is based more on their individual needs. The mismatch         The main developments were:
in maturities, currencies or instruments is a corporate decision
and is reflected in this unit in a centralised way.                 • Net interest income was EUR 2,678 million negative
                                                                      compared to EUR 2,210 million also negative in 2009. The
The financial cost of the various financing sources recorded in       increase was largely due to the higher cost of credit of
the books of the parent bank (although part of them reflects          issues.
the Group’s needs as such) are registered in corporate
activities and can be issues of commercial paper, senior debt,        As previously explained, corporate activities mainly provides
covered bonds, subordinated debt, preference shares and               liquidity to the businesses of the parent bank in Spain at the
securitisation of assets.                                             euribor or swap rate. The higher cost of credit, largely due
                                                                      to liquidity tensions in the market, was not transmitted with
The financial management area usually covers in new issues            the same intensity and speed to the cost for the various
the interest rate and exchange rate risks from the start of the       businesses.
operation. It uses financial derivatives for this. The net impact
of this hedging is recorded in the gains/loss on financial            This increased cost was also reflected in the financing of the
transactions in corporate activities.                                 goodwill of the Group’s investments, which by definition is
                                                                      negative, but also raised the cost of their financing
This area also analyses the strategies for structural                 proportionately.
management of credit risk where the aim is to reduce
concentrations by sectors, which naturally occur as a result of       The net interest income of the ALCO portfolios registered
commercial activity. Derivative operations here achieve an            here shows no substantial changes.
effect similar to that of the sale of assets and their
compensation by the acquisition of other assets enables us to       • Dividends from equity stakes (reduced in the last year)
diversify the credit portfolio as a whole.                            dropped from EUR 121 million to EUR 64 million.

Lastly, and separately from the financial management activities     • Gains on financial transaction, which includes those from
described here, corporate activities acts as the Group’s              centralised management of interest rate and currency risk of
holding. It manages all capital and reserves and allocations of       the parent bank as well as from equities, were EUR 142
capital to each of the units as well as providing liquidity that      million negative compared to EUR 631 million in 2009. The
some of the business units might need (mainly the Santander           difference was due to hedging.
Branch Network and corporate in Spain). The price at which
these operations are carried out is the market rate (euribor or       In 2009, the impact from hedging the results of units was
swap without liquidity premium for their duration) for each of        low, and, moreover, there were positive returns on the
the maturities of repricing operations.                               business of equity stakes and hedging of interest rates.


140                                                                                                            ANNUAL REPORT 2010
In 2010, the situation reverted, with higher losses from the
  hedging of the results of subsidiaries (which, however, were
  compensated in the business units with higher results in
  euros) and allowances for financial investments in the
  portfolio of equity stakes.

• Operating costs were almost flat (+1.5%). The growth in
  general costs from the increase in rents was offset by the
  reduction in personnel costs from variable remuneration.

• Net loan-loss provisions include an allowance of EUR 111
  million as against a release of EUR 50 million in 2009. In
  2009, there were releases from country risk but not in 2010.
  Furthermore, there was a generic provision in 2010 to
  strengthen the balance sheet.

  Other small movements were recorded in this item from
  normal allocations and releases from portfolios that
  configure the ALCO strategies, and from others that
  constitute positions of centralised management.

• “Other income”, which includes various provisions and
  writedowns, was EUR 428 million negative compared to EUR
  848 million negative in 2009.

  This item includes allowances derived from the management
  and sale of foreclosed properties. These were higher in 2009
  because of a larger inflow than in 2010. Other types of
  writedowns are included such as derivatives of goodwill and
  losses in the value of equity stakes. Of note in 2009 was the
  EUR 196 million allowance for Metrovacesa.

• Lastly, the tax line reflects a lower rate arising from the
  recovery of losses as a result of the different impact that
  certain one-off items had in both years.


     ANNUAL REPORT 2010                                           141
2. SECONDARY SEGMENTS OR BY BUSINESS
                                                                                        NET OPERATING INC.                                  ATTRIBUTABLE PROFIT
RETAIL BANKING                                                                          Million euros
                                                                                                                              +9.7%         Million euros
                                                                                                                                                                                  +7.0%
• Small growth in business and management of spreads


                                                                                                                     22,569
  increased net interest income.


                                                                                                        20,576


                                                                                                                                                                          7,940
• Rigorous discipline in expenses, which remained flat on a


                                                                                                                                                               7,417
  like-for-like basis and without the exchange rate impact.
• Risk management reflected in lower provisions in the
  Americas and the UK. One-off increase in Europe
  because of the imapct of the Bank of Spain’s Circular
  (EUR 437 million, net of taxes).                                                                   2009          2010                                     2009 2010(1)
                                                                                                                                            (1) Before the impact from the application of Bank
                                                                                                                                               of Spain’s Circular 3/2010: 8,377 million; +13.0%


Attributable profit was 7.0% higher at EUR 7,940 million. Retail                        Operating expenses rose 10.7%, but remained flat without
Banking generated 85% of the operating areas’ total gross                               perimeter and forex impact. As a result, the efficiency ratio
income and 72% of attributable profit.                                                  remained at around 40% and net operating income was 9.7%
                                                                                        higher at EUR 22,569 million.
Gross income increased 10.1% to EUR 38,121 million, due to
the 12.4% rise in net interest income thanks to management of                           Net loan-loss provisions increased 5.9%. Excluding the perimeter
spreads against a background of weak business growth. Net fee                           and forex impact, provisions were 3.4% lower. These figures
income grew 7.0%.                                                                       reflect the impact of the extraordinary provision in Spain made
                                                                                        in the third quarter of 2010 because of the Bank of Spain’s new
All these variations were positively impacted by the perimeter                          regulations. Excluding this one-off and the perimeter and forex
and by exchange rates. Excluding them, gross income was in                              effects, provisions were 10.1% lower, reflecting the quality of
line with that in 2009.                                                                 integral management of risk in all the Group’s units.


INCOME STATEMENT AND BUSINESS VOLUMES SECONDARY SEGMENTS
Million euros
                                                                       Operating                            Retail                       Global                 Asset Management
                                                                   business areas                         Banking             Wholesale Banking                      and Insurance
                                                                  2010      Var (%)           2010               Var (%)         2010         Var (%)                   2010        Var (%)
INCOME STATEMENT
Net interest income                                             31,902         11.9         28,994                 12.4          2,676              6.7                  232            15.6
Net fees                                                          9,774          7.6          8,058                 7.0          1,292             14.6                  425            (1.5)
Gains (losses) on financial transactions                          2,747         (1.6)         1,333                (3.0)         1,364             (1.4)                   49           45.0
Other operating income (1)                                          286       (32.2)           (264)              221.0            175              5.7                  375            10.9
Gross income                                                    44,710           9.6        38,121                 10.1          5,508              6.2                1,081              7.7
Operating expenses                                             (17,374)        11.3        (15,552)                10.7         (1,480)            17.7                 (343)           10.3
  General administrative expenses                              (15,567)        10.2        (13,929)                 9.8         (1,343)            15.0                 (295)             5.9
      Personnel                                                  (9,061)       11.3          (8,002)               10.6           (898)            18.6                 (161)             7.9
      Other general administrative expenses                      (6,506)         8.7         (5,927)                8.8           (445)             8.3                 (134)             3.7
  Depreciation and amortisation                                  (1,807)       21.9          (1,623)               19.2           (137)            54.4                   (47)          48.3
Net operating income                                            27,335           8.5        22,569                  9.7          4,027              2.6                  739              6.5
Net loan-loss provisions                                       (10,147)           6.4      (10,142)                  5.9              (5)            —                      (0)            —
Other income                                                     (1,116)        29.0         (1,083)               33.3             (16)             —                    (17)         (68.0)
Profit before taxes                                             16,073           8.6        11,345                 11.4          4,007              1.1                  721            11.4
Tax on profit                                                    (4,014)          6.8        (2,743)               11.7         (1,071)            (1.2)                (200)            (8.6)
Profit from continuing operations                               12,059           9.2          8,602                11.2          2,936              2.0                  521            21.6
Net profit from discontinued operations                              (14)          —             (14)                 —               —              —                      —              —
Consolidated profit                                             12,045           8.6          8,588                10.4          2,936              2.0                  521            21.6
Minority interests                                                   946        81.6             648               79.3             238            81.1                     59         114.1
Attributable profit to the Group                                11,099           5.0          7,940                 7.0          2,698            (1.8)                  462            15.2

BUSINESS VOLUMES
Total assets                                                1,177,052           7.2        862,055                  6.0        281,937            10.9                 33,060           11.1
Customer loans                                                721,509           5.8        651,871                  5.4         69,179             9.4                    459          (22.2)
Customer deposits                                             602,118          19.5        514,330                 14.1         83,689            60.0                  4,100          710.3
(1).- Including dividends, income from equity-accounted method and other operating income/expenses


142                                                                                                                                                        ANNUAL REPORT 2010
RETAIL BANKING. INCOME STATEMENT
Million euros
                                                                          Gross                Net operating                     Attributable
                                                                        income                       income              profit to the Group
                                                             2010       Var (%)             2010       Var (%)            2010        Var (%)

Continental Europe                                          13,520         (2.4)           8,194         (5.4)            2,774        (27.8)
o/w: Spain                                                    7,855       (10.2)           4,403        (16.4)            1,553         (43.4)
     Portugal                                                   985         (8.7)            485        (15.6)              340         (19.3)
United Kingdom                                                5,159          6.8           3,058         10.2             1,557          16.0
Latin America                                               17,351         19.9           10,163         18.8             3,196          41.6
o/w: Brazil                                                  12,190         25.7           7,289          27.1            1,798          59.1
     Mexico                                                   1,841         (2.6)          1,038        (12.7)              430           45.6
     Chile                                                    1,721         17.0           1,067          12.5              519           32.2
Sovereign                                                     2,091        42.9            1,154         98.2               413             —
Total Retail Banking                                        38,121         10.1           22,569           9.7            7,940            7.0


Total lending rose 5% and customer deposits increased 14%.            Global Private Banking includes institutions that specialise in
                                                                      financial advice and asset management for high-income clients
The performance by geographic areas reflects the varying              (mainly Banif in Spain, Santander Private Banking in the UK, Italy
economic environments, with lower growth in developed                 and Latin America), as well as the units of domestic private
economies and a better macroeconomic environment in                   banking in Portugal and Latin America, jointly managed with
emerging countries.                                                   local retail banks.

• Retail Banking in Continental Europe was the most affected by       The division continued to deepen and adapt its common
  the environment. Gross income declined 2.4% and net                 business model, paying particular attention to the commercial
  operating income 5.4%. Attributable profit dropped 27.8%,           processes of advice, training, career plans, standardisation of
  because of higher provisions, as it is Continental Europe that      investment strategies and discretional management and
  bears the impact of Bank of Spain Circular 3/2010.                  unification of products. The IT platform for management of
                                                                      clients is also being worked on intensely so that it is common to
  The main drivers were moderate business volumes and even            all units in the future. This platform is currently operating in
  falls in lending, good management of assets spreads in an           Spain, Italy and Mexico. The rest of units will gradually join it.
  environment of strong pressure and low interest rates, the
  impact of the Group's policy for capturing deposits, control of     All of this will help to enhance the quality of customer service,
  costs and the effect of the extra provisions under the new          maintain a constant watch on portfolios to ensure they are in
  regulations.                                                        line with objectives, align the value offer of all units and obtain
                                                                      significant synergies.
• The profit of Retail Banking in the United Kingdom was
  11.7% higher in sterling than in 2009. Growth in gross              The environment in which activity was conducted in 2010 was
  income was spurred by net interest income and lower costs,          very difficult. As well as the international financial crisis, interest
  which produced a further gain in the efficiency ratio to            rates were low and the main stock market indices were lower
  40.7%.                                                              than at the beginning of the year.

• The results of Retail Banking in Latin America (at constant         Despite the negative impact of markets, the volume of
  exchange rates) came from growth in basic revenues (net             managed assets was higher on a like-for-like basis, due to the
  interest income and fee income), control of costs                   capturing of new business and more customers. This
  compatible with business development (benefiting from               underscored the good commercial and management processes.
  Brazil’s synergies) and lower loan-loss provisions. Gross           The volume stood at EUR 97,888 million at the end of 2010,
  income and costs rose moderately and the efficiency ratio           +10.6% above 2009 at constant perimeter.
  (including amortisations) was around 41%.
                                                                      Despite the determining factors, private banking posted an
  As a result of a lower level of provisions, net operating income    attributable profit of EUR 283 million. Gross income was hit by
  after provisions increased 31.1%, while attributable profit rose    net interest income due to the evolution of interest rates, offset
  26.1% (higher minority interests).                                  by higher fee income. Expenses, thanks to continued strict
                                                                      control, remained almost stable and provisions continued to
                                                                      have a low share of costs.


      ANNUAL REPORT 2010                                                                                                                   143
NET OPERATING INC.                  ATTRIBUTABLE PROFIT
GLOBAL WHOLESALE BANKING                                             Million euros
                                                                                                 +2.6%   Million euros
                                                                                                                                                -1.8%
• Rigorous management of risk, liquidity and capital.


                                                                                         4,027
                                                                                3,927
• Strong attributable profits, though less than in 2009,


                                                                                                                                    2,698
                                                                                                                         2,748
  which was a record in revenues and earnings

• Activity mainly underscored by customer revenues (86%
  of the total).

• Impact on provisions and profits (-EUR 35 million after                      2009     2010                          2009 2010(1)
  tax) of the new Bank of Spain Circular.                                                                (1) Before the impact from the application of Bank
                                                                                                            of Spain’s Circular 3/2010: 2,733 million; -0.5%


This segment, managed by Santander Global Banking and                Net operating income rose 2.6% to EUR 4,027 million. This
Markets, posted EUR 2,698 million of attributable profit, 1.8%       growth, partly absorbed by provisions including EUR 49
lower than in 2009. This area contributed 12% of the operating       million from the impact of the new Circular on the area, left
areas’ gross income and 24% of attributable profit.                  consolidated profit 2.0% higher. Attributable profit, after
                                                                     higher minority interests, was 1.8% lower. Excluding the
Strategy in 2010                                                     Circular’s impact, attributable profit would have dropped by
The area strengthened its capacities in core markets in order to     0.5%.
consolidate the liquidity positions attained in 2009. This greater
potential enhanced the Group’s capital and liquidity strength        The results were supported by strong and diversified client
and enabled it to keep up a high level of activity in 2010 in an     revenues (86% of the total). They were 3.4% higher than in
environment of greater competition, while maintaining rigorous       2009; the weak evolution in Spain was offset by a higher
management of risk. A good example of this was Santander’s           contribution in euros from other large areas.
notable participation in some of the year’s main operations,
which consolidated it as a major player.                             In order to boost client revenues, Santander Global Banking &
                                                                     Markets continued to deepen the global focus of business, by
Meanwhile, adjustment of structures achieved in the past and         focusing more on the Global Customer Relation Model and
effective management of costs and operations enabled                 fostering inter-relation between the product areas and
Santander to assume the increased capacity while maintaining         specialised units. The model, which concentrates management
an efficiency ratio, which is a benchmark for its peers.             of global corporations and institutions, increased its revenues
                                                                     15% and lifted its share of total revenues.
Results and activity
These actions were reflected in the income statement. The rise       The product areas also made further progress in their
in revenues was offset by higher costs and provisions and            increasingly global business vision, adapted to the changing
contributed to a 1.8% fall in attributable profit to EUR 2,698       needs of markets and clients. Their performance was the
million. The other reasons for this were higher minority interests   following:
in Brazil, because of the listing in October 2009, and the impact
of the new Circular on provisions in the third quarter.              Global Transaction Banking
                                                                     This area, which includes Cash Management, Trade Finance and
Nonetheless, the performance in 2010 was still notable as it was     Basic Financing, increased its client revenues 15%. Growth was
the second best year ever, only slightly behind 2009, a record       solid but lower than in 2009 because of a smaller rise in
year in revenues and profits which were spurred by high spreads      volumes and lower spreads.
and volatility and reduced competition. The normalisation of the
environment in 2010 lifted the value of the results, which           Trade Finance performed the best (+32%), with rises in almost
continued to be backed by a customer-focused business model,         all countries thanks to the Group’s solid position in its natural
the area’s global reach and its interconnection with local units.    markets. Of note was the strong growth in Brazil and Mexico,
                                                                     and the recovery of business in Spain. These three markets
Gross income increased 6.2%. Net fee income grew the most            account for almost 80% of revenues and of their growth.
(+14.6%), aided by the disintermediation trends in some Latin
American countries, net interest income increased 6.7% after         The area also received recognitions in the four main Latin
absorbing the deleveraging of mature markets, the higher cost        American countries where we operate including Argentina and
of liquidity and the normalisation of spreads and gains on           Chile. The magazine Trade Finance named Santander the best
financial transactions remained virtually unchanged.                 international bank for trade in Brazil and Chile

Operating expenses reflected the investments made and some
exchange-rate impact and were 17.7% higher. The efficiency
ratio was 26.9%.


144                                                                                                                   ANNUAL REPORT 2010
Cash Management’s revenues rose 18% as the weakness of                GROSS INCOME BREAKDOWN
European markets, due to lower volumes and interest rates, was        Million euros
offset by the large potential of Latin American business, with
growth rates that doubled those of the area in the three large
markets. Santander was also named the best bank in cash                                      Total             +6%    5,508
                                                                                                       5,184
management in Latin America and first in the TMI ranking in                   Proprietary trading &            +27%    793
South America.                                                                            portfolios
                                                                                                               -10%    848
                                                                                             Equity
In Basic Financing, revenues grew 8%. In Europe, the strong                                                    -10%   1,179
                                                                                              Rates                           Customers
deleveraging of the balance sheets of economic agents resulted                                                                  +3%
                                                                                                               +14%   1,018
in flat revenues. The evolution in the US and Latin America was                             Credit
                                                                                                                       166
                                                                                Corporate Finance              +44%
better, the latter spurred by activity in Brazil.
                                                                        Global Transaction Banking             +15%   1,503

Corporate Finance
                                                                                                       2009           2010
This area (including Mergers and Acquisitions and Asset &
Capital Structuring, -A&CS-) performed well after accelerated
growth in the second half of the year. Client revenues rose 44%
thanks to a very active fourth quarter in Brazil and the UK,          Credit Markets
which returned business to pre-crisis levels.                         Credit Markets, which include origination and risk management
                                                                      units and distribution, with capital market instruments as well as
Mergers and Acquisitions recovered the positive trend in              pure loans and structured financings for the corporate, financial
revenues, mainly due to activity in the large Latin American          and public sectors, continued to generate solid client revenues
countries, an area where the Group continued to accompany its         (+14%), with a good performance by products and countries.
clients in key operations for their expansion. This offset the
weak business in Spain where we maintained our leadership as          In loans, Santander had a leading role in major operations in
the main bank by number of transactions announced.                    Europe and the Americas (combined volume close to $80,000
                                                                      million). Of note was the refinancing of the loan to Inbev to
Of note among the operations in which the Group participated          acquire its rival Anheuser-Busch where the Bank was the book
was advising the Isolux-Elecnor-Cobra (ACS) consortium on the         runner.
sale of eight electricity transmission lines in Brazil to a Chinese
group and selling the stake of Portugal’s Brisa in the Brazilian      In Project and Acquisition Finance, Santander consolidated its
holding company CCR with interests in private interstate              position as one of the leading banks at the global level. The
highway concessions. Also noteworthy was our participation in         Group is present in major operations in the energy and
other cross-border operations such as those conducted by ENI,         electricity sectors in Spain, the UK and Italy. Of note was the
Dufry and Telefónica-Infosel.                                         Castor project (Europe Oil & Gas Deal of the Year for Project
                                                                      Finance International) to create the third underground
The revenues of Asset & Capital Structuring (A&CS) grew the           warehouse for the Spanish gas system, in financing the
fastest thanks to the growing number of clients in Europe and         purchase of 25.83% of Abertis by both companies in which CVC
Latin America. Of note was the activity of Spanish Operating          and ACS have stakes and in the acquisition of the gas
Lease (purchase and lease of assets) with several operations          distribution and transport networks of Endesa and Gas Natural
completed and mandates on transport assets with clients in            by infrastructure funds in Spain, or the acquisition of the gas
Spain, the UK, France and Brazil. In Brazil, we won Jane’s            distribution and transport networks of Eon in Italy.
Transport Finance Awards in two categories: 2010 Aircraft
Leasing Innovator of the Year and 2010 Latin American Aircraft        In Latin America Santander capitalized on its experience in
Leasing Deal of the Year.                                             financing renewable energy and infrastructure, acting as the
                                                                      structuring bank for financing many projects in Brazil, Mexico
Also notable was solar energy business in Italy and wind power        and Chile. Of note was the construction and operation of the
in Brazil and the US, as well as in the segment of R&D+i, which       first large-scale cogeneration plant of Pemex in Mexico. Project
optimizes the development funds of Spain’s Industry Ministry          Finance International named Santander Bank of the Year
and the Centre for the Development of Industrial Technology           Americas.
(CDTI). Lastly, we completed a CER monetization operation (CO2
emission rights) for a wind power park in Oaxaca, Mexico.             The evolution in the segment for bonds and securitisations was
                                                                      also good, particularly due to activity in Latin America where the
                                                                      Group took Brazilian, Mexican, Argentine and Chilean issuers to
                                                                      the international market, added to significant operations in
                                                                      Europe in the public and private sectors. All of this enabled
                                                                      Santander to scale positions in the world of bonds and attain
                                                                      new recognitions in markets such as the 2010 European
                                                                      Institutional Performance Award for the best MTN newcomer
                                                                      given by Mtn-i.

                                                                      Of note among the main operations in Latin America were: the
                                                                      issue of the first corporate bond in Argentine in three years; the
                                                                      largest issue in Chile, which included for the first time a tranche
                                                                      in Chilean pesos; and, because of its complexity and innovation,
                                                                      a 10-year $1,500 million bond for Brazil’s Odebrecht. This
                                                                      operation received the IFR award as Latam Bond of the Year.

     ANNUAL REPORT 2010                                                                                                                   145
Rates                                                                                        Equities
The client revenues of this area (including trading activities,                              The revenues of the Global Equities area (activities related to the
structuring and distribution of FX and public bonds and interest                             equity markets, settlement and custody) were 10% lower than
rate derivatives for the Group’s wholesale and retail clients)                               in 2009 (a record year).
declined 10%. The larger volumes with institutional and mid-
corp clients did not offset the impact on revenues of the                                    The factors behind the fall were the considerable degree of
normalization of spreads since the highs reached in 2009.                                    uncertainty in the markets, the significant fall in share prices,
                                                                                             high volatility and sharp declines in trading volumes, despite
Geographic diversification of revenues is enabling the Group to                              which Santander managed to defend its position in key markets.
build up an increasingly solid position. Four of our key countries                           Among the position attained in the sector’s main rankings were
(Spain, Portugal, Chile and Uruguay) received Best Foreign                                   first in Iberia and in Latin America in equity capital markets by
Exchange provider awards from the magazine Global Finance.                                   Bloomberg and first by Institutional Investors and Thomson
                                                                                             Reuters in equities research in Iberia.
Of note in Europe was the increase in sales to institutional
investors and large companies, particularly in bonds and simple                              Significant operations in 2010 included global coordinator of
derivatives, as well as the recovery of retail activity in Spain                             Petrobrás’s IPO, the largest in history ($70,000 million) and book
supported by mid corps. The evolution was also very good in                                  runner in Deutsche Bank’s capital increase launched in October.
the UK in the three large segments, consolidating it as the third
largest unit in revenue generation. Strong growth in Latin                                   The sale of investment solutions and hedging via derivatives
America fuelled by the retail segment in the three large markets                             slowed down because of the increased remuneration of
where the Group operates, particularly Brazil, and firmly backed                             deposits, which triggered demand for these products.
by Santander Global Connect. In the US, the Group’s franchise
model for clients is beginning to generate significant revenues.                             Lastly, custody and settlement activity began to pick up, due
                                                                                             largely to Latin America and particularly Brazil. This offset the
                                                                                             weak performance in Europe from stock markets and a
                                                                                             slower than expected recovery in the volume of managed
                                                                                             funds.


RANKINGS IN 2010

                 Activity                                                            Area           Country / Region                Source

Award            Best Cash Management Bank 2010                                      GTB            Latin America                   TMI
N1.              Cash Management in South America                                    GTB            Latin America                   TMI
Award            Best International Trade Bank                                       GTB            Brazil/Chile                    Trade Finance
Award            Best Trade Bank                                                     GTB            Mexico                          Trade Finance
Award            Best Argentinean trade Bank                                         GTB            Argentina                       Trade Finance
Award            Aircraft Leasing Innovator of the Year                              CIB            Brazil                          Jane's Transport Finance
Award            Latinamerican Aircraft Leasing Deal of the Year                     CIB            Latin America                   Jane's Transport Finance
Award            Latin America Bond of the Year - PF Odebrecht                       CM             Latin America / Brazil          IFR /Bond Radar / Euromoney
Award            Latin America Wind Deal of the Year : SIIF                          CM             Latin America / Brazil          Euromoney
Award            Bank of the year Americas                                           CM             America                         Project Finance International
Award            Transport Deal of the Year Asia: Peninsula Link                     CM             Asia                            Project Finance International
Award            Europe Oil & Gas Deal of the Year: Castor                           CM             Europe                          Project Finance International
Award            Best MTN newcomer for Institutional Clients                         CM             Europe                          Mtn-i
Award            Best Foreing Exchange Provider                                      RT             Chile/Portugal/Spain/Uruguay    Global Finance
N1.              Equity Capital Markets de Latin America                             EQ             Latin America                   Bloomberg
N1.              Equities Research en Iberia                                         EQ             Spain and Portugal              Institutional Investors
N1.              Equities Research en Iberia                                         EQ             Spain and Portugal              Thomson Reuters
N1.              Equity Capital Markets en Iberia                                    EQ             Spain and Portugal              Bloomberg
N2.              Equities Research en Mexico                                         EQ             Mexico                          Institutional Investors
(*).- Prize or ranking depending on the criterion               (**),- Prize or ranking by volume

 GTB: Global Transaction Banking                    CIB: Corporate and Investment Banking                 CM: Credits and Markets        RT: Rates            EQ: Equity


146                                                                                                                                          ANNUAL REPORT 2010
NET OPERATING INC.               ATTRIBUTABLE PROFIT
ASSET MANAGEMENT AND INSURANCE                                       Million euros
                                                                                             +6.5%    Million euros
                                                                                                                              +15.2%
• Total revenues accounted for 9% of all the Group’s
  operating areas.


                                                                                       739
• Customer preference for deposits continued to negatively


                                                                                694


                                                                                                                        462
  impact the sale of mutual funds and insurance.


                                                                                                                 401
• Mutual funds: higher volumes in Brazil and the UK, with
  a still limited impact on fee income. Leadership recovery
  in Spain in mutual funds.
• Insurance: better evolution, backed by growth in Latin
  America.                                                                     2009   2010                      2009   2010


Strategy                                                             strengthen bancassurance in five key markets in Latin America:
Attributable profit was EUR 462 million, 15.2% more than in          Brazil, Mexico, Chile, Argentina and Uruguay. Santander will
2009 (4% of the operating areas’ total).                             create a holding company for its insurers in Latin America,
                                                                     which will be 49% owned by it and 51% by Zurich.
At the global level Santander Asset Management continued to
streamline the range and merger of funds in various markets.         This agreement combines Banco Santander’s commercial
The aim is to supply the Group’s networks with simple                strength and distribution capacity with the experience and
products, well known and with high average volumes.                  leadership of Zurich in developing and managing products. In
                                                                     each of the countries Banco Santander will distribute
Of note was the creation of the multi manager team to                bancassurance products for 25 years.
manage funds of funds, which maximises synergies in all units.
Progress was also made in developing the platform in                 Results
Luxembourg to unify distribution of products from anywhere in        Gross income increased 7.7%, more strongly supported by
the world and managed by the best teams from any of the              insurance as revenue from mutual funds was stable. Costs
Group’s fund managers.                                               almost flat in the last few quarters, ended the year up 10.3%
                                                                     because of the one-off impact of the change in accounting
These efforts were recognised in 2010 with prizes to fund            criteria for amortisation of intangible insurance assets.
management institutions (Spain, Chile, UK and Mexico) and for
the performance of funds in several countries and categories.        Net operating income amounted to EUR 739 million, 6.5%
                                                                     more than in 2009. As a result of lower provisions and a more
Santander Insurance advanced in its global business model,           favourable tax rate, which offset the higher minority interests
creating new products via its distribution channels and preserving   in Brazil, attributable profit grew at a faster pace than net
its low risk profile and high level of efficiency in operations.     operating income.

A strategic alliance was reached with the insurer Zurich to          Total revenues contributed to the Group by asset management
                                                                     and insurance activities, without deducting those recorded by
                                                                     the distribution network, amounted to EUR 3,966 million, 9%
                                                                     of the Group's total and 10.1% more than in 2009.
TOTAL GROUP REVENUES
Million euros                                                        The total contribution to Group profits (income before tax and
                                                                     the fee income paid to the networks) was EUR 3,591 million
                                                                     (+11.2%).
                                     +10%      3,966
                     Total   3,603                                   Asset Management

                                                                     Santander Asset Management generated an attributable profit
                 Insurance                     2,688                 of EUR 81 million, better than in 2009 and reflecting the
                                     +11%
                                                                     recovery in volumes, the rise in average commissions in the
                                                                     main markets due to the better product mix and more
                                                                     “normal” provisions.
         Asset Management             +8%      1,278
                                                                     Total revenues from mutual and pension funds, before
                             2009               2010
                                                                     distribution to the distribution networks, amounted to EUR


      ANNUAL REPORT 2010                                                                                                          147
1,278 million (+8%), while the total contribution to profits         Management Brazil and Moody’s the MQ1 investment
rose 12.3% to EUR 1,099 million.                                     manager quality rating.

Volumes were weak in developed countries because of the              Managed assets also rose in the UK, spurred by increasing
strong preference of agents for on-balance sheet funds and           sales in branches of multimanager funds. The retail balance
the impact of the markets on portfolios, and stronger in Latin       at the end of 2010 was EUR 14,000 million (+27% in
America within the recovery trend begun in 2009.                     sterling).

Total managed assets amounted to more than EUR 124,000               Mexico also benefited from the launch of new mixed funds
million at the end of 2010 (+7% and benefiting from the              which helped increase the volume of managed assets to EUR
appreciation of currencies against the euro)                         10,000 million (+7% in local currency) and improve its
                                                                     product mix.
The main elements by units and countries were as follows:
                                                                     Of note in other markets, which account for 10% of managed
• In traditional management of assets, mutual fund                   assets, was Chile which benefited from a personal banking
  business continued to recover, with the incorporation of           product and the Elite portfolios. Its managed assets stood at
  more markets and greater interest by clients and distributors,     EUR 5,800 million and its average fee improved, offsetting the
  particularly in Latin America.                                     exit of funds into other savings instruments (-6% in local
                                                                     currency).
  At the end of 2010, the Group managed EUR 121,000
  million (+7%) in mutual funds, investment companies and            Portugal, on the other hand, notably improved its average
  pension plans, 90% of which was in four large markets              fee which offset the impact on revenues and earnings of the
  (Spain, UK, Brazil and Mexico).                                    16% decline in volumes, the result of the bad performance
                                                                     of markets and the appetite for deposits.
  In Spain, the improvement in volumes at the end of 2009
  was interrupted by the preference for on-balance sheet funds     • In real estate management, Grupo Santander decided,
  with attractive offers for deposits. This, coupled with the        for solely commercial reasons, to contribute funds to the
  impact of markets, brought total assets managed in Spain,          Santander Banif Inmobiliario investment fund by subscribing
  including pension funds, to EUR 40,000 million (-14%).             to new units and granting a two-year liquidity guarantee in
                                                                     order to meet the reimbursements of participants who so
  Santander Asset Management recovered its leadership of             desire it. As a result of this measure, the suspension of
  mutual funds in Spain with a market share of 17.4%,                reimbursements was lifted and the fund is now operating
  according to Inverco.                                              normally.

  This recovery, backed by management of the networks, was         • In alternative management, we continued to restructure
  focused on the sale of mixed and guaranteed fixed income           the funds and structures of Optimal Investment Services, in
  funds, which were well received. Of note was the EUR 2,400         line with the current scant demand for this type of product
  million captured in the range of 100X100 funds and the EUR         and with the forced reduction in its managed assets.
  700 million in Santander Revalorización Activa. The
  reorganisation of the range of funds improved the product        • In venture capital funds (a product aimed at institutional
  mix and the average fee. Santander Asset Management                clients who invest very long term in unlisted companies),
  continued to focus on contributing value and at the end of         assets remained at around EUR 300 million.
  2010 launched the Gama Select of profiled funds, which are
  expected to perform well in 2011.

  The trend in Brazil was good, with net sales and average
  commissions higher than in 2009. Of note was the reception
  given to new guaranteed products for the retail segment,
  particularly the fund Capital protegido 6 which surpassed
  placement expectations. At the end of 2010, managed
  funds amounted to almost EUR 44,000 million (+12% in
  local currency).

  Also noteworthy is that in 2010 Standard & Poor’s affirmed
  the AMP-1 rating (very strong) for Santander Asset


148                                                                                                         ANNUAL REPORT 2010
Insurance                                                           INSURANCE (DISTRIBUTION PBT + FEES)
                                                                    %. December 2010
The global area of Santander Insurance generated attributable
profit of EUR 381 million, 9.0% more than in 2009. The main
reason for this was greater activity, which absorbed the higher          Other Latin America                       Spain 15%
minority interests in Brazil.                                                          15%

Total revenues (the area’s gross income plus fee income paid
to the networks) were EUR 2,688 million, 11% more than in                                                                  Germany 13%
2009 (+3.5% without the exchange rate impact) and
representing 6% of the operating areas’ total gross income

The total contribution to the Group’s results (profit before tax         Brazil 33%
of the insurance companies and brokers and fees received by                                                              Other
networks) increased 10.7% to EUR 2,491 million (+3.3%                                                                    Europe 14%
excluding the exchange-rate impact).
                                                                                      Sovereign 1%              United Kingdom 8%

Total premium income was 6% lower, impacted by clients’
preference for liquidity and the consequent lower demand for
savings-investment products. Premium income from protection
insurance, on the other hand, increased 16%.
                                                                    Latin America contributed EUR 1,213 million (49% of the total)
Continental Europe, which contributed 42% of the total,             and 34% more than in 2009 (+15% excluding the exchange-
maintained its stable contribution despite the weakness of the      rate impact). All countries increased their contributions at
main euro zone economies. Spain’s contribution (excluding           double-digit rates in euros and in local currency.
Santander Consumer Finance) was EUR 373 million (-7%), with
a good performance of revenues from protection insurance            The greater efficiency in selling products via the banking
which partially offset the fall in savings-investment.              networks and other channels, coupled with development of
                                                                    simple products independent of lending operations lifted the
Portugal maintained good levels of fee income and results           region’s level of activity and of results.
from the insurance company. Its total contribution increased
2% to EUR 134 million.                                              Of note was Brazil (+12% in local currency and 69% of the
                                                                    region’s contribution), and Mexico (+26% in pesos). In Chile,
Santander Consumer Finance maintained its pace, adjusting its       the country’s earthquake in February 2010 had no significant
levels of penetration to activity and generation of loans in each   impact on insurance results thanks to the Group’s reinsurance
market. Its total contribution was EUR 544 million, in line with    policy for this type of disaster. Its contribution was 15% higher
2009.                                                               in local currency.

The UK’s total contribution was 16% lower in sterling at EUR        Sovereign, in the first phases of its insurance model, already
193 million. This was due to lower placement of savings             contributed EUR 34 million (+5% in dollars), basically due to
insurance products because of the stronger demand for other         fee income from distribution of savings insurance.
products.


ASSET MANAGEMENT AND INSURANCE. INCOME STATEMENT
Million euros
                                                                       Gross                   Net operating                     Attributable
                                                                     income                          income              profit to the Group
                                                             2010     Var (%)            2010        Var (%)              2010        Var (%)

Mutual funds                                                  267        7.9              113            8.7                70          77.7
Pension funds                                                  25      (13.2)              16          (18.4)               11         (11.0)
Insurance                                                     790        8.4              610            6.9               381           9.0
Total Asset Management and Insurance                        1,081        7.7              739            6.5               462          15.2


      ANNUAL REPORT 2010                                                                                                                  149
RISK MANAGEMENT REPORT


Photo: El Bosque, Grupo Santander City, Boadilla del Monte, Madrid, Spain
150                                                                         ANNUAL REPORT 2010
152   EXECUTIVE SUMMARY
                     154   CORPORATE PRINCIPLES OF RISK MANAGEMENT
                     158   CORPORATE GOVERNANCE OF THE RISK FUNCTION
                     159   INTEGRAL CONTROL OF RISK
                     161   CREDIT RISK
                     182   MARKET RISK
                     197   OPERATIONAL RISK
                     200   REPUTATIONAL RISK
                     202   ADJUSTMENT TO THE NEW REGULATORY FRAMEWORK
                     204   ECONOMIC CAPITAL
                     207   RISK TRAINING ACTIVITIES


ANNUAL REPORT 2010                                                      151
RiSk MANAgEMENT REPORT
ExEcUTivE SUMMARy


 BANCO SANTANDER’S
                                                   Independence                             All the Bank’s organs
 RISK MANAGEMENT                                     of the risk                             of government are
                                                                                                                                                                              Collegiate
                                                                                                                                                                              decisions
 PRINCIPLES                                           function                                 deeply involved
 pages 154 a 157


                                                                                                Control and
                                                    Cutting-edge                                                                                                         Support for
                                                                                            management of risk
                                                tools and systems in                                                                                                       business,
                                                                                              integrated via a
                                                 risk measurement                                                                                                       maintaining risk
                                                                                            corporate structure
                                                     and analysis                                                                                                           quality
                                                                                             with global scope


 MARKET RISK                                                VAR PERFORMANCE IN 2010
 pages 182 a 196                                            Million euros

                                                              40
 • Santander maintains a low risk profile in activities                                                                                          Max. (37.5)
   subject to market risk.                                    36

 • In trading activity, lower exposure than in 2009 in
                                                              32
   a high volatility environment due to Europe’s
   sovereign debt crisis.
                                                              28
 • In 2010, the exposures of Grupo Santander
   related to complex structured assets, from already         24
   very low levels, were reduced.
                                                              20                                                                                                                      Min. (21.2)
                                                                   4 Jan. 10

                                                                               11 Feb. 10

                                                                                             02 Mar. 10

                                                                                                          28 Apr. 10

                                                                                                                       17 May. 10

                                                                                                                                    05 Jun. 10

                                                                                                                                                   13 Jul. 10

                                                                                                                                                                20 Aug. 10

                                                                                                                                                                                  27 Sep. 10

                                                                                                                                                                                               16 Oct. 10

                                                                                                                                                                                                            23 Nov. 10

                                                                                                                                                                                                                          31 Dec. 10


 MANAGEMENT OF FUNDING                                             LIQUIDITY MONITORING METRICS
 AND LIQUIDITY RISK
                                                                   Metrics                                                                                       2010                                           2009
 pages 192 a 194
                                                                   Loans/Net assets                                                                                  75%                                          79%
 • Santander has a stable structural liquidity position            Customer deposits, insurance
   backed by customer deposits and medium- and                     and medium and long-term
   long-term wholesale funding (4.1 years on average).             funding/lending                                                                              115%                                        106%
 • Strong improvement in 2010 in liquidity ratios after            Customer deposits, insurance
   capturing EUR 109,000 million in deposits and                   and medium and long-term
                                                                   financing and other
   EUR 38,000 million in medium and long-term issues.
                                                                   liabilities/Loans+fixed assets                                                               117%                                        110%
   Santander has no need in 2011 and 2012 to cover
   the envisaged maturities of its debt.                           Short-term
                                                                   financing/Net liabilities                                                                                 3%                                          5%
 • Discounting capacity in central banks of around
   EUR 100,000 million.
 • Santander has a decentralized model of liquidity
   independent of the subsidiaries and within
   coordinated management at the Group level.
CREDIT PORTFOLIO IN SPAIN
   Billion euros                                                                                                                                                        change
                                                                                              -3.5%                              -3.6%                                   08/10
              TOTAL                                                           254                                                                                           %
                                                                                                                 245
              Public administrations                                           7                                                                  236                       -7.0
                                                                                                                  10
                                                                                                                                                   12                     +70.1
              Residential mortgages                                            65
                                                                                                                  64
                                                                                                                                                   61                       -5.4
              Other loans to individuals                                       33
                                                                                                                  31
                                                                                                                                                   30                       -9.6
              companies excluding construction                                 98
              and real estate                                                                                     95
                                                                                                                                                   95                       -3.6
                                       Non-real estate purpose                 13
                                                                                                                  13
              construction                                                                                                                         11                     -15.5
              and real estate                                                  38                                 31
                                       Real estate purpose                                                                                         27                     -27.5
                                                                            2008                                2009                             2010

             Net foreclosed assets                                            4.3                                4.5                               5.2


EXPOSURE TO REAL ESTATE CREDIT RISK IN SPAIN
pages 172 a 174

At the end of 2010:
• Total lending to households to acquire homes with mortgage guarantee amounted to EUR 61,387 million
  (26% of loans in Spain). The non-performing loan ratio was 2.2% (2.5% in 2009).
• The exposure to the construction and real estate activity sectors was EUR 27,334 million (3.7% of the Group’s
  total and 12% of lending in Spain). This exposure dropped by 27% in the last two years.
• Santander’s estimated market share of this business is 10%, much lower than the market share of all the Group’s
  businesses in Spain (15%).
• The non-performing loan ratio of this portfolio is 17.0%. Total doubtful loans (EUR 4,636 million) and sub standard
  loans (EUR 4,932 million) amounted to EUR 9,568 million and the level of coverage with provisions was 28%.*
• The net balance of acquired and foreclosed properties was EUR 5,195 million.*


EXPOSURE TO THE CONSTRUCTION                                                                         NON-PERFORMING LOAN RATIO IN SPAIN
AND REAL ESTATE ACTIVITY SECTORS                                                                     %
Million euros
                                                                                                                Construction and real estate                                 Rest of portfolio
                                                                                                                Total portfolio in Spain                                     Residential mortgages
                                                                                                      15
 Total: 27,334 mill.
                                                                  Finished buildings                                                                            Non-real estate purpose: 4.4%
                                                                  (12,709) 47%                                                                                  Real estate purpose 17.0%
                                                                                                      12                                                                                   13.3


    Land that can be
          developed                                                                                   9
         (2,023) 7%                                                                                                                                       8.7

       Developed land                                                                                 6
         (3,678) 13%
                                                                                                                                                                                          4.2
                                                                                                                                                 3.4
                                                                                                      3    3.3                                                                                  3.0
                    Buildings under                              Without mortgage                                                                         2.5
                       construction           Other land         guarantee                                         2.0                                                                          2.2
                                                                                                          1.9                                       2.4
                      (2,548) 10%             (252) 1%           (6,124) 22%
                                                                                                                   1.5
                                                                                                      0
                                                                                                            2008                                   2009                                2010


* Pages 172-173 of this report set out the structure of risk coverage in the construction and real estate development sectors and the volume of acquired and foreclosed properties.
cORPORATE PRiNciPLES OF RiSk MANAgEMENT,
cONTROL AND RiSk APPETiTE


The importance of grupo Santander’s risk policy was                 GRUPO SANTANDER’S BANKING
highlighted once again in 2010. The policy is focused on
maintaining a medium-to-low, predictable profile in all risks,      BUSINESS MODEL FROM THE RISK
which, together with the group’s diversification, were again the    STANDPOINT
differentiating factors that enabled Santander to maintain a
leading position in this sphere.                                    The banking business model chosen by the group mainly
                                                                    determines grupo Santander’s risk management, control and
Santander’s risk management policies were particularly              appetite.
effective in countering the turmoil that has affected financial
                                                                    • Santander focuses on retail banking and maintains an
markets since July, 2007.
                                                                      internationally diversified presence characterised by market
                                                                      shares of more than 10% in the main markets where it
For grupo Santander, quality risk management is one of its
                                                                      operates. Wholesale banking business is conducted above all
hallmarks and thus a priority in its activity. Throughout its 150
                                                                      in core markers.
years, Santander has combined prudence in risk management
with use of advanced risk management techniques, which have         • The model enables Santander to generate results with a high
proven to be decisive in generating recurrent and balanced            degree of recurrence, with a strong capital base and liquidity.
earnings and creating shareholder value.
                                                                    • Santander operates in markets via subsidiaries that are
                                                                      autonomous in terms of capital as well as liquidity and
                                                                      compatible with corporate control. The corporate structure
                                                                      has to be simple, minimising the use of non-functional
                                                                      subsidiaries.
                                                                    • Santander develops its model for operational and technology
                                                                      integration via corporate platforms and tools. This provides an
                                                                      agile aggregation of information in time and form.
                                                                    • All the activity that the group carries out is part of its social
                                                                      and reputational commitment, in accordance with its strategic
                                                                      objectives.


154                                                                                                             ANNUAL REPORT 2010
The risks model that underpins the business model is based on       Management and control of risks at grupo Santander is
the following principles                                            structured around the following phases:
• independent working from the business areas. Mr Matías            • Establishment of risk policies and procedures. They constitute
  Rodríguez inciarte, the group’s third vice-chairman and             the basic framework for regulating risk activities and
  chairman of the board’s risk committee, reports directly to the     processes. At the local level, the risk units incorporate the
  executive committee and to the board. The establishment of          corporate rules to their internal policies.
  separate functions between the business areas (risk takers)
                                                                    • Defining and assessing risk methodologies. The
  and the risk areas responsible for measurement, analysis,
                                                                      methodologies enable us to develop the internal risk models
  control and information provides sufficient independence and
                                                                      applied by the group, and require risk measures, methods for
  autonomy to control risks appropriately.
                                                                      evaluating products and for constructing yield curves.
• involvement of senior management in all decisions taken.
                                                                    • Risk measurement. This considers all the risk positions taken
• collective decision-making (including at the branch level),         throughout the business perimeter and uses methodologies
  which ensures a variety of opinions and does not make results       and models put into use in accordance with a process of
  dependent on decisions solely taken by individuals. Joint           validation and approval, based on components and
  responsibility for decisions on credit operations between risk      dimensions of risk in the whole life cycle.
  and business areas.
                                                                    • Define and limit the risk appetite. The aim is to delimit
• Defining functions. Each risk taker unit and, where                 efficiently the maximum risk levels by setting the global and
  appropriate, risk manager has clearly defined the types of          specific limits for the different types of risk, products,
  activities, segments, risks in which they could incur and           customers, sectors and countries.
  decisions they might make in the sphere of risks, in
                                                                    • Execute a system to monitor and control risks, which verifies
  accordance with delegated powers. How risk is contracted,
                                                                      every day and with the corresponding reports the extent to
  managed and where operations are booked is also defined.
                                                                      which Santander’s risk profile is in line with the risk policies
• centralised control. Risk control and management is                 approved and the limits established.
  conducted on an integrated basis through a corporate
  structure, with global scope responsibilities (all risk, all
  businesses, all countries).


      ANNUAL REPORT 2010                                                                                                              155
Santander’s risk management is fully identified with the Basel        GRUPO SANTANDER’S RISK APPETITE
principles as it recognises and supports the industry’s most
advanced practices which the group has been anticipating and,         The risks in which Santander incurs must be delimited and
as a result, it has been using for many years various tools and       quantified within the risk appetite framework defined and
techniques which will be referred to later in this section.           approved by the board. Santander defines the risk appetite
They include:                                                         as the amount and type of risks considered as reasonable to
                                                                      assume in the execution of its business strategy.
• internal rating and scoring models which, by assessing the
  various qualitative and quantitative components by client and
                                                                      The board, at the proposal of senior management, is responsible
  operation, enable the probability of default to be estimated
                                                                      for establishing and monitoring Santander’s risk appetite and its
  first and then, on the basis of estimates of losses, the
                                                                      tolerance to risk. Senior management is responsible for
  expected loss.
                                                                      achieving the desired risk profile as well as managing risks on
• Economic capital, as the homogeneous metric of the risk             a day to day basis. The group has the necessary metrics and
  assumed and the basis for measuring management, using               infrastructure to guarantee management.
  RORAc, for pricing operations (bottom up) and for analysis of
  portfolios and units (top down), and vaR, as the element of         The risk appetite has quantitative and qualitative aspects, and is
  control and setting the market risk limits of the various trading   directly linked to Santander’s global strategy, including assessing
  portfolios.                                                         growth opportunities in businesses and key markets, liquidity
                                                                      and financing capacity and capital. Pillar 2, with its
• Analysis of scenarios and stress tests to complement the
                                                                      corresponding exercises of planning and stress test of capital,
  analysis of market and credit risk, in order to assess the impact
                                                                      complements the risk appetite reference framework.
  of alternative scenarios, including on provisions and on
  the capital.
                                                                      Formulating the risk appetite delimits the budgetary process, in
                                                                      which the main strategic parameters are analysed and approved
grupo Santander calculates the minimum regulatory capital in          as well as their results, liquidity, capital, bad loans, vaR, etc.
accordance with Bank of Spain circular 3/2008 on determining
and controlling the minimum equity of credit institutions. This
regulation completed the transfer to Spanish banking legislation
of the Directives (2006/48Ec and 2006/49/Ec), which
incorporate to European Union (EU) regulations the new Basel
capital Accord (BiS ii).

As a result of the new elements introduced into the regulatory
framework, commonly known as BiS iii, grupo Santander took
steps to apply with sufficient prevision the future requirements
indicated in BiS iii. This entails a greater requirement for high
quality capital, sufficiency of capital conservation and counter
cyclical.

grupo Santander also foresaw the application of the two new
liquidity ratios indicated in BiS iii, which guarantee sufficient
liquidity even in stress scenarios. These ratios are the liquidity
coverage ratio (LcR) for the short term (30 days) and the net
stable funding ratio (NSFR) regarding the financing structure.

As regards the new liquidity requirements, and especially
concerning the ratio of stable financing, the group believes it is
very important that the final definition to attain after agreed
periods of observation and review reflects the differences
associated with the various banking business models and avoids
penalising the flow of loans to the real economy.


156                                                                                                               ANNUAL REPORT 2010
RISK APPETITE MANAGEMENT CRITERIA                                       As for the risk concentration appetite, Santander’s main
FOR EACH SPECIFIC RISK                                                  objective is to maintain a well diversified risk portfolio from the
The main criteria and metrics used are approved by the risk             standpoint of its exposure to large risks, certain markets and
committee, the executive committee and, where appropriate,              specific products. it is measured via three focal points
the board at least yearly. control and monitoring is conducted in       (customers, products and sector) which include limits set such as
accordance with various time frames (from daily to annual), on          warning or control signs.
the basis of the metric and corresponding level of responsibility.      • Market risk: Trading activity is customer-focused. The
                                                                          consistency between the proposed limits and the budget of
criteria, metrics and limits (“hard” and “alert/control”) where           the business is verified. Metrics are used such as vaR, P&L of
necessary are set for each risk. We now look briefly at the               management and capital. The vaR is established on the basis
general criteria for each risk, which are developed in the                of the historic evolution of losses, and as consumption/P&L of
following chapters:                                                       management up to a certain percentage. Stress tests are also
• Credit risk: The credit risk appetite in general is articulated         used.
  around control limits that can change during the year                   in the case of market/structural risks, these are linked to
  depending on banking business needs and the group’s risk                conservative management of the group’s assets and liabilities,
  appetite, on the basis of segmenting the risk established               liquidity and structural Fx. criteria and metrics are used that
  (individualised management, standardised and wholesale).                are mentioned in greater detail in the relevant sections.
  The results of the stress tests under various scenarios are also
  taken into account.                                                   • Operational and technology risk: Risk appetite is monitored
                                                                          on the basis of management and daily mitigation, via the ratio
                                                                          of gross losses/gross income, self-assessment
The main features for each credit risk segment are as follows:            questionnaires/risk maps and management indicators.
• Standardised risks: Scoring models and automated decisions            • Compliance and reputational risk: The appetite for this risk is
  are used. The risks are grouped in credit management                    zero. Active policies to manage reputational risk are
  programmes (cMPs), with credit policies designed and                    established by the corporate office created for this purpose.
  approved on the basis of the unit’s risk appetite and in
  accordance with their level of predictability. The annual cMPs        Support indicators are used to monitor it:
  are approved at the local level, in accordance with the group’s         – Antimoney laundering.
  structure of powers.
                                                                          – institutional relations with regulatory bodies.
• Individualised management: classified as of a certain risk
  exposure per customer. Each analyst is assigned a portfolio of          – codes of conduct of the securities markets.
  customers to monitor. The ratings of each one are updated at            – Marketing of products.
  least once a year.
                                                                          – Markets in financial instruments directive (MiFiD).
• Global wholesale banking risk (GWB: includes corporate and
  financial institutions/iFis): the distribution of the risk level by     – Others: Bank of Spain/Supervisors customer complaints
  rating is used as the parameter for monitoring the portfolio.             and data protection (law on data protection).
  Limited for each group/customer are assigned at least once a
  year and all aggregated limits are analysed, breaking them
  down by the level of rating. The revisions are done by sectors
  (corporate) and countries (iFis).


      ANNUAL REPORT 2010                                                                                                                157
1. cORPORATE gOvERNANcE
   OF THE RiSk FUNcTiON


The risk committee is responsible for proposing to the board the      The board’s risk committee delegates some of its powers in risk
group’s risk policy, approval of which corresponds to the board       committees which are structured by geographic area, business
under its powers of administration and supervision. The               and types of risk, all of them defined in the corporate
committee also ensures that the group’s activities are consistent     governance risk model.
with its risk tolerance level and establishes the global limits for
the main risk exposures, reviewing them systematically and            in addition, both the executive committee and the Bank’s board
resolving those operations that exceed the powers delegated in        pay particular attention to management of the group’s risks.
bodies lower down the hierarchy.
                                                                      grupo Santander’s risks function is conducted via two
The committee is of an executive nature and takes decisions in        directorates-general of risks which are independent of the
the sphere of the powers delegated in it by the board. it is          business areas, both from the hierarchical and functional
chaired by the third vice-chairman of grupo Santander and four        standpoint. Both of them report to the group’s third vice-
other board members are also members of the committee.                chairman, the maximum executive responsible for the group’s
                                                                      risk management. The organisational and functional framework
The committee met 99 times during 2010, underscoring the              is as follows:
importance that grupo Santander attaches to appropriate
                                                                      • general directorate of integral control and internal validation
management of its risks.
                                                                        of risks, with responsibilities of global scope and corporate
                                                                        nature and support for the group’s organs of governance,
The main responsibilities of the board’s risk committee are:
                                                                        which are:
• Propose to the board the risk policy for the group, which
                                                                        - validation of internal models of risk to assess the suitability
  must, in particular, identify:
                                                                          and appropriateness of the classification systems, internal
  - The different types of risk (operational, technological,              processes and treatment of data, in accordance with Basel ii.
    financial, legal and reputational, among others) facing it;
                                                                        - integral control of risks to guarantee that the management
  - The information and internal control systems used to control          and control systems of the various risks are in line with the
    and manage these risks;                                               Bank’s global risk profile.
  - Set the level of risk considered acceptable:                      • Directorate general of risks, with functions in the following
                                                                        blocks:
  - The measures envisaged to mitigate the impact of identified
    risks, in the event that they materialise;                          - A corporate structure, with global scope responsibilities
                                                                          (“all risks, all countries”), which establishes the policies,
• Systematically review exposures with the main customers,
                                                                          methodologies and control: solvency, market and
  economic sectors, geographic areas and types of risk.
                                                                          methodology.
• Authorise the management tools and risk models as well be
                                                                        - A business structure, centred on the execution and
  familiar with the results of the internal validation.
                                                                          integration in management of the risks function in the
• Ensure that the group’s actions are consistent with the                 group’s retail, global and local businesses.
  previously decided risk tolerance level.
• know, assess and monitor the observations and
  recommendations periodically formulated by the supervisory
  authorities in the exercise of their function.
• Resolve operations beyond the powers delegated to bodies
  lower down the hierarchy, as well as the global limits of pre-
  classification of economic groups or in relation to exposures
  by classes of risk.


158                                                                                                                 ANNUAL REPORT 2010
2. iNTEgRAL cONTROL
   OF RiSk


grupo Santander launched in 2008 the function of integral             The main features of this function are:
control of risks, anticipating the new regulatory requirements,
                                                                      • global and corporate scope: all risks, all businesses,
then being discussed in the main organisations and forums –
                                                                        all countries;
Basel committee, cEBS, FSF, etc, - as well as the
recommendations on best risk management practices                     • it is configured as a third layer of control, following the one
formulated by various public and private bodies.                        by the person responsible for managing and controlling each
                                                                        risk in the sphere of each business or functional unit (first layer
                                                                        of control) and the corporate control of each risk (second
ORGANISATION, MISSION AND                                               layer). This ensures the vision and thus integral control of all
                                                                        risks incurred during the year.
FEATURES OF INTEGRAL CONTROL
                                                                      • Special attention is paid to the development of best practices
OF RISKS                                                                in the sphere of the financial industry, in order to be able to
                                                                        incorporate within Santander and at once any advances
The organisation of this function is part of the directorate
                                                                        deemed opportune.
general of integral control and internal validation of risk.
This function supports the group’s governance bodies in risk          • Both the information available as well as the resources that
management and control.                                                 grupo Santander assigns to controlling the various risks are
                                                                        optimised, avoiding overlapping.
Particular attention is paid to credit risk (including the risks of
concentration and counterparty); market risk (including liquidity
risk as well as structural risks of interest rates and exchange
rates); operational and technology risks and risk of compliance       METHODOLOGY AND TOOLS
and reputational risk.
                                                                      in order to systemise the function and adjust it to Santander’s
                                                                      specific needs, internal development of methodology and tools
integral control of risk is treated in three modules:
                                                                      to support it was completed. This makes application of the
                                                                      methodology traceable. The methodology and the tools are
Module 1. Ensure that the management and control systems of
                                                                      articulated through the three modules previously referred to for
the various risks inherent in grupo Santander’s activity meet the
                                                                      all risks treated:
most demanding criteria and the best practices observed in the
industry and/or required by regulators.
                                                                      Module 1. A guide of tests or reviews exists for each risk,
                                                                      divided in spheres of control (for example, corporate
Module 2. Ensure that senior management has at its disposal an
                                                                      governance, organisational structure, management systems,
integral vision of the profile of the various risks assumed and
                                                                      integration in management, technology environment,
that these risks are in line with the previously agreed appetite
                                                                      contingency plans and business continuity, etc).
for risks.
                                                                      Applying the tests and obtaining the relevant evidence which is
Module 3. Supervise appropriate compliance in time and form
                                                                      assessed and enables the parameters of control of the various
with the recommendations drawn up for risk management
                                                                      risks to be homogenised is done every 12 months. New tests are
matters following inspections by internal auditing and by the
                                                                      incorporated where needed. The support tool is the risk control
supervisors to whom Santander is subject.
                                                                      monitor, which is a repository of the results of each test and of
                                                                      their work papers. A half yearly review of the state of each risk is
integral control of risk supports the work of the risk committee,
                                                                      also carried out, monitoring the recommendations emanating
providing it with the best practices in risk management.
                                                                      from the annual report of integral control.


     ANNUAL REPORT 2010                                                                                                                 159
Module 2. Senior management is able to monitor integral            During 2010:
vision of the various risks assumed and their adjustment to
                                                                   a) The second cycle of reviewing the various risks was
the previously formulated risk appetites.
                                                                      completed in close contact with the corporate areas of
                                                                      control, contrasting and assessing the control and
Module 3. The SEgRE tool is used to track the
                                                                      management systems of these risks. improvements were
recommendations made by internal auditing and by the
                                                                      identified and made into recommendations – with their
supervisors regarding risk control and management and it also
                                                                      corresponding schedule for implementation agreed with the
includes the recommendations by integral control. Use of this
                                                                      areas – along with half yearly monitoring of the progress
tool is coordinated with the relevant risk control areas so that
                                                                      achieved in the recommendations made in 2009.
monitoring is optimised. The Bank of Spain can access these
tools if it so wishes.                                             b) The board and the executive committee were regularly
                                                                      informed and given an integral vision of all risks; and
                                                                   c) Work continued on extending the integral control of risks
                                                                      model to the group’s main units.

                                                                   We will now look at the group’s main risks: credit, market,
                                                                   operational and reputational.


160                                                                                                          ANNUAL REPORT 2010
3. cREDiT RiSk


INTRODUCTION TO THE TREATMENT                                        • Those under individualised management are assigned, mainly
                                                                       because of the risk assumed, a risk analyst. This category
OF CREDIT RISK                                                         includes the companies of wholesale banking, financial
                                                                       institutions and some of the companies of retail banking. Risk
credit risk is the possibility of losses stemming from the failure
                                                                       management is conducted through expert analysis backed up
of clients or counterparties to meet their financial obligations
                                                                       by tools to support decision making based on internal models
with the group.
                                                                       of risk assessment.
The group’s risks function is organised on the basis of the type     • Standardised: a customer who has not been specifically
of customer in order to distinguish during the risk management         assigned a risk analyst. This category includes individuals,
process companies under individualised management from                 individual businessmen and retail banking companies that are
standardised customers.                                                not segmented. Management of these risks is based on
                                                                       internal models of assessment and automatic decisions,
                                                                       complemented where the model does not go far enough or is
                                                                       not sufficiently precise by teams of analysts specialised in this
                                                                       type of risk.


     ANNUAL REPORT 2010                                                                                                              161
MAIN VOLUMES                                                                                              Spain was still the main unit as regards exposure to credit risk,
                                                                                                          although it share of the total was 3 p.p. less than at the end of
AND PERFORMANCE                                                                                           2009. Of note in the rest of Europe, which accounts for more
                                                                                                          than one-third of the credit exposure, is the presence in the Uk.
The group’s credit risk profile is characterised by diversified
                                                                                                          Overall, Europe, including Spain, accounted for 71% of the total
geographic distribution and predominantly retail banking
                                                                                                          exposure.
activity.
                                                                                                          in Latin America, which accounted for 23% of the exposure,
A. GLOBAL MAP OF CREDIT RISK, 2010                                                                        96% of the exposure to credit risk is classified as investment-
The table below sets out the global credit risk exposure in                                               grade.
nominal amounts (except for derivatives and repos exposure
which is expressed in equivalent credit) at December 31, 2010.                                            The US accounted for 6.5% of the group’s total credit exposure
                                                                                                          at the end of 2010.
growth in lending was moderate, due to reduced demand.
The exposure to credit risk increased 8.8%. Of this growth, 48%
was due to the exchange rate effect during the year of the main
currencies against the euro. The rest was concentrated in similar
percentages between outstanding and commitments to
customers and outstanding to credit entities.


GRUPO SANTANDER. GROSS EXPOSURE TO CREDIT RISK                                         Outstanding
Million euros                                                                                   to
                                        Out- commit-      Sovereign Private fixed        cred. ent.    commit- Derivatives
                                    standing ments to fixed income          income and central         ments to and Repos                                                  %/
                                to custumers customers   (exc. trading) (exc. trading)       banks credit entities   (EcR)                         Total        %     Dec. 09

Spain                                277,583           61,492             26,956              7,674           19,260        1,484   32,644     427,092     35.4%       -3.0%
Parent Bank                           168,070           45,097              16,210             4,892           14,059       1,210   26,568      276,105     22.9%          -1.6%
Banesto                                 79,842          10,154               7,980             1,198                3,204    273     5,905      108,556      9.0%          -5.7%
Others                                  29,671            6,241              2,765             1,584                1,997      1       171       42,430      3.5%          -4.9%
Rest of Europe                       320,158           42,791               6,022             9,163           34,224           1    16,167     428,525     35.5%           9.6%
germany                                 21,879              295                    0              111                694       0         6       22,984      1.9%          0.5%
Portugal                                23,062            7,831              5,515             3,517                1,466      1     1,880       43,272      3.6%      11.6%
Uk                                    242,864           32,154                  145            5,431           31,380          0    13,650      325,624     27.0%      11.7%
Others                                  32,353            2,511                 362               103                684       0       631       36,645      3.0%          -2.6%
Latin America                        136,084           63,200             25,602              3,745           31,544           6    10,926     271,106     22.5%      30.0%
Brazil                                  81,684          42,159              18,040             2,613           24,008          0     5,758      174,263     14.4%      32.0%
chile                                   27,397            7,929              1,764                948               2,313      6     2,938       43,296      3.6%      24.8%
Mexico                                  14,621          11,508               3,977                   2              3,431      0     1,822       35,361      2.9%      34.0%
Others                                  12,382            1,603              1,820                183               1,791      0       407       18,186      1.5%      18.5%
United States                          53,288          10,888               1,682             8,953             2,984          0       795      78,590       6.5%     16.8%
Rest of World                               747             102                    1                 1               158       0         0       1,009       0.1%     -33.9%
Total Group                          787,860         178,473              60,262             29,536           88,169        1,491   60,532   1,206,322      100%           8.8%
% of Total                              65,3%           14,8%                5,0%              2,4%                 7,3%    0,1%     5,0%      100,0%
% Change/Dec 09                           6,9%          19,6%                1,2%           -24,0%             43,9%        9,4%    -0,7%         8,8%

Data at December 31, 2010, drawn up on the basis of legal company criteria.
EcR (equivalent credit risk: net value of replacement plus the maximum potential value. includes mitigants)
Outstanding balances with customers including contingent risk and excluding repos (EUR 1,395 million) and other
customer credit assets (EUR 12,406 million).
Total fixed income excludes the trading portfolio and investments of third party takers of insurance.
Balances with credit institutions and central banks include contingent risks and exclude repos, trading portfolio
and other financial assets. Of the total, EUR 65,351 million are deposits in central banks.


162                                                                                                                                                   ANNUAL REPORT 2010
B. EVOLUTION OF THE VOLUMES IN 2010                                                                       Specific provisions for loan losses, net of recoveries, amounted
The evolution of non-performing loans and the cost of credit                                              to EUR 12,342 million, 1.56% of the average credit exposure
reflect the impact of the deterioration of the economic                                                   with customers (the year’s average lending plus financial
environment softened by prudent risk management which                                                     guarantees), down from 1.57% in 2009.
enabled, in general, these figures to remain lower than the
levels of competitors. As a result, the group maintains a
significant level of coverage and available generic provisions.

The group’s ratio of non-performing loans (NPLs) was 3.55%
at the end of 2010, up from 3.24% at the end of 2009 but
reflecting a slower pace of growth in this ratio in the last few
years. NPLs declined in Santander consumer Finance, Brazil and
Sovereign and rose in businesses in Spain. NPL coverage was
72.7% compared to 75.3% at the end of 2009.


GRUPO SANTANDER: RISK, NPLS, COVERAGE, PROVISIONS AND COST OF CREDIT
Million euros


                                           credit risk                                                                                     Spec. prov net
                                        with customers *                            NPL ratio                       coverage           recovered write-offs **        credit cost
                                            (million euros)                              %                                 %                (million euros)           (% of risk)3

                                           2010            2009               2010              2009              2010         2009      2010             2009      2010 2       2009 1

Continental Europe                   370,673         366,970                  4.34              3.64              71.4          76.6    6,190            5,084       1.62            1.39
Santander Branch Network 126,705                      129,099                  5.52              4.38              51.8         64.9    2,454             1,851      1.89            1.41
Banesto                                 86,213          86,681                 4.11              2.97              54.4         64.1    1,272                 737    1.52            0.89
Santander consumer Finance 67,820                       60,214                 4.95              5.39            128.4          96.8    1,884             2,005      2.85            3.38
Portugal                                32,265          34,501                 2.90              2.27              60.0         64.6      105                  95    0.30            0.27
United Kingdom                       244,707         238,215                  1.76              1.71              45.8          43.8      826            1,018       0.34            0.43
Latin America                        149,333         117,146                  4.11              4.25            103.6          105.2    4,758            5,053       3.53            4.44
Brazil                                  84,440          65,611                 4.91              5.27            100.5          99.2    3,703             3,537      4.93            5.88
Mexico                                  16,432          12,676                 1.84              1.84            214.9         264.4      469                 824    3.12            6.13
chile                                   28,858          21,384                 3.74              3.20              88.7         89.0      390                 402    1.57            1.98
Puerto Rico                               4,360           4,132              10.59               9.60              57.5         53.3      143                  89    3.22            1.99
colombia                                  2,275           1,719                1.56              1.83            199.6         187.5       15                  31    0.68            1.94
Argentina                                 4,097           2,936                1.69              2.60            149.1         141.0       26                  91    0.72            2.99
Sovereign Rest                         40,604          38,770                 4.61              5.35              75.4          62.5      479                 578    1.16
Total Group                          804,036         758,347                  3.55              3.24              72.7          75.3   12,342          11,760        1.56            1.57


Memo item
Spain                                283,424         284,307                  4.24              3.41              57.9          73.4    4,352            3,497       1.53            1.20


* includes gross customer loans, guarantees, documentary credits and retail segment derivatives (EcR EUR 2,375 million).
** Bad debts recovered.
1. Excludes Sovereign
2. Excludes the incorporation of Aig in Santander consumer Finance Poland.
3. (Specific allowances - recovery of bad debts)/ Total average credit risk.


         ANNUAL REPORT 2010                                                                                                                                                           163
C. DISTRIBUTION OF CREDIT RISK
The charts below show the diversification of Santander’s loans
by countries and customer segments. The group is diversified
and focused on its main markets.

grupo Santander’s profile is essentially retail (86.3% retail
banking), and most portfolios are products with a real
guarantee (e.g. mortgages).


DISTRIBUTION OF CREDIT RISK
%

By gEOgRAPHic AREA                                                By TyPE OF RiSk

                                Spain 33%


                                                                             Others
                                                                                2%
                                                                                                        individuals 57%
                                                                     Public sector
        Others 9%                                                             3%

      United States
               5%                                                global wholesale
                                                                           14%
        Portugal 4%                                Uk 30%


                Latin America 19 %                                                       companies and SMEs 24%


The distribution by geographic area and product of lending in
the segment of standardised risks is set out below.


STANDARDISED
%


By gEOgRAPHic AREA                                                By PRODUcT
                                            Uk 44%                                                  Mortgages 66%


                                                                 SMEs and others
       Santander                                                            8%
 consumer Finance
             14%
                                                                       cards 3%


        United States
                 3%
                                                Spain 18%
                                                                          consumer 23%
           Latin America 16%
                                     Portugal 4%


164                                                                                              ANNUAL REPORT 2010
3.3 METRICS AND                                                              B. PARAMETERS OF CREDIT RISK
                                                                             The assessment of a customer or operation, through ratings or
    MEASUREMENT TOOLS                                                        scorings, constitutes a judgement of the credit quality, which is
                                                                             quantified via probability of default (PD).
A. RATING TOOLS
The group has been using since 1993 its own models for
                                                                             As well as evaluating the customer, quantifying credit risk
assigning solvency and internal ratings, which measure the
                                                                             requires other parameters to be estimated such as exposure at
degree of risk of a client or transaction. Each rating or scoring
                                                                             default (EaD) and the percentage of EaD that might not be
corresponds to a certain probability of default or non-payment,
                                                                             recovered (loss given default or LgD). Other aspects are also
the result of the entity’s past experience, except for some
                                                                             included such as quantifying off-balance sheet exposures, which
termed low default portfolios. The group has around 200
                                                                             depend on the type of product, or analysis of expected
internal rating models for risk admission and monitoring.
                                                                             recoveries, related to the guarantees existing and other features
                                                                             of the operation: type of product, maturity, etc.
global rating tools are used for the segments of sovereign risk,
financial institutions and global wholesale banking. Their
                                                                             These factors comprise the main credit risk parameters. Their
management is centralised in the group, both for determining
                                                                             combination enables the probable or expected loss (EL) to be
their rating as well monitoring the risk. These tools assign a
                                                                             calculated. This loss is considered as one more cost of the
rating for each customer, based on balance sheet ratios or
                                                                             activity as it reflects the risk premium and should be
macroeconomic variables, and supplemented by the expert view
                                                                             incorporated into the price of operations.
of an analyst.
                                                                             The following charts show the distribution of failed consumer
in the case of companies and institutions under individualised
                                                                             loans and mortgages since 2001 on the basis of the percentage
management, the parent company of grupo Santander has
                                                                             recovered after discounting all the costs – including the financial
defined a single methodology for formulating a rating in each
                                                                             or of opportunity – of the recovery process.
country. The rating is determined by an automatic model which
reflects a first intervention by the analyst and which can or not
be later complemented. The automatic model determines the
rating in two phases, one quantitative and the other qualitative
based on a corrective questionnaire which enables the analyst
to modify the automatic scoring by a maximum of ±2 points of
rating. The quantitative rating is determined by analysing the
credit performance of a sample of customers and the correlation              SPAIN-PARENT BANK. MORTGAGES
with their financial statements. The questionnaire has 24                    Distribution of operations by the percentage recovered
questions divided into six areas of assessment. The automatic                       70%
rating (quantitative +corrective questionnaire) can be changed
                                                                                    60%
by an analyst by writing over it or by using a manual assessment
model.                                                                              50%
                                                                    % operations


The ratings accorded to customers are regularly reviewed,                           40%
incorporating new financial information available and the                           30%
experience in the development of the banking relation. The
regularity of the reviews increases in the case of clients who                      20%
reach certain levels in the automatic warning systems and in                        10%
those classified as special watch. The rating tools are also
reviewed so that their accuracy can be fine-tuned.                                  0%
                                                                                                  >10%&


                                                                                                          >20%&


                                                                                                                  >30%&


                                                                                                                           >40%&


                                                                                                                                   >50%&


                                                                                                                                           >60%&


                                                                                                                                                   >70%&


                                                                                                                                                           >80%&
                                                                                          <=10%


                                                                                                  <=20%


                                                                                                          <=30%


                                                                                                                  <=40%


                                                                                                                           <=50%


                                                                                                                                   <=60%


                                                                                                                                           <=70%


                                                                                                                                                   <=80%


                                                                                                                                                           <=90%

                                                                                                                                                                   >90%
During 2010 the quantitative model for rating wholesale
banking was adjusted and new expert rating models developed
                                                                                                                          % recovered
for funds, fund mangers and leveraged buy outs (LBOs).

in the case of standardised risks, both for transactions with                SPAIN- PARENT BANK. CONSUMER-RETAIL
                                                                             Distribution of operations by the percentage recovered
companies as well as individuals, there are scoring tools which
automatically assess the operations.                                                70%

                                                                                    60%
These admission systems are complemented by performance
assessment models which enable the risk assumed to be better                        50%
                                                                     % operations


predicted. They are used for both preventative activities as well
as sales.                                                                           40%

                                                                                    30%

                                                                                    20%

                                                                                    10%

                                                                                     0%
                                                                                                  >10%&


                                                                                                          >20%&


                                                                                                                  >30%&


                                                                                                                           >40%&


                                                                                                                                   >50%&


                                                                                                                                           >60%&


                                                                                                                                                   >70%&


                                                                                                                                                           >80%&
                                                                                          <=10%


                                                                                                  <=20%


                                                                                                          <=30%


                                                                                                                  <=40%


                                                                                                                           <=50%


                                                                                                                                   <=60%


                                                                                                                                           <=70%


                                                                                                                                                   <=80%


                                                                                                                                                           <=90%

                                                                                                                                                                   >90%


                                                                                                                          % recovered


     ANNUAL REPORT 2010                                                                                                                                            165
The risk parameters also calculate the regulatory capital in          C. MASTER SCALE OF GLOBAL RATINGS
accordance with the rules of the new Basel capital Accord (BiS        The following tables are used to calculate regulatory capital.
ii). The regulatory capital is the difference between the             They assign a PD on the basis of the internal rating, with a
unexpected and the expected loss.                                     minimum value of 0.03%.

The unexpected loss is the basis for calculating the capital and      These PDs are applied uniformly throughout the group in
makes reference to a very high level of loss, but not very            accordance with the global management of these portfolios.
probable, not considered recurrent and which must be met              As can be seen, the PD assigned to the internal rating is not
with equity.                                                          exactly equal for a same rating in both portfolios, although it
                                                                      is very similar in the tranches where most of the exposure is
in portfolios where the internal experience of defaults is scant,     concentrated (i.e. in tranches of rating of more than six).
such as banks, sovereigns or global wholesale banking,
estimates of the parameters come from alternative sources:
market prices or studies by external agencies which draw on the
shared experience of a sufficient number of institutions. These       REGULATORY CAPITAL
portfolios are called low default portfolios.
                                                                                                               PD

For the rest of portfolios, estimates are based on the
institution’s internal experience. The PD is calculated by              internal         Wholesale
observing NPL entries and putting them in relation to the final           rating          Banking               Banks          Sovereigns
rating assigned to the customer or with the scoring assigned to
                                                                      8.5 to 9.3           0.030%             0.030%             0.030%
the operations.
                                                                      8.0 to 8.5           0.049%             0.039%             0.045%
The LgD calculation is based on observing the recovery process        7.5 to 8.0           0.077%             0.066%             0.072%
of operations not fulfilled, taking into account not only the                              0.123%             0.111%
                                                                      7.0 to 7.5                                                 0.115%
revenues and costs associated with this process, but also the
moment when they are produced and the indirect costs incurred         6.5 to 7.0           0.195%             0.186%             0.184%
in recovery activity.                                                 6.0 to 6.5           0.311%             0.311%             0.293%
                                                                      5.5 to 6.0           0.494%             0.521%             0.468%
The estimation of the EaD comes from comparing the use of the
                                                                      5.0 to 5.5           0.786%             0.874%             0.746%
lines committed at the moment of default and a normal
situation, in order to identify the real consumption of the lines     4.5 to 5.0           1.251%             1.465%             1.189%
at the time of default.                                               4.0 to 4.5           1.989%             2.456%             1.896%
                                                                      3.5 to 4.0           3.163%             4.117%             3.022%
The parameters estimated for global portfolios are the same for
                                                                      3.0 to 3.5           5.031%             6.901%             4.818%
all the group’s units. A financial institution with a rating of 8.5
will have the same PD regardless of the unit in which its             2.5 to 3.0           8.002%            11.569%             7.681%
exposure is recorded. On the other hand, retail portfolios have       2.0 to 2.5          12.727%            19.393%            12.246%
specific scoring systems in each unit of the group. This requires                         20.241%            32.509%
                                                                      1.5 to 2.0                                                19.524%
separate estimates and specific assignment in each case.
                                                                          < 1.5           32.193%            54.496%            31.126%
The parameters are then assigned to the operations present
in the balance sheet of units in order to calculate the
expected losses and the capital requirements associated with
their exposure.


166                                                                                                              ANNUAL REPORT 2010
D. DISTRIBUTION OF EAD AND                                                                          3.4. LOSS OBSERVED:
EXPECTED LOSS (EL) ASSOCIATED
The table below sets out the distribution by segments of the                                             MEASUREMENTS OF CREDIT COST
outstanding credit exposure to customers in terms of EaD. PD,
                                                                                                    As well as using these advanced models, other usual measures
LgD and EL. Approximately 77% of total risk with clients
                                                                                                    are employed which provide prudent and effective management
(excluding sovereign, counterparty risks and other assets)
                                                                                                    of credit risk on the basis of the loss observed.
corresponds to companies, SMEs and loans to individuals,
underlining the retail focus of business and of Santander’s risks.
                                                                                                    grupo Santander’s cost of credit is measured by various means:
The expected loss from customer exposure is 1.39% (1.10% for
                                                                                                    change in net entries (final doubtful loans –initial doubtful loans
the group’s total credit exposure), which can be considered as a
                                                                                                    +write offs –recovered write offs), net loan-loss provisions
medium-to-low risk profile.
                                                                                                    (net specific provisions – recovered write-offs) and net write-offs
                                                                                                    (write offs –recovered write-offs).

SEGMENTATION OF CREDIT RISK EXPOSURE                                                                GRUPO SANTANDER’S TOTAL COST OF CREDIT
Million euros and %                                                                                 % of average portfolio
                                                                 Average Average
                                            EAD    1
                                                               %      PD    LgD                EL      Average 2002-2010
                                                                                                       change in net entries: 0,89%
Sovereign debt                          160,764         15.38% 0.14% 10.64%                 0.01%
                                                                                                       Net loan-loss provisions: 0,59%
counterparty                              63,264          6.05% 0.41% 74.94%                0.31%      Net write-offs: 0,76%
Public sector                             12,539          1.20% 0.73% 12.01%                0.09%
                                                                                                    2.5%
corporate                               154,725         14.80% 0.90% 37.40%                 0.34%
                                                                                                    2.2%
SMEs                                    172,547         16.51% 5.79% 31.50%                 1.83%
                                                                                                    1.9%
Mortgages (individuals)                 312,865         29.93% 3.20%                7.44%   0.24%
consumer loans                          119,921         11.47% 8.69% 54.57%                 4.74%   1.6%

credit cards of individuals               31,193          2.98% 5.46% 63.74%                3.48%   1.3%
Other assets                              17,361          1.66% 1.83% 28.09%                0.51%   1.0%
Memorandum item customers2 803,791                      76.90% 4.18% 33.31%                 1.39%
                                                                                                    0.7%
Total                               1,045,180 100.00% 3.29% 33.44% 1.10%
                                                                                                    0.4%
Data at December 2010
1. Excluding doubtful loans                                                                         0.1%
2. Excluding sovereign debt, banks and other financial entities and other assets.
                                                                                                            Dec. 02 Dec. 03 Dec. 04 Dec. 05 Dec. 06 Dec. 07 Dec. 08 Dec. 09 Dec. 10
                                                                                                    The data for 2009 reflects the incorporation of A&L and in 2010 Sovereign.


                                                                                                    The three approaches measure the same reality and,
                                                                                                    consequently, converge in the long term although they
                                                                                                    represent successive moments in credit cost measurement:
                                                                                                    flows of non-performing loans (changes in net entries) coverage
                                                                                                    of doubtful loans (net loan-loss provisions, NLLPs) and becoming
                                                                                                    write offs (net write-offs), respectively. And this without
                                                                                                    detriment that in the long term and within the same economic
                                                                                                    cycle, the three show differences at certain times, particularly
                                                                                                    significant at the start of a change of cycle. These differences
                                                                                                    are due to the various moments at which the losses are
                                                                                                    calculated, which are basically determined by accounting rules
                                                                                                    (for example, mortgages have a calendar of coverage and
                                                                                                    become write-offs more slowly than consumer loans). in
                                                                                                    addition, the analysis can be complicated by changes in the
                                                                                                    policy of coverage and entry into write offs, composition of
                                                                                                    the portfolio, doubtful loans of entities acquired, changes in
                                                                                                    accounting rules, sale of portfolios, etc.


        ANNUAL REPORT 2010                                                                                                                                                       167
The following charts reflect the cost of grupo Santander’s credit
risk in its main areas of activity in 2010 and the comparison with
prior years, measured in various ways:


NET ENTRIES
change in doubtful loans plus net write-offs
(% of average balances)
                                                                                                                                                                                     6.25
   2006             2007            2008            2009            2010
                                                                                                                                                                                            4.67

                                                                                                                                                                       2.61 2.85
                       2.35
                              1.73
               1.62                                       1.67 1.93 1.49                                                                              1.41      1.57
                                                                                                           1.34                        1.17 1.37 1.36
       0.70                                                                                                        0.53        0.69
0.40                                       0.16 0.34                                 0.21 0.23 0.37
              group                                      Spain                                       Uk                                Rest of Europe                   Latin America


NET LOAN-LOSS PROVISIONS
Net specific provisions less recovered write offs                                                                                                                                    4.91
(% of average balances)

   2006             2007            2008            2009            2010
                                                                                                                                                                              3.70          3.86


                                                                                                                                                                       2.28
                       1.57 1.56                                        1.51
               1.16                                              1.18                                                                               0.95 1.18   1.60
                                                          0.73                                             0.55 0.44                         0.65
0.32
       0.50                                                                                                                     0.43 0.46
                                           0.06 0.15                                 0.20 0.23 0.25

              group                                      Spain                                       Uk                                Rest of Europe                   Latin America

NET WRITE-OFFS
Write-offs less recovery of write-offs
(% of average balances)                                                                                                                                                              4.56

                                                                                                                                                                                            3.68
   2006             2007            2008            2009            2010

                                                                                                                                                                              2.44
                                                                                                                                                                1.77
                                                                                                                                                                       1.67
                       1.17 1.23
               0.72                                                     0.73                                                                           0.91
       0.43                                                      0.55                                  0.52 0.47              0.45 0.43      0.64
0.26                                       0.08 0.16 0.20                        0.18 0.20 0.17                                         0.36

              group                                      Spain                                  Uk                                    Rest of Europe                    Latin America

Note: Data drawn up in accordance with legal company criteria. The figures for 2010 reflect the incorporation of Sovereign.
2008 excludes A&L and 2009 excludes Sovereign and venezuela


The year-on-year change includes the exchange-rate impact
which for Latin America was around -44.1% in net entries, 2.2%
in net provisions and -17.2% in net write offs.

The general trend over the past few years has been to maintain
the cost of Santander’s credit at low levels. in 2010, there was a
small decline of one basis point in the cost of credit as a result
of the still significant deterioration of the economic environment
and the mix of retail portfolios which, although with a higher
expected loss, have higher levels of direct and indirect
profitability and a more predictable nature of risk. These
portfolios performed well during the year, particularly in Latin
America, which contained the amount of provisions made.


168                                                                                                                                                              ANNUAL REPORT 2010
3.5 CREDIT RISK CYCLE                                                    B. RISK STUDY AND PROCESS OF CREDIT RATING
                                                                         The study of risk is obviously a prior requirement for authorising
Risk management consists of identifying, measuring, analysing,           customer operations by the group. it consists of analysing the
controlling, negotiating and deciding the risks incurred by the          capacity of the customer to meet their contractual obligations
group’s operations. The process involves risk takers and senior          with the Bank. This entails analysing the customer’s credit
management, as well as the risk areas.                                   quality, risk operations, solvency and return in accordance with
                                                                         the risk assumed.
The process emanates from senior management, via the board
of directors and the risk committee; they set the risk policies and      The risk study is carried out every time there is a new customer
procedures, the limits and delegating of powers, and approve             or operation or with a pre-established regularity, depending on
and supervise the framework of the risks function.                       the segment. in addition, the rating is studied and reviewed
                                                                         every time there is an alert or something that affects the
The risk cycle has three phases: pre-sale, sale and after sale:          customer/operation.
• Pre-sale: this includes the planning and setting of objectives,
                                                                         C. DECISIONS ON OPERATIONS
  determining the appetite for risk, approving new products,
                                                                         The purpose of the decision-making process is to analyse and
  studying the risk and rating loans, and establishing limits.
                                                                         resolve operations, taking into consideration both the risk
• Sale: this covers the phase of decision-making both for                appetite as well as those elements of the operation that are
  operations under pre-classification as well as one-off                 relevant in the search for the balance between risk and return.
  transactions.
                                                                         The group has been using RORAc methodology (return on risk
• After sale: monitoring, measurement, control and recovery
                                                                         adjusted capital) since 1993 to analyse and set prices for
  management.
                                                                         operations and businesses.

A. PLANNING AND SETTING LIMITS                                           D. MONITORING
Setting limits is a dynamic process which identifies the group’s         As well as the tasks carried out by the internal auditing division,
risk appetite by discussing business proposals and the opinion           the directorate general of risks, through local and global teams,
of risks.                                                                controls credit quality by monitoring the risks and has the
                                                                         resources and specific people to do it.
The global plan of limits, the document drawn up on the basis
of consensus which provides complete management of the                   The monitoring is based on a continuous process of permanent
balance sheet and of the inherent risks, establishes the risk            observation, which enables incidents to be detected in advance
appetite in the various factors.                                         in the evolution of risk, operations, customers, and their
                                                                         environment in order to take steps to mitigate them. The
The limits are based on two structures: customers/segments               monitoring is conducted on the basis of customer
and products.                                                            segmentation.

The most basic level in individualised management is the                 The group has a system called companies in special watch
customer and when certain features are present - generally of            (FEvE) which identifies four levels on the basis of the degree of
relative importance – an individual limit (pre-classification) is set.   concern arising from the circumstances observed (extinguish,
                                                                         secure, reduce, monitor). The inclusion of a company in FEvE
A pre-classification model based on a system for measuring and           does not mean there have been defaults, but rather the
monitoring economic capital is used for large corporate groups.          advisability of adopting a specific policy toward that company
A more simplified version is used for those companies which              and establishing the person and time frame for it. clients in
meet certain requirements (high knowledge, rating, etc).                 FEvE are reviewed at least every six months, and every quarter
                                                                         for the most serious cases. A company can end up in special
in the sphere of standardised risk, the planning and setting of          watch as a result of monitoring, a review conducted by internal
limits is done through credit management programmes (cMPs),              auditing, a decision of the person responsible for the company
a document reached by consensus between the business and                 or the entry into functioning of the system established for
risk areas and approved by the risk committee or committees              automatic warnings.
delegated by it. The cMPs set out the expected results of
business in terms of risk and return, as well as the limits to           Ratings are reviewed at least every year, but if weaknesses are
which activity is subject and management of the associated               detected, or on the basis of the rating, it is done more regularly.
risks.
                                                                         As regards the risks of standardised clients, the main indicators
                                                                         are monitored in order to detect shifts in the performance of the
                                                                         loan portfolio with respect to the forecasts made in the credit
                                                                         management programmes.


      ANNUAL REPORT 2010                                                                                                                  169
FEVE DECEMBER 2010                                                                                           in accordance with Bank of Spain rules, the group regards as
Million euros                                                                                                doubtful loans those which have not been serviced for more
                                                                                                             than 90 days and includes the total debt of the customer when
                                                                                                  Total      the unpaid part represents more than 25% of it or when pre-
                                      Extinguish         Secure Reduce Monitor                    FEVE
                                                                                                             judicial actions are taken. Also considered as doubtful loans are
Retail banking Spain                        5,148            379      12,975 11,582 30,084                   those which, without entering into non-compliance, have
Banesto                                     8,499            460        2,720 11,116 22,795                  reasonable doubts of being fully repaid.
Portugal                                       339             69          920       1,926       3,236
                                                                                                             The non-performing loan (NPL) ratio in Spain was 4.24%,
United kingdom                                 236             14          933       2,318       3,502       concentrated in those sectors which were more affected by the
Sovereign                                   2,640            231           742       1,992       5,605       economic downturn. This ratio is higher than in 2009, but is on
Latin America                               1,262            425        1,657        6,223       9,567       a slower growth trend as the NPL ratios of a high percentage
                                                                                                             of credit portfolios in Spain were stable during 2010.
Total                                    18,124           1,577 19,930 35,157 74,789

                                                                                                             The NPL ratio in Spain is well below the aggregate of
Note: 2010 shows the application of the FEvE tool in Sovereign. The classification of risk in FEvE is
independent in each institution and responds to the various criteria for classification of these risks and
                                                                                                             commercial banks as a whole, according to the Bank of Spain,
management of them on the basis of the category in which they are classified.                                underscoring the group’s traditionally prudent risk management
                                                                                                             criteria.

Credit exposure in Spain                                                                                     Total provisions for covering the possible loss of these risks
                                                                                                             represent coverage of 58%.
a. General view of the portfolio
grupo Santander’s credit portfolio at the end of 2010 stood at                                               in addition, and in line with the Bank of Spain’s rules and
EUR 236,000 million. if we mainly add to this figure guarantees                                              indications, loans classified as substandard are those which,
and documentary credits the total credit risk of Santander’s                                                 while being up to date on payments and with no reason to be
businesses in Spain amounted to EUR 283,424 million, 35% of                                                  classified as doubtful, shows some weakness which could lead
the group’s total and with an appropriate level of                                                           to non-payments and losses, as they involve the weakest
diversification, both by product as well as customer segment.                                                customers from certain collectives or sectors affected by
The credit risk of commercial networks of the main businesses in                                             extraordinary circumstances of greater risk. This category has
Spain (Santander Branch Network, Banesto, Banif and Santander                                                EUR 10,808 million of classified risks.
consumer) accounted for 26% of the group’s total, distributed
as follows:

SEGMENTATION OF THE CREDIT RISK OF COMMERCIAL                                                                MONTHLY EVOLUTION OF NON-PERFORMING LOANS 2008-2010
NETWORKS IN SPAIN                                                                                            %
%
                                                                          comps. indiv.man.                      Banks (total system)
                                                                          44%                                    Total group in Spain
        Other segments                                                                                        6.00
                                                                                                                                                                                                                                             5.83
                  4%                                                                                          5.50                                                                                                   5.34
                                                                                                              5.00                                                                  5.02
        institutions 7%
            Standardised                                                                                      4.50
        companies 4%                                                                                          4.00                                  4.02
                    Other                                                                                                                                                                                                                           4.24
                                                                                                              3.50
         (individuals) 2%                                                                                              2.80                                                                                          3.71
                                                                                                              3.00
                 consumer 6%                                                                                                                                                        3.41
                                                                   Mortgages 33%                              2.50
                                                                                                              2.00
                                                                                                                                                    2.72
                                                                                                              1.50     1.95
includes the commercial networks of the main businesses in Spain (Santander Retail Banking, Banesto,         1.00
Banif and Santander consumer).
                                                                                                             0.50
                                                                                                                      Dec. 08

                                                                                                                                Feb. 09

                                                                                                                                          Apr. 09

                                                                                                                                                      Jun. 09

                                                                                                                                                                Aug. 09

                                                                                                                                                                          Oct. 09

                                                                                                                                                                                     Dec. 09

                                                                                                                                                                                               Feb. 10

                                                                                                                                                                                                           Apr. 10

                                                                                                                                                                                                                      Jun. 10

                                                                                                                                                                                                                                Aug. 10

                                                                                                                                                                                                                                          Oct. 10

                                                                                                                                                                                                                                                       Dec. 10


170                                                                                                                                                                                                      ANNUAL REPORT 2010
b. Analysis of the mortgage portfolio of                                 LOAN TO VALUE
   individual customers
                                                                            LTv < 50%                                                                       51%

in line with the Bank of Spain’s guidelines for greater                     50% < LTv < 80%
                                                                                                                   2%
transparency in information for the market regarding property,              80% < LTv < 100%
the table below sets out the loans granted to households to buy             LTv > 100%
homes by the main businesses in Spain. This portfolio, one of                                               13%
the main ones, stood at EUR 61,936 million at the end of 2010
(26% of lending in Spain). Of this, EUR 61,387 million had
mortgage guarantees.

LOANS TO HOUSEHOLDS FOR THE ACQUISITION OF PROPERTY                                                                                     34%
Million euros
                                     gross amount   Of which: doubtful   AFFORDABILITY RATE
Loans to acquire property                  61,936               1,388    Average 29%
                                                                                                                                                            52%
   Without mortgage guarantee                 549                  30       TE < 30%
   With mortgage guarantee                 61,387               1,358       30% < TE < 40%
                                                                            TE > 40%
                                                                                                              23%
The NPL ratio of the portfolio with mortgage guarantee improved
notably at the end of 2010, in a negative macroeconomic
environment, to 2.2% from 2.5% a year earlier.

The portfolio of mortgages for property in Spain held its
medium-low risk profile and had limited expectations of further                                                                         25%
deterioration:
                                                                         Note: The affordability rates does not include Banif.
• All mortgages pay principal from the very first day of                 Loan to value: relation between the amount of the loan and the appraised value of the mortgaged
  the operation.                                                         property. On the basis of management criteria, the average LTv of the portfolio of mortgages for
                                                                         individuals to buy homes was 50.5%
• The usual practice is to repay it ahead of time and so                 Affordability rate: relation between the annual payments and the customer’s net income.
  the average life of the operation is well below that of
  the contract.
• The borrower responds with all assets and not just the
  property.
• Most mortgages have variable interest rates with spreads
  over Euribor.                                                          Despite the economy’s situation and its gradual deterioration
                                                                         during 2010, which reduced the demand for loans in 2009
• High quality of collateral: 94% of the portfolio is financing
                                                                         and in 2010, the measures taken in admission produced an
  for the first residence.
                                                                         increasingly better evolution of vintages. For new loans between
• 85% of the portfolio has a LTv of less than 80%.                       2008 and 2010 in the Santander Branch Network in Spain,
                                                                         the maturity of vintages is shown below:
• The average affordability rate remained at close to 29%.


LOAN TO VALUE RANGES. TOTAL                                              EVOLUTION OF THE DEFAULT RATE BY THE NUMBER
Million euros                                                            OF OPERATIONS BY VINTAGES
                LTv < 50% 50% < LTv < 80% 80% < LTv < 100% LTv > 100%    5,0%

gross amount       20,583         31,519            8,299         986
                                                                         4,0%
   Of which: doubtful 247            638              440          33
                                                                         3,0%


                                                                         2,0%
                                                                                                                                                                     2008-1
                                                                                                                                                               2008-2 2.55%
                                                                         1,0%                                                                           2008-3 1.53%
                                                                                                                                                        1.15%
                                                                                                                    2009-4       2009-2 2009-1 2008-4
                                                                                     2010-4 2010-3 2010-2 2010-1                        0.44% 0.60%
                                                                                     0.01% 0.00% 0.03% 0.09%        0.17% 2009-3 0.29%
                                                                         0,0%                                              0.10%

                                                                                         5         10          15          20          25          30           35            40


      ANNUAL REPORT 2010                                                                                                                                                 171
c. Financing provided for construction                                         A particularly important product in the real estate promotion
   and real estate development                                                 portfolio is mortgage loans to real estate developers. At the end
Lending to these sectors, in line with the Bank of Spain’s                     of 2010, this amounted to EUR 9,854 million and represented
guidelines regarding classification by purpose, amounted in                    around 1.3% of grupo Santander’s total credit portfolio. The
Spain to EUR 27,334 million (3.7% of the group’s total lending),               exposure to this product was 9.3% less than in 2009 and in
12% lower than in 2009 and 27% below 2008 using like-for-                      2010 it dropped a further 20%.
like criteria. This means a market share of around 10%,
substantially lower than that of the group’s combined                          At the end of 2010, this portfolio of loans had a larger number
businesses in Spain (15%).                                                     of customers, with a low degree of concentration and an
                                                                               appropriate level of guarantees and coverage.
The reduction in risk was largely due to a strict policy in
admitting new loans with the consequent amortisation of the                    The situation was as follows:
credit operations of the portfolio outstanding and proactive
                                                                               • Developments completed and with the final certificate
management of existing risks.
                                                                                 of work: 72.5% of outstanding risk.
The non-performing loan ratio of this portfolio at the end of                  • Developments more than 80% completed:
2010 was 17%, underscoring the deterioration in this sector.                     12.8% of outstanding risk.
This is higher than the rest of the segments of the portfolio in
Spain and shows the group’s conservative policy of anticipation                • Developments between 50% and 80% completed:
in classifying bad loans. More than 75% of the EUR 9,568                         3.1% of outstanding risk.
million classified as doubtful and sub-standard loans was up-to-               • Developments less than 50% completed: 11.5%.
date with payments. coverage with specific provisions was
28%, in accordance with the regulations.                                       Furthermore, close to 85% of this financing of real estate
                                                                               developments is totally completed or close to it, having
                                                                               overcome the risk of construction.
FINANCING FOR CONSTRUCTION AND REAL ESTATE
DEVELOPMENT: DOUBTFUL AND SUBSTANDARD LOANS                                    Policies and strategies established for
Million euros                                                                  management of these risks
                                               Risk            coverage        The policies for managing this portfolio, periodically reviewed
                                        Amount          Amount            %
                                                                               and approved by the group’s senior management, are focused
                                                                               on reducing and securing the current exposure, without
Doubtful                                  4,636           1,321           29   overlooking new business identified as viable.
Substandard                               4,932             569           12
generic coverage                                            768                in order to tend to the management of this credit exposure,
                                                                               grupo Santander has specialised teams that not only form part
Total                                    9,568            2,658           28
                                                                               of the risk areas, but also supplement its management and
                                                                               cover the whole life cycle of these operations: their commercial
                                                                               management, juridical treatment, the eventuality of recovery
A large part of the exposure to the construction and real estate               management, etc.
activity sectors are loans with mortgage guarantee (EUR 21,210
million, 78% of the portfolio). Their distribution is shown below.             Anticipative management of these risks has enabled the group
                                                                               to significantly reduce its exposure (by 27% between 2008 and
                                                                               2010), with a granular portfolio, geographically diversified and
CREDIT EXPOSURE TO THE CONSTRUCTION                                            where financing of second homes accounts for a very small
AND REAL ESTATE DEVELOPMENT SECTOR
Million euros                                                                  proportion of the portfolio. Mortgages for land that is not
                                                                               developed accounts for only 4.2% of the exposure to land;
                                                  Finished buildings           the rest is already classified as developed land or which can
                                                  (12,709) 47%                 be developed.
Total: 27,334 mill.
                                                                               in the case of property financing projects where the work is
      Land that can be                                                         already completed, the significant reduction in the exposure
            developed                                                          (-20% en 2010) is backed by various actions. As well the
          (2,023) 7%
                                                                               already existing specialised channels, campaigns were
         Developed land                                                        conducted supported by specific managers for this function
           3,678) 13%                                                          who, in the case of the Santander Branch Network, were
                                                                               directly supervised by the business area of recoveries, where
                                                  Without mortgage             direct management of them with real estate promoters and
                Buildings under                   guarantee
                   construction   Other land      (6,124) 22%                  buyers, applying criteria of reducing sale prices and adapting
                  (2,548) 10%     (252) 1%                                     the financing conditions to buyers’ needs, enabled us to make
                                                                               subrogations of the already existing loans. These subrogations
                                                                               enable risk to be diversified in a business segment that has a
                                                                               much lower non-performing loan ratio.


172                                                                                                                       ANNUAL REPORT 2010
The admission processes are managed by specialised teams who          d. Real estate acquired and foreclosed
work in direct coordination with the commercial teams. The            One of the mechanisms used in Spain to manage risk efficiently
policies and criteria are clearly defined:                            is the purchase and foreclosure of real estate assets. The net
                                                                      balance of these assets at the end of 2010 was EUR 5,195
• Promoters with a comfortable solvency profile and with a            million (gross amount of EUR 7,509 million), with coverage
  proven track record in the market.                                  of 31% that was above the minimum required by the Bank of
• Strict criteria of the parameters inherent in operations:           Spain and in line with the group’s usual criteria of prudence.
  exclusive financing for the cost of construction, high
  percentages of accredited sales, first residence financing, etc.
                                                                      PROPERTIES ACQUIRED AND FORECLOSED
• Support for officially protected homes with percentages of          Billion euros
  accredited sales.                                                      coverage                                               7.5
• Financing of restricted land, tied to the re-establishment of the      Net volume
                                                                                                                   6.5
  adequate level of coverage of already existing financing or                                                                    2.3
  increase in guarantees.                                                                                           2.0
                                                                                                4.8
in addition to permanent control by the group’s risk monitoring                                 0.5
teams, there is a technical unit specialised in monitoring and                                  4.3                 4.5          5.2
controlling this portfolio with regard to the progress in the
work, compliance with planning and control of sales, as well as
validation and control of the disbursement of certifications.
Santander has specific tools created for this function. All the
mortgage loan distributions, disposal of amounts for all
concepts, changes to the grace period are authorised on a                                     2008                 2009         2010
centralised basis.
                                                                      PROPERTIES ACQUIRED AND FORECLOSED:
in the case of projects in the phase of construction that show        COVERAGE RATIO


                                                                                                                     31%
some kind of problem, the criterion followed is to guarantee


                                                                                                             31%
completion of the work in order to have finished buildings for
sale in the market. in order to achieve this, each project is
individually analysed so that for each case the most effective
series of measures are adopted (structures of payment to
suppliers that guarantee completion of the work, establishment                                       10%
of specific calendars, etc).

Those cases that require analysis of some type of restructuring
of the exposure are carried out with the joint participation of
the risk and recoveries areas, anticipating non-payment                                         2008 2009 2010
situations, with criteria centred on providing projects with a
payments structure that enables the work to be completed.             The group views acquisition as an efficient tool for resolving
These operations are authorised on a centralised basis and by         unpaid loans as opposed to initiating legal proceedings for
expert teams who ensure that the strictest criteria are applied in    the following reasons:
accordance with the group’s prudent risk management. Possible         • The immediate availability of these assets as against the
losses are recognised when identified, classifying the positions        greater duration of legal processes.
without waiting for non-payment according to the regulation           • cost savings.
established by the Bank of Spain, and with the corresponding
provision that covers the expected loss of these positions.           • it facilitates the viability of companies as liquidity is injected
                                                                        into their activity.
Real estate assets on the balance sheet are managed by                • Reduction in the possible loss of value in the loans of
companies specialised in selling property (Altamira Santander           these clients.
Real Estate and Promodomus) and complemented by the                   • Reduction in the exposure and of the expected loss.
structure of the commercial network. Sales are conducted with
price reduction levels in line with the market’s situation.           The table below sets out the situation at the end of 2010
                                                                      regarding acquired and foreclosed properties by the main
                                                                      businesses in Spain:

                                                                      SPAIN: PROPERTIES ACQUIRED AND FORECLOSED
                                                                      Million euros
                                                                                                           gross amount          Allowance   Net amount
                                                                      Finished buildings                          3,098                25%        2,339
                                                                      Buildings under construction                        564          25%         425
                                                                      Developed land                                 2,307             35%        1,506
                                                                      Land that can be developed                     1,308             40%         787
                                                                      Other land                                          232          40%         138
                                                                      Total                                         7,509              31%       5,195


     ANNUAL REPORT 2010                                                                                                                             173
The stock of this portfolio was 44% lower in 2010 than in 2009,         in addition to close monitoring of these portfolios by the
due to the combination of lower gross entries of acquired               group’s risk management teams, both the various supervisory
properties (-20%) and a significant increase in sales (+31%).           authorities to which the group is subject as well as internal
The property assets are managed by companies specialised in             auditing pay particular attention to controlling and adequately
sales and aided by the structure of the commercial network              assessing the refinanced portfolios.
which enables the assets to be placed in the market with
acceptable levels of losses.                                            Refinancing does not mean the release of provisions,
                                                                        maintaining the classification of risk in bad loans, unless:
SPAIN: PROPERTIES ACQUIRED AND FORECLOSED
Billion euros                                                           • They meet the criteria in the regulations based on Bank of
                                      2010        2009
                                                                          Spain circulars (payment of ordinary interest pending and,
gross entries                           2.1         2.5          -20%     in any case, contribution of new effective guarantees or a
Sales                                   1.1         0.8          31%      reasonable certainty of payment capacity).
Difference                              1.0         1.7          -44%   • They fulfil the precautions which under prudent criteria are set
                                                                          out in the group’s corporate policy (sustained payment for
Of the total amount, 41% are completed buildings available for            between 3 and 12 months, on the basis of the operation’s
sale and of the total land assets 95% is developed or can be              features and the type of guarantees).
developed, with an appropriate coverage level of 37%.
                                                                        in the case of Spain (Santander networks plus Banesto),
The information mentioned in points b, c and d under the                the balance at the end of 2010 of commercial refinancing of
specific formats set out by the Bank of Spain in its note of            positions previously recorded as doubtful loans was EUR 2,258
January 18, 2011 is reflected in note 54 of the audited report          million, of which EUR 1,675 million were company operations
and consolidated financial accounts that form part of Banco             and EUR 583 million with individuals.
Santander’s 2010 annual report.
                                                                        Of the total refinancing, EUR 1,313 million met the
e. Refinancing                                                          reclassification requirements set by the Bank of Spain in
Refinancing is one of the management tools to adjust maturity           appendix ix of its circular 4/2004.
structures of principal and interest payments to the new
payment capacity of customers.                                          At the end of 2010, a high percentage (84%) of refinancing was
                                                                        in a normal situation as regards compliance with obligations.
At grupo Santander, these operations are restricted, on the
basis of rigorous and selective criteria, to:                           Analysis of the UK’s mortgage portfolio
                                                                        As well as the risk portfolio in Spain, of note in standardised
• viable operations, which in origin do not have very severe            risks and because of its importance in grupo Santander's total
  deterioration;                                                        lending is the Uk mortgage portfolio.
• where the customer intends to pay;
                                                                        This portfolio consists of first time buyer mortgages for
• which improve the Bank’s position in terms of expected loss;          properties in the Uk, as there are no operations that entail
• and where the refinancing does not discourage the additional          second or successive charges on mortgaged real estate.
  effort by the customer.
                                                                        Most of the credit exposure is concentrated in greater London,
The group’s corporate policy of restructurings ensures                  where house prices have been more stable even during the
homogeneous and rigorous application of these criteria in the           period of economic downturn.
various units:
• The customer’s risk is assessed overall, irrespective of the          Authorised valuers assess all properties before each operation is
  situation of each individual contract, and all the risks are          approved, in accordance with the principles established by the
  provided with the highest possible level of guarantees.               group for its risk management and in line with the methodology
                                                                        defined by the Royal institution of chartered Surveyors.
• The risk with the customer is not increased.
• All the alternatives to the refinancing and its effects are           The portfolio performed favourably during 2010. its non-
  evaluated, ensuring that the results of it are better than what       performing loan ratio at the end of the year was 1.41%
  might have been obtained if nothing was done.                         compared to 1.52% in 2009, the result of monitoring and
                                                                        constant control as well as strict lending policies which include,
• Particular attention is paid to collateral and the possible future    among other measures, maximum loan to value (LTv) criteria in
  evolution of its value.                                               relation to properties in guarantee. On the basis of these
• its use is restricted, giving precedence to the renewal of risks      policies, no mortgages have been granted since 2009 with LTvs
  with additional efforts by the customer and avoiding situations       of more than 100% and only 0.1% of those granted during this
  that only postpone the problem.                                       period have an LTv of more than 90%. The average LTv is 51%.

• Monitoring of these operations is done in a special way and is        There is no risk appetite for subprime mortgages. The credit risk
  maintained until the debt is totally extinguished.                    policies in force explicitly prohibit this type of loan and establish
• A very detailed analysis, case by case, is made of individually       demanding requirements for credit quality, both regarding the
  managed customers, where the expert view enables the most             operations and customers. Buy-to-let loans with a higher risk
  appropriate conditions to be adjusted.                                profile account for barely 1% of the total portfolio.


174                                                                                                                  ANNUAL REPORT 2010
The following charts show the structure in LTv terms for the                                        E. CONTROL FUNCTION
whole portfolio of residential mortgages and the distribution in                                    The management process is also aided during the various
terms of the income multiple:                                                                       phases of the risk cycle by the function of control. This provides
                                                                                                    a global vision of the group’s portfolio of loans with the
                                                                                                    sufficient level of detail, enabling the current risk position and its
LOAN TO VALUE 1                                                                                     evolution to be assessed.
average : 51%
                                                                                   63%
    LTv < 75%                                                                                       The objective of the control model is to assess the risk of
    75% < LTv < 90%                                                                                 solvency assumed in order to detect focuses of attention and
    LTv > 90%                         12%                                                           propose measures that tend to correct eventual deterioration. it
                                                                                                    is therefore vital that to the control activity in the proper sense
                                                                                                    of the word is added an analysis component that facilitates
                                                                                                    proactivity regarding early detection of problems and the
                                                                                                    subsequent recommendation of action plans.

                                                   25%                                              The evolution of risk with regard to budgets, limits and
                                                                                                    standards of reference is constantly and systematically controlled
                                                                                                    and the impact assessed in the face of future situations,
INCOME MULTIPLE                                                                                     both exogenous and arising from strategic decisions, in order
average 3 times                                                                39%                  to establish measures that put the profile and volume of the
                                                                                                    portfolio of risks within the parameters set by the group.
   < 3,0
   3,0 - 3,99
                                                                                                    The control function is conducted by assessing risks from various
   > 4,0                                                                                            perspectives and establishing as the main elements control by
                                                                                                    countries, business areas, management models, products and
                                                                                                    processes. This facilitates the detection of focuses of specific
                                                                                      35%
                                                                                                    attention for decision-making.
                                        26%

                                                                                                    One of the focuses in 2010 was to strengthen the vision of the
(1) indexed.
                                                                                                    various units from a local control standpoint, deepening their
(*) Loan to value: the relation between the loan and the appraised value of the                     context of business, legislation, strategy, local regulations and
    mortgaged property.                                                                             evolution of their portfolios. The homogeneity of the control
    income multiple: affordability rate (relation between the customer’s uncommitted net
   income and the annual loan payments). The figures in the chart are only for loans                model was consolidated, setting standards for the flow of
   made in 2010.                                                                                    information, analysis by portfolios and monitoring of the main
                                                                                                    management metrics, which enable the risk of each business
UNITED KINGDOM: PORTFOLIO OF RESIDENTIAL MORTGAGES                                                  segment to be constantly assessed.
Million euros
                                                                       December 2010                in 2006, under the corporate framework established in the
                                                                                                    group for complying with the Sarbanes-Oxley Act, a tool was
                                                              Portfolio                % of loans
                                                                                                    created in the group’s intranet to document and certify all sub
Residential mortgages                                         192,590                       78.6    processes, operational risks and controls that mitigate them. The
      First home buyer                                         34,666                       14.2    Risks Division, as part of the group, evaluates every year the
      Mover                                                    75,110                       30.7
                                                                                                    efficiency of internal control of its activities.
      Remortgage                                               82,814                       33.8    Analysis of scenarios
First Time Buyer: customers who buy a home for the first time.                                      As part of its management of monitoring and continuous
Mover: customers who change home with or without changing the bank that granted the mortgage.       control, the group conducts simulations of its portfolio using
Remortgage: customers who transfer their mortgage from another bank.
                                                                                                    adverse scenarios and stress tests in order to assess the group’s
                                                                                                    solvency in the face of certain situations in the future. These
                                                                                                    simulations cover all the group’s most relevant portfolios and
An additional indicator of the portfolio’s good performance is                                      are done systematically using a corporate methodology which:
the low volume of properties that have been repossessed, which                                      • Determines the sensitivity of risk factors (PD, LgD) to certain
at the end of 2010 amounted to EUR 143 million (a mere                                                macroeconomic variables.
0.07% of the total mortgage exposure). The efficient
management of these cases and the existence of a dynamic                                            • Defines reference scenarios (at the global level as well as for
market for this type of property, which enables sales to take                                         each of the group’s units).
place in a short period, contribute to the good results obtained.                                   • identifies rupture scenarios (levels as of which the sensitivity of
                                                                                                      risk factors to macroeconomic variables is more accentuated)
                                                                                                      and the distance of these scenarios from the current situation
                                                                                                      and the reference scenarios.
                                                                                                    • Estimates the expected loss of each scenario and the evolution
                                                                                                      of the risk profile of each portfolio to movements in certain
                                                                                                      macroeconomic variables.


         ANNUAL REPORT 2010                                                                                                                                            175
The simulation models use the data of a complete economic                   evolution compared to the end of 2009 (the starting point) in
cycle to measure the performance of risk factors in the face                two types of scenarios: benchmark and the other in adverse
of changes in macroeconomic variables.                                      circumstances including the impact of sovereign debt shocks.

in the wholesale sphere, as they are low default portfolios,                in the case of Santander, the stress tests showed the strength
there is insufficient data on defaults to conduct this                      and validity of its business model. Even in the most adverse
measurement and expert criteria are used.                                   scenario, the group is able to generate profits, distribute
                                                                            dividends and continue to generate capital, keeping its Tier 1
The scenarios take into account the vision of each unit as well             capital ratio intact at 10.0% (surplus of EUR 23,131 million over
as the global vision. The macroeconomic variables include:                  the 6% benchmark ratio).
• The unemployment rate
                                                                            These results compare very well with those of our competitors.
• Property prices                                                           On the basis of the like-for-like information supplied by cEBS,
                                                                            Santander is the European bank that would generate the
• gDP
                                                                            highest profits before tax, and its return on risk assets and on
• interest rates                                                            Tier 1 capital would be the best of the 25 largest banks
                                                                            analysed.
• inflation
The analysis of scenarios enables senior management to better               F. RECOVERY ACTIVITY
understand the foreseeable evolution of the portfolio in the face           Recovery management in 2010 continued to be a strategic
of market conditions and changing situations, and it is a key               element in the Bank’s risk management.
tool for assessing the sufficiency of the provisions established for
stress scenarios.                                                           in order to carry out this function, which is essentially a business
                                                                            activity, the Bank has a corporate model of management which
The analysis of the baseline and acid scenarios for the whole               sets the guidelines and general rules to be applied in the
group and for each unit, with a time frame of five years, shows             countries where it operates, with the necessary adjustments on
the strength of the balance sheet in the face of different market           the basis of local business models and the economic situation of
and macroeconomic situations.                                               the respective environments.

EU Stress test exercises                                                    This corporate model basically establishes procedures and
in order to increase the confidence in European banks and raise             management circuits on the basis of customers’ features,
the degree of transparency and standardisation in the financial             making a distinction between massive level management with
information supplied to the market, the committee of European               the use of multiple channels and a more personalised
Banking Supervisors (cEBS) published the results of the stress              management with specific managers assigned.
tests conducted during the first half of 2009 on 91 banking
groups accounting for at least 50% of the domestic banking                  As a result of this segmentation in management, various
system of 20 European countries.                                            mechanisms were established to ensure recovery management
                                                                            of customers in non-payment situations from the earliest phases
carried out in coordination with the European central Bank and              to the writing off of the debt. The sphere of action of the
the European commission, as designers of the scenarios, and                 recovery function begins the very first day of non-payment of
countries’ banking authorities, as those responsible for                    the loan and ends when it has been paid or reclassified.
conducting the analysis, the stress tests of cEBS analysed the              Preventative management is conducted in some segments
level of capital the banks would reach in 2011 and their                    before a non-payment situation arises.


STRESS TEST RESULTS
Million euros

                                                    Benchmark    Adverse
                                                      scenario   scenario

Net operating income 2010-2011                         49,196     43,599
Provisions at December 2009                            20,779     20,779
Total                                                  69,975     64,378
gross deterioration 2010-2011                         (40,856)   (50,288)
Taxes                                                  (6,701)    (3,114)
Net surplus stress test                               22,419     10,976
Dividends, generic provisions not used and others     (14,555)    (8,730)
Change in Tier 1 capital                                7,864     2,246
Risk assets                                           579,621    585,346
Tier 1                                                 11,0%     10,0%
Source: Bank of Spain


176                                                                                                                     ANNUAL REPORT 2010
Recovery activity, understood as an integral business, is             The distribution of the portfolio of companies by sectors is
supported by constant reviewing of the management processes           adequately diversified. The chart below shows the distribution
and methodology. it is backed by all the group’s capacities and       of the credit exposure in the group’s main units.
with the participation and cooperation of other areas
(commercial, resources, technology, human resources) as well as
the development of technology solutions to improve                    DISTRIBUTION OF RISK BY SECTOR
                                                                      %
effectiveness and efficiency.
                                                                                                                                       individuals 55%

Santander also attaches great importance to the development
                                                                                 Real estate activity
of talent. We have a practical and hands on training plan which                                 8%
deepens knowledge, facilitates the exchange of ideas and best              commerce and repairs
practices and professionally develops teams, while always                                    5%
striving to integrate recovery activity into the group’s ordinary                    Transport and
and commercial activity.                                                     communications 4%
                                                                                    construction and
                                                                                    public works 4%
All these actions in 2010 to ensure an efficient recovery process
enabled us to improve the ratios for the recovery of non-                    Elect. gas and water prod.
                                                                                           and distr. 3% Other              Rest 19%
performing loans and contain the entry of new ones. There was                                            business
                                                                                                         services
a notable reduction in net entries, a trend observed on most of                                          2%
the group’s business units.                                           *Rest includes sectors with concentration below 2%.


The results for the recovery of written-off assets were also good
in 2010, as we took actions both at the level of customers in         The group’s risks division works closely with the financial
situations of non-payment, as well as actively managing               division to actively manage credit portfolios. its activities include
portfolios. All of this made possible a greater degree of recovery    reducing the concentration of exposures through various
in this line of activity.                                             techniques such as using credit derivatives and securitisation to
                                                                      optimise the risk-return relation of the whole portfolio.

3.6 OTHER STANDPOINTS                                                 B. CREDIT RISK BY ACTIVITIES IN
                                                                          FINANCIAL MARKETS
    OF CREDIT RISK                                                    This section covers credit risk generated in treasury activities
                                                                      with clients, mainly credit institutions. This is developed through
There are spheres and/or specific points in credit risk that
                                                                      financing products in the money market with different financial
deserve specialised attention and which supplement global
                                                                      institutions, as well as derivatives to provide service to the
management.
                                                                      group’s clients.
A. RISK OF CONCENTRATION
control of risk concentration is a vital part of management.          Risk is controlled through an integrated system and in real time
The group continuously tracks the degree of concentration of          which enables us to know at any moment the exposure limit
its credit risk portfolios using various criteria: geographic areas   available with any counterparty, in any product and maturity
and countries, economic sectors, products and groups of clients.      and in all of the group’s units.

The board’s risk committee establishes the policies and reviews       Risk is measured by its prevailing market as well as potential
the appropriate exposure limits for appropriate management of         value (value of risk positions taking into account the future
the degree of concentration of credit risk portfolios.                variation of underlying market factors in contracts).
                                                                      The Equivalent credit Risk (EcR) is the Net Replacement value
The group is subject to the Bank of Spain regulation on large         plus the Maximum Potential value of these contracts in the
risks. in accordance with circular 3/2008, no individual or           future. The capital at risk or unexpected loss is also calculated
economic group exposure, including all types of credit risks and      (i.e. the loss which, once the expected loss is subtracted,
equities, can exceed 25% of the group’s shareholders’ equity.         constitutes the economic capital, net of guarantees
The total of large risks (those that exceed 10% of eligible equity)   and recovery).
cannot be more than eight times higher than equity (excluded
from this are exposures to OEcD governments and central banks).       The total exposure to credit risk from activities in the financial
                                                                      markets was 63.2% with credit institutions. By product type,
At December 31, 2010, there was only one economic group               the exposure to derivatives was 52.3%, mainly products
that exceeded 10% of shareholders’ funds: a Spanish                   without options, and 47.7% to liquidity products and traditional
multinational with an internal rating equivalent to A- and which      financing.
represented 11.09%. After applying risk mitigation techniques
and the rules for large risks, the percentage came down to            Derivative operations are concentrated in high credit quality
9.28% of eligible equity.                                             counterparties; 62.8% of risk with counterparties has a rating
                                                                      equal to or more than A-. The total exposure in 2010 in terms
At December 31, 2010, the 20 largest economic and financial           of equivalent credit risk amounted to EUR 46,893 million.
groups, excluding AAA governments and sovereign securities
denominated in local currency, represented 6.0% of the
outstanding credit risk of the group’s clients (lending plus
guarantees).


     ANNUAL REPORT 2010                                                                                                                            177
OTC DERIVATIVES DISTRIBUTION BY NET REPLACEMENT VALUE AND EQUIVALENT CREDIT RISK
Million euros at December 31, 2010
                                                             Total EcR                  Total net replacement value

                                                  Trading    Hedging       Total   Trading      Hedging               Total

cDS protection acquired                              663        134         798       178           210               388
cDS protection sold                                   55           2         57      -325            -33              -358
TRS total return swap                                  0           0          0         0              0                 0
cDS options                                            0           0          0         0              0                 0
Total credit derivatives                            718         137        855       -147           177                30
Equity forwards                                        0        142         143         0          -286               -286
Equity options                                       522       1,013      1,535      -203          -362               -564
Equity swaps                                           0        513         513         0           165               165
Equity spot                                            0           0          0         0              0                 0
Total equity derivatives                            522       1,669       2,191      -203          -483               -685
Fixed-income forwards                                 56          38         94        30              1                31
Fixed-income options                                   0           1          1         0              0                 0
Fixed-income spot                                      0           0          0         0              0                 0
Total fixed income derivatives                        56         39         95         30              1               31
Asset swaps                                        1,686       2,600      4,286    -1,688           389           -1,299
Exchange-rate options                                304        140         443       -74          -303               -377
Exchange-rate swaps                                4,353      12,045     16,398       603         1,805            2,408
Other exchange-rate derivatives                        5           6         11         1              1                 2
Total exchange rates                              6,348      14,791      21,139    -1,159         1,893               734
Asset swaps                                            0        293         293         0            -52               -52
call money swaps                                     371          20        391       -86             -8               -94
iRS                                               14,935      10,439     25,375     1,008         3,170            4,178
Forward interest rates                                 1           4          4         0            -11               -11
Other interest-rate derivatives                      916       1,423      2,339       643         -1,914          -1,271
interest rate structures                             338        493         831       222          -256                -34
Total interest-rate derivatives                  16,561      12,673      29,234    1,787            929           2,717
commodities                                          239          13        252       164             11              175
Total commodity derivatives                         239          13        252       164             11               175
Total otc derivatives                            24,444      29,322      53,766      473          2,529           3,002
Collateral                                             0      -6,873     -6,873
Total                                            24,444      22,449      46,893


178                                                                                           ANNUAL REPORT 2010
NOTIONAL OTC DERIVATIVE PRODUCTS BY MATURITY
Million euros
                                          1 year                   1-5 years              5-10 years             over 10 years             Total REc

                                     T      H      Total     T      H    Total        T      H   Total       T      H     Total        T        H       Total

cDS protection acquired               4     5         9     66     15          81   16      56     72      577     58      636       663     134        798
cDS protection sold                   5     2         7     40       0         40   10       0     10        0      0        0        55        2         57
TRS total return swap                 0     0         0      0       0          0    0       0         0     0      0        0         0        0          0
cDS options                           0     0         0      0       0          0    0       0         0     0      0        0         0        0          0
Total credit derivatives             9      7       16     105     15     120       26     56      82      578     59     636       718      137        855
Equity forwards                       0   142      143       0       0          0    0       0         0     0      0        0         0     142        143
Equity options                      168   564      732     346    382     728        8      62     70        0      5        5       522   1,013       1,535
Equity swaps                          0   163      163       0    301     301        0       3         3     0     47       47         0     513        513
Equity spot                           0     0         0      0       0          0    0       0         0     0      0        0         0        0          0
Total equity derivatives           168    869 1,038        346    683 1,029          8     65      72        0     52       52      522 1,669          2,191
Fixed-income forwards                56    38        94      0       0          0    0       0         0     0      0        0        56       38         94
Fixed-income options                  0     0         0      0       1          1    0       0         0     0      0        0         0        1          1
Fixed-income spot                     0     0         0      0       0          0    0       0         0     0      0        0         0        0          0
Total fixed income derivatives 56          38       94      0       1          1     0       0         0     0      0        0       56       39          95
Asset swaps                       1,121 2,234 3,356        491    284     775       26      79    105       48      2       50     1,686   2,600       4,286
Exchange-rate options               222   130      352      81     10          91    1       0         1     0      0        0       304     140        443
Exchange-rate swaps               1,539 2,142 3,681 1,649        5,649   7,297 1,163 1,925 3,088             2 2,329     2,331     4,353 12,045 16,398
Other exchange-rate derivatives       5     6        11      0       0          1    0       0         0     0      0        0         5        6         11
Total exchange rates              2,887 4,512 7,399 2,221 5,943 8,164 1,190 2,004 3,194                     51 2,331 2,382         6,348 14,791 21,139
Asset swaps                           0     1         1      0     27          27    0      48     48        0    217      217         0     293        293
call money swaps                    138    18      157     223       2    225        5       0         5     5      0        5       371       20       391
iRS                                 374   729 1,104 3,135        3,418   6,552 3,986 2,714 6,699 7,440 3,579 11,019               14,935 10,439 25,375
Forward interest rates                1     4         4      0       0          0    0       0         0     0      0        0         1        4          4
Other interest-rate derivatives       2   197      199      41    451     492       107   384     491      766    391    1,157       916   1,423       2,339
interest rate structures             33    93      126     213    173     386       48      51     99       44    176      220       338     493        831
Total interest-rate derivatives 549 1,042 1,591 3,612 4,071 7,683 4,145 3,197 7,342 8,256 4,363 12,619 16,561 12,673 29,234
commodities                         108     0      108     119     13     132       12       0     12        0      0        0       239       13       252
Total commodity derivatives 108             0      108     119     13     132       12       0     12        0      0        0      239       13        252
Total otc derivatives             3,777 6,469 10,246 6,403 10,726 17,129 5,380 5,322 10,703 8,884 6,805 15,689 24,444 29,322 53,766
Collateral                                                                                                                            0 -6,873 -6,873
Total                                                                                                                             24,444 22,449 46,893

H = Hedging
T = Trading


        ANNUAL REPORT 2010                                                                                                                               179
DISTRIBUTION OF RISK IN OTC DERIVATIVES                                                         The distribution of risk in derivatives by type of counterparty is
BY TYPE OF COUNTERPARTY                                                                         41% with Banks, 34% with large companies and 10% with
                                                                                                SMEs. As regards the geographic distribution of risk, 18% is
Rating                                                                                      %   with Spanish counterparties, 20% with Uk ones (mainly
AAA                                                                                    11.6     operations by Santander Uk) and among the rest of areas
AA                                                                                      9.7
                                                                                                Eurooe (29%), the US (9%) and Latin America (16%).
A                                                                                      41.5     ACTIVITY IN CREDIT DERIVATIVES
BBB                                                                                    21.3     grupo Santander uses credit derivatives to cover loans,
BB                                                                                     13.3     customer business in financial markets and, to a lesser extent,
                                                                                                within trading operations. The volume of this activity is small
B                                                                                       1.6
                                                                                                compared to that of our peers and, moreover, is subject to a
Rest                                                                                    0.9     solid environment of internal controls and minimising
                                                                                                operational risk.

                                                                                                The risk of these activities is controlled via a broad series of
DISTRIBUTION OF RISK IN OTC DERIVATIVES
BY TYPE OF COUNTERPARTY                                                                         limits such as vaR, nominal by rating, sensitivity to the spread by
                                                                                                rating and name, sensitivity to the rate of recovery and to
                                                                    Banks 41%
                                                                                                correlation. Jump-to-default limits are also set by individual
                                                                                                name. geographic area, sector and liquidity.

                                                                                                At December 31, 2010, for the group’s trading activity, the
          Sovereign 12%                                                                         sensitivity of lending to increases in spreads of one basis point
                                                                           Securitisation
                                                                           1%                   was minus EUR 1.5 million, and the average vaR during the year
           Sov/pub. instit.                                                                     was EUR 17.2 million. The latter was higher than in 2009
                      2%                                                                        because of the greater volatility of credit spreads in the market.
           Large companies
                     10%                                                                        in notional terms, the position in cDS incorporates EUR 89.127
                                                    corporate 34%                               million of acquired protection and EUR 79.764 million of sold
                                                                                                protection.

                                                                                                C. COUNTRY RISK
DISTRIBUTION OF RISK IN OTC DERIVATIVES                                                         country risk is a credit risk component in all cross-border credit
BY GEOGRAPHIC AREAS                                                                             operations for circumstances different to the usual commercial
                                                                                                risk. its main elements are sovereign risk, the risk of transfer and
                                                           Rest of Europe 29%                   other risks which could affect international financial activity
                                                                                                (wars, natural disasters, balance of payments crisis, etc).

                                                                                                The exposure susceptible to country-risk provisions at the end
           Latin America                                                   Uk 20%               of 2010 was EUR 435 million, of which EUR 37 million
                   16%                                                                          corresponded to intragroup operations. At the end of 2009,
                                                                                                the total country risk in need of provisions was EUR 444 million.
                                                                                                Total provisions in 2010 stood at EUR 69 million compared with
                                                                                                EUR 65 million in 2009.
                           US 9%
                                                                                                country risk management principles continued to follow very
                                    Others 8%     Spain 18%
                                                                                                prudent criteria. Risk is assumed very selectively in operations
                                                                                                that are clearly profitable for the group and which strengthen
                                                                                                the global customer relation.
EVOLUTION OF COUNTRY-RISK SUBJECT TO PROVISIONS
AND PROVISIONS ASSIGNED
Million euros
                                                   5,422
                   1,437
            977


                                      971


                                            916
    810


                              710


                                                              444


                                                                     435


DEC 02 DEC 03 DEC 04 DEC 05 DEC 06 DEC 07 DEC 08 DEC 09 DEC 10


180                                                                                                                                          ANNUAL REPORT 2010
D. SOVEREIGN RISK                                                   E. ENVIRONMENTAL RISK
As a general criterion, sovereign risk is that contracted in        Analysis of the environmental risk of credit operations is one of
transactions with a central bank (including the regulatory cash     the main aspects of the strategic plan of corporate social
reserve requirement), the issuer risk of the Treasury or the        responsibility. it revolves around the following two large points:
Republic (portfolio of state debt) and that arising from
                                                                    • Equator principles: this is an initiative of the World Bank’s
operations with public institutions with the following features:
                                                                      international Financial corporation. it is an international
their funds only come from institutions directly integrated into
                                                                      standard for analysing the social and environmental impact of
the state sector; and their activities are of a non-commercial
                                                                      project finance operations. The assumption of these principles
nature.
                                                                      represents a commitment to evaluating, on the basis of
                                                                      sequential methodology, the social and environmental risks of
At December 31, 2010 Europe accounted for 56.1% of
                                                                      the projects financed.
sovereign risk, Latin America 37.7%, the US 5.1% and others
1%. Of note in Europe were the Uk (27.2%) and Spain (21.2%)            – For operations with an amount equal to or more than $10
and in Latin America Brazil (27.1%) and Mexico (6.0%). As for            million, an initial questionnaire is filled out, of a generic
those countries on the periphery of Europe, the percentages of           nature, designed to establish the project’s risk in the socio-
total risk are low: Portugal (2.4%), italy (0.3%), ireland (0.2%)        environmental sphere (according to categories A, B and c,
and greece (0.1%).                                                       of greater to lower risk, respectively) and the operation’s
                                                                         degree of compliance with the Equator Principles.
Latin America’s exposure to sovereign risk mainly comes from
                                                                       – For those projects classified within the categories of greater
the obligations to which subsidiary banks are subject for
                                                                         risk (categories A and B), a more detailed questionnaire has
constituting certain deposits in the corresponding central banks
                                                                         to be filled out, adapted according to the sector of activity.
as well as from fixed-income portfolios maintained as part of the
structural interest rate risk management strategy. These               – According to the category and location of the projects a
exposures are in local currency and are financed by locally              social and environmental audit is carried out (by
captured customer deposits, also denominated in local currency.          independent external auditors). Specific questionnaires have
The exposures to sovereign risk of Latin American issuers                been developed for those sectors where the Bank is most
denominated in currencies other than the official one of the             active. The Bank also gives training courses in social and
country of issue amounted to EUR 1,812 million (2.7% of total            environmental matters to risk teams as well as to those
sovereign risk with Latin American issuers).                             responsible for business.
                                                                    • viDA tool: used since 2004, its main purpose is to assess the
                                                                      environmental risk of corporate clients, both current and
                                                                      potential, through a system that classifies in seven categories
                                                                      each of the companies on the basis of the environmental risk
                                                                      contracted. in 2010, 41,306 companies were assessed by this
                                                                      tool in Spain.


                                                                    ENVIRONMENTAL RISK CLASSIFICATION
                                                                    Billion euros

                                                                     30


                                                                     25


                                                                     20


                                                                     15


                                                                     10


                                                                      5


                                                                      0                   VL        L-      L+       M-      M+       H-   H+


                                                                    Note: viDA companies assessed in the retail banking network in Spain
                                                                    vL: very low; L: low; M: medium and H: high.


     ANNUAL REPORT 2010                                                                                                                         181
4. MARkET RiSk


4.1 ACTIVITIES SUBJECT                                                  and the group’s economic value by maintaining appropriate
                                                                        levels of liquidity and solvency.
    TO MARKET RISK
                                                                        Each of these activities is measured and analysed with different
The perimeter for measuring, controlling and monitoring the             tools in order to show in the most precise way their risk profile.
area of Financial Risks covers those operations where equity risk
is assumed. This risk comes from the change in interest rates,
exchange rates, shares, the spread on loans, raw material prices
and from the volatility of these elements, as well as the liquidity     4.2 METHODOLOGIES
risk of the various products and markets in which the group
operates.
                                                                        A. TRADING ACTIVITY
                                                                        The standard methodology that grupo Santander applied to
                                                                        trading activities during 2010 was Value at Risk (VaR), which
On the basis of the finality of the risk, activities are segmented in
                                                                        measures the maximum expected loss with a certain confidence
the following way:
                                                                        level and time frame. The standard for historic simulation is a
a) Trading: this includes financial services for customers and the      confidence level of 99% and a time frame of one day. Statistical
   buying and selling and positioning mainly in fixed-income,           adjustments are applied enabling the most recent developments
   equity and currency products.                                        that condition the levels of risk assumed to be efficiently and
                                                                        quickly incorporated. A time frame of two years or at least 520
b) Balance Sheet Management: interest rate and liquidity risk           daily data from the reference date of the vaR calculation is used.
   comes from mismatches between maturities and repricing of            Two figures are calculated every day, one applying an exponential
   assets and liabilities. it also includes active management of        decline factor which accords less weight to the observations
   credit risk inherent in the group’s balance sheet.                   furthest away in time and another with the same weight for all
c) Structural risks:                                                    observations. The reported vaR is the higher of the two.

   • Structural Exchange-Rate Risk/Hedging of Results:                  The vaR is not the only measure used. it is deployed because it
     Exchange rate risk, due to the currency in which the               is easy to calculate and is a good reference for the group’s level
     investment is made, both in companies that consolidate             of risk. There are also other measures that allow greater control
     and do not consolidate (structural exchange rate) and              of risks in all the markets where the group operates.
     exchange rate risk arising from the hedging of future
     results generated in currencies other than the euro                They include analysis of scenarios which define alternatives for
     (hedging of results).                                              the performance of different financial variables and provide the
   • Structural equity: This covers equity stake investments in         impact on results. These scenarios can replicate critical
     financial and non-financial companies that do not                  developments or circumstances that happened in the past (such
     consolidate, generating risk in equities.                          as a crisis) or determine plausible alternatives that are not
                                                                        concerned with past events. A minimum of three types of
The treasury area is responsible for managing the taking of             scenario are given: plausible, severe and extreme, and a vaR is
trading activity positions.                                             obtained as well as a much fuller picture of the risk profile.

The financial management area is responsible for the centralised        The market risk area, at the level of each unit and globally and
management of these structural risks, applying standardised             following the principle of independence of the business units,
methodologies, adapted to each market where the group                   carries out daily monitoring of positions, through an exhaustive
operates. in the area of convertible currencies (euro, sterling and     control of the changes that take place in the portfolios in order
the dollar), financial management directly manages the parent           to detect possible new developments for immediate correction.
bank’s risks and coordinates management of the rest of the units        The daily preparation of the income statement is an excellent
which operate in these currencies. The management decisions for         indicator of risk levels, as it enables us to identify the impact of
these risks are taken by each country’s ALcO committee and, in          changes on financial variables in the portfolios.
the last instance, by the markets committee of the parent bank.
                                                                        Lastly, in order to control derivative activities and credit
The aim of financial management is to inject stability and              management, because of its atypical nature, specific measures are
recurrence into the net interest margin of commercial activity          conducted daily. in the first case, sensitivity to the price


182                                                                                                                  ANNUAL REPORT 2010
movements of the underlying asset (delta and gamma), volatility        it measures the interest risk implicit in net worth (equity) on the
(vega) and time (theta) is controlled. in the second case, measures    basis of the impact of a change in interest rates on the current
such as the spread sensitivity, jump-to-default, and concentration     values of financial assets and liabilities.
of positions by rating levels, etc, are systematically reviewed.
                                                                       d) Value at Risk (VaR)
As regards the credit risk inherent in trading portfolios and in       The value at Risk for balance sheet activity and investment
line with the recommendations of the Basel committee on                portfolios is calculated with the same standard as for trading:
Banking Supervision and prevailing regulations, an additional          maximum expected loss under historic simulation with a
measurement began to be calculated (incremental default risk,          confidence level of 99% and a time frame of one day. Statistical
iDR), in order to cover the risk of default that is not adequately     adjustments are made which incorporate effectively and quickly
captured in the vaR, via changes in lending spreads. The               the latest developments that condition the risk levels assumed.
controlled products are basically fixed-rate bonds, both public
and private sector, derivatives on bonds (forwards, options, etc)      e) Analysis of scenarios
and credit derivatives (credit default swaps, asset backed             Two scenarios for the performance of interest rates are
securities, etc). The method for calculating the iDR, in essence       established: maximum volatility and severe crisis. These
similar to that of the credit risk of positions outside trading, is    scenarios are applied to the balance sheet, obtaining the impact
based on direct measurements of the tails of the distribution of       on net worth as well as the projections of net interest margin
losses to the appropriate percentile (99.9%). The Monte carlo          for the year.
methodology is used, applying a million simulations.
                                                                       Liquidity risk
B. BALANCE SHEET MANAGEMENT                                            Liquidity risk is associated with the group’s capacity to finance
Interest rate risk                                                     its commitments, at reasonable market prices, as well as carry
The group analyzes the sensitivity of net interest margin and          out its business plans with stable sources of funding. The group
market value of equity to changes in interest rates. This              permanently monitors maximum gap profiles.
sensitivity arises from gaps in maturity dates and the review of
interest rates in the different asset and liability items.             The measures used for liquidity risk control in balance sheet
                                                                       management are the liquidity gap, liquidity ratios, stress
On the basis of the positioning of balance sheet interest rates, as    scenarios and contingency plans.
well as the situation and outlook for the market, the financial
measures are agreed to adjust the positioning to that desired by       a) Liquidity gap
the Bank. These measures range from taking positions in markets        The liquidity gap provides information on contractual and
to defining the interest rate features of commercial products.         expected cash inflows and outflows for a certain period of time,
                                                                       for each of the currencies in which the group operates. The gap
The measures used by the group to control interest rate risk in        measures the net need or net excess of funds at a particular
balance sheet management are the interest rate gap and the             date, and reflects the level of liquidity maintained under normal
sensitivity of net interest margin and net worth to changes in         market conditions.
interest rates, value at Risk (vaR) and analysis of scenarios.
                                                                       Two types of liquidity gap analysis are made, on the basis of the
a) Interest rate gap of assets and liabilities                         balance sheet item:
interest rate gap analysis focuses on lags or mismatches
between changes in the value of asset, liability and off-balance       1. Contractual liquidity gap: All on-and off-balance sheet items
sheet items. it provides a basic representation of the balance            are analysed provided they contribute cash flows placed in
sheet structure and allows for the detection of interest rate risk        the point of contractual maturity. For those assets and
by concentration of maturities. it is also a useful tool for              liabilities without a contractual maturity, an internal analysis
estimating the impact of eventual interest rate movements on              model is used, based on statistical research of the historical
net interest margin or equity.                                            series of products, and which determines what we call the
                                                                          stability and instability impact on liquidity.
All on- and off-balance sheet items must be disaggregated by
their flows and looked at in terms of repricing/maturity. in the
                                                                       2. Operational liquidity gap: This is a scenario in normal
case of those items that do not have a contractual maturity, an
                                                                          conditions of liquidity profile, as the flows of the balance
internal model of analysis is used and estimates made of the
                                                                          sheet items are placed in the point of probable liquidity and
duration and sensitivity of them.
                                                                          not in the point of contractual maturity. in this analysis
                                                                          defining the behaviour scenario —renewal of liabilities,
b) Net interest margin sensitivity (NIM)
                                                                          discounts in sales of portfolios, renewal of assets— is the
The sensitivity of net interest margin measures the change in the
                                                                          fundamental point.
short/medium term in the accruals expected over a particular
period (12 months), in response to a shift in the yield curve.
                                                                       b) Liquidity ratios
it is calculated by simulating the net interest margin, both for a     The liquidity coefficient compares liquid assets available for sale
scenario of a shift in the yield curve as well as for the current      (after applying the relevant discounts and adjustments) with
situation. The sensitivity is the difference between the two           total liabilities to be settled, including contingencies. This
margins calculated.                                                    coefficient shows, for currencies that cannot be consolidated,
                                                                       the level of immediate response to firm commitments.
c) Market value of equity sensitivity (MVE)
This is an additional measure to the sensitivity of the net interest   Net accumulated illiquidity is defined as the 30-day accumulated
margin.                                                                gap obtained from the modified liquidity gap. The modified


     ANNUAL REPORT 2010                                                                                                                 183
contractual liquidity gap is drawn up on the basis of the             C. STRUCTURAL EXCHANGE-RATE RISK/
contractual liquidity gap and placing liquid assets in the point of   HEDGING OF RESULTS/ STRUCTURAL EQUITY
settlement or repos and not in their point of maturity.               These activities are monitored by position measures,
                                                                      vaR and results.
in addition, other ratios or metrics regarding the structural
position of liquidity are followed:                                   D. ADDITIONAL MEASURES
• Loans/net assets.                                                   Back-testing
                                                                      Back-testing is an a posteriori comparative analysis between
• customer deposits, insurance and medium and long-term               value at Risk (vaR) estimates and the “clean” daily results
  financing/lending.                                                  actually generated (results of the portfolios at the end of the day
• customer deposits, insurance and medium and long-term               valued at the next day’s prices). The purpose of these tests is to
  financing, shareholders’ funds and other liabilities/the sum of     verify and measure the precision of the models used to calculate
  credits and fixed assets.                                           vaR.

• Short-term financing/net liabilities.                               The back-testing analysis carried out by grupo Santander
                                                                      complies, as a minimum, with the BiS recommendations
c) Analysis of scenarios/Contingency Plan                             regarding the verification of the internal systems used to
The group’s liquidity management focuses on taking all the            measure and manage market risks. in addition, back-testing
necessary measures to prevent a crisis. Liquidity crises, and their   includes the hypothesis test: tests of excess, normality,
immediate causes, cannot always be predicted. consequently,           Spearman rank correlation, measures of excess average, etc.
the group’s contingency plans concentrate on creating models
of potential crises by analyzing different scenarios, identifying     The valuation models are fine-tuned and tested regularly by a
crisis types, internal and external communications and individual     specialized unit.
responsibilities.
                                                                      Coordination with other areas
The contingency plan covers the sphere of activity of a local unit    Every day work is carried out jointly with other areas to offset
and of central headquarters. it specifies clear lines of              the operational risk. This entails the conciliation of positions,
communication at the first sign of crisis and suggests a wide         risks and results.
range of responses to different levels of crisis.

As a crisis can occur locally or globally, each local unit must
prepare a contingency financing plan, indicating the amount it
would potentially require as aid or financing from headquarters
during a crisis. Each unit must inform the central unit of its plan
at least every six months so that it can be reviewed and
updated. These plans, however, must be updated more
frequently if market circumstances make it advisable.

Lastly, grupo Santander is actively participating in the process
opened by the Basel committee to strengthen the liquidity of
banks1, with a two-pronged approach: on the one hand,
participating in the analysis of the impact of the regulatory
changes raised —basically, the introduction of two new ratios:
Liquidity coverage Ratio (LcR) and Net Stable Funding Ratio
(NSFR)— and, on the other, being present in the different
forums to discuss and make suggestions on the issue (European
Banking Federation, etc), maintaining in both cases close co-
operation with the Bank of Spain.


                                                                      1. “Basel iii: international framework for liquidity risk measurement, standards and monitoring”
                                                                         (Basel committee on Banking Supervision, December 2010)


184                                                                                                                                      ANNUAL REPORT 2010
4.3. CONTROL SYSTEM                                                 4.4. RISKS AND RESULTS IN 2010
A. DEFINITION OF LIMITS                                             A. TRADING ACTIVITY
The process of setting limits takes place after the year-end        Quantitative analysis of VaR in 2010
budgeting process, and is the means used by the group to            The group’s risk performance with regard to trading activity in
establish the level of equity that each activity has available.     financial markets during 2010, as measured by vaR, was as
The process of definition of limits is dynamic, and responds        follows:
to the level of risk appetite considered acceptable by senior
management.                                                         EVOLUTION OF VAR DURING 2010
                                                                    Million euros
B. OBJECTIVES OF THE STRUCTURE OF LIMITS
                                                                     40
The structure of limits require a process that takes into account
the following aspects, among others:                                                                   Max. (37.5)
                                                                     36
• identify and define, efficiently and comprehensively, the main
  types of risk incurred so that they are consistent with the
                                                                     32
  management of business and with the strategy.
• Quantify and inform the business areas of the risk levels          28
  and profile that senior management believes can be assumed,
  in order to avoid undesired risks.                                 24
• give flexibility to the business areas to build risk positions
  efficiently and opportunely according to changes in the            20                                               Min. (21.2)
  market, and in the business strategies, and always within the

                                                                            4 Jan. 10
                                                                           23 Jan. 10
                                                                          11 Feb. 10
                                                                          02 Mar. 10
                                                                          21 Mar. 10
                                                                          09 Mar. 10
                                                                           28 Apr. 10
                                                                          17 May. 10
                                                                           05 Jun. 10
                                                                           24 Jun. 10
                                                                            13 Jul. 10
                                                                          01 Aug. 10
                                                                          20 Aug. 10
                                                                          08 Sep. 10
                                                                          27 Sep. 10
                                                                          16 Oct. 10
                                                                          04 Nov. 10
                                                                          23 Nov. 10
                                                                          12 Dec. 10
                                                                          31 Dec. 10
  risk levels regarded as acceptable by the entity.
• Allow the generators of business to take prudent risks but
  sufficient to attain the budgeted results.
• Define the range of products and underlying assets with
                                                                    vaR during 2010 fluctuated more than 97% of the time in a
  which each treasury unit can operate, bearing in mind features
                                                                    range of between EUR 24 million and EUR 36 million. it
  such as the model and valuation systems, the liquidity of the
                                                                    exceeded EUR 36 million in three periods – at the end of April,
  tools used, etc.
                                                                    May and June. This was due to the increase in volatility due to
                                                                    the sovereign debt crisis in European markets, in the first two
                                                                    cases, and to the higher interest rate risk in Brazil and Mexico in
                                                                    the third case. The vaR reached a maximum of EUR 37.5 million
                                                                    at the end of June and then declined because of the reduction
                                                                    in the credit risk spread in Madrid and interest rate and
                                                                    exchange rate in Mexico, to a minimum of EUR 21.2 million in
                                                                    the middle of September. There was a “window effect” in the
                                                                    fourth quarter – exit from observations of the Lehman crisis
                                                                    (September-December 2008) from the time range with which
                                                                    vaR is calculated (2 years), which would have generated a
                                                                    reduction in vaR- which was offset by higher volatility in
                                                                    sovereign credit spreads.

                                                                    The average vaR of the group’s trading portfolio in 2010 (EUR
                                                                    28.7 million) was slightly lower than in 2009 (EUR 30.2 million),
                                                                    even though 2010 was conditioned by the aforementioned
                                                                    periods of higher volatility over the European sovereign debt
                                                                    crisis. The changes in vaR in 2009 were mainly due to changes
                                                                    in the positions of portfolios in Brazil and Mexico. compared to
                                                                    other comparable financial groups, grupo Santander has a low
                                                                    trading risk profile. Dynamic management of it enables the
                                                                    group to adopt changes of strategy in order to exploit
                                                                    opportunities in an environment of uncertainty.


     ANNUAL REPORT 2010                                                                                                             185
The histogram below shows the distribution of average risk in                                              in Latin America, the US and Asia the credit spread vaR and the
terms of vaR during 2010. it was between EUR 24 million and                                                commodities vaR factor are not shown separately because of
EUR 32 million on 75.7% of days. Of note is the right tail of                                              their scant or zero materiality.
distribution (levels of more than EUR 38 million) mainly due to
the increased volatility in markets because of the sovereign debt                                          The average vaR was EUR 1.5 million lower than in 2009.
crisis in Europe.                                                                                          The reduction was mainly in interest rate and forex, which
                                                                                                           dropped from EUR 20 million and EUR 15.5 million to EUR 16.4
                                                                                                           million and EUR 11.4 million, respectively. The average level of
VAR RISK HISTOGRAM                                                                                         vaR in equities increased a little to EUR 8 million. The main risk
Number of days (%)
Million euros                                                                                              increase was in the credit spread, which rose from EUR 11.9
                                                                                                           million to EUR 20.9 million because of the episodes of volatility
                                                   26.3%


                                                                                                           over the sovereign debt crisis in the euro zone.
                                      21.6%


                                                                                                           Histogram of VaR by risk factor
                                                                                                           The vaR performance during 2010 underlined the group’s
                                                               13.9%
                           13.9%


                                                                          11.2%


                                                                                                           flexibility and agility in adapting its risk profile on the basis of
                                                                                                           changes in strategy caused by a different perception of
               6.2%


                                                                                                           expectations in the markets.
                                                                                      3.9%


                                                                                                  2.3%
   0.8%


 <22          24          26          28          30          32          34          36         >38


Risk by factor
The minimum, average, maximum and year-end 2010 values
in vaR terms are shown below:

VAR STATISTICS BY RISK FACTOR2                                                                             HISTOGRAM OF VAR BY RISK FACTOR
Million euros                                                                                              Million euros

                                      Minimum              Average        Maximum              year-end      Fixed-income vaR      Fx vaR          credit spread vaR
Total trading
Total VaR                                     21.2           28.7                 37.5            29.6       Equity vaR            commodities vaR
Diversification effect                        (15.7)        (29.1)                (45.4)         (27.8)
Fixed income vaR                                9.4           16.4                 25.4           19.0     30.0

Equity vaR                                      4.4             8.0                14.4              8.8   25.0
Fx vaR                                          4.6           11.4                 23.6           13.9
                                                                                                           20.0
credit spread vaR                              13.9           20.9                 27.1           14.7
commodities vaR                                 0.5             1.3                 2.1              1.0   15.0
Latin America
Total VaR                                     12.5           18.2                 34.8            13.9     10.0

Diversification effect                         (1.3)          (8.3)               (21.5)         (12.6)     5.0
Fixed income vaR                               12.0           14.5                 20.1           14.8
                                                                                                            0.0
Equity vaR                                      1.7             5.8                15.0              5.3
                                                                                                                    4 Jan. 10
                                                                                                                   23 Jan. 10
                                                                                                                  11 Feb. 10
                                                                                                                  02 Mar. 10
                                                                                                                  21 Mar. 10
                                                                                                                  09 Mar. 10
                                                                                                                   28 Apr. 10
                                                                                                                  17 May. 10
                                                                                                                   05 Jun. 10
                                                                                                                   24 Jun. 10
                                                                                                                    13 Jul. 10
                                                                                                                  01 Aug. 10
                                                                                                                  20 Aug. 10
                                                                                                                  08 Sep. 10
                                                                                                                  27 Sep. 10
                                                                                                                  16 Oct. 10
                                                                                                                  04 Nov. 10
                                                                                                                  23 Nov. 10
                                                                                                                  12 Dec. 10
                                                                                                                  31 Dec. 10


Fx vaR                                          2.8             7.1                27.6              6.5
US and Asia Total VaR                           0.7            1.3                  5.9             0.9
Diversification effect                         (0.1)          (0.7)                (1.8)          (0.3)
Fixed income vaR                                0.7             1.2                 2.7              0.9
Equity vaR                                      0.0             0.2                 1.4              0.0
Fx vaR                                          0.3             0.6                 5.5              0.3
Europe Total VaR                                9.2          14.8                 31.3            25.1
Diversification effect                         (3.6)        (18.9)                (28.4)         (14.6)
Fixed income vaR                                4.9             8.9                17.5           12.5
Equity vaR                                      4.0             6.7                14.5              6.5
Fx vaR                                          2.0             9.8                15.8              9.6
credit spread vaR                               3.5             7.0                14.4              9.0
commodities vaR                                 0.5             1.3                 2.1              2.1

2. Total vaR of trading includes operations that are not assigned to any particular country,
   such as Active credit Portfolio Management and Non-core Legacy Portfolio.


186                                                                                                                                                       ANNUAL REPORT 2010
a) Geographic distribution
Latin America contributed on average 40.8% of the group’s
total vaR in trading activity and 30.2% in economic results from
this activity. Europe, with 27.1% of global risk, contributed
66.7% of results, as most of its treasury activity focused on
professional and institutional clients.

Below is the geographic contribution (by percentage), both in
risks, measured in vaR terms, as well as in results (economic
terms).

RISK STATISTICS 2010
%

     Average vaR                                     Annual economic results

70

60

50

40

30

20

10

 0
          Latin America                    Europe                US and Asia                    Global
                                                                                               activities


b) Monthly distribution of risks and results
The next chart shows that the risk assumption profile, in terms
of vaR, followed an upward path during the first half of the year
and then remained stable, while results evolved more irregularly
during the year. Of note were April, August and November                                                               The following histogram of frequencies shows the distribution
when the European sovereign debt crisis was clear, with a P&L                                                          of daily economic results on the basis of their size. The daily
lower than the yearly average, mainly in the Madrid unit and in                                                        yield3 was between -EUR 5 and +EUR 15 million on 69.5% of
the books of global activities.                                                                                        days of the market.


DISTRIBUTION OF RISK BY TIME AND RESULTS IN 2010                                                                       HISTOGRAM OF THE FREQUENCY OF DAILY RESULTS
% of annual total                                                                                                      Number of days (%)

     Average monthly vaR
                                                                                                                                                                                 25.9%


     Monthly economic result
                                                                                                                                                                        17.4%


                                                                                                                                                                                          16.2%
                                                                                                                                                              15.8%


15
                                                                                                                                                                                                   10.0%


10
                                                                                                                                                   5.0%
                                                                                                                                      4.2%


5
                                                                                                                            3.5%


                                                                                                                                                                                                            1.2%


                                                                                                                                                                                                                      0.8%


0
       Jan 10

                Feb 10

                         Mar 10

                                  Apr 10

                                            May 10

                                                        Jun 10

                                                                 Jul 10

                                                                          Aug 10

                                                                                   Sep 10

                                                                                            Oct 10

                                                                                                     Nov 10

                                                                                                              Dec 10


                                                                                                                           < -20


                                                                                                                                     -20 - -15


                                                                                                                                                 -15 - -10


                                                                                                                                                             -10 - -5


                                                                                                                                                                        -5 - 0


                                                                                                                                                                                 0-5


                                                                                                                                                                                         5 - 10


                                                                                                                                                                                                  10 - 15


                                                                                                                                                                                                            15 - 20


                                                                                                                                                                                                                      > 20


                                                                                                                       3. yields “clean” of commissions and results of intraday derivative operations.


         ANNUAL REPORT 2010                                                                                                                                                                                                  187
Risk management of structured derivatives market                    The following table shows the average, maximum and minimum
Structured derivatives activity is mainly focused on designing      values for each of the units where this type of transactions were
investment products and hedging risks for clients.                  carried out.

These transactions include options on equities, fixed-income        STRUCTURED DERIVATIVES RISK (VAR)
and exchange rates.                                                 IN 2010 BY UNIT.
                                                                    Million euros
The units where this activity mainly takes place are: Madrid
                                                                                                          Minimum            Average          Maximum            year-end
(parent bank treasury), Banesto, Santander Uk, Brazil and
Mexico, and, to a lesser extent, chile and Portugal.                Total VaR Vega                                4.5              7.9                13.6             6.2
                                                                    Madrid                                         1.3              4.3               11.2              2.4
The chart below shows the vaR vega4 performance of                  Portugal                                       0.0              0.0                0.1              0.0
structured derivatives business in 2010. Most of the time risk
moved in a range between EUR 5 and EUR 12.5 million.                Abbey                                          0.9              1.2                1.9              1.0
The main exception was a slight temporary increase in the           Banesto                                        4.0              5.9               10.0              5.3
middle of the year, concentrated in equity volatility of treasury   Brazil                                         0.3              0.9                2.2              0.5
in Madrid and mainly caused by the episodes of higher volatility
                                                                    Mexico                                         0.9              1.5                2.8              1.1
linked to tensions over the sovereign debt crisis in countries on
the periphery of the euro zone.
                                                                    The average risk in 2010 (EUR 7.9 million) was higher than in
                                                                    2009 (EUR 6.6 million), largely due to the general increase in the
                                                                    volatility of markets and the European sovereign debt crisis than
EVOLUTION OF RISK (VAR) OF THE STRUCTURED                           to change in risk taking.
DERIVATIVE BUSINESS
Million euros
                                                                    Regarding vaR by risk factor, the exposure, on average, was
                                                                    concentrated in equities, followed by interest rates, exchange
15,0
                                                                    rates and commodities. This is shown in the following table:
12,5

10,0                                                                STRUCTURED DERIVATIVES RISK (VAR) IN 2010 BY FACTOR
                                                                    Million euros
 7,5                                                                                                      Minimum            Average          Maximum            year-end
                                                                    Total VaRD Vega                               4.5              7.9                13.6             6.2
 5,0
                                                                    Diversification impact                       (2.5)            (3.8)               (8.0)             0.0
 2,5                                                                interest rate vaR                              1.7              2.4                5.8              2.1
                                                                    Equity vaR                                     3.9              7.1               12.9              5.6
        4 Jan. 10
       23 Jan. 10
      11 Feb. 10
      02 Mar. 10
      21 Mar. 10
      09 Mar. 10
       28 Apr. 10
      17 May. 10
       05 Jun. 10
       24 Jun. 10
        13 Jul. 10
      01 Aug. 10
      20 Aug. 10
      08 Sep. 10
      27 Sep. 10
      16 Oct. 10
      04 Nov. 10
      23 Nov. 10
      12 Dec. 10
      31 Dec. 10


                                                                    Fx vaR                                         0.4              1.8                3.9              1.5
                                                                    commodities vaR                                0.2              0.5                1.0              0.2


                                                                    Gauging and contrasting measures
                                                                    in accordance with the BiS recommendations on gauging and
                                                                    controlling the effectiveness of internal financial risk
                                                                    measurement and management systems, in 2010 the group
                                                                    regularly carried out analysis and contrasting measures which
                                                                    confirmed the reliability of the model.

                                                                    As in 2009, in 2010 there were no exceptions of vaR at 99%
                                                                    (days when the daily loss was higher than the vaR5). Of note,
                                                                    however, was the exit of vaE6 at 99% (days when the daily gain
                                                                    was more than the vaE) on May 10, mainly due to the sharp fall
                                                                    in credit spreads following the agreement reached by euro zone
                                                                    ministers in conjunction with the European central Bank (EcB)
                                                                    and the international Monetary Fund (iMF). This agreement
                                                                    included the launch of the European stabilisation mechanism
                                                                    and the announcement of public debt purchases by the EcB, in
                                                                    order to contain the lack of confidence in the euro and in
                                                                    sovereign debt.


                                                                    4. vega, a greek term, means here the sensitivity of the value of a portfolio to changes in the price
                                                                       of market volatility.
                                                                    5. Results in terms of “clean P&L”. Excluding intraday results and those from commissions.
                                                                    6. vaE is value at Earnings and is the counterparty of vaR on the profits side.


188                                                                                                                                       ANNUAL REPORT 2010
BACKTESTING OF BUSINESS PORTFOLIOS: DAILY RESULTS VERSUS PREVIOUS DAY’S VALUE AT RISK
Million euros


                                                                       clean P&L                  vaE 99%                       vaR 99%                         vaE 95%                           vaR 95%

 90

 70

 50

 30

 10


-10

-30

-50
      04 Jan. 10


                   23 Jan. 10


                                11 Feb. 10


                                             02 Mar. 10


                                                          21 Mar. 10


                                                                        09 Apr. 10


                                                                                     28 Apr. 10


                                                                                                  17 May. 10


                                                                                                                   05 Jun. 10


                                                                                                                                24 Jun. 10


                                                                                                                                                  13 Jul. 10


                                                                                                                                                               01 Aug. 10


                                                                                                                                                                                 20 Aug. 10


                                                                                                                                                                                              08 Sep. 10


                                                                                                                                                                                                           27 Sep. 10


                                                                                                                                                                                                                              16 Oct. 10


                                                                                                                                                                                                                                               04 Nov. 10


                                                                                                                                                                                                                                                               23 Nov. 10


                                                                                                                                                                                                                                                                            12 Dec. 10


                                                                                                                                                                                                                                                                                             31 Dec. 10
Analysis of scenarios                                                                                                                          Maximum volatility scenario
various scenarios were analyzed in 2010. The chart below                                                                                       The table below shows, at December 31, 2010, the results by
shows the results at December 31, 2010 for a scenario of                                                                                       rick factor of (interest rates, equities, exchange rates, spreads on
maximum volatility, applying six standard deviations in various                                                                                loans, commodities and the volatility of each one of them), in a
market factors for the trading portfolios.                                                                                                     scenario in which a volatility equivalent to six standard
                                                                                                                                               deviations in a normal distribution is applied. This scenario is
                                                                                                                                               based on taking for each risk factor the movement that
                                                                                                                                               represents a greater potential loss in the global portfolio. For the
                                                                                                                                               year-end, this scenario involved rises in interest rate in Latin
                                                                                                                                               American markets and falls in core markets (“flight into
                                                                                                                                               quality”), declines in stock markets, the dollar’s slide against all
                                                                                                                                               currencies except the euro, greater volatility and credit spreads.


MAXIMUM VOLATILITY STRESS TEST
Million euros
                                                                                                    interest                                                                Exchange                        credit
                                                                                                       rates                                 Equities                           rates                      spread                          commodities                                    Total

Total trading                                                                                                  -61.2                          -68.8                            -76.1                       -94.2                                            -1.6                         -302.0
Europe                                                                                                          -9.7                           -16.4                           -62.8                          -54.6                                         -1.6                         -145.1
Latin America                                                                                                  -51.2                           -52.4                            -10.9                                   0.0                                 0.0                          -114.5
US                                                                                                              -0.3                             0.0                             -0.3                                   0.0                                 0.0                            -0.6
global activities                                                                                               -0.2                             0.0                             -2.1                         -39.6                                         0.0                           -41.8


                                                                                                                                               The stress test shows that the economic loss suffered by the
                                                                                                                                               group in its trading portfolios, in terms of the Mark to Market
                                                                                                                                               (MtM) result would be, if the stress movements defined in the
                                                                                                                                               scenario materialized, EUR 302 million, a loss that would be
                                                                                                                                               distributed between Europe (exchange rates and spreads on
                                                                                                                                               loans), Latin America (fixed income) and global activities (credit
                                                                                                                                               spreads).


              ANNUAL REPORT 2010                                                                                                                                                                                                                                                            189
7                                      At the end of 2010, the region’s risk consumption, measured by
B. BALANCE SHEET MANAGEMENT
                                                                                                               the market value of equity sensitivity to 100 basis points, was
B1. Interest rate risk                                                                                         EUR 763 million (EUR 704 million in 2009), while that of the net
                                                                                                               interest margin at one year, measured by its sensitivity to 100
a) Convertible currencies                                                                                      basis points, was EUR 45 million (EUR 64 million in 2009).
At the end of 2010, the sensitivity of net interest margin at one
year to parallel rises of 100 basis points was concentrated in the
euro interest rate curve (EUR 284.1 million), with the parent                                                  LATIN AMERICAN RISK PROFILE EVOLUTION
bank contributing the most, and in the sterling interest rate                                                  (Sensitivity of NiM and MvE to 100 b.p.)
curve (£ 330.8 million). The sensitivity of the rest of convertible                                              NiM
currencies was not very significant.                                                                             MvE


                                                                                                                                                                                                        762.8
                                                                                                                                                                    760.4
                                                                                                                                                 749.4
                                                                                                                         703.8


                                                                                                                                                                                    651.0
At the same date, the sensitivity of equity to parallel rises in the
yield curve of 100 basis points in the euro interest rate curve
was EUR 1,265.7 million, most of it in the parent bank. As
regards the curve in sterling it was £ 406.2 million.

in accordance with the current environment of low interest
rates, the Bank maintains a positive sensitivity, both in net
interest margin (NiM) and to interest rate rises.

                                                                                                                  64.0


                                                                                                                                                           64.2
b) Latin America


                                                                                                                                     56.9


                                                                                                                                                                                                 44.8
                                                                                                                                                                            6.1
1. Quantitative analysis of risk
The interest rate risk of Latin America’s balance sheet                                                           DEC 09              MAR 10                JUN 10           SEP 10               DEC 10
management portfolios, measured by the sensitivity of market
value of the net interest margin (NiM) to a parallel movement of
100 basis points, remained during 2010 at low levels and within
a narrow band, with a maximum of EUR 79 million8 in April as
of when it declined to a low of EUR 6 million in September,
mainly due to the increased hedging in Brazil and the portfolio
sale in Mexico. it then rose until the end of the year, largely
because of the increase in deposits and issues in Brazil.

in terms of equity sensitivity, it fluctuated in a narrow range of
between EUR 651 million and EUR 827 million, and increased in
the fourth quarter, mainly because of the purchase of the credit
portfolio in Brazil and chile.

7. includes all the balance sheet except the trading portfolios.
8. Sensitivity expressed as an absolute value. it is the aggregation of the sensitivity to many yield
curves, grouped applying suppositions of correlation (betas) between them.


MATURITY AND REPRICING GAPS AS OF DECEMBER 31, 2010
Structural gap parent bank-holding*
Million euros
                                                                            Not sensitive               Up to 1 year             1-3 years               3-5 years          > 5 years                           Total
Money and securities market                                                                                  41,762                 1,797                         1,754            14,671                59,985
Loans                                                                                     112               116,764                10,838                         1,504             1,728               130,946
Permanent equity stakes                                                              65,919                                                                                                              65,919
Other assets                                                                         17,346                  51,705                         51                      53                      91           69,247
Total assets                                                                        83,377                 210,231                 12,686                     3,312               16,490                326,097
Money market                                                                                —                43,125                   108                         1,800                     —            45,033
customer deposits                                                                           —                39,513                13,314                         9,704            14,649                77,180
Debt issues and securitisations                                                             —                77,605                13,789                   14,592                 10,766               116,753
Shareholders’ equity and other liabilities                                           82,219                  44,054                 1,011                          712              1,122               129,118
Total liabilities                                                                   82,219                 204,298                 28,223                  26,807                 26,537                368,085
Balance sheet Gap                                                                     1,158                   5,933              (15,537)                (23,495)             (10,046)                  (41,988)
Off-balance sheet structural gap                                                            —                24,104                13,067                   10,630                 (2,078)               45,723
Total structural Gap                                                                  1,158                  30,037                (2,470)               (12,865)             (12,125)                          3,735
Accumulated Gap                                                                             —                30,037                27,567                  14,702                  2,577                           —

* gap of euro-denominated assets and liabilities, excluding other currencies.


190                                                                                                                                                                               ANNUAL REPORT 2010
Interest rate risk profile at the end of 2010                                                 More than 90% of risk is concentrated in four countries: Brazil,
The gap tables show the risk maturity structure in Latin America                              chile, Mexico and Puerto Rico.
at the end of 2010.
                                                                                              The balance sheet management risk in Latin America, measured
2. Geographic distribution                                                                    in vaR terms at one day and at 99%, amounted to EUR 152
Financial margin sensitivity                                                                  million at the end of 2010. The chart shows that most of it was
For the whole of Latin America, the consumption at the end of                                 concentrated in Brazil.
2010 was EUR 45 million (sensitivity of the financial margin at
one year to rises of 100 b.p.). The geographic distribution is                                DISTRIBUTION OF BALANCE SHEET RISK MANAGEMENT (VAR)
shown below.                                                                                  %

More than 90% of the risk was concentrated in three countries:                                                  Otros 0,1%
Brazil, chile and Mexico.                                                                               Puerto Rico 0,5% Argentina 2,3%
                                                                                                            chile 5,3%
                                                                                               Other countries* 7%
NIM SENSITIVITY BY COUNTRIES
%

                                          Other countries* 7%
              Puerto Rico 3,5%

         Mexico 15,3%


                                                                                                                                                     Brazil 91,7%

                                                                                              (*) Other countries: colombia, Mexico, Santander Overseas and Uruguay.


          chile 18,1%                                                 Brazil 56,1%
                                                                                              B2. Structural management of credit risk
                                                                                              The purpose of structural management of credit risk is to reduce
                                                                                              the concentrations that can naturally occur as a result of
(*) Other countries: Argentina, colombia, Panama, Santander Overseas, Peru and Uruguay        business activity through the sale of assets. These operations are
                                                                                              offset by acquiring other assets that diversify the credit portfolio.
Market Value of equity sensitivity                                                            The financial management area analyses these strategies and
For the whole of Latin America, the consumption at the end of                                 makes proposals to the ALcO in order to optimise the exposure
2010 was EUR 763 million (sensitivity of MvE to rises of 100 b.p                              to credit risk and help create value.
in interest rates). The geographic distribution is shown below:
                                                                                              During 2010 and as part of the group’s liquidity management:
MVE SENSITIVITY BY COUNTRIES                                                                  • EUR 26,000 million of assets were securitised, of which EUR
%                                                                                               19,000 million were placed in the market and the rest
               chile 20,1%                                                                      retained by the group’s various units. These retained
                                                                                                securitisations increased the group’s liquidity position through
                                                                                                its discounting capacity in central banks.  
                                                                                              • Repurchases were made in the secondary market of
      Mexico 5,1%                                                         Brazil 67,2%
                                                                                                securitisation bonds of the higher tranches of group issuers
  Puerto Rico 3,3%                                                                              (around EUR 500 million).
Other countries* 2,4%
          Argentina 1,9%

(*) Other countries: colombia, Panama, Santander Overseas, Peru and Uruguay.


STRUCTURAL GAP LATIN AMERICA
Million euros
Local currency                                                      Not sensitive        0-6 months      6-12 months                 1-3 years              > 3 years      Total
Assets                                                                         50,273        85,009               19,659                 45,031                 21,114   221,086
Liabilities                                                                    54,232        73,683                 5,351                26,446                  4,536   164,248
Off-balance sheet                                                               2,637         9,829                -6,681                -5,747                 -1,024      -986
gap                                                                            -16,452        -1727                 7,626                 -1,109                15,554     3,891
Dollar                                                              Not sensitive        0-6 months      6-12 months                 1-3 years              > 3 years      Total
Assets                                                                          2,948        20,864                 3,983                 2,973                  7,643    38,411
Liabilities                                                                     2,419        22,432                 4,425                 3,730                  7,906    40,912
Off-balance sheet                                                               -2,546         315                   -433                 2,181                  1,469      982
gap                                                                             -2,341       -1,887                  -875                       5                1,206    -3,891


         ANNUAL REPORT 2010                                                                                                                                                  191
B3. Management of funding                                           ORGANISATION MODEL
and liquidity risk                                                  Area of decision
Management of financing and liquidity risk, fully consolidated
before the onset of the financial turbulence, has been one of
the main pillars behind the success of Banco Santander’s
                                                                                                     Markets’ committee
business model during this critical period.

This framework of liquidity management has not required
changes to make it function correctly and has given Santander                          convertible
                                                                                       currencies                            LatAm
a significant competitive advantage. Specifically, it has enabled
the group and its subsidiaries to successfully tackle the
business liquidity needs during the worst moments of the crisis
                                                                                         Local                               Local
and take advantage of growth opportunities offered by                                   ALcO 1                              ALcO 1
the market.

The great capacity to attract customer deposits, combined with                           Local                               Local
strong issuance activity in institutional markets, has given the                        ALcO 2                              ALcO 2
group the necessary liquidity to finance the acquisition of new
units in the last few years. it has also helped to bolster the
Bank’s capacity to create value, while at the same time further                          Local                               Local
improve the diversification of financing sources.                                       ALcO 3                              ALcO 3

The group’s liquidity management framework and its situation
at the end of 2010 is set out below.                                Management and control areas

1. Management framework                                                   Financial management                         Global market risk
Liquidity management is based on three fundamental pillars:             Responsible for executing                 Responsible for monitoring
                                                                      and monitoring their decisions             and controlling risks and limits
A) Organisational and governance model
   A solid model of governance that ensures the involvement
   of senior management and the board in taking decisions
   and facilitating their integration with the group’s global
   strategy.                                                        in this way, and in line with the best practices of governance,
                                                                    the group establishes a clear division between executing the
B) Management                                                       financial management strategy (the responsibility of the financial
   Adapted to each business’s liquidity needs, in accordance        management area) and monitoring and control (the
   with the decentralised organisational model.                     responsibility of market risks).

c) Balance sheet analysis and liquidity risk management             B. Management
   Profound analysis of the balance sheet and its evolution in      Structural liquidity management aims to finance the group’s
   order to support decision-taking.                                recurring activity in optimum conditions of maturity and cost
                                                                    and avoid assuming undesired liquidity risks.
A. Organisational and governance model
Decision-taking regarding structural risks is done by local ALcO    Liquidity and financing management is based on the following
committees in coordination with the markets committee. The          principles:
latter is the highest decision-taking body and coordinates all
                                                                    • Wide and very stable base of customer deposits: more than
global decisions that influence measurement, management and
                                                                      85% are retail and are captured in the group’s core markets
control of liquidity risk.
                                                                      by various units.
The committee is headed by the chairman of the Bank and             • Financing via medium and long-term issues of the balance
comprises the second vice-chairman and cEO, the third vice-           sheet’s stable liquidity needs (the gap between loans and
chairman (who is the maximum executive responsible for the            deposits), establishing a surplus of structural financing in
group’s risks), the chief financial officer and the senior vice-      order to be able to meet possible adverse situations.
president of risks and those responsible for the business and
analysis units.                                                     • Diversification of financing sources to reduce the risk in
                                                                      relation to:
There are also ALcO committees for convertible currencies such        – instruments/investors
as Latin American currencies.
                                                                      – markets/currencies
The financial management area manages structural risks                – maturities
including liquidity and the global risk area is responsible for
control. Both areas support the ALcO committees and present         • Strict control of short-term financing needs, within the
analysis and management proposals and also ensure                     group’s policy of minimising the degree of recourse to short-
compliance with the limits established.                               term funds.
                                                                    • Autonomy and responsibility of subsidiaries in managing the
                                                                      financing of liquidity, with no structural support from the
                                                                      parent bank.


192                                                                                                                       ANNUAL REPORT 2010
in practice, and applying these principles, the group’s liquidity
                                                                        ANALYSIS OF THE BALANCE SHEET AND MEASUREMENT
management consists of:                                                 OF LIQUIDITY RISK
• Drawing up every year the liquidity plan based on the
                                                                                  1. group strategy            2. current situation of liquidity
  financing needs derived from the budgets of each business
  and the methodology stated in section B. On the basis of
  these needs and bearing in mind prudent limits on recourse to
  short-term markets, the year’s issuance and securitisation plan
  is established by financial management.
                                                                                                       Analysis
• During the year the evolution of the balance sheet and financing            5. Financing            of liquidity
  needs is regularly monitored, giving rise to changes to the plan.              markets in                                    3. Projection of
                                                                                 stress                                           the balance
• Maintain an active presence in a wide and diversified series of                conditions                                       sheet and need
  financing markets. The group has nine significant and                                                                           for liquidity
  independent issuance units, which avoid dependence on a
  specific market and maintain available a wide capacity of                                    4. Balance sheet in stress
  issuance in various markets.                                                                    conditions

• And backed by all this, the group has an adequate structure
  of medium and long-term issues, well diversified by products
  (senior debt, subordinated, preferred shares, bonds,                  All of this enables the group to respond to a spectrum of
  securitisation) with an average conservative maturity (4.1 years      potential, adverse circumstances, anticipating the corresponding
  at the end of 2010), to which are added the securitisations.          contingency plans.
• All of this results in moderate needs of recourse to short-term
                                                                        These actions are in line with the practices being fostered from
  wholesale financing at the group level, which, as reflected in
                                                                        the Basel committee in order to strengthen the liquidity of
  the accompanying balance of liquidity, only represented 3% of
                                                                        banks, whose objective is to define a framework of principles
  net funds in 2010, down from 5% in 2009.
                                                                        and metrics that is still being analysed and discussed.
The subsidiaries have a large degree of autonomy to manage
their liquidity within grupo Santander’s decentralised financing        2. Current state of liquidity
model. Each one must budget their liquidity needs and assess            The group has an excellent structural position, with the capacity
their own capacity of recourse to the wholesale markets in order        to meet the new conditions of stress in the markets. This is
to establish the issuance and securitisation plan in coordination       underscored by:
with the parent bank.
                                                                        A) The robust balance sheet.
Only in the case of Santander consumer Finance does the                 B) The dynamics of financing.
parent bank (Banco Santander) provide the necessary liquidity
and always at the market price taking into account the maturity         A. Robust balance sheet
of the finance and the rating of the relevant unit. The group,          The balance sheet at the end of 2010 was solid, as befits the
within the strategy of optimising the use of liquidity, has             group’s retail nature. Lending, which accounted for 75% of net
followed a policy in the last few years of strongly reducing the        assets, was entirely financed by customer deposits and medium
recourse of Santander consumer Finance to the parent bank,              and long-term financing. Equally, the structural needs of
which is scheduled to be maintained in the coming years.                liquidity, represented by loans and fixed assets, were also totally
                                                                        financed by structural funds (deposits, medium and long-term
C. Analysis of the balance sheet and measurement                        financing and capital).
of liquidity risk
Taking decisions on financing and liquidity is based on a deep          As regards financing in wholesale markets, the group’s structure
understanding of the group’s current situation (environment,            is largely based on medium and long-term instruments (89% of
strategy, balance sheet and state of liquidity), the future liquidity   the total).
needs of businesses (projection of liquidity), as well as access to
and the situation of financing sources in the wholesale markets.        Short-term financing is a marginal part of the structure (3% of
                                                                        total funds) and it amply covered by liquid assets.
The objective is to ensure the group maintains optimum levels
of liquidity to cover its short and long-term needs, optimising         Lastly, the Bank has a large capacity of recourse to central banks
the impact of its cost on the income statement.                         to obtain immediate liquidity. At the end of 2010, total eligible
                                                                        assets which could be discounted in the various central banks to
This requires monitoring of the structure of balance sheets,            which the group has access via its subsidiaries amounted to
forecasting short and medium-term liquidity and establishing the        close to EUR 100,000 million.
basic metrics, in line with those reported in the next section.

various stress tests are also conducted taking into account
the additional needs that could arise from various extreme,
although possible, events. These could affect the various items
of the balance sheet and/or sources of financing differently
(degree of renewal of wholesale financing, deposit outflows,
deterioration in the value of liquid assets, etc), whether for
global market reasons or specific ones of the group.


     ANNUAL REPORT 2010                                                                                                                            193
We now set out the framework of the balance of liquidity,                                               B. Dynamics of financing
consolidated as the main metrics for monitoring the structural                                          The evolution of 2010 enabled Santander to continue to
position of liquidity:                                                                                  improve its structural liquidity position, backed by two
                                                                                                        management drivers, which proved to be very effective in the
GRUPO SANTANDER’S BALANCE SHEET OF LIQUIDITY                                                            current recession.
AT THE END OF 2010 *
%                                                                                                       The first one was that the group was able to increase its
                                                                                                        customer deposit base very significantly: EUR 109,000 million
                                                                                                        during 2010.

                                                                                                        This growth was due to two effects. On the one hand, the
                                                                                                        effort made to attract deposits via the branch networks, which
          customer loans               75%          85%         customer deposits                       benefited from the customers’ confidence in the group’s
                                                                and medium and                          liquidity and solvency. All of this made Santander the bank
                                                                long-term financing                     chosen by depositors in many markets: the so-called flight to
                                                                                                        quality effect.

                                        8%                                                              This increase occurred in an environment of deleveraging in
                 Fixed assets                                   Shareholders’ funds and
                                                    12%                                                 which deposits were spurred by the higher rate of household
                                       17%                      other liabilities
             Financial assets
                                                     3%         Short-term financing                    and corporate savings, while lending slowed down, reflecting
                                                                                                        the lower rates of consumption and investment in various
(*) Balance sheet for the purposes of liquidity management: total balance sheet net of trading
derivatives and interbank balances.
                                                                                                        countries.

                                                                                                        The evolution of 2010 was a good example of this, with the
                                                                                                        group’s deposits growing 22% and lending rising 6%, both
MONITORING METRICS                                                                                      excluding the perimeter effect.
%
Metrics                                                    2010                                  2009   This capturing of stable funds coupled with the trend of
Loans/net assets                                            75%                                  79%
                                                                                                        moderate credit growth enabled Santander to reduce the
                                                                                                        credit/deposit ratio to 117% from 135% in 2009 and 150%
customer deposits, insurance
                                                                                                        in 2008.
and medium and long-term
funding/loans                                             115%                                   106%
                                                                                                        The second driver was the high capacity of access to wholesale
customer deposits, insurance                                                                            financing markets, which the group can access regularly via its
and medium and long-term
                                                                                                        various units. This strategy enabled Santander to access different
financing, shareholders’ funds and
                                                                                                        institutional investors in a wide variety of instruments and
other liabilities/total loans and fixed assets 117%                                              110%
                                                                                                        diversity of maturities.
Short-term financing/
net liabilities                                               3%                                  5%    As a result, the group’s units captured during 2010 EUR 38,000
                                                                                                        million in medium and long-term issue in wholesale markets of
                                                                                                        senior debt and covered bonds, a significantly higher volume
As in the group, the balance sheets of the units of convertible                                         than in 2009. This capacity is backed by the group’s excellent
currencies and of Latin America maintain the same principles,                                           credit quality (AA from Standard & Poor’s and Aa2 from
within the philosophy of independence and responsibility in                                             Moody’s). Moreover, in all cases the appetite for securities by
their financing.                                                                                        investors is adjusted to placement prices that recognise the
                                                                                                        superior credit quality of the group and its subsidiaries.
A good example is that in the group’s main units customer
lending is totally financed by customer deposits plus medium                                            in short, a big rise in deposits, good access to medium and
and long-term wholesale financing.                                                                      long-term wholesale markets and the generation of liquidity by
                                                                                                        businesses in scenarios such as today’s explain the improvement
                                                                                                        in the group’s structural liquidity in the last 12 months. We thus
                                                                                                        began 2011 with an excellent liquidity situation and with
                                                                                                        reduced issuance needs. We have no concentration of
                                                                                                        maturities in the coming years when annual maturities will be
                                                                                                        less than in 2010 and, moreover, the dynamics of business
                                                                                                        mean it will not be necessary to cover all of them.


194                                                                                                                                                ANNUAL REPORT 2010
in any case, and while the current environment of uncertainty        D) STRUCTURED FINANCE OPERATIONS
persists, we will continue to implement a conservative policy        Despite the complicated economic environment, Santander
in issues, as we did in 2010, in order to bolster the already        achieved growth of 12% in this activity in 2010 to a committed
solid position.                                                      exposure of EUR 19,445 million at the end of the year,
                                                                     corresponding to 673 transactions, and increased both the
GRUPO ISSUES AND MATURITIES OF MEDIUM                                diversification by sectors and the internationalisation of
- AND LONG - TERM DEBT*                                              business. Leadership in project finance was strengthened with
Billion euros                                                        an exposure of EUR 13,258 million (490 transactions), followed
                                                                     by EUR 3,526 million in acquisition finance (37 transactions),
   Euro zone
                                                                     of which EUR 2,004 million related to 13 margin calls and
   Rest
                                                                     leveraged buy-outs (LBOs) and other forms amounted to
               gROUP iSSUES             gROUP MATURiTiES             EUR 2,661 million (146 transactions).
                       38
                                       31                            After analysing the impact on the solar energy portfolio in Spain
                                              30
                                                                     as a result of the entry into force of RDL 14 of December 23,
                       14
                                       6                             2010, no downward valuation adjustments in this type of
                                              8                      lending were considered necessary beyond EUR 104.5 million
                                                    22
                                                                     of loan-loss provisions for the whole portfolio of structured
                       24              25     22     4               finance. Santander’s net exposure in project finance dropped
                                                                     by almost EUR 1,300 million to EUR 11,957 million at the
                                                    18
                                                                     end of 2010, as a result of three partial transfer operations of
                                                                     the portfolio of projects to cLOs made in the two years prior
                                                                     to 2010.

                    2010              2011   2012   2013             As a result of integrating Alliance & Leicester into the group in
                                                                     2008, a portfolio of structured operations is maintained.
(*) Excludes securitisations
                                                                     it is a diversified portfolio of specialised financing operations.
                                                                     The exposure at the end of 2010 was 15.9% lower than in 2009
C ) STRUCTURAL EXCHANGE-RATE RISK/HEDGING                            at £ 4,936 million (EUR 5,735 million and 241 transactions).
OF RESULTS
Structural exchange rate risk arises from group operations in        E) EXPOSURES RELATED TO
currencies, mainly related to permanent financial investments,       COMPLEX STRUCTURED ASSETS
and the results and the dividends of these investments.              grupo Santander continues to have a very limited exposure to
                                                                     instruments or complex structured vehicles, reflecting a
This management is dynamic and seeks to limit the impact on          management culture one of whose hallmarks is prudence in risk
equity of currency depreciations and optimise the financial cost     management. At the end of 2010, the group had:
of hedging.
                                                                     • CDOs/CLOs: the position remained not very significant at
                                                                       EUR 486 million, 24% lower than in 2009. Most of this was
As regards the exchange-rate risk of permanent investments,
                                                                       due to the integration of the portfolio of Alliance & Leicester
the general policy is to finance them in the currency of the
                                                                       in 2008 (32% of the portfolio has an AAA rating and 77%
investment provided the depth of the market allows it and the
                                                                       A or higher).
cost is justified by the expected depreciation. One-off hedging is
also done when a local currency could weaken against the euro        • Non-agency CMOs and pass-through with underlying
beyond what the market estimates.                                      mortgage alt-A9: exposure of EUR 639 million at the end of
                                                                       2010 from the integration of Sovereign Bank in January 2009.
At the end of 2010, the largest exposures of a permanent               The position was 17% lower than in 2009.
nature (with potential impact on net worth) were concentrated
                                                                     • Hedge funds: the total exposure is not significant (EUR 540
in Brazilian reales, followed by sterling, Mexican pesos, US
                                                                       million at the end of 2010) and most of it is through financing
dollars and chilean pesos. The group covers part of these
                                                                       these funds (EUR 295 million), as the rest is direct participation
positions of a permanent nature with exchange-rate derivatives.
                                                                       in portfolio. This exposure has low levels of loan-to-value of
                                                                       around 35% (EUR 1,543 million of collateral). The risk with
in addition, financial management at the consolidated level is
                                                                       this type of counterparty is analysed case by case, establishing
responsible for exchange-rate management of the group’s
                                                                       the percentages of collateral on the basis of the features and
expected results and dividends in those units whose currency is
                                                                       assets of each fund. The exposure was 2% lower than
not the euro.
                                                                       in 2009.
                                                                     • Conduits: no exposure. The positions inherited from buying
                                                                       Alliance & Leicester were integrated, at market prices, into the
                                                                       group’s balance sheet in the third quarter of 2010.


                                                                     9. Alternative A-paper: mortgages originated in the US market which for various reasons are
                                                                        considered as having an intermediate risk level between prime and subprime mortgages
                                                                        (not having all the necessary information, loan-to-value levels higher than usual, etc).


         ANNUAL REPORT 2010                                                                                                                                        195
• Monolines: Santander’s exposure to bond insurance                                                    4.5 INTERNAL MODEL
  companies was EUR 274 million10 at the end of 2010, EUR
  244 million of it indirect exposure by virtue of the guarantee                                       The Bank of Spain approved at the end of 2010 the use of our
  provided by this type of entity to various financing or                                              internal market risk model for calculating regulatory capital in
  traditional securitisation operations. The exposure in this case                                     the trading portfolios of units in Spain, chile and Portugal. The
  is double default, as the primary underlying assets are of high                                      group’s objective is to gradually extend approval to the rest of
  credit quality (mainly AA). The small remaining amount is                                            units.
  direct exposure (for example, via purchase of protection from
  the risk of non-payment by any of these insurance companies                                          As a result of this approval, the regulatory capital of trading
  through a credit default swap). The exposure was 31% lower                                           activity is now calculated via advanced methods. The vaR
  than in 2009.                                                                                        calculated for the Market Risks Area is the fundamental metric
                                                                                                       and incorporates an incremental default risk.
The exposure to this type of instrument, the result of the
group’s usual operations, declined in 2010 and this was mainly
                                                                                                       We closely co-operate with the Bank of Spain in order to
due to integrating the positions of banks acquired by the group,
                                                                                                       advance in the perimeter susceptible of entering into the
such as Alliance & Leicester and Sovereign (in 2008 and 2009,
                                                                                                       internal model (at the geographic and operational levels), as
respectively). All these positions were known at the time of
                                                                                                       well as analysis of the impact of possible future changes, in line
purchase, having been duly provisioned. Since integration in the
                                                                                                       with the documents published by the Basel committee in
group, these positions have been reduced notably in order to
                                                                                                       December 2010 to strengthen the capital of banks.11
eventually eliminate them from the balance sheet. The exposure
emanating from A&L in cDOs, cLOs, Alt-A and conduits was
reduced by around 80% in 2010.

Santander’s policy for approving new transactions related to
these products remains very prudent and conservative; it is
subject to strict supervision by the group’s senior management.
Before approving a new transaction, product or underlying
asset, the risks division verifies:

• The existence of an appropriate valuation model to monitor
  the value of each exposure: Mark-to-Market, Mark-to-Model
  or Mark-to-Liquidity.
• The availability in the market of the necessary inputs to be
  able to implement this valuation model.
And provided these two points are always met:
• The availability of appropriate systems, duly adapted to
  calculate and monitor every day the results, positions and risks
  of new operations.
• The degree of liquidity of the product or underlying asset,
  in order to make possible their coverage when deemed
  opportune.


10. guarantees provided by monolines for bonds issued by US states (municipal bonds) are not
    considered as exposure. As a result of the acquisition of Sovereign Bank, the group integrated a   11. “Basel iii: A global regulatory framework for more resilient banks and banking systems” and
    EUR 1,328 million portfolio of these bonds.                                                            “Basel iii: international framework for liquidity risk measurement, standards and monitoring.”


196                                                                                                                                                                        ANNUAL REPORT 2010
5. OPERATiONAL RiSk


DEFINITION AND OBJECTIVES
grupo Santander defines operational risk (OR) as the risk of         Management is based on the following elements:
losses from defects or failures in its internal processes,
employees or systems, or those arising from unforeseen
circumstances. They are, in general, purely operational events,                                             ement
which makes them different from market or credit risks,                                                 asur          Con
                                                                                                      Me essment    Mit trol
although they also include external risks, such as natural                                              Ass            iga
                                                                                                                          tio


                                                                                         isk n
                                                                                     of r atio
disasters.


                                                                                                                            n
                                                                                            s
                                                                                        tific


                                                                                                                                   Info
                                                                                   Iden
The objective in control and management of operational risk is to


                                                                                                                                       rmation
identify, measure/valuate, control/mitigate and monitor this risk.

The group’s priority is to identify and eliminate risk focuses,
                                                                                     Po l i c m e t
regardless of whether they produce losses or not. Measurement
                                                                                          and
                                                                                             ies
also helps to establish priorities in management of operational


                                                                                                                            to ic a l
                                                                                                 ,p


                                                                                                                              o ls
                                                                                                                               g
risk.                                                                                             o                          lo
                                                                                               od ce d u
                                                                                                    r

                                                                                                                          no
                                                                                                      h


                                                                                                 o lo re s          Te c h p ort
grupo Santander opted, from the beginning, to use the                                                gie               sup
                                                                                                         s
standard method for calculating regulatory capital by
operational risk, envisaged in the BiS ii rules. The group is
weighing up the best moment to adopt the focus of advanced
models (AMs), bearing in mind that a) the short-term priority in
management of operational risk centres on its mitigation; and b)     The different phases of the technological and operational risk
most of the regulatory requirements established for being able       management model entail:
to adopt the AMs must be incorporated into the standard              • identify the operational risk inherent in all activities, products,
model (already achieved in the case of grupo Santander’s               processes and banking systems.
operational risk management model).
                                                                     • Measure and assess the operational risk objectively,
MANAGEMENT MODEL                                                       continuously and in line with the regulatory standards (Basel ii,
                                                                       Bank of Spain) and the banking industry, establishing risk
The organisational model for controlling and managing risks is
                                                                       tolerance levels.
the result of adapting to the new BiS ii environment, which
establishes three levels of control:                                 • continuously monitor the exposure of operational risk in order
                                                                       to detect the levels of unassumed risk, implement control
• First level: control functions conducted by the group’s units.
                                                                       procedures, improve internal knowledge and mitigate losses.
• Second level: functions carried out by the corporate areas.
                                                                     • Establish mitigation measures that eliminate or minimise
• Third level: integral control functions by the risks division-       operational risk.
  integral control area and internal validation of risk.
                                                                     • Produce regular reports on the exposure to operational risk
The technology and operations division is responsible for              and the level of control for senior management and the
management and control of operational risk. Within this                group’s areas/units, as well as inform the market and
division, the corporate area of technological and operational          regulatory bodies.
risk, established in 2008, defines policies as well as managing
                                                                     • Define and implement systems that enable operational risk
and controlling these risks. The implementation, integration and
                                                                       exposures to be watched over and controlled and integrated
local adjustment of the policies and guidelines established by
                                                                       into the group’s daily management, taking advantage of
this area is the responsibility of local executives in each unit.
                                                                       existing technology and seeking the maximum
                                                                       computerisation of applications.
This structure for operational risk management is based on the
knowledge and experience of executives and professionals of          • Define and document operational risk management policies,
the group’s various units. Particular importance is attached to        and introduce methodologies for managing this risk in
the role of local executives.                                          accordance with regulations and best practices.


     ANNUAL REPORT 2010                                                                                                                          197
grupo Santander’s operational risk management model                  • Processes are conducted to conciliate data bases with
contributes the following advantages:                                  accounting data.
• integral and effective management of operational risk              By consolidating the total information received, the group’s
  (identification, measurement/assessment, control/mitigation        operational risk profile is reflected in the following chart:
  and information).
• Better knowledge of existing and potential operational risks       DISTRIBUTION OF AMOUNT AND FREQUENCY
  and assigning responsibility for them to the business and          OF EVENTS BY CATEGORY (2010)
  support lines.                                                     %
                                                                         Amount of events
• Operational risk information helps to improve the processes


                                                                                                                            43.3
                                                                         Frequency of events
  and controls, reduce losses and the volatility of revenues.


                                                                                                   36.3
                                                                                       33.3


                                                                                                                                                                                             30.5
                                                                                                                                        29.3
IMPLEMENTING THE MODEL:
GLOBAL INITIATIVES AND RESULTS
The main functions, activities and global initiatives are:


                                                                                                                                                                                15.4
• Define and implement the framework for corporate
  management of technological and operational risk


                                                                                                                                               3.9


                                                                                                                                                                          2.1
                                                                       1.7


                                                                                                                                                         1.7
  management.


                                                                                 0.0


                                                                                                                                                               0.9
                                                                                                                      0.0
                                                                                                          1.4
• Designate coordinators and create operational risk                         I                II                III                IV                V               VI                VII
  departments.                                                       i. internal fraud
                                                                     ii. External fraud
• Training and interchange of experiences: continuation of           iii. Employment, health and security practices at work
                                                                     iv. Practices with clients, products and business
  best practices within the group.                                   v. Damage in physical assets
                                                                     vi. interruption of business and failures in systems
• Foster mitigation plans: ensure control of implementation          vii. Execution, delivery and management of processes
  of corrective measures as well as ongoing projects.
• Ensure effective management of operational and                     The group exercises supervision and control of technological
  technological risk.                                                and operational risk via its governance organs. The various areas
                                                                     of local resources hold meetings of monitoring committees with
• Supply adequate information on this type of risk.
                                                                     the corporate area every month and by country. in 2010, the
The corporate function strengthens management of                     group’s management committee included treatment of relevant
technological risk, strengthening the following aspects among        aspects in the management and mitigation of operational risk
others:                                                              on a regular basis.
• The security of the information systems.
                                                                     This management also led to a reduction in the gross loss,
• The contingency and business continuity plans.                     which was around 3% on a like-for-like basis.
• Management of risk associated with the use of technologies
                                                                     in general, combined with the control of losses, all the group’s
  (development and maintenance of applications, design,
                                                                     units continued to improve aspects related to management of
  implementation and maintenance of technology platforms,
                                                                     operational risk as can be confirmed in the annual review carried
  output of computer processes, etc).
                                                                     out by internal auditing.
Almost all the group’s units have been incorporated to the
model with a high degree of uniformity. However, due to the          The group, via approval in the risk committee, formalises every
different pace of implementation, phases, schedules and the          year the operational risk profiles and limits. A risk appetite is also
historical depth of the respective data bases, the degree of         established which must be in low and medium-low profiles on
progress varies from country to country.                             the basis of the measurement of various ratios. Limits are set by
                                                                     country and for the group on the basis of the gross loss/gross
On a general basis:                                                  income ratio.
• Data bases of operational incidents that are classified are
  received every month. The capturing of events related to           in addition, the group’s units conduct self-evaluation risk
  operational risk are not truncated (i.e. without exclusions for    exercises in terms of frequency and severity. This enables limits
  reasons of amount and with both the accounting impact              to be set for the following year on the basis of the distribution
  —including positive effects— as well as the non-accounting         and modeling of expected loss/unexpected.
  impact).
• Self-assessment questionnaires filled in by almost all the
  group’s units are received and analysed.
• A corporate system of operational risk indicators is in place.
  it is in continuous evolution and coordination with the internal
  control area.
• The main and most frequent events are identified and
  analysed, and mitigation measures taken which, in significant
  cases, are disseminated to the group’s other units as a best
  practices guide.


198                                                                                                                                                      ANNUAL REPORT 2010
ANALYSIS AND MONITORING OF                                         INSURANCE IN THE MANAGEMENT
CONTROLS IN MARKET OPERATIONS                                      OF OPERATIONAL RISK
The complexity of financial instruments makes it necessary for     grupo Santander regards insurance as a key element in
the group to continuously strengthen operating control of this     management of operational risk. The area responsible for
activity, enhancing the very demanding and conservative risk       operational risk has been closely cooperating with the group’s
and operating principles that grupo Santander has been             insurance area since 2004 in all those activities that entail
regularly applying.                                                improvements in both areas. For example:
                                                                   • cooperation in the exposure of the group’s operational risk
Over and above regular tracking of all aspects regarding
                                                                     control and management model to insurance and reinsurance
operating control, all of the group’s units paid more attention
                                                                     companies.
to the following aspects, so that the review is validated every
month by each unit’s management committee. Of note are the         • Analysis and monitoring of recommendations and suggestions
following:                                                           to improve operational risks made by insurance companies,
                                                                     via prior audits conducted by specialised companies, as well
• Review of the valuation models and in general the valuation of
                                                                     as their subsequent implementation.
  portfolios.
                                                                   • Exchange of information generated in both areas in order to
• capturing processes and independent validation of prices.
                                                                     strengthen the quality of the data bases of errors and the
• Appropriate confirmation of operations with counterparties.        perimeter of coverage of the insurance policies for the various
                                                                     operational risks.
• Reviewing cancellations/modifications of operations.
                                                                   • close cooperation between local operational risk executives
• Reviewing and monitoring the effectiveness of guarantees,
                                                                     and local coordinators of insurance to strengthen mitigation
  collateral and mitigation of risk.
                                                                     of operational risk.
                                                                   • Regular meetings on specific activities, states of situation and
CORPORATE INFORMATION
                                                                     projects in both areas.
The corporate area of control of technological and operational
risk has a system for integral management of operational risk      • Active participation of both areas in global sourcing of
information, which every quarter consolidates the information        insurance, the group’s maximum technical body for defining
available from each country/unit in the operational risk sphere      coverage strategies and contracting insurance.
and gives a global vision with the following features:
• Two levels of information: one corporate and the other
  individualised for each country/unit.
• Dissemination of the best practices among countries/units
  of grupo Santander, obtained from the combined study
  of the results of qualitative and quantitative analysis of
  operational risk.

information is also prepared on the following aspects:
• grupo Santander’s management model for operational risk.
• Human resources and perimeter of action
• Analysis of the data base of errors and events
• Operational risk cost and accounting conciliation
• Self-assessment questionnaires
• indicators
• Mitigating measures/asset management
• contingency plans
• Regulatory framework: BiS ii
• insurance
This information acts as the basis for meeting the needs of
reporting to the board’s risk committee, senior management,
regulators, rating agencies, etc.


     ANNUAL REPORT 2010                                                                                                            199
6. REPUTATiONAL RiSk


grupo Santander defines reputational risk as that linked to the       CORPORATE COMMITTEE OF PRODUCT AND
perception of the Bank by its various stakeholders, both internal     SERVICES MARKETING
and external, of its activity, and which could have an adverse        This committee is chaired by the group’s secretary general and
impact on results, capital or business development expectations.      integrated by representatives of the divisions of risk, financial
This risk relates to juridical, economic-financial, ethical, social   management, technology and operations, secretariat general,
and environmental aspects, among others.                              general intervention and control, internal auditing, retail banking,
                                                                      Santander global Banking & Markets, private banking, asset
various of the group’s governance structures are involved in          management and insurance. it is the group’s maximum decision-
reputational risk management, depending on where the risk             making body for approving and monitoring products and services.
comes from. The audit and compliance committee helps the
board to supervise compliance with the group’s code of                The committee pays particular attention to adjusting the
conduct in the securities markets, the manuals and the                product or service to the framework where it is going to be sold
procedures to prevent money-laundering and, in general,               and especially to ensuring that:
the Bank’s rules of governance and compliance. it formulates
the proposals needed for their improvement.                           • Each product or service is sold by someone who knows how
                                                                        to sell it.
Management of reputational risk which might arise from an             • The client knows what he or she is investing in and the risk of
inadequate sale of products or an incorrect provision of services       each product or service and this can be accredited with the
by the group is mainly conducted by the following bodies and            relevant documents.
procedures:
                                                                      • The product or service fits the customer’s risk profile.
THE RISK COMMITTEE                                                    • Each product or service is sold where it can be, not only for
This committee is the responsibility of board, as part of its           legal or tax reasons (i.e. it fits into the legal and tax regime of
supervisory function. it defines the group’s risk policy.               each country), but also on the basis of the prevailing financial
                                                                        culture.
As the maximum body responsible for global management of
                                                                      • When a product or service is approved the maximum limits for
risk and of all types of banking operations, the committee
                                                                        placement are set.
assesses, with the support of the division of the secretary
general, reputational risk in its sphere of activity and decisions.   Marketing committees are created at the local level which
                                                                      channel to the corporate committee of marketing new product
                                                                      approval proposals, after issuing a favourable opinion, and
                                                                      approve products that are not new and marketing campaigns.
                                                                      in the respective approval processes, the marketing committees
                                                                      operate with a risk focus and from the double perspective of
                                                                      Bank/customer.

                                                                      The corporate marketing committee (cMc) held 21 meetings in
                                                                      2010 and the local committee of marketing (LcM) of retail
                                                                      banking Spain met 10 times, analysing a total of 237
                                                                      products/services (197 were new products/services submitted to
                                                                      the cMc and 40 were approved by the LcM as they were not
                                                                      new products/services that fitted into those previously
                                                                      authorised by the cMc).

                                                                      Of the 197 products/services submitted to the cMc, the number
                                                                      per country/unit and their share of the total was as follows:
                                                                      Spain 113 (57.4%); chile: 15 (7.6%); Portugal: 14 (7.1%);
                                                                      Mexico: 12 (6.1%); Uk: 11 (5.6%); Brazil: 11 (5.6%);
                                                                      US: 9 (4.6%); Argentina: 4 (2%); colombia: 2 (1%); Puerto Rico:
                                                                      2 (1%); italy: 2 (1%); Peru: 1 (0.5%); and Uruguay: 1 (0.5%).


200                                                                                                                 ANNUAL REPORT 2010
GLOBAL CONSULTATIVE COMMITTEE                                       MANUAL OF PROCEDURES FOR THE SALE OF
The global consultative committee (gcc) is the advisory body        FINANCIAL PRODUCTS
for the corporate committee of marketing and comprises              The manual, which has been used by Banco Santander since
representatives of areas that contribute vision of regulatory and   2004 for the retail marketing of financial products in Spain,
market risks. This committee meets every quarter and can            covers investment services for financial products including
recommend the review of products affected by regulatory             securities and other fixed-income or equity instruments, money
changes, in markets, deterioration of solvency (country, sectors    market instruments, participations in collective investment
and companies) or by changes in the group’s vision of markets       institutions, savings and investment insurance, traded derivatives
in the medium and long term.                                        and OTc and atypical financial contracts. The corporate
                                                                    committee of marketing can also include other instruments in
CORPORATE OFFICE OF REPUTATIONAL RISK                               the sphere of the manual of procedures, as has been the case
MANAGEMENT                                                          with structured deposits, savings insurance or investment and
integrated in the corporate area of compliance and reputational     pension plans.
risk, with the division of the general secretary, this office
provides the corresponding organs of governance with the            in 2010 90 products/services subject to the manual were
necessary information to:                                           submitted for approval.
1. adequately analyse the risk to be approved, with a two-
   pronged purpose: impact on the Bank and on the customer.
2. monitoring of products throughout their life cycle.
During 2010, 52 products or services not considered to be new
were presented to the corporate office for reputational risk
management for its approval. The office also resolved 110
consultations from various areas and countries. The products
approved by the office are successive issues of products
previously approved by the corporate committee of marketing
or the local committee of marketing of retail banking Spain,
after having delegated them this faculty in the branch.


     ANNUAL REPORT 2010                                                                                                            201
7. ADJUSTMENT TO THE NEW
   REgULATORy FRAMEWORk


grupo Santander participated during 2010 in impact studies            in operational risk, the group believes that development of
promoted by the Basel committee and cEBS, and coordinated             the internal model should be largely based on the accumulated
at the local level by the Bank of Spain to calibrate the new          experience of the entity via the corporate guidelines and criteria
regulations denominated Basel iii and whose implementation            established after assuming their control and which are precisely
involves establishing new standards for capital and liquidity,        hallmarks of Santander. The group has made many acquisitions
with stricter criteria and standardised at the international level.   in the last few years that make necessary a longer period of
                                                                      maturity to develop the internal model based on the own
Santander has very solid capital ratios, adjusted to the business     management experience of the various entities. However,
model and to its risk profile and which put it in a comfortable       although for the time being grupo Santander has decided to
position to amply meet Basel iii. The impact analysis shows no        adhere to the standard approach for calculating regulatory
significant affects on the group’s high solvency ratios, which        capital, it envisages the possibility of adopting the advanced
benefit from a considerable organic capital generation capacity.      management approach (AMA) once it has gathered sufficient
The new capital regulations will be gradually implemented             information on the basis of its own management model in order
between 2013 and 2019.                                                to strengthen to the maximum the virtues that characterise
                                                                      the group.
grupo Santander has proposed adopting, during the next few
years, the advanced internal ratings based (AiRB) models of           in Pillar ii grupo Santander uses an economic capital approach
Basel ii for almost all its banks (up to covering more than 90%       to quantify its global risk profile and its solvency position within
of net exposure of the credit portfolio under these models).          the process of self-evaluation conducted at the consolidated
Meeting this objective in the short term will also be conditioned     level (icAAP). This process, which is complemented by the
by the acquisition of new entities as well as by the need of          qualitative description of the risk management and internal
coordination among supervisors of the validation processes of         control systems, is revised by the internal audit and internal
internal models. The group operates in countries where the            validation teams, and is subject to a corporate governance
legal framework between supervisors is the same as in Europe          framework that culminates with its approval by the board.
via the capital directive. However, in other areas, the same          Furthermore, the board establishes every year the strategic
process is subject to the collaboration framework between the         elements regarding risk appetite and solvency objectives. The
supervisor in the home country and that in the host country           economic capital model considers features not included in Pillar
with different legislations, which, in practice, means adapting to    1 (concentration, interest rate and business risks). The group’s
different criteria and calendars in order to attain authorisation     diversification compensates the additional capital required for
for the use of advanced models on a consolidated basis.               these risks.

With this objective, Santander continued in 2010 to gradually         grupo Santander, in accordance with the capital requirements
install the necessary technology platforms and methodological         set out in the European Directive and the regulations of the
developments which will make it possible to progressively apply       Bank of Spain, publishes every year the Report with Prudential
advanced internal models for calculating regulatory capital in        Relevance. This report, published for the first time with data at
the rest of the group’s units. At the moment, grupo Santander         December 31, 2008, clearly shows the transparency
has the supervisory authorisation to use advanced focuses for         requirements regarding Pillar iii. grupo Santander regards the
calculating the regulatory capital requirements by credit risk for    requirements providing the market with information as vital for
the parent bank and the main subsidiaries in Spain, the Uk and        complementing the minimum capital requirements demanded
Portugal (close to two-thirds of its total exposure at the end of     by Pillar 1, and the supervisory exam process conducted via Pillar
2010). The strategy of implementing Basel in the group is             ii. it is incorporating to its Pillar iii report the recommendations
focused on achieving use of advanced models in the main               of the committee of European Banking Supervisors (cEBS) in
institutions in the Americas and consumer banking in Europe.          order to become an international benchmark in matters of
                                                                      transparency to the market as already happens in its annual
As regards the rest of risks explicitly envisaged in Pillar 1 of      report.
Basel, in market risk we have authorisation to use its internal
model for the trading activity of Madrid treasury and during          As well as the process of implementing the advanced models in
2010 we obtained authorisation for the units in chile and             various of the group’s units, Santander is carrying out an
Portugal, thus continuing the gradual installation for the rest       ambitious training process on Basel at all levels which is
of the units presented to the Bank of Spain.                          reaching a large number of employees in all areas and divisions,


202                                                                                                                ANNUAL REPORT 2010
with a particular impact on those most affected by the changes
resulting from adopting the new international standards in
matters of capital.

INTERNAL VALIDATION OF
INTERNAL RISK MODELS
internal validation is a prerequisite for supervisory validation.
A specialised unit of Santander, with complete independence,
obtains a technical opinion on whether the internal model is
appropriate for the purposes used (internal and regulatory) and
concludes on its usefulness and effectiveness.

As well as the regulatory requirement, internal validation is also
a fundamental support for the board’s committee of risks and
local committees of risks in their responsibilities of authorising
the use (management and regulatory) of models and their
periodic review.

Santander’s internal validation covers both credit risk and
market risk models and those that set the prices of financial
assets as well as the economic capital model. The scope of
validation includes not only the most theoretical or
methodological aspects but also the technology systems and the
quality of data that make implementation effective and, in
general, all relevant aspects for management of risk (controls,
reporting, uses, involvement of senior management, etc).

The function of internal validation is located, at the corporate
level, within the area of integral control and internal validation
of risk which reports directly to the group’s third vice-chairman
and chairman of the board’s risk committee. The function is
global and corporate in order to ensure homogeneous
application. This is done via four regional centres in Madrid,
London, Sao Paulo and New york. These centres report to the
corporate centre, which ensures uniformity in the development
of their activities. This facilitates application of a common
methodology supported by a series of tools developed internally
in Santander which provide a robust corporate framework for
use in all the group’s units and which automate certain
verifications in order to ensure the reviews are conducted
efficiently.

Moreover, grupo Santander’s corporate framework of internal
validation is fully aligned with the criteria for internal validation
of advanced models issued by the Bank of Spain. The criterion
of separation of functions is maintained between the units of
internal validation and internal auditing which, as the last
element of control in the group, is responsible for reviewing the
methodology, tools and work done by internal validation and
giving its opinion on its degree of effective independence.


     ANNUAL REPORT 2010                                                 203
8. EcONOMic cAPiTAL


The concept of economic capital has traditionally been                 GLOBAL RISK ANALYSIS PROFILE
contrasted with that of regulatory capital, as this is the one         The group’s risk profile at December 31, 2010, measured in
required for the regulation of solvency. The new Basel capital         terms of economic capital, is distributed by types of risk and the
framework clearly brings both concepts closer together.                main business units, is reflected below:
While Pillar 1 determines the minimum regulatory capital
requirements, Pillar ii quantifies, via economic capital,
the group’s global solvency position.                                  DISTRIBUTION OF ECONOMIC CAPITAL
                                                                       By types of risk
The group’s model of economic capital quantifies the
                                                                                                       credit 62%
consolidated risk profile taking into account all the significant
risks of activity, as well as the consubstantial diversification
effect on a multinational and multi-business group like
Santander. This economic capital model serves as the group’s
base for preparing its self-assessment of capital report in
accordance with Bank of Spain regulations under the Basel ii
Pillar 2 framework.
                                                                                   Material
                                                                                 assets 2%
The concept of diversification is fundamental for appropriately
                                                                                                                              Equity
measuring the risk profile of a global activity group. Although it                 Business 6%                                non trading 5%
is an intuitive concept and one present in risk management                                                                Fx structural 6%
since banking began, we can also explain diversification as the                           Operational 10%            Trading 1%
                                                                                                            ALM 8%
fact that the correlation between various risks is imperfect and
so the largest events of losses do not happen simultaneously in
all portfolios or by types of risk. The sum of the economic            DISTRIBUTION OF ECONOMIC CAPITAL
capital of the different portfolios and types of risk, considered in   By business units
isolation, is more than the group’s total economic capital. in
                                                                                                  continental Europe 38%
other words, the group’s overall risk is less than the sum of its
parts considered separately.

in addition, within the framework of the model for
measurement and aggregation of economic capital, the risk of
concentration for wholesale portfolios (large companies, banks                                                                  Uk 11%
                                                                                    Financial
and sovereigns) is also considered both in its dimension of               management and
exposure as well as concentration by sectors and countries.              equity stakes 13%
The existence of concentration in a country or a product in retail
portfolios is captured by applying an appropriate model of                        Sovereign 6%
correlations.
                                                                                                Rest of              Brazil 20%
                                                                                                Latin America 12%


204                                                                                                                     ANNUAL REPORT 2010
The distribution of economic capital among the main business           RETURN ON RISK ADJUSTED CAPITAL (RORAC)
units reflects the diversification of the group’s activity and risk.   AND CREATION OF VALUE
The group’s diversification is going to increase even more with        grupo Santander has been using RORAc methodology in its
the acquisitions announced in the last few months in Poland,           credit risk management since 1993 in order to:
germany, the Uk, Mexico and the US, among others.
                                                                       • calculate the consumption of economic capital and the return
                                                                         on it of the group’s business units, as well as segments,
continental Europe accounts for almost 40% of the group’s
                                                                         portfolios and customers, in order to facilitate optimum
capital, Latin America including Brazil (20%) almost one-third,
                                                                         assigning of economic capital.
the Uk for 11%, and Sovereign 6%, while the corporate area of
financial management and equity stakes, which assumes the risk         • Budget the capital consumption and RORAc of the group’s
from the structural exchange-rate position (derived from stakes          business units, including them in their remuneration plans.
in subsidiaries abroad denominated in non-euro currencies) and
                                                                       • Analyze and set prices during the decision-taking process for
most of the equity stakes accounts for 13%.
                                                                         operations (admission) and clients (monitoring).
The economic capital at December 31, 2010 was EUR 46,526               RORAc methodology enables one to compare, on a like-for-like
million, including minority interests.                                 basis, the return on operations, customers, portfolios and
                                                                       businesses, identifying those that obtain a risk adjusted return
The benefit of diversification envisaged in the economic capital       higher than the cost of the group’s capital, aligning
model, including both the intra-risks (assimilated to geographic)      management of risk and business with the intention to
as well as inter-risks, amounted to around 22% at the end              maximise the creation of value, the ultimate aim of the group’s
of 2010.                                                               senior management.

The group also conducts capital planning with the main                 The group regularly assesses the level and evolution of value
objective of obtaining future projections of economic and              creation (vc) and the risk adjusted return (RORAc) of its main
regulatory capital and so be able to assess situations of capital      business units. The vc is the profit generated above the cost of
sufficiency in various scenarios. Each scenario incorporates the       the economic capital (Ec) employed, and is calculated as
forecasts of results in a coherent way, both with their strategic      follows:
objectives (organic growth, M&A, pay-out ratio, etc) as well as
with the evolution of the economic situation and in the face of          Value creation =profit – (average EC x cost of capital)
stress situations. Possible capital management strategies are
identified that enable the Bank’s solvency situation to be             The economic profit is obtained by making the necessary
optimised as well as the return on capital.                            adjustments to attributable profit so as to extract just the
                                                                       recurrent profit that each unit generates in the year of
                                                                       its activity.

                                                                       The minimum return on capital that an operation must attain
                                                                       is determined by the cost of capital, which is the minimum
                                                                       required by shareholders. it is calculated objectively by adding
                                                                       to the free return of risk the premium that shareholders demand
                                                                       to invest in our group. This premium depends essentially on the
                                                                       degree of volatility in the price of our shares in relation to the
                                                                       market’s performance. The cost of capital in 2010 applied to
                                                                       the group’s various units was 13.606%.


     ANNUAL REPORT 2010                                                                                                                205
A positive return from an operation or portfolio means it is
contributing to the group’s profits, but it is not really creating
shareholder value unless that return exceeds the cost of capital.

All the main business units obtained in 2010 a RORAc higher
than the cost of capital. The creation of value and the RORAc
for the group’s main business areas are shown below:

MAIN SEGMENTS
Million euros
Main segments                            RORAc      creation of value
continental Europe                        21.2%                1,444
Uk                                        38.5%                1,284
Latin America                             36.5%                3,549
Sovereign                                 14.0%                   13
Subtotal of operating areas              28.3%                6,290
Financial management and equity stakes   -44.3%               -3,879
Group total                              18.5%                2,411


The group’s RORAc comfortably exceeded the cost of capital
estimated for 2010 and stood at 18.5%. The creation of value
(i.e. the economic profit less the average cost of capital used to
achieve it) amounted to EUR 2,411 million.


206                                                                     ANNUAL REPORT 2010
9. RiSk TRAiNiNg
   AcTiviviES


Santander has a corporate school of risks. its purpose is to help    HOURS OF TRAINING
to consolidate the risk management culture in Santander and
ensure that all employees in the risks area are trained and


                                                                                                   26,665
developed with the same criteria.

The school, which gave a total of 26,665 hours of training


                                                                                          21,479
to 2,849 employees in 2010 in 116 sessions, is the base for
strengthening Santander’s leadership in this sphere and
continuously enhancing the skills of its staff.

it also trains staff from other business segments, particularly in
the retail banking area, and aligns the requirements of risk
management with business goals.


                                                                                         2009 2010


     ANNUAL REPORT 2010                                                                                     207
APPENDICES
210   THE COMPLIANCE FUNCTION
214   HISTORICAL DATA
216   GENERAL INFORMATION
Appendices


THE COMPLIANCE FUNCTION


                                                                           COMPLIANCE AND
                                                                           REPUTATIONAL RISK
The compliance area is part of the General Secretariat division and        Reputational risk is that arising from the perception of the Bank by
is responsible for global management of the Group’s reputational           its various stakeholders, both internal and external, of its activity,
risks, compliance and anti-money laundering. The objectives of             and which could have an adverse impact on results, capital or
compliance are to minimise the probability of irregularities and to        business development expectations. This risk relates to juridical,
identify, report and quickly resolve those that might occur.               economic-financial, ethical, social and environmental aspects,
                                                                           among others.
Compliance:
                                                                           Compliance risk is the risk of receiving sanctions, economic or
(i) provides advice to senior management on the regulations and            otherwise, or other forms of disciplinary measures from supervisory
    standards of conduct applicable and their evolution;                   bodies for failing to comply with laws, regulations, rules, self-
                                                                           regulation standards and codes of conduct applied to its activities.
(ii) co-operates with senior management in creating a culture of
     compliance within the Group and establishes written policies          Money laundering is participating in any operation whose purpose
     and procedures;                                                       is to hide or mask the nature or origin or funds from criminal
                                                                           activities. Financing of terrorism is understood as providing or
(iii) identifies and measures the risks of compliance associated with      collecting funds, by any direct or indirect means, in order to use
      the Group’s activity and assesses regularly whether the policies     them or in the knowledge that they will be wholly or partly used to
      and procedures for managing them are adequate;                       commit an act of terrorism.

(iv)conducts the tests that are needed to verify that the activities are
    undertaken in accordance with the policies and procedures; and

(v) informs senior management of the conclusions.

The compliance function focuses on the operational spheres where
the Group’s exposure to reputational and compliance risks is the
greatest:

• Conduct in the securities markets.
• Marketing of products and services.
• Prevention of money laundering and financing of terrorism.
• Relations with regulators and supervisors.
• Preparing and disseminating the Group’s institutional
  information.


210                                                                                                                       ANNUAL REPORT 2010
GOVERNANCE OF THE
COMPLIANCE FUNCTION
The board, the audit and compliance committee and other            CODES OF CONDUCT
organs of the Group, with varying levels of responsibility and     The functions of compliance management with regard to the
different tasks, supervise the compliance function in Grupo        Code of Conduct in the Securities Markets (CCSM) are as
Santander. The board approves the corporate policy and receives    follows:
information on how it is applied, while the audit and
compliance committee supervises compliance with the Code of        1. Register and control sensitive information known and/or
Conduct in the Securities Markets and with the manuals and            generated by the Group;
procedures for preventing money laundering, and also reviews
the compliance of actions and measures resulting from the          2. Maintain the lists of securities affected and related
reports or activities of supervisors.                                 personnel, and watch the transactions conducted with these
                                                                      securities;
Compliance management reports on an ongoing basis to the
board via the audit and compliance committee. The chief            3. Monitor transactions with restricted securities according to
compliance officer took part in 10 of the 11 meetings held by         the type of activity, portfolios or collectives to whom the
this committee in 2010.                                               restriction is applicable;

The compliance committee, which is the organ responsible for       4. Receive and deal with communications and requests to carry
all matters related to the compliance function that are not           out own account transactions;
specific ones of marketing products and services or the
prevention of money laundering and the financing of terrorism,     5. Control own account transactions of the personnel subject
met five times.                                                       to the CCSM;

The corporate committee of marketing, which is responsible for     6. Manage failures to comply;
establishing processes within the Group relating to the approval
and monitoring of products and services offered to customers,      7. Resolve doubts on the CCSM;
held twenty-one meetings. The analysis and resolution
committee, the most senior body specializing in anti-money         8. Resolve and register, in the sphere of its responsibilities,
laundering and terrorism financing prevention related matters,        conflicts of interest and situations that could give rise to
met four times.                                                       them;

                                                                   9. Assess and manage conflicts arising from the analysis
                                                                      activity;

                                                                   10. Keep the necessary records to control compliance with the
                                                                       obligations envisaged in the CCSM;

                                                                   11. Develop ordinary contact with regulators;

                                                                   12. Organise the training and, in general, conduct the actions
                                                                       needed to apply the code; and

                                                                   13. Analyse activities suspicious of constituting abuse of the
                                                                       market and, where appropriate, report them to the
                                                                       supervisory authorities.


     INFORME ANUAL 2010                                                                                                              211
Appendices


At the meeting of the audit and compliance committee on 15         OTHER COMPLIANCE ACTIVITIES
December, 2010, the chief compliance officer reported on the       Compliance management continued to carry out other activities
entry into force on 23 December of the Organic Law 5 of 22         in 2010 inherent to its sphere, such as reviewing the Bank’s
June, 2010, on the reform of the penal code, considering it        internal rules (circulars and various notes) before their
necessary to have in the Group a compliance programme that         publication, ensuring treasury stock operations are in line with
establishes regulations and procedures that try to prevent the     internal and external rules, maintaining the section on
risk of non-compliance in the Group and which strengthen the       regulatory information on the corporate website, reviewing the
corporate culture of compliance that Santander has been            vote recommendation reports for shareholders’ meetings drawn
enforcing intensely for years.                                     up by the leading proxy agencies in this area and sending
                                                                   periodic regulatory information to the supervisory bodies
The committee was also informed of the need to modify the          (treasury stock, significant equity stakes, opening and closing of
General Code of Conduct as it is the core element of the           branches, etc).
compliance programme and in order to give room to activities
which could give rise to penal responsibilities for the Bank and   ANTI-MONEY LAUNDERING
which until now were not explicitly contemplated in the code.      It is a strategic objective of Grupo Santander, a socially
                                                                   responsible organisation, to have an advanced and effective
The audit and compliance committee, at its meeting on 15           system to prevent money laundering and the financing of
December, 2010, favourably informed on the compliance              terrorism, permanently adapted to the latest international
programme and on the changes to the General Code                   regulations and with the capacity to meet the appearance of
of Conduct, which were approved by the board on                    new techniques by criminal organisations.
20 December, 2010.
                                                                   At 31 December 2010, no unit of Grupo Santander in the world
MARKETING OF PRODUCTS                                              was subject to corrective measures of sanctions issued by
The section on reputational risk in the risk management report     supervision or regulatory authorities, as a result of non-
(pages 200 to 201 of this annual report) describes the             compliance or weaknesses in the sphere of preventing money
composition, functions and activities carried out in 2010 by the   laundering or the financing of terrorism.
corporate committee of marketing. The corporate office for
management of reputational risk and the global consultative        The organisation to prevent money laundering and the financing
committee are also dealt with.                                     of terrorism has three pillars: the anti-money laundering central
                                                                   department (AMLCD), executives in charge of prevention and
RELATIONS WITH THE SUPERVISORY AUTHORITIES                         the analysis and resolution committee.
AND DISSEMINATION OF INFORMATION INTO
MARKETS                                                            In 2010, 499 Group employees were involved in fighting
Compliance management is responsible for answering the             money-laundering and the financing of terrorism, three-quarters
information requirements of the regulatory and supervisory         of them full time. There were 209 units in 37 countries.
bodies in Spain and in those countries where the Group
operates, monitoring the implementation of measures                The Group’s policies are set out in corporate manuals (universal,
emanating from the reports or inspection activities of these       private and correspondent banking). These internal regulations
bodies and supervising the way in which the Group disseminates     are applied in all the Group’s units, with the necessary local
institutional information into markets, ensuring it is done        adjustments. The subsidiaries and business areas have their own
transparently and in accordance with the requirements of           procedure manuals.
regulators.
                                                                   During 2010 the AMLCD guided and approved the changes,
At each meeting, the audit and compliance committee is             adjustments and updating of the internal rules of more than half
informed of the main matters.                                      of the Group’s units, in a constant and systematic process of
                                                                   updating. As a result, the Group’s internal rules are line with the
OFF-SHORE CENTRES                                                  most demanding international standards.
In accordance with the recommendations of the Bank of Spain
contained in the 2003 Report of Banking Supervision in Spain       Grupo Santander’s model is based on customer acceptance
regarding subsidiaries and branches in tax havens, compliance      policies, which establish rigorous filters, such as a ban on
management, in coordination with internal audit, legal affairs,    dealing with certain people or risk sectors and, in other cases, a
tax advisory, and financial accounting and control, prepared a     strict regime of authorisation.
report on the Group’s off-shore centres which was reviewed by
the audit and compliance committee at its 15 March 2010            During 2010 the AMLCD carried out actions to fully adapt the
meeting.                                                           units to the rules that transpose the third directive of the
                                                                   European Union, mainly regarding the requirement for customer
The 2010 report of the audit and compliance committee              risk segmentation in the process of contracting, and the
contains more information on this issue.                           establishment of due diligence differentiated on the basis of the
                                                                   risk (reinforced, standard or simplified).


212                                                                                                            ANNUAL REPORT 2010
During 2010 the AMLCD took action to fully adapt the units to        for the prevention of money laundering and of the rest of the
the regulations transposing the third European Union directive,      units in Spain. This review also took into account aspects of
mainly with respect to the required segmentation of customers        coordination and global supervision of the rest of the Group’s
by risk in the signing-up process and the establishment of           units in the world. The report issued in April 2010 revealed no
separate due diligence processes in terms of risk (enhanced,         weakness in the system and limited itself to formulating an
standard or simplified).                                             eventual recommendation of the rectification suggested.

The units in Europe and in most of Latin America are                 Banco Santander is a founder member of the Wolfsberg Group
participating in this work. The technological developments are       along with 10 other large international banks. The Wolfsberg
important and the impact on the contracting model is high. At        Group’s purpose is to establish international standards that
the same time, we are tackling, with time frames set by various      increase the effectiveness of programmes to combat money-
legislations, complex and costly processes of updating the data      laundering and the financing of terrorism in the financial
of the global portfolio of customers.                                community. Various initiatives have been developed on anti-
                                                                     money laundering in private and correspondent banking, the
Grupo Santander has established in all its units and business        financing of terrorism, among others. Regulatory authorities and
areas corporate systems based on decentralised IT applications.      experts in this area believe that the principles and guidelines set
These enable operations and customers who because of their           by the Wolfsberg Group represent an important step in the fight
risk need to be analysed to be presented to the branches of the      against money-laundering, corruption, terrorism and other
account and/or customer relation managers. The tools are             serious crimes.
complemented by others centralised by teams of analysis from
prevention units who, in accordance with certain risk profiles       During 2010, the Wolfsberg Group maintained the working
and changes in certain patterns of customer behaviour, enable        groups to propose the best practices regarding controls for the
operations susceptible of being linked to money laundering           prevention of money laundering and the financing of terrorism
and/or the financing of terrorism to be analysed, identified early   in activities such as trade finance and in prepaid cards, as well as
on and monitored.                                                    for the effective application of controls and filters on applicable
                                                                     lists in matters of international sanctions.
The Group analysed a total of 34.6 million operations in 2010
(both by the commercial networks as well as money laundering
prevention teams), of which more than one million were by the        MAIN INDICATORS OF ACTIVITY
                                                                     2010
units in Spain.

Procedures have been established in all units that enable             Number of subsidiaries reviewed 171
suspicious transactions to be communicated to the authorities,        Number of cases investigated 70,102
guaranteeing throughout the circuit the strictest confidentiality.
                                                                      Number of reports sent to authorities 16,830
The rating accorded by the authorities to the Group’s
communications in all countries is good.                              Number of employees trained 84,820

One of the Group’s priorities in this sphere is to take the
necessary steps so that all employees know the requirements
resulting from the prevailing regulations. The aim of the training
actions is to enable employees to detect these operations and
instruct them in what to do.

In 2010, 84,820 employees received training on prevention of
money laundering (a total of 126,863 hours).

The internal audit function is necessary in order to guarantee
continuous compliance with these policies and it is responsible
for ensuring the system is efficient. In addition, many units are
submitted to periodic reviews by external auditors, Deloitte
carried out an integral review of the parent bank’s global system


     ANNUAL REPORT 2010                                                                                                               213
HISTORICAL DATA(1)
2000 - 2010

                                                                                                   2010                 2009                 2008                  2007                  2006
                                                                           Mill. US$          Mill. euros         Mill. euros          Mill. euros           Mill. euros           Mill. euros
BALANCE SHEET
Total assets                                                              1,626,824           1,217,501           1,110,529            1,049,632               912,915               833,873
Net customer loans                                                          967,614             724,154             682,551              626,888               571,099               523,346
Customer deposits                                                           823,601             616,376             506,976              420,229               355,407               331,223
Customer funds under management                                           1,316,517             985,269             900,057              826,567               784,872               739,223
Shareholders' equity                                                        100,580              75,273              70,006               63,768                51,945                40,062
Total managed funds                                                       1,820,291           1,362,289           1,245,420            1,168,355             1,063,892             1,000,996

INCOME STATEMENT
Net interest income                                                         38,658               29,224              26,299                20,945                   14,443            12,480
Gross income                                                                55,623               42,049              39,381                33,489                   26,441            22,333
Net operating income                                                        31,554               23,853              22,960                18,540                   14,417            11,218
Profit before taxes                                                         15,942               12,052              10,588                10,849                   10,970             8,995
Attributable profit to the Group                                            10,822                8,181               8,943                 8,876                    9,060             7,596


                                                                                                  2010                     2009             2008                     2007                   2006
                                                                                    US$           Euros                    Euros            Euros                    Euros                  Euros
PER SHARE DATA(2)
Attributable profit to the Group                                            1.2458               0.9418              1.0454                1.2207                   1.3320            1.1334
Dividend                                                                    0.8017               0.6000              0.6000                0.6325                   0.6068            0.4854
Share price                                                                 10.593                7.928              11.550                 6.750                   13.790            13.183


Market capitalisation (million)                                             88,234               66,033              95,043                53,960                   92,501            88,436

Euro / US$ = 1.3362 (balance sheet) and 1.3228 (income statement)
(1).- Figures from 2004 on according to IFRS.
(2).- Figures adjusted to capital increases.
(3).- Compound Annual Growth Rate.


TOTAL MANAGED FUNDS                                                                               NET CUSTOMER LOANS
Billion euros                                                                                     Billion euros
                                                                                      1,362


                                                                                                                                                                                      724
                                                                            1,245
                                                                  1,168


                                                                                                                                                                             683
                                                                                                                                                                       627
                                                         1,064


                                                                                                                                                              571
                                              1,001


                                                                                                                                                     523
                                       962


                                                                                                                                            436
                               793


                                                                                                                                     369
                        461
          453
   438


                 418


                                                                                                                               173
                                                                                                            174
                                                                                                     169


                                                                                                                     163


 2000 2001 2002 2003 2004 2005 2006                     2007 2008 2009 2010                        2000 2001 2002 2003 2004 2005 2006                        2007 2008 2009 2010

                                                      with IFRS                                                                                            with IFRS


214                                                                                                                                                             ANNUAL REPORT 2010
2005                                2004                          2003                        2002                             2001                             2000                            CAGR(3)
             Mill. euros                         Mill. euros                   Mill. euros                 Mill. euros                      Mill. euros                      Mill. euros                              (%)

                809,107                            664,486                          351,791                  324,208                          358,138                                348,928                                13.3
                435,829                            369,350                          172,504                  162,973                          173,822                                169,384                                15.6
                305,765                            283,212                          159,336                  167,816                          181,527                                169,555                                13.8
                651,360                            595,380                          323,901                  304,893                          331,379                                303,098                                12.5
                 35,841                             32,111                           18,364                   17,594                           19,128                                 17,798                                15.5
                961,953                            793,001                          460,693                  417,546                          453,384                                437,576                                12.0


                     10,659                          7,562                               7,958                 9,359                           10,257                                  8,290                                13.4
                     19,076                         13,999                              13,128                14,004                           15,564                                 13,005                                12.5
                      8,765                          6,431                               5,721                 5,566                            5,944                                  4,689                                17.7
                      7,661                          4,387                               4,101                 3,509                            4,237                                  3,774                                12.3
                      6,220                          3,606                               2,611                 2,247                            2,486                                  2,258                                13.7


                      2005                             2004                              2003                   2002                                   2001                            2000                        CAGR(3)
                      Euros                            Euros                             Euros                  Euros                                  Euros                           Euros                          (%)

                     0.9293                         0.6791                              0.5105                0.4431                           0.5079                                 0.5006                                 6.5
                     0.3883                         0.3107                              0.2824                0.2690                           0.2690                                 0.2550                                 8.9
                     10.396                          8.512                               8.755                 6.098                            8.773                                 10.629                                (2.9)


                     69,735                         57,102                              44,775                31,185                           43,845                                 51,987                                 2.4


ATTRIBUTABLE PROFIT TO THE GROUP*                                                                            DIVIDEND PER SHARE*
Million euros                                                                                                Euros
                                                                                                                                                                                                 0.6325
                                                                       9,060


                                                                                           8,943
                                                                                8,876


                                                                                                                                                                                        0.6068


                                                                                                                                                                                                                   0.6000
                                                                                                                                                                                                          0.6000
                                                                                                   8,181
                                                            7,596


                                                                                                                                                                            0.4854
                                                    6,220


                                                                                                                                                                   0.3883
                                                                                                                                                          0.3107
                                                                                                                                              0.2824
                                                                                                                                   0.2690
                                                                                                                          0.2690
                                                                                                                 0.2550
                                         3,606
                                2,611
             2,486
   2,258


                        2,247


 2000 2001 2002 2003                    2004 2005 2006                2007 2008 2009 2010                      2000 2001 2002 2003                       2004 2005 2006                2007 2008 2009 2010

                                                                    with IFRS
(*).- Includes extraordinary capital gains and allowances (EUR 1,008 million in 2005, EUR 1,014 million      (*).- Figures adjusted to capital increases and stock splits.
      in 2006 and EUR 950 million in 2007).


           ANNUAL REPORT 2010                                                                                                                                                                                                 214
GENERAL INFORMATION


  Banco Santander, S.A.                                        Relations with Santander Shareholders
  The parent bank of Grupo Santander was                       Santander Group City
  established on March 21, 1857 and incorporated               Edificio Marisma, Planta Baja,
  in its present form by a public deed executed in             Avda. De Cantabria s/n
  Santander, Spain, on January 14, 1875, recorded              28660 Boadilla del Monte
  in the Mercantile Registry (Finance Section) of              Madrid
  the Government of the Province of Santander,                 Spain
  on folio 157 and following, entry number 859.                Telephones: 902 11 17 11 and +34 91 276 92 90
  The Bank’s By-laws were amended to conform
  with current legislation regarding limited liability
  companies. The amendment was registered on                   Relations with investors and analysts
  June 8, 1992, and entered in the Mercantile                  Santander Group City
  Registry of Santander (volume 448, general                   Edificio Pereda, Planta Primera,
  section, folio 1, page 1,960, first inscription of           Avda. De Cantabria s/n
  adaptation).                                                 28660 Boadilla del Monte
                                                               Madrid
  The Bank is also recorded in the Special registry            Spain
  of Banks and Bankers 0049, and its fiscal                    Telephone: +34 91 259 65 14
  identification number is A-390000013. It is a
  member of the Bank Deposit Guarantee Fund.
                                                               Customer Attention Department
                                                               Santander Group City
  Registered Office                                            Avda. De Cantabria s/n
  The corporate by-laws and additional public                  28660 Boadilla del Monte
  information regarding the company may be                     Madrid
  inspected at its registered office at Paseo de               Spain
  la Pereda, numbers 9 to 12, Santander.                       Telephone: 91 257 30 80
                                                               Fax: 91 254 10 38
                                                               atenclie@gruposantander.com
  Operational Headquarters
  Santander Group City
  Avda. De Cantabria s/n                                       Ombudsman
  28660 Boadilla del Monte                                     Mr José Luis Gómez-Dégano,
  Madrid                                                       PO Box 14019
  Spain                                                        28080 Madrid
                                                               Spain

  General Information
  Telephone: 902 11 2211
  Telephone: 91 289 00 00


  www.santander.com


  This report was printed on ecology-friendly paper and has been produced using
  environmentally friendly processes.

© April 2011, Grupo Santander
  Design: Addison
  Photographs: Íñigo Plaza Cano, Ángel Baltanás, Pisco del Gaiso, Javier Marlán.
  Printing: Litofinter, S.A.
  Legal deposit:

Santander Bank Annual Report 2010

  • 1.
    2010 ANNUAL REPORT
  • 2.
    2010 ANNUAL REPORT Photo: The headquarters of Santander UK, Triton Square, London, UK
  • 3.
    2 KEY GROUP FIGURES 4 LETTER FROM THE CHAIRMAN 10 LETTER FROM THE CHIEF EXECUTIVE OFFICER 16 CORPORATE GOVERNANCE 20 THE SHARE 22 THE SANTANDER BUSINESS MODEL 30 SANTANDER’S BUSINESSES IN 2010 32 Corporate transactions 34 Continental Europe 38 United Kingdom 40 Latin America 44 United States-Sovereign 46 Global businesses 50 CORPORATE SOCIAL RESPONSIBILITY 54 HUMAN RESOURCES 58 REPORT ON CORPORATE GOVERNANCE 61 OWNERSHIP STRUCTURE 64 BANCO SANTANDER’S BOARD OF DIRECTORS 80 SHAREHOLDERS’ RIGHTS AND THE GENERAL SHAREHOLDERS’ MEETING 82 BANCO SANTANDER’S SENIOR MANAGEMENT 84 TRANSPARENCY AND INDEPENDENCE 86 UNIFIED GOOD GOVERNANCE CODE 88 FINANCIAL REPORT 90 CONSOLIDATED FINANCIAL REPORT 108 REPORT BY BUSINESS AREAS 109 1. Main segments or geographic areas 142 2. Secondary segments or businesses 150 RISK MANAGEMENT REPORT 152 EXECUTIVE SUMMARY 154 CORPORATE PRINCIPLES OF RISK MANAGEMENT 158 CORPORATE GOVERNANCE OF THE RISKS FUNCTION 159 INTEGRAL CONTROL OF RISK 161 CREDIT RISK 182 MARKET RISK 197 OPERATIONAL RISK 200 REPUTATIONAL RISK 202 ADJUSTMENT TO THE NEW REGULATORY FRAMEWORK 204 ECONOMIC CAPITAL 207 RISK TRAINING ACTIVITIES 208 APPENDICES 210 THE COMPLIANCE FUNCTION 214 HISTORICAL DATA 216 GENERAL INFORMATION
  • 4.
    KEY FIGURES BALANCE SHEET ANDINCOME STATEMENT* 2010 2009 % 2010/2009 2008 Total assets 1,217,501 1,110,529 9.6 1,049,632 Customer loans (net) 724,154 682,551 6.1 626,888 Customer deposits 616,376 506,976 21.6 420,229 Managed customer funds 985,269 900,057 9.5 826,567 Shareholders’ funds (after distribution of earnings) 75,273 70,006 7.5 63,768 Total managed funds 1,362,289 1,245,420 9.4 1,168,355 Net interest income 29,224 26,299 11.1 20,945 Gross income 42,049 39,381 6.8 33,489 Net operating income 23,853 22,960 3.9 18,540 Profit from continuing operations 9,129 9,427 (3.2) 9,030 Attributable profit to the Group 8,181 8,943 (8.5) 8,876 RATIOS (%) Efficiency (with amortization) 43.3 41.7 44.6 ROE 11.80 13.90 17.07 ROA 0.76 0.86 0.96 RoRWA 1.55 1.74 1.87 Core capital 8.8 8.6 7.5 Tier 1 10.0 10.1 9.1 BIS ratio 13.1 14.2 13.3 Tangible capital/tangible assets(1) 4.4 4.3 3.6 Ratio of basic financing(2) 79.6 76.0 75.1 Lending/deposit ratio 117 135 150 Non-performing loan (NPL) ratio 3.55 3.24 2.04 NPL coverage 73 75 91 THE SHARE AND CAPITALISATION Number of shares in circulation (million) 8,329 8,229 1.2 7,994 Share price (euros) 7.928 11.550 (31.4) 6.750 Market capitalisation (million euros) 66,033 95,043 (30.5) 53,960 Shareholders’ funds per share (euros)(3) 8.58 8.04 7.58 Share price/shareholders’ funds per share (times)(3) 0.92 1.44 0.89 PER (share price/attributable profit per share) (times)(3) 8.42 11.05 5.53 Attributable profit per share (euros)(3) 0.9418 1.0454 (9.9) 1.2207 Diluted attributable profit per share (euros)(3) 0.9356 1.0382 (9.9) 1.2133 Remuneration per share(3) 0.6000 0.6000 0.0 0.6325 Total shareholder return (million euros) 4,999 4,919 1.6 4,812 OTHER FIGURES Number of shareholders 3,202,324 3,062,633 4.6 3,034,816 Number of employees 178,869 169,460 5.6 170,961 Continental Europe 54,518 49,870 9.3 48,467 United Kingdom 23,649 22,949 3.1 24,379 Latin America 89,526 85,974 4.1 96,405 Sovereign 8,647 8,847 (2.3) Corporate activities 2,529 1,820 39.0 1,710 Number of branches 14,082 13,660 3.1 13,390 Continental Europe 6,063 5,871 3.3 5,998 United Kingdom 1,416 1,322 7.1 1,303 Latin America 5,882 5,745 2.4 6,089 Sovereign 721 722 (0.1) * Million euros (1) (Capital+Reserves+Minority Interests+Profits-Treasury stock-Dividends-Valuation adjustments-Goodwill-Intangibles)/(Total assets-Goodwill-Intangibles) (2) (Deposits+Medium and long-term wholesale financing+capital)/Total assets (excluding dividends) (3) 2008 adjusted to the capital increase with preferential right at the end of 2008 2 ANNUAL REPORT 2010
  • 5.
    Banco Santander distributedamong its shareholders almost EUR 15,000 million in dividends in the last three years GROSS INCOME NET OPERATING INCOME Million euros + 6.8% Million euros + 3.9% 2009-2010 2009-2010 42,049 23,853 39,381 22,960 33,489 18,540 2008 2009 2010 2008 2009 2010 ATTRIBUTABLE PROFIT TOTAL DIVIDEND PAYOUT Million euros – 8.5% Million euros + 1.6% 2009-2010 2009-2010 4,999 8,943 4,919 8,876 8,181* 4,812 2008 2009 2010 2008 2009 2010 * EUR 8,653 million before the impact of applying Bank of Spain circular 3/2010 (-3.2%) EFFICIENCY + 1.6 p.p. CORE CAPITAL + 0.2 p.p. % % 2009-2010 2009-2010 44.6 43.3 8.8 8.6 41.7 7.5 2008 2009 2010 2008 2009 2010 ANNUAL REPORT 2010 3
  • 6.
    “Grupo Santander’s attributableprofit between 2007 and 2010 totalled EUR 35,060 million, making us the world’s third bank in earnings during this period” Photo: Mr Emilio Botín addresses the convention of Grupo Santander executives at the Bank’s corporate centre in Boadilla del Monte, Spain, in February 2011 4 ANNUAL REPORT 2010
  • 7.
    LETTER FROM THECHAIRMAN Emilio Botín In a very difficult economic and financial environment, Banco Santander generated recurring results in 2010 and strengthened its balance sheet with more capital, liquidity and provisions. This laid the foundations for continued growth in the coming years. Attributable profit was EUR 8,181 million in 2010, 8.5% less than in 2009. Thanks to our geographic diversification, the commercial strength of our branch network, the focus on controlling costs and prudent risk management we have remained one of the world’s leading banks in terms of profits in the last four years. Grupo Santander’s total attributable profit in 2007-2010 amounted to EUR 35,060 million, making us the world’s third bank in earnings during this period. The good performance of the Bank’s businesses enabled the total shareholder return The good performance of to be held at EUR 0.60 per share, a figure in line with the objective announced at the AGM in June 2010. In terms of total remuneration, this meant distributing almost all the Bank’s businesses EUR 19,000 million among our shareholders in the last four years. enabled total shareholder All this is particularly important in the current context, as many of our remuneration to remain competitors were forced over the past few years to eliminate or significantly reduce at EUR 0.60 per share, their dividend payout. in line with the objective The good reception given to Santander Dividendo Elección programme in 2009 announced at the AGM —under which Banco Santander gives its shareholders the option to receive part of the dividend in cash or in new shares— led us to extend the plan and offer it for the in June 2010 second and third interim dividends charged to 2010’s earnings. A total of 85% of shareholders opted to receive new shares. A DEMANDING ECONOMIC, FINANCIAL AND REGULATORY FUTURE The global economy is recovering, led by emerging countries. Some developed economies, such as the US and Germany, are also registering positive growth rates. International financial reforms, in general terms, are moving in the right direction and significant steps forward have been taken, although there are still some issues to be resolved. ANNUAL REPORT 2010 5
  • 8.
    In our view: •Basel III will mean enhanced levels of capital and liquidity for banks. • The contingency and resolution plans (living wills) are a key mechanism for enhancing management of banking crises. Banco Santander was the first international bank to deliver its living will. • No regulation can take the place of good supervision, which must be rigorous and closely monitored. • The additional capital requirements imposed on banks which are considered systemic must be directly related to risk. The structure of Banco Santander’s subsidiaries limits the contagion between the Group’s institutions and minimizes systemic risk. • In Spain’s case, the restructuring of savings banks is leading to very important steps in the right direction. As a result of all this, I am convinced that the financial sector, which emerges from the crisis, will be more stable, more balanced and less vulnerable. A SOLID BASE UPON WHICH TO CONTINUE GROWING In the last few years, Banco Santander has managed to be profitable even in the most difficult economic scenarios and, moreover, has taken advantage of its position of strength to build a solid base upon which to continue growing, backed by: BALANCE SHEET STRENGTH Solid and sustained growth can only be achieved with a healthy balance sheet and Solid and sustained high levels of solvency. Banco Santander has: growth can only • High and maximum quality solvency ratios: The core capital ratio ended 2010 at 8.8% and will exceed 9% at the end of 2011, largely due to the Group’s capacity be achieved with a to organically generate capital. healthy balance sheet • A balance sheet that withstands the most adverse scenarios: Santander was among and high levels of the best in Europe in terms of profitability and solvency in the stress tests conducted on banks during 2010. solvency • A solid liquidity position: The strong capture of deposits via commercial networks (EUR 109,000 million in 2010 alone) and our capacity to issue medium- and long- term debt in the markets where we are present (EUR 38,000 million in 2010) enable Santander to meet its financial obligations and finance customer transactions. Banco Santander has no need to issue securities in Spain in 2011 and 2012 to cover its expected debt maturities. • Our non-performing loan (NPL) ratios and coverage are better than the banking system’s average in all the countries where we operate: This is due to our strict management of risk and conservative policies for provisions. Banco Santander’s generic provisions amounted to EUR 5,846 million at the end of 2010. In line with our criteria of maximum prudence, Banco Santander decided to apply the Bank of Spain’s new rules on provisions conservatively, charging to the third quarter’s results EUR 472 million net of tax. Excluding this impact, the Group’s profit in 2010 would have been similar to that in 2009, instead of declining 8.5%. 6 ANNUAL REPORT 2010
  • 9.
    GEOGRAPHIC DIVERSIFICATION Banco Santander’sinternational strategy in the last few years has been aimed at Banco Santander’s attaining a diversified presence with critical mass and high market shares in its main markets, which currently number 10: Spain, Portugal, Germany, the UK, Brazil, Mexico, international strategy Chile, Argentina, the US and Poland. These countries give the Group an appropriate in the last few years balance between mature and emerging markets and greater recurrence in results. Of note are: has been aimed at • Brazil: Its contribution to the Group’s attributable profit was the largest, attaining a diversified at EUR 2,836 million (25% of the total). Economic stability and a still low level presence with critical of “bankarisation” will fuel Santander’s strategic plans to grow in the country. Technological integration and unification of the brand in 3,702 branches was mass and high market completed successfully. shares in its main markets • In the UK, Santander has become a leading bank in just six years. The acquisition of Abbey in 2004 was the most successful cross-border transaction. The UK contributed EUR 1,985 million to the Group’s attributable profit (18% of the total). In 2010, we reached an agreement to acquire 318 Royal Bank of Scotland branches to expand business with SMEs. • Spain (15% of the Group’s total profits): In a very difficult year for the Spanish economy, the commercial networks were very busy, capturing EUR 32,000 million in deposits and leading the channelling of ICO loans, while maintaining the focus on the quality of service to customers, for which the “We want to be your Bank” strategy of the Santander branch network continued to play a key role. Furthermore, the Group’s NPL ratio in Spain (4.2%) remained below the banking system’s average, the efficiency ratio remained very competitive and provisions were increased. The Group’s loans to the construction and property sectors for real estate development were reduced by 27% in 2009 and 2010 to EUR 27,000 million (3.7% of the Group’s total lending and 12% of lending in Spain). Grupo Santander’s share of loans to this sector is around 10%, well below our average market share of 15% for the various businesses in Spain. Bad and substandard loans are 28% covered by provisions. Grupo Santander has a competitive advantage in Spain as it has two brands, Santander (with 2,931 branches) and Banesto (with 1,762 branches). We have no intention of closing branches in the near future. • The United States contributed 7% of the Group’s total profits. The restructuring of Sovereign continues. In less than two years of management by Banco Santander, it has moved from a loss to a profit of $561 million. Santander also took advantage of the situation in 2010 to bolster its presence in other significant markets, such as: • Mexico: With the purchase of the 25% of Santander Mexico in the hands of Bank of America, this country generated 6% of the Group’s profits. • Germany (4% of the Group’s profits): 173 retail banking branches of the Swedish group SEB were acquired. • Poland: With the acquisition of Bank Zachodni WBK, the country’s third largest bank, Banco Santander will enter the retail banking business. We envisage an additional contribution of these businesses of EUR 750 million to the Group’s results in 2013. Santander has no need to make further acquisitions in the coming years. ANNUAL REPORT 2010 7
  • 10.
    Lastly, I wouldlike to point out that in the last three years Banco Santander’s strategy of expansion and acquisitions has gone hand-in-hand with a policy of selling businesses and assets. Overall, the amount invested is roughly equal to that received from the sales (around EUR 14,000 million), with an almost neutral impact on the Group’s capital. RETAIL BANKING: FOCUSED ON CUSTOMERS These years of financial crisis have highlighted the fact that financial institutions with Banco Santander’s business more centred on retail banking have shown greater recurrence and less volatility in their results. Santander’s retail banking businesses generate 76% of the retail banking businesses Group’s profits. generate 76% of the Grupo Santander serves almost 100 million customers through its 14,082 branches, Group’s profits the largest network of any international bank. This is complemented by a wide range of multi-channel banking. The quality of customer service, innovation in products and services and the confidence and security transmitted by the Bank help to capture, link and retain a growing customer base. Our customer banking model also has cutting-edge technology, which transforms cost savings into higher value for customers and shareholders, while the Santander brand, the third most valued financial brand in the world, today has unprecedented levels of recognition and renown. CORPORATE GOVERNANCE AND SUSTAINABILITY The business model is also supported by: • Solid corporate governance, which guarantees an appropriate risk profile and a long-term business strategy aligned with shareholders’ interests. Mr Ángel Jado Becerro de Bengoa joined the board in 2010. His long experience will contribute value to the board’s decisions, and • A corporate social responsibility policy focused on supporting universities. We announced last May at the Second International Meeting of Universia Rectors in Guadalajara, Mexico, that we will invest EUR 600 million over the next five years in higher education. Santander Universities has agreements with 938 universities throughout the world, awards 13,000 scholarships and integrates more than 1,200 universities in the Universia portal. 8 ANNUAL REPORT 2010
  • 11.
    THE SANTANDER SHARE Theperformance of the Santander share in 2010 did not truly reflect the Bank’s results or growth prospects. The share ended the year at EUR 7.93, down from EUR 11.55 in 2009 (-31%). The concerns about the international financial sector, regulatory uncertainty and, above all, the performance of Spain’s sovereign risk dented the share price in 2010, although I am sure that when the economic and financial environment clears up the share will rise and reflect Grupo Santander’s real value. Nevertheless, Santander still has one of the highest total shareholder return among its Santander remains European bank competitors in the medium- and long-term. The dividend yield in 2010 was 6.36%. one of the banks with the highest total Banco Santander is well placed to continue to create shareholder value. Today, we are a more solvent bank, with a greater degree of leadership in our main markets and shareholder return with a stronger growth potential than at the start of the crisis. Furthermore, we have among its European the best and most committed management team, led by the best CEO in banking. competitors in the Lastly, I would like to thank you again for your support during these years and for medium- and long-term the confidence you have placed in Banco Santander. You can rest assured that all of us who work for Grupo Santander will strive to make this Bank the best investment for all shareholders. Emilio Botín CHAIRMAN ANNUAL REPORT 2010 9
  • 12.
    “Santander is inan excellent position: we are a well diversified banking group, with one of the soundest balance sheets in international banking, a presence in growing markets and a banking model that proves its success year after year” Photo: Mr Alfredo Sáenz speaks to the convention of Grupo Santander executives at the Bank’s headquarters in Boadilla del Monte, Spain, in February 2011 10 ANNUAL REPORT 2010
  • 13.
    LETTER FROM THECHIEF EXECUTIVE OFFICER Alfredo Sáenz RESULTS AND SANTANDER SHARE Grupo Santander posted attributable profit of EUR 8,181 million in 2010, 8.5% less The stronger balance sheet than in 2009. Once more, we gave priority to strengthening our balance sheet over short-term results by applying the Bank of Spain’s 3/2010 Circular very strictly. is reflected in the core Excluding the impact of this decision, profit would have been EUR 8,653 million (- capital ratio, which 3.2%). increased from 8.6% at Earnings per share (EPS) were EUR 0.9418, 9.9% less than in 2009. Eliminating the end of 2009 to 8.8% the impact of the circular, the EPS would have been EUR 0.9961 (-4.7%). a year later Meanwhile, the stronger balance sheet is reflected in the core capital ratio, which increased from 8.6% at the end of 2009 to 8.8% a year later. The Santander share price fell 31.4% in 2010, mainly due to the concern over the sovereign debt crisis in countries on the periphery of the euro zone and the impact of “risk contagion” on Spain, which is not justified. To the extent that the Spanish economy and the financial system reach a more balanced situation, it is reasonable to assume a normalisation of the financial markets. I am optimistic about the Spanish economy because the private sector is making progress in its adjustments — raising productivity, achieving cost savings and higher exports in the face of the fall in domestic demand — the public sector is correcting its imbalances and, lastly, the financial sector, especially savings banks, is starting to recognize its losses, to recapitalize and to restructure its cost base. ANNUAL REPORT 2010 11
  • 14.
    RESULTS BY UNITS Toanalyse Grupo Santander’s positioning and results, we can divide our markets into three groups: mature markets where a clear recovery is still pending (Spain and Portugal); mature markets where the upturn is solid (the UK, the US and Germany) and emerging markets which are growing strongly (Brazil, Mexico, Chile, Argentina, Uruguay, Colombia and Poland). This business portfolio shows very tangibly the advantages of a diversified group: Our business portfolio our businesses have different cycles, and this injects stability into the Group’s results. shows very tangibly the MATURE MARKETS STILL RECOVERING advantages of a diversified group: our businesses have Our income statement was hard hit in 2010 by the pressure on results from our retail banking activity in Spain and Portugal: the combined contribution of the Santander different cycles, and this Branch Network, Banesto and our business in Portugal was down by EUR 1,200 million injects stability into the from 2009. This was mainly due to the lack of growth in lending because of low solvent demand, higher provisions because of the economic downturn and the pressure of spreads Group’s results on deposits as a result of the low interest-rate environment and liquidity tensions. Unlike in other markets, the Spanish and Portuguese financial systems have still not adjusted sufficiently to the new environment, producing a significant deterioration in the system’s structural profitability. We are currently at a turning point: • First, the Spanish financial system is going through a profound restructuring process, focused, in particular, on savings banks. As a result of the integration of this sector, we expect to see a significant reduction in the number of branches, as well as greater rationality in prices. In this context, our objective in Spain is to gain profitable market share and maintain a low risk profile. • Second, we are seeing some upward movement in euro zone interest rates. This will have a positive impact on our spreads. • Third, there is a gradual rise in credit pricing in Spain, which will help normalize our spreads and those of the financial system. In the last two years, loans have been made at prices which were not consistent with the cost of liquidity. Clearly, this situation was not sustainable and we are seeing the beginning of the adjustment. • Fourth, the credit quality of our portfolio in Spain and Portugal is stabilizing. Combining these factors, we can expect a “return to the average” profitability of our businesses in Spain and Portugal over the next two or three years, probably beginning in the second half of 2011. Our medium-term objective is to recover the profit temporarily lost in 2010, and we are working on this. MATURE MARKETS WITH SOLID RECOVERY Our operations in the UK, the US and Santander Consumer Finance (which generated 54% of its attributable profit in Germany) are once again achieving good results, despite doing business in markets with moderate growth. • In the UK, attributable profit rose 10.7%, in local currency, to £1,701 million. In this market, we continued to concentrate on gaining market share — particularly in segments such as SMEs — managing spreads and continuing to maintain excellent credit quality. 12 ANNUAL REPORT 2010
  • 15.
    • Over thenext few years, our objective is to speed up our growth in segments such as companies and SMEs where our presence is lower than our natural market share. The integration of the business acquired from Royal Bank of Scotland will enable us to make a significant leap forward in this aspect. • Santander has been one of the few banks in the UK that has lived through the crisis without problems and we have continued to make loans to the British economy, enabling us to gain profitable market share. • In the US, Sovereign’s restructuring continues to produce good results. In 2010, attributable profit was $561 million, higher than the goal announced at the time of the bank’s purchase. • Sovereign still has a significant potential to improve. During the two previous years, the main drivers of growth were the improvement in the efficiency ratio, management of spreads and enhanced credit quality. The focus now is on strengthening the bank’s commercial capabilities, which will be the driver of growth in the next few years. We expect further strong growth in Sovereign’s profit in 2011 to the announced target of $750 million. • Santander Consumer Finance also had a good year. Its attributable profit rose 28.9% to EUR 811 million. This was a new record for this unit, which, after two years of declines because of the crisis, has comfortably surpassed the profit posted in 2007. • Santander Consumer Finance’s objectives for the next few years are to complete the integrations underway (mainly in Germany), gain profitable market share from weaker competitors and continue to manage spreads and loan loss recoveries well. • We believe that 2011 will be another year of strong growth in this division. EMERGING MARKETS WITH STRONG GROWTH Our units in emerging markets continued to generate very good results, reflecting the Very few international good economic conditions in the countries where we operate. banks have such a deep • In 2010, we returned to double-digit growth in our Latin American businesses. and high quality presence • In Brazil, attributable profit of $3,751 million was 10.4% more than in 2009. It would have been 24.4% higher excluding the impact of increased minority interests, following in growth markets as the IPO of Santander Brazil in October 2009. we do • Latin America excluding Brazil generated attributable profit of $2,604 million, 12.4% more than in 2009, with strong growth in loans and deposits in the core markets. • In Mexico, we obtained attributable profit of $902 million, 22.7% more than in the previous year. Chile’s attributable profit was $904 million (+5.4%). Both units registered strong growth in business, with double-digit increases in lending and an improvement in the cost of credit. • Moreover, in 2011 we acquired Bank Zachodni WBK, making us one of the leading banks in the Polish market. Poland, with almost 40 million inhabitants and a significant potential for growth, is a market where we have had a notable presence in consumer finance since 2004. Bank Zachodni WBK is an excellent franchise, the third largest bank by number of branches. Our objective, announced to the market at the time of the purchase, is to achieve a contribution from this business of more than EUR 450 million in 2013. Our positioning in emerging markets will be a very significant driver of growth for the Group in the next few years. Very few international banks have such a deep and high quality presence in growth markets as we do. ANNUAL REPORT 2010 13
  • 16.
    THE NEED TOADAPT TO THE NEW BANKING ENVIRONMENT As I commented last year, banking business has changed considerably in the last few years. The main changes include: 1. In many markets, including the main ones in Continental Europe, the UK and the US, we are operating in an environment of deleveraging and low growth in lending. 2. Moreover, a new regulatory environment is being designed. One of the main implications of this change is the need to operate with much higher capital ratios, and with a stricter calculation of risk assets. As a result of these changes, a same business could be subject to more than double the capital requirement in less than five years. • To this must be added the pressure on profitability from the new rules on liquidity and other effects, such as the new taxes on banks in some countries. • These new capital and liquidity rules also have a negative impact on western economies, in terms of access to and pricing of credit. We are witnessing profound changes in the banking business. It is vital to adapt to We are witnessing the new environment. We have to: profound changes in the • Review the real profitability of all our businesses. It makes sense, in those businesses that do not justify the capital they consume, to reduce the allocation banking business. It is vital of capital or seek different approaches. to adapt to the new • Adapt pricing policies, particularly for loans. environment • Adjust the structure of costs to the revenue-generating prospects of each business. In many segments, the international banking sector continues to maintain cost structures designed in the pre-crisis environment. Banks that do not generate revenues to justify these costs must adjust them to the current scenario. In short, the new environment could be very negative for those institutions that continue to operate through inertia, and are not capable of understanding the changes and adapting. We are very well positioned, and this makes me optimistic about our future prospects. 14 ANNUAL REPORT 2010
  • 17.
    CONCLUSIONS My message forthe coming years is very optimistic. Santander is in an excellent position: we are a well diversified banking group, with one of the soundest balance sheets in international banking, a presence in growth markets and a banking model that proves its success year after year. In our business in Spain and Portugal, we are at a very low phase of the cycle in generating profits. However, I am optimistic about our prospects in these markets. We also have in both cases excellent opportunities to gain profitable market share, taking advantage of the relative weakness of many competitors. Moreover, one of our main hallmarks as a bank is our flexibility and the speed with which we take decisions. This is very valuable in the current environment, where it is essential to adapt to the sector’s new conditions. We also have one of the best teams of professionals in the international banking sector. We have big opportunities ahead, and are working to ensure we take advantage We have great opportunities of them. So far, these good prospects are not reflected in the price of the Santander share. ahead, and are working to ensure we take advantage Along these lines, I would like to point out that in a sum-of-its-parts calculation, the valuations of Grupo Santander today assign a value of close to zero to the Spanish of them businesses. As the adjustment capacity of the Spanish private sector, public accounts and the financial system becomes clear for the market, I have no doubt that the share price will start to reflect our Group’s good prospects. Alfredo Sáenz CHIEF EXECUTIVE OFFICER ANNUAL REPORT 2010 15
  • 18.
    CORPORATE GOVERNANCE Banco Santanderhas solid and transparent corporate governance and aligned with shareholders’ interests BANCO SANTANDER’S CORPORATE THE BOARD GOVERNANCE MODEL OF DIRECTORS Banco Santander’s board of directors is the maximum A balanced and committed board of directors. decision-making body, except for matters reserved for the annual meeting of shareholders. It is responsible, among • Of the 20 directors, 14 are non-executive and 6 executive. other things, for the Bank’s strategy. Its functioning and activities are regulated by the Bank’s internal rules and it is guided by principles of transparency, efficiency and defence Equality of shareholders’ rights. of shareholders’ interests. The board is closely involved in the Bank’s activity and makes an exhaustive analysis of the • The principle of one share, one vote, one dividend. most relevant issues and risks. • No anti-takeover measures in the corporate By-laws. Banco Santander’s board is balanced between executive • Informed participation of shareholders in meetings. and non-executive directors. All members are recognised for their professional capacity, integrity and independence. Maximum transparency, particularly in remuneration. After the appointment of Mr Ángel Jado Becerro de Bengoa, approved by the annual meeting of shareholders on June 11, 2010, the board has 20 members, six of whom are executive A corporate governance model recognised by external directors and 14 non-executive (10 of them independent). institutions. The board ensures compliance with the best international • Santander has been in the FTSE4Good and DJSI indices practices, based on the principle of full equality of shareholders’ since 2003 and 2000, respectively. rights and maximum transparency. 16 ANNUAL REPORT 2010
  • 19.
    Grupo Santander City,Boadilla del Monte, Madrid, Spain REMUNERATION POLICY REMUNERATION OF DIRECTORS IN 2010 In 2010, for the second year in a row, the board agreed to The remuneration policy for directors and the Bank’s senior keep unchanged the annual remuneration of its members management is based on the following three pillars: for exercising the functions of supervision and collegiate decision-making. There has been no change in it since 2008. 1. Transparency, as the fundamental principle that the board has fostered for years. As regards executive directors, the board decided to maintain with only one exception the fixed remuneration for 2011 and 2. Anticipation and adapting to regulatory changes, given the increase by 10% the variable remuneration for 2010. importance that Santander has always attached to rigorous management of risk and a remuneration policy consistent with it. 3. Involvement of the board, as, at the proposal of the appointments and remuneration committee, it approves the report on the remuneration policy for directors. The board submitted for the first time in 2010 the report on the remuneration policy for directors to a consultative vote at the ordinary general meeting of shareholders where it received the favourable vote of 95% of shareholders who were present and represented. This measure joined others adopted by the board over the last decade in order to implement the best international practices in remuneration matters. In 2002, the Bank pioneered the publication of the individual remuneration of executive and non-executive directors and broken down by items, and in 2005 it was the first to present at a general meeting of shareholders a report by the appointments and remuneration committee. Since 2007, this report has included the remuneration policy for directors of the previous and current year. In 2008, the disclosure of directors’ remuneration became a statutory obligation. THE BOARD OF DIRECTORS IN 2010 • For the fifth year running, a meeting was dedicated solely as well as the liquidity of European banks and of Santander to the Group’s strategy. and the new rules on capital (Basel III). • The second vice-chairman and chief executive officer • Ana Patricia Botín-Sanz de Sautuola y O’Shea was proposed presented to the board eight management reports and the to the board of Santander UK as chief executive officer third vice-chairman, who heads the risks division, presented of Santander UK. Antonio Basagoiti García-Tuñón was seven reports on risks. proposed to the board of Banesto as non-executive chairman of Banesto. • The board analysed the businesses in Latin America, particularly Brazil, and those in the UK, the Santander Branch Network in Spain and Banesto and the Group’s Asia Plan, ANNUAL REPORT 2010 17
  • 20.
    CORPORATE GOVERNANCE BOARD OFDIRECTORS Director Director Director Director Director Lord Terence Burns Mr Ángel Jado Ms Ana Patricia Botín-Sanz MrAntonio Basagoiti Mr Antonio Escámez Torres Becerro de Bengoa de Sautuola y O’Shea García-Tuñón Director Director Director Director Fourth vice-chairman Second vice-chairman and Mr Guillermo de Mr Luis Ángel Mr Abel Matutes Juan Mr Rodrigo Echenique Mr Manuel Soto Serrano chief executive officer la Dehesa Romero Rojo Duque Gordillo Mr Alfredo Sáenz Abad 18 ANNUAL REPORT 2010
  • 21.
    Executive committee Risk committee Audit and compliance committee Appointments and remuneration committee International committee Technology, productivity and quality committee Chairman Director Director Director Director Mr Emilio Botín-Sanz de Ms Isabel Tocino Mr Javier Botín-Sanz de Mr Luis Alberto Assicurazioni Generali S.p.A. Sautuola y García de los Ríos Biscarolasaga Sautuola y O’Shea Salazar-Simpson Bos (Mr Antoine Bernheim) First vice-chairman Third vice-chairman Director Director General secretary Mr Fernando de Asúa Álvarez Mr Matías Rodríguez Mr Francisco Mr Juan Rodríguez and of the board Inciarte Luzón López Inciarte Mr Ignacio Benjumea Cabeza de Vaca ANNUAL REPORT 2010 19
  • 22.
    THE SHARE Banco Santanderpaid a total of EUR 4,999 million in dividends in 2010 to its more than 3.2 million shareholders 1st SHAREHOLDER REMUNERATION Banco Santander assigned EUR 4,999 million to dividends in Santander is the euro zone’s largest bank 2010, 1.6% more than in 2009. The high degree of recurrence by market capitalisation of profits and the soundness of Santander’s capital enabled the Bank to pay out more than EUR 14,700 million in the last three years, making Santander the international bank that most 0.60 remunerated its shareholders during this period. As part of this remuneration, and due to its success in 2009, euros of remuneration per share Santander maintained and increased the Santander Dividendo Elección programme. This scrip dividend offers Banco Santander’s shareholders the possibility of opting to receive an amount equivalent to that of the second and third interim 85% dividends in the form of cash or new Santander shares. More than 85% of the Bank’s capital chose to receive shares, up from 81% in 2009. of the capital opted to receive the second and third interim dividends charged to 2010’s earnings in the form of shares The board approved in January 2011 a fourth interim dividend of EUR 0.229 per share to be paid in May which, added to the dividends paid in August and the scrip dividend, paid in 3,202,324 November 2010 and February 2011, brought the total remuneration per share in 2010 to EUR 0.60, the same as in 2009. shareholders REMUNERATION PER SHARE TOTAL DIVIDEND PAYOUT Euros Million euros Santander Dividendo Elección programme 2009: 0.60 euros 2010: 0.60 euros 0.229 4,999 4,919 0.222 4,812 4,070 0.135 0.135 3,256 0.123 0.119 0.120 0.117 2,605 1,837 1,444 1,376 1,329 1.08.09 4.11.09 1.02.10 1.05.10 1.08.10 3.11.10 3.02.11 1.05.11 2001 2002 2003 2004 2005 2006 2007 2008 2009 2010 20 ANNUAL REPORT 2010
  • 23.
    General meeting ofshareholders, June 11,2010, Santander, Cantabria, Spain PERFORMANCE OF THE SANTANDER SHARE SHAREHOLDER BASE AND CAPITAL Stock markets were very volatile during 2010 because of doubts The number of Banco Santander shareholders increased by on consolidation of the economic recovery. The share ended 140,000 in 2010 to 3,202,324. At the end of the year, 3.0% 2010 at EUR 7.928, 31.4% lower than a year earlier. This of the capital stock was in the hands of the board of directors, performance did not reflect the results and the Bank’s solid 37.8% with individual shareholders and rest with institutional balance sheet, nor the Group’s future prospects. Three factors investors. Of the total capital stock, 85.5% is located in Europe, hit the share: 14.1% in the Americas and 0.4% in the rest of the world • The problems of confidence that weighed on the euro zone The interests held by Chase Nominees Limited (10.24%), State and in particular on Spain. The Ibex-35 index was the worst Street Bank & Trust (9.52%), EC Nominees Limited (6.45%), performer among international markets. Bank of New York Mellon (5.05%), Guaranty Nominees Limited • The penalisation of financial stocks. (3.73%) and Societé Générale (3.28%), which were the only ones in excess of 3%, were held by them for the account of • The uncertainty associated with coming regulatory changes. their clients. The Bank is not aware of any other shareholders holding individual stakes of 3% or more of its capital stock. Santander continued to be the largest bank in the euro zone by market value, with a capitalisation of EUR 66,033 million at the Banco Santander carried out two capital increases in 2010 end of 2010. In terms of total shareholder return, Santander is to tend to the conversion of 33,544 bonds (October) and for one of the European banks with the best return in the medium- the Santander Dividendo Elección programme (November). and long-term. Overall, 100,295,963 new shares were issued. Banco Santander continued in 2010 to strengthen its information and attention channels for its shareholders through seven dedicated offices in Spain, the UK, the US, Brazil, Mexico, Portugal and Chile. These offices tended to 247,057 consultations by telephone, 20,704 e-mails and 14,230 shareholders attended 179 forums and events held in various countries. COMPARATIVE PERFORMANCE OF THE SANTANDER DISTRIBUTION OF THE CAPITAL STOCK BY TYPE OF SHARE AND INDICES SHAREHOLDER Data from December 31 2009 to December 31 2010 Number of shares and % Santander Dow Jones Stoxx 50 Dow Jones Stoxx Banks Ibex 35 December 2010 Shares (%) 110 Board 253,156,054 3.04 Institutional 4,926,897,662 59.15 100 Retail 3,149,068,382 37.81 Total 8,329,122,098 100.00 90 80 70 60 31/12/09 31/12/10 Base: 100 ANNUAL REPORT 2010 ANNUAL REPORT 2010 21
  • 24.
    Commercial focus THE SANTANDER Disciplined use of The Santander BUSINESS MODEL capital and financial brand strength Santander’s customer-focused Prudence model generates a large degree in risk Geographic diversification of recurrence in its results Efficiency COMMERCIAL FOCUS The most lasting customer relationships, which create the most Quality of service is a priority at Banco Santander, which strives value, are generated and maintained in branches. Santander has for maximum customer satisfaction. As well as various local 14,082 branches, more than any other international bank and initiatives, Santander also has corporate strategies to enhance mostly distributed in its 10 core markets. The Bank also provides the quality of service in all countries and channels in which it services through other around-the-clock channels, such as operates. A total of 85.7% of customers said they were online and telephone banking. satisfied, generating greater linkage and loyalty as well as more revenues. In 2010, Santander stepped up its distribution capacity by 422 branches, mainly as a result of plans of branch openings Banco Santander has a broad range of financial products and in high growth countries such as Brazil and Mexico. services with which to seek to satisfy customers’ needs. A hallmark of the Bank, in all its markets, is its anticipation and The customer base has grown significantly in the last few years. dynamism when launching new products. For example, in 2010 It doubled between 2004 and 2010. At the end of 2010, the “Depósito Ganador” in Spain, the Santander Zero Current Santander had 97.2 million customers, distributed as follows: Account in the UK and the “Conta Integrada” in Brazil for shops 31% in Continental Europe, 26% in the UK and 43% in and companies. the Americas. Customer linkage and retention are constant objectives of Banco Santander’s commercial policy. In 2010, the initiatives launched in various countries with plans to eliminate service fees are having a very positive impact on retaining customers: in Spain, the “We want to be your Bank” plan notably increased customer loyalty. CUSTOMERS BRANCHES Million Number 14,082 97.2 13,660 92.0 13,390 87.2 2008 2009 2010 2008 2009 2010 22 ANNUAL REPORT 2010
  • 25.
    THE SANTANDER BRAND Santander,a strong and attractive brand positioned among the world’s best Santander is the brand which embodies the Group’s identity and In Germany, the branches acquired from the Swedish bank SEB expresses a corporate culture, an international positioning and will assume the Santander brand. The Bank will also launch a strong identity throughout the world. It represents the various initiatives and corporate and brand marketing strategies essence, personality and values that make Santander unique: to strengthen and foster customer satisfaction. The aim is to dynamism, strength, innovation, leadership, commercial drive, make the Santander brand increasingly associated with the quality of service and professional ethics and sustainability. Bank’s excellent quality of service. Integral and consistent management of the Santander brand CORPORATE SPONSORSHIPS has enabled it to be known throughout the world. Today it Corporate sponsorships continue to be the best platform is present in all the brand rankings of the main consultancy for enhancing the renown of the brand and consolidating firms, such as Interbrand, Millward Brown and Brand Finance. the Bank’s positioning at the international level. The five-year alliance with the Formula 1 Ferrari team has been a complete Progress continued in 2010 in consolidating the brand in key success. The return on the advertising in the first year covered markets for the Group. Santander adopted a single brand in the investment for 2010-2013. This sponsorship has proved the UK after integrating those of Abbey, Bradford & Bingley to be an excellent tool for business: the success of the launch and Alliance & Leicester. In just five years, Santander has of the Santander-Ferrari card in Spain, Brazil, Mexico and become a leading brand in UK banking, where it is known by Portugal is the best proof of this. more than 90% of the population. In November, Santander also had a single brand in Brazil following the integration of In the UK, Santander continued to sponsor the drivers of the Santander and Banco Real. McLaren Formula 1 team and in Latin America, for the fourth year running, the Bank will sponsor in 2011 the Santander As regards the challenges for 2011, in Poland the integration Libertadores Cup. Furthermore, in order to increase the link and change of brand of the business acquired from AIG will be with Latin America Santander will be the official bank of the completed and become Santander Consumer Finance. Copa América Argentina 2011, one of the world’s main football championships. United Kingdom: January and November 2010 REBRANDING OF ABBEY AND BRADFORD & BINGLEY REBRANDING OF ALLIANCE & LEICESTER Brazil: November 2010 UNIFICATION OF THE BANCO REAL AND SANTANDER BRAZIL BRAND ANNUAL REPORT 2010 23
  • 26.
    Banco Santander businessmodel GEOGRAPHIC DIVERSIFICATION Banco Santander’s geographic position is The Bank concentrates on 10 core Main countries. balanced between mature and emerging markets: Spain, Portugal, Germany, Other countries where Banco Santander has markets, which contributed 57% the UK, Brazil, Mexico, Chile, Argentina, retail banking businesses: Colombia, Peru, and 43% of profits in 2010, respectively. the US and, most recently, Poland. Puerto Rico, Uruguay, Norway, Sweden, This enables the Bank to maximise Finland, Denmark, Netherlands, Belgium, revenues and profits throughout the The Bank also has global business areas Austria, Switzerland and Italy. economic cycle. which develop activities in other countries as well as in the main markets. US-SOVEREIGN Customers (million) 1.7 Branches 721 Employees 8,647 Market share(8) 3% MEXICO Customers (million) 9.1 Branches 1,100 Employees 12,500 (1) Market share 15% (1) Ranking 3rd BRAZIL Customers (million) 24.7 Branches 3,702 Employees 53,900 (1) Market share 9% (1) (2) Ranking 3rd CHILE Customers (million) 3.1 Branches 504 Employees 11,595 (1) Market share 19% (1) Ranking 2nd ARGENTINA Customers (million) 2.3 Branches 324 Employees 6,466 Market share(1) 10% Ranking(1) (2) 1st 24 ANNUAL REPORT 2010
  • 27.
    UNITED KINGDOM Customers (million) 25.6 Branches 1,416 Employees 23,649 (1) Market share 11% (3) Ranking 2nd GERMANY(9) Customers (million) 6.2 Branches 142 Employees 3,483 Market share(4) 13% Ranking(5) 1st POLAND(10) Customers (million) 1.8 Branches 213 Employees 2,751 (6) Market share 10% (7) Ranking 2nd SPAIN Customers (million) 14.4 Branches 4,848 Employees 33,694 (1) Market share 15% (1) Ranking 1st PORTUGAL ATTRIBUTABLE PROFIT BY GEOGRAPHIC AREAS % of total operating areas Continental Customers (million) 1.9 Rest of Latin America 6% Europe 35% Spain retail Branches 759 Chile 6% networks 15% Employees 6,214 Mexico 6% Market share(1) 10% Portugal 4% Ranking(1) (2) 3rd Germany 4% Rest of retail (1) Loans, deposits and mutual funds. Europe 3% (2) Excluding state banks. (3) Loans and retail deposits. Brazil 25% (4) Consumer credits. (5) Among independent finance companies. Europe global (6) In new car sales of individuals. businesses 9% (7) In institutions specialised in consumer financing. (8) In its zone of influence. US-Sovereign (9) In January 2011, 173 more retail banking branches in Germany were incorporated into the Group. 4% (10) On March 25 Santander’s takeover of Bank Zachodni WBK was completed. UK 18% This will add 527 retail banking branches in Poland. ANNUAL REPORT 2010 25
  • 28.
    Banco Santander businessmodel EFFICIENCY With an efficiency ratio of 43.3%, Santander is one of the most efficient international banks Santander has a cutting-edge technological and operational customer fees. In Spain, the “We want to be your Bank” plan is platform in international banking, which enables it to achieve now five years old and more than 4 million linked customers high productivity and know in detail the overall financial needs benefit from zero commissions and other advantages. In the UK, of its customers. The Bank strives to centre all its resources on the Santander Zero Current Account was launched, which customer service, improving processes and optimising the eliminates commissions for certain services and on overdrafts and functioning of the support areas. gives free access to Santander ATMs throughout the world to, among others, customers who have a mortgage, an investment Santander continues to progress in the technological and product or their main current account with Santander UK. operational integration of all its units, which is creating value via synergies and cost savings. In 2010, all the Bank’s businesses DATA PROCESSING CENTRES in the UK were successfully integrated and now operate under Banco Santander’s technology drive led in 2010 to the the same brand and IT systems. As for Brazil, the technological construction of a new data-processing centre in Cantabria, integration of the commercial networks has already been Spain, which will be fully working at the beginning of 2012. completed. The experience that the Bank has accumulated This centre joins those that the Bank already has in Madrid, in the last few years enables it to execute these integration London, Querétaro (Mexico), and Campinas in the state of processes quickly and efficiently. São Paulo, Brazil. These centres have all the infrastructure needed to provide services to customers and manage the This strategy, combined with the recurrent growth in the Bank’s three trillion transactions processed every year. revenues, strict control of costs and very productive branches, makes Santander one of the most efficient international banks, The new data-processing centre in Cantabria will reduce with an efficiency ratio of 43.3%. operational risk to a minimum and will increase by 30% the space for storing data and the Group’s processing servers. The continuous improvements in efficiency have produced higher As well as the technological advances incorporated, the design value-added for customers, as shown by the decisions taken in and construction take into account the most demanding and some of the main markets where the Bank has eliminated innovative standards in energy efficiency and sustainability. GRUPO SANTANDER’S DATA-PROCESSING CENTRES Milton Keynes (UK) 16,450 MIPS* 3,110 servers Querétaro (Mexico) 11,800 MIPS* 1,686 servers Cantabria (Spain) Operational as of 2012 Boadilla (Spain) Madrid (Spain) 30,368 MIPS* 10,538 MIPS* 6,700 servers 1,328 servers Campinas (Brazil) 36,642 MIPS* 3,530 servers * MIPS: millions of instructions per second 26 ANNUAL REPORT 2010
  • 29.
    PRUDENCE IN RISK BancoSantander has better credit quality than its competitors in the regions where it operates Prudent risk management has been a hallmark of Banco SANTANDER HAS A LOW AND Santander since it was founded more than 150 years ago. PREDICTABLE RISK PROFILE This focus has played a decisive role in the growth in recurrent Retail banking accounts for 86% of Banco Santander’s risk. As it earnings and in generating shareholder value. is very close to its customers, Santander knows their risks well and this enables it to act rigorously and with anticipation when Everyone is involved in risk management, from the daily admitting, monitoring and recovering loans. Santander’s risk transactions in branches, where many business managers also profiles are highly diversified and their concentration in have risk objectives, to senior management, the executive customers, business groups, sectors, products and countries is committee and the board, whose risk committee comprises subject to limits. five directors and meets for 297 hours a year. Banco Santander has the most advanced risk management Of note among the corporate risk management principles is models, such as tools for calculating ratings and internal that the risk function is independent of business. The head of scoring, economic capital, price-setting systems via return on the Group’s Risk Division, Matías Rodríguez Inciarte, risk-adjusted capital (RoRAC), use of value at risk (VaR) in market third vice-chairman and chairman of the risk committee, risk, and stress testing. reports directly to the executive committee and to the board. The policy for provisions was very strict in 2010 for bad, Grupo Santander’s coverage in 2010 was 73% and the NPL doubtful and substandard loans, with very rigorous criteria ratio 3.55%. In Spain, the NPL ratio was 4.24% compared to for their classification. an average for the sector of 5.83%, while some of the Group’s units, such as Santander Consumer Finance, Brazil and Sovereign reduced their ratios during the year. *** Credit exposure to the construction and real estate sectors in Spain represented 3.7% of the Group’s total loans and 12% Banco Santander’s risk management principles are set out of total credit in Spain. Santander’s estimated market share of in greater detail on pages 154-158 of the annual report. this business is approximately10%, substantially lower than that of the Group’s total businesses in Spain (15%). All these risks are appropiately provisioned (coverage of 28%). NON-PERFORMING LOAN RATIO COVERAGE RATIO % % 3.55 91 3.24 75 73 2.04 2008 2009 2010 2008 2009 2010 ANNUAL REPORT 2010 27
  • 30.
    Banco Santander businessmodel DISCIPLINED USE OF CAPITAL AND FINANCIAL STRENGTH In an uncertain banking environment, Banco Santander significantly strengthened its balance sheet CAPITAL LIQUIDITY The core capital ratio, the main indicator of a bank’s solvency, Santander finances most of its loans with customer deposits, increased to 8.8% in 2010. This increase is the result of organic has wide access to wholesale financing and draws upon a generation of capital as well as the Santander Dividendo diverse range of instruments and markets to obtain liquidity. Elección programme (scrip dividend), which 85% of the Bank’s capital opted to accept. Banco Santander also continued in 2010 to bolster its liquidity, capturing EUR 109,000 million in deposits and EUR 38,000 During the last few years of financial crisis, Santander raised its million in medium- and long-term financing. This means core capital by more than 2.5 p.p., without the need of state Santander has no need to issue debt in Spain in 2011 and 2012. aid. This was largely achieved by generating organic capital, the Santander Dividendo Elección programme (scrip dividend), Banco Santander’s geographic diversification has also benefited the listing of Banco Santander Brazil and the capital increase its liquidity. Strong deleveraging and the capturing of deposits, with preferential subscription rights in 2008. mainly in mature markets, have had a positive impact on liquidity ratios, while growth in lending by the Group’s banks Santander’s core capital ratio is of very high quality, mainly in emerging markets was financed by increased deposits. consisting of capital and reserves. *** Santander applies very strict strategic and financial criteria to its new acquisitions. These have to be in countries and markets The main rating agencies affirmed their high ratings for that Santander knows well, must have a positive impact on Santander in 2010 (AA). Santander is one of only four earnings per share and must exceed the cost of capital by the international banks with an AA rating from the three third year after the acquisition. main agencies. CORE CAPITAL DEPOSITS+MEDIUM-AND LONG-TERM FINANCING/LOANS % % 115 8.8 8.6 106 104 7.5 2008 2009 2010 2008 2009 2010 28 ANNUAL REPORT 2010
  • 31.
    BANCO SANTANDER ANDTHE NEW FINANCIAL REGULATIONS Banco Santander’s subsidiary structure, financial soundness and prudence: The best formula for tackling the new economic scenario and international regulations The global economy requires an agile, solvent and well THE SUBSIDIARY MODEL supervised financial system to guarantee stability and The focus of Santander’s business model is retail banking with economic growth. Santander has a proactive and constructive a low and predictable risk profile and without any complex position in the design of the new regulatory and international interconnections. These factors clearly mitigate systemic risk. supervisory environment, which will be the framework of Furthermore, Banco Santander’s international expansion has activity for banks in the coming years. been carried out through a structure of legally independent subsidiaries. A fundamental element of this model is the Banco Santander participated during 2010 in the highest level principle of financial autonomy of local subsidiaries: international forums, where it set out its position on the key • Capital: Local units have the capital needed to autonomously issues of financial reform. Banco Santander attaches particular carry out their activity and tend to the regulatory requirements, importance to close and rigorous supervision; no regulation can without recourse to the parent bank. take the place of good supervision. • Liquidity: Each subsidiary develops its financial plans, liquidity The international regulatory debate is currently centred around projections and financing needs without counting on funds three main issues: and guarantees from the parent bank. The ALCO committees coordinate the liquidity position at Group level. • Implementing the capital and liquidity reforms known as Basel III. • Specific regulation of institutions considered systemic. This autonomy is compatible with strong corporate policies that ensure the Group’s co-ordination in spheres such as technology • Frameworks for resolving and managing a crisis. and risks. BASEL III The structure of financially autonomous subsidiaries reduces the The new Basel III regulations are a very important step for possibilities of systemic risk contagion among the Group’s units. strengthening the international financial system via more This structure is also submitted to a two-pronged supervision, demanding and higher quality capital ratios. As regards the by the home supervisor and the local one, and has very positive new liquidity requirements, it is very important that the final implications with regard to resolving and managing a crisis. definition reflects the differences associated with the various banking business models and avoids collaterally penalising Banco Santander, in line with the requirements of the Financial the flow of loans to the real economy. Stability Board in crisis resolution and management matters, was the first international bank to send its living will to its supervisor. This plan highlights the strength of Banco Santander’s business model and the advantages for the Group of the structure of its subsidiaries. III International banking conference, September 15th 2010, Grupo Santander City, Boadilla del Monte, Madrid, Spain. ANNUAL REPORT 2010 29
  • 32.
    SANTANDER’S BUSINESSES IN 2010 Santander branch in SMo Paulo, Brazil
  • 33.
    GRUPO SANTANDER RESULTS Santander’snet attributable profit in 2010 was EUR 8,181 million. The recurrence of profits, which for the fourth year in a row were more than EUR 8,000 million, is based on a business model that focuses on retail banking, geographic diversification and the strength of Santander’s balance sheet. These results enabled the Bank, for the second year running, to provide total shareholder remuneration of EUR 0.60 per share. The Group’s results are increasingly more geographically diversified: Continental Europe contributes 35% of profits (the commercial networks in Spain 15%), Latin America 43% (Brazil 25%), the UK 18% and Sovereign in the US 4%. The Group kept up intense activity in 2010. Deposits grew 22% and loans 6%. Gross income increased 6.8%, spurred by the most commercial revenues such as net interest income, fee income and insurance, as well as the contribution of the new units. Costs remained under firm control in almost all countries in which the Group operates. This, coupled with revenues, pushed up net operating income by 3.9%. The efficiency ratio of 43.3% was one of the best among international banks. Profit was 8.5% lower than in 2009 because of the Bank’s decision to apply very prudently and conservatively the Bank of Spain’s new regulations on provisions, which absorbed EUR 472 million of the third quarter’s net profit. The credit quality of the Group’s main units improved in 2010, with falls in net entries of bad loans and in the risk premium. The NPL ratio rose from 3.24% in 2009 to 3.55%, a slower pace of growth than in 2009 and 2008. The ratio was lower in Brazil, Sovereign and Santander Consumer Finance. NPL coverage was 73% and the Group’s generic provisions amounted to EUR 5,846 million. Santander has a comfortable liquidity position. In 2010 it increased its deposits by EUR 109,000 million, captured EUR 38,000 million in debt issues and improved the main liquidity ratios. Core capital, the main measure of a bank’s solvency, was 8.8% and is expected to surpass 9% in 2011. 31
  • 34.
    CORPORATE TRANSACTIONS Banco Santanderstrengthens its presence in its core markets GERMANY UNITED KINGDOM SEB branches Royal Bank of Scotland branches Santander has been operating in Germany for more than The UK, which contributed 18% of the Group’s attributable 20 years through a consumer finance business that is a leader profit in 2010, is one of Santander’s core markets. Santander in this segment of the market and which contributed 4% of the entered retail banking in the UK in 2004 when it acquired Group’s profits in 2010. Abbey. In just six years, it has become one of the leading banks in the country in terms of deposits, efficiency and profitability. In July, Santander reached an agreement with the Swedish financial group Skandinaviska Enskilda Banken (SEB Group) In August 2010, Santander UK reached an agreement to acquire to acquire its retail banking business in Germany for EUR 555 the part of the business that the Royal Bank of Scotland million. This operation was completed on January 31, 2011, conducted via its branches in England and Wales, and of the with the integration of SEB’s branches into Santander Consumer NatWest network in Scotland. The price was £1,650 million. Bank in Germany. This acquisition will add 173 branches to the Group, offering The acquisition includes 311 RBS branches in England and services to one million customers including 10,000 SMEs. It also Wales, seven of NatWest in Scotland, 40 SME banking centres, boosts Santander’s balance sheet in Germany with EUR 8,500 four company banking centres and three private banking million of loans and EUR 4,600 million of deposits. As a result of centres. The operation affects 1.8 million individual customers, this operation, Santander will double its number of branches in 244,000 SMEs and 1,200 company banking clients. Germany, have 7 million customers and EUR 30,000 million in customer loans. The new branches will operate under the Santander brand in the first half of 2011. This acquisition is also strategically very important for the Group, as it is a natural step toward developing retail banking beyond consumer finance in Germany, the euro zone’s largest economy and the European country with the largest volume of deposits. 173 branches 318 branches 1 million customers 1.8 million individual customers Investment: EUR 555 million Investment: £ 1,650 million 32 ANNUAL REPORT 2010
  • 35.
    POLAND MEXICO Bank Zachodni WBK Acquisition of 25% of Santander Mexico Poland is one of east Europe’s most attractive markets due to Santander is Mexico’s third largest financial group by business the size of its economy and its good medium- and long-term volume, with a market share of 13.5% in loans and 15.1% in prospects. It is a country that Banco Santander knows well savings, 1,100 branches and 9.1 million customers. It has been through its experience there since 2004 via Santander conducting retail banking in the country for 13 years. Consumer Bank. Banco Santander acquired in 2010 the 25% of Santander Banco Santander agreed in September to buy Allied Irish Bank’s Mexico that Bank of America held since 2003. Banco Santander 70.36% stake in Poland’s Bank Zachodni WBK, a transaction now fully owns Santander Mexico, whose contribution to the carried out through a takeover bid for all of the capital. In Group’s profits will increase to 7%. March 2011 Banco Santander announced completion of the acquisition, after securing tender acceptances representing 95.67% of the bank's capital. The total amount of the The purchase cost $2,500 million, a price which valued operation, including the 50% stake that Allied Irish Bank had in Santander’s businesses in Mexico at $10,000 million. This BZ WBK Asset Management (EUR 150 million in cash), was EUR acquisition will have a positive impact on earnings per share 4,139 million. of 1.3% as of the first year. Bank Zachodni, headquartered in Wroclaw, is Poland’s third This operation strengthened Santander’s commitment to Latin largest bank by profits (EUR 244 million in 2010) and branches America and in particular to Mexico, a country where the Group (527 throughout the country). It has EUR 10,500 million of has a significant growth potential thanks to the good economic deposits and EUR 8,700 million of loans (market shares of 6.4% outlook and the solid, efficient and competitive business model and 4.7%, respectively). It is Poland’s second best bank in terms of the Mexican franchise. of efficiency and has good liquidity and solvency positions. This acquisition will make a positive contribution to Santander’s earnings per share right from the start. This operation enables Santander to enter universal banking in Poland with force and deepen its geographic diversification in large emerging markets with high growth potential. Santander in Mexico 527 branches 1,100 branches 2.4 million customers 9.1 million customers Investment: EUR 4,139 million Additional investment: $2,500 million ANNUAL REPORT 2010 33
  • 36.
    CONTINENTAL EUROPE Santander strengthensits leadership in its core markets of Continental Europe and generates a net attributable profit of EUR 3,885 million Santander is the leader in retail banking in Spain, via the ATTRIBUTABLE PROFIT Santander and Banesto branch networks, and in private Million euros – 22.8% 5,031 banking. Santander Totta is the largest bank in terms of profits 3,885 (1) in Portugal. Santander is the consumer finance leader in Germany and, since February 2011, also provides retail banking services. Santander also has wholesale businesses, asset management and insurance in Continental Europe. In 2010, Continental Europe’s revenues were dented by the weak economic environment, particularly in Spain and Portugal. Operating costs, meanwhile, remained flat in the main commercial units. The efficiency ratio was 38.6% and net operating income was 5.0% lower than in 2009. 2009 2010 (1) EUR 4,357 million before the impact of Bank of Spain circular 3/2010 (-13.4%) The area’s attributable profit was EUR 3,885 million (35% of the Group’s total). This was 22.8% lower than in 2009 as it was affected by Santander’s decision to apply very conservatively and prudently the Bank of Spain’s new regulations on MANAGED CUSTOMER FUNDS provisions. This meant reducing the profit generated in Spain Billion euros + 9.6% by EUR 472 million. 352 Activity in 2010 centred on capturing customer funds as demand for loans was very weak. 321 For the third year running, Grupo Santander was chosen by the magazine Euromoney as the Best Bank in Spain (Santander and Banesto) and in Portugal (where The Banker also awarded it their prize). 2009 2010 Total Santander Santander Continental CONTINENTAL EUROPE Branch Network Banesto Portugal Consumer Finance Rest Europe Customers (million) 9.3 2.5 1.9 15.6 0.4 29.7 Branches (number) 2,931 1,762 759 519 92 6,063 Employees (number) 18,893 9,742 6,214 13,852 5,817 54,518 Customer loans* 111,372 75,624 30,102 63,342 43,221 323,660 Managed customer funds* 112,531 98,325 33,927 38,118 68,936 351,836 Net operating income* 2,769 1,376 650 3,361 1,637 9,794 Attributable profit* 1,243 419 456 811 957 3,885 Efficiency (%) 42.8 42.8 45.4 27.5 43.1 38.6 (*) Million euros 34 ANNUAL REPORT 2010
  • 37.
    Branch of Santanderin Calle Alcalá, Madrid. Spain SPAIN - SANTANDER BRANCH NETWORK The Santander Branch Network Despite the reduced demand for loans, This achieved two objectives: an increase contributed EUR 1,243 million to the more than 285,000 lending transactions in the customer base and strengthening Group’s results, 38.0% less than in 2009. were executed for a total of more than the Group’s balance sheet and liquidity. EUR 35,000 million. Of note were the As a result of this strong contribution to The focus of the strategy of the operations conducted via programmes customer funds, Santander’s market Santander Branch Network in 2010 was with state institutions and regional and share rose by more than 100 b.p. to on achieving closer, more profitable and local governments, and above all the 9.0%. lasting relations with customers, through contribution of the Santander Branch its 2,931 branches. Network to the financing programmes The strategic plan, “We want to be your of the Official Credit Institute (ICO), Bank” remained in force after five years. In an environment of low economic where it remained the market leader It is the main driver behind capturing new growth, an increase in non-performing with a market share of 18% as a result customers. The total number of loans and low interest rates, the of granting more than 50,000 loans, customers in Spain reached 9.3 million, Santander Branch Network concentrated especially to SMEs and businesses in 4.2 million of whom benefit from the in 2010 on intensifying commercial Spain. plan and are exempt from paying service activity, defending spreads, maintaining commissions. flat costs and active risk management. Customer funds grew much more The good results of this management led strongly, particularly in the first half of Santander attained these results while to gross income of EUR 4,841 million. 2010 because of the “Depósito Ganador” keeping costs flat and without reducing and “Cuenta Crecimiento” campaigns. its installed capacity. Banco Santander’s The year 2010 was particularly The balance of deposits increased by EUR non-performing loan ratio at the end of significant for commercial activity. 13,240 million. 2010 was 4.24%, well below the sector’s average of 5.83%. ATTRIBUTABLE PROFIT CUSTOMERS Million euros – 38.0% Million + 0.4 mill. 2,005 9.3 8.9 1,243 (1) 2009 2010 2009 2010 (1) EUR 1,536 million before the impact of Bank of Spain circular 3/2010 (-23.4%). ANNUAL REPORT 2010 35
  • 38.
    Continental Europe Santander Totta, Lisbon, Portugal SPAIN - BANESTO PORTUGAL Banesto contributed net attributable profit of EUR 419 million in Net attributable profit was EUR 456 million, 14.2% lower 2010, 43.2% less than in 2009 and largely due to the effort than in 2009. made in provisions. Against a background of a sharp slowdown in economic and Banesto focuses on retail banking services with individual financial activity, and strong restrictions on Portuguese banks’ customers, SMEs and companies, and together they generate access to international financing markets, Santander Totta 82% of the bank’s gross income. Its 2.5 million customers are maintained solid capital and efficiency ratios, as well as higher tended to in 1,762 branches and through its multi channel levels of profitability than those of its competitors. platform. The online bank, ibanesto, has more than 150,000 customers and in 2010 was the leader in capturing funds in One of the strategic priorities of 2010 was the greater emphasis direct banking in Spain. placed on capturing funds (+45% in deposits). This, coupled with weak demand for loans by individual customers and Despite the strong pressures exerted by a difficult economic companies, produced a better financial structure and enabled environment, in 2010 Banesto managed to improve its Santander Totta to maintain a comfortable liquidity position. competitive position and was the sector’s reference in efficiency and risk quality. It also notably bolstered its capital and liquidity In 2010, Santander Totta launched two innovative products in position and increased the number of customers and their the Portuguese market: the “Soluciones Integradas” campaign, degree of linkage: which offers a higher return on deposits and also provides access in special conditions to various credit lines; and the • 270,000 new individual customers and 82,000 companies “Gestor de Pagos y Cobros” which aims to deepen the relation and SMEs were captured. with SMEs, the backbone of the Portuguese economy. • Total private sector funds increased 6.5%. The 6.2% decline in gross income was mainly due to the higher • The efficiency ratio was 42.8%, a notable figure given the cost of financing, the lower demand for loans and stiffer complicated economic context. competition to capture funds. Another of the year’s priorities • The non-performing loan ratio was 4.11%. was rigorous control of operating costs (-0.6%). Risk continued to be actively and prudently managed as well as the focus on • Capital ratios increased through organic growth, with the loan loss recoveries. At the end of 2010, the non-performing core capital ratio reaching 8.3%. loan ratio was 2.90% and coverage 60%. The magazine Global Finance included Banesto among the world’s 50 safest banks for the second year running. Santander Totta consolidated itself as Portugal’s leading bank in terms of financial strength and solvency. The bank has the highest Tier 1 capital ratio in the sector (11.2%) and obtained the best results in the stress test conducted on banks in Portugal, as well as the best rating of a bank in the country. 36 ANNUAL REPORT 2010
  • 39.
    SANTANDER CONSUMER FINANCE SantanderConsumer Finance is the Group’s division specialised in consumer finance. Its business model is based on providing customers with financial solutions via more than 145,000 distributors. Once a relation is started with a customer, Santander Consumer Finance increases customer linkage and loyalty by directly offering them other products such as credit cards and personal loans. RESULTS IN 2O1O Santander Consumer Finance generated a record net attributable profit of EUR 811 million, 28.9% more than in 2009. Lending rose 11% to EUR 63,342 million, thanks to strong commercial activity and integration of the new credit portfolios Branch of Santander Consumer Bank in Austria in Poland and the US. Deposits increased 16% to EUR 25,950 million. The efficiency ratio remained at 27.5%, one of the best in its LENDING BY COUNTRIES sector, while the non-performing loan ratio reached a turning % point and dropped to 4.95%. Germany 32% Santander Consumer USA’s profit was EUR 255 million, spurred by a sharp rise in lending. The Nordic countries and the UK also Netherlands 2% performed well, with significant growth in profits. Santander Austria 2% Consumer Spain, in a very weak market, recovered its leadership Portugal 2% position in auto finance. UK 5% US 19% GERMANY Poland 5% Attributable profit was EUR 435 million, 4% of the Group’s total. Santander Consumer is the country’s consumer finance Nordic countries 9% leader with a market share of 12.8%. Spain 12% Italy 12% The acquisition of 173 retail banking branches from the Swedish group SEB was completed on January 31, 2011. This doubled the number of Santander’s branches in Germany to 315 and added more than one million customers. LENDING BY SEGMENTS % OTHER ACQUISITIONS AND INTEGRATIONS Cars – new 27% In Poland, approval was given to merge Santander Consumer Bank and AIG Bank Polska. This transaction increased the number of Santander Consumer branches in this country to 213. Credit cards 2% Santander Consumer USA acquired consumer finance portfolios Stock Finance 4% from HSBC and Citi amounting to $7,500 million. An agreement Others 6% Cars- second hand was also reached to manage the servicing of $7,200 million of 35% Electrical household third party funds. appliances 5% Mortgages 6% Direct businesses 15% ANNUAL REPORT 2010 37
  • 40.
    UNITED KINGDOM Santander UKposted net attributable profit of EUR 1,985 million, carried out strong commercial activity and brought all its businesses under the Santander brand Santander UK has 1,416 branches serving its 25.6 million Santander UK generated attributable profit of £1,701 million, customers. It is the UK’s second largest bank by deposits, 10.7% more than in 2009. Its contribution to the Group’s total number of branches and mortgages. It completed in 2010 the profit increased from 16% to 18%. technological integration and rebranding of the former branches of Abbey, Alliance & Leicester and Bradford & The drivers behind the good results were gross income (+3.7%), Bingley. For the third year running, the magazine Euromoney strict control of costs, savings and synergies from the integration named Santander the best bank in the UK, while The Banker of businesses and a prudent risk policy. The efficiency ratio was did so for the second time. below 40% (39.4%), one of the best among British banks (the average is around 50%) and the non-performing loan ratio was 1.76%, only 5 b.p. more than in 2009. ATTRIBUTABLE PROFIT + 15.0%* Million euros 1.985 1.726 2009 2010 * In sterling: +10.7% UNITED KINGDOM Customers (million) 25.6 Branches (number) 1,416 Employees (number) 23,649 Customer loans* 233,856 Managed customer funds* 271,386 Net operating income* 3,567 Attributable profit* 1,985 Efficiency (%) 39.4 (*) Million euros 38 ANNUAL REPORT 2010
  • 41.
    BUSINESS STRENGTH CUSTOMER-FOCUSED In an environment of low economic and financial activity, One of the main objectives of Santander UK is to increase Santander UK was characterised by its business growth. customer loyalty by offering high value-added products. One of them is the Santander Zero Account, 194,000 of which The stock of mortgages rose 3% to £166,000 million. Santander were opened, which waives various service fees for costumers UK’s market share of new mortgage lending in 2010 was 18%, with a mortgage. This offer will be extended to customers with compared to a 14% share for the total stock of its mortgages. savings accounts as of 2011. Other products are the Zero Credit Loans to SMEs grew 26%, underscoring Santander UK’s drive Card and the Loyalty Tracker Bond. to support the recovery of the UK economy. Santander UK announced in 2010 that, in order to raise its This growth in lending was done prudently: new mortgages service quality levels, it would hire 1,000 people to strengthen had an average loan-to-value of 63%; personal loans were only customer attention in its branches and would begin to provide granted to existing customers with a good history of payment again its call centre service from the UK (provided from India (these loans fell 24%) and credit growth went hand-in-hand before). All of this in the framework of an integral plan to make with a notable rise in managed customer funds. Santander UK one of the best banks in terms of customer satisfaction. Retail deposits rose 7% to £153,500 million. Around one million current accounts were opened in 2010 for the second straight BUSINESS INTEGRATION AND EXPANSION year. Total managed customer funds increased 7% to £233,600 Santander UK integrated during 2010 its three commercial million. networks – Abbey, Alliance & Leicester and Bradford & Bingley – under the Santander brand. The technological integration was completed in record time and will enable Santander’s customers in the UK to benefit from access to more than 1,400 branches. Santander UK continued to increase its distribution capacity with the acquisition of 88 branches from Halifax and an agreement with Royal Bank of Scotland to purchase 311 RBS branches in England and Wales and seven NatWest branches in Scotland. GROSS INCOME AND COSTS (*) EFFICIENCY RATIO – 1.4 p.p. +7.7 % (with amortisations) % 40.8 +3.8 39.4 Gross income Costs 2009 2010 (*) Gross income in sterling +3.7% and costs -0.1% Santander branch in London, UK ANNUAL REPORT 2010 39
  • 42.
    LATIN AMERICA Santander postednet attributable profit of EUR 4,804 million and consolidated itself as the leading financial franchise in Latin America The Group has leadership positions in the most dynamic and Santander remained committed to the region’s “bankarisation” solid economies such as Brazil, Mexico, Chile and Argentina, and development. The pace of lending continued to quicken with an overall market share in the region of 10%. Latin and reached 15% at the end of 2010, spurred by Brazil, Mexico America contributes 43% of the Group’s total profits and is and Chile. Santander’s market share of loans in the countries one of the main drivers of Santander’s growth. where it operates is 11.5%. The Latin American economy recovered strongly in 2010 from Under the slogan “Crecer con cliente” the three-year “América the global financial crisis and, along with Asia, was one of the 20.13” plan was launched to drive greater growth in revenues engines of global growth. This recovery was not based solely through a larger, more linked and more satisfied customer base. on a pick up in external demand, but also on the strength of domestic demand, job creation and an upturn in lending. Santander has 5,882 branches and 27,550 ATMs for its 40 million customers. The focus of the Group’s commercial strategy in 2010 was to increase transactional business of corporate clients and institutions, raise the linkage of medium and high income segments through the capturing of payroll cheques and a greater emphasis on attracting customer funds. ATTRIBUTABLE PROFIT CUSTOMER LOANS Million euros + 25.3%* Billion euros + 30.0%* 127 4,804 3,833 98 2009 2010 2009 2010 (*) Excluding the exchange-rate impact:+10.5% (*) Excluding the exchange-rate impact: +14.7%. LATIN AMERICA Brazil Mexico Chile Argentina Uruguay Colombia Puerto Rico Peru Rest Total Customers (million) 24.7 9.1 3.1 2.3 0.2 0.3 0.5 0.1 0.1 40.3 Branches (number) 3,702 1,100 504 324 43 76 121 1 11 5,882 Employees (number) 53,900 12,500 11,595 6,466 817 1,343 1,820 41 1,044 89,526 Customer loans* 71,027 15,156 25,732 3,914 1,013 1,935 4,066 421 4,005 127,268 Managed customer funds* 137,931 31,622 30,674 5,478 2,468 2,880 8,790 357 15,888 236,087 Net operating income* 9,037 1,458 1,311 454 76 75 186 11 198 12,805 Attributable profit* 2,836 682 683 297 67 41 38 7 153 4,804 Efficiency (%) 37.0 38.7 36.0 45.1 55.1 59.9 48.7 36.6 54.3 38.4 (*) Million euros 40 ANNUAL REPORT 2010
  • 43.
    Santander Brazil’s netattributable profit of EUR 2,836 million represented 25% of the Group’s total. The Bank consolidated its position as the country’s third largest private sector financial institution, with 3,702 branches and 25 million customers BRAZIL Santander Brazil carried out its business in 2010 in a favourable economic environment, as Brazil was one of the economies that best and most quickly overcame the international crisis. In the last few years, Brazil’s GDP growth rates have been more than double those of the main developed economies. Growth in 2010 was 7,5%. Macroeconomic stability enabled the country to combine high growth with a shrinking budget deficit and external debt. The process of “bankarisation” continued, well anchored in the country’s economic and financial stability, sustained growth and development of the middle classes. Santander has invested more than $27,000 million in the last 10 years in Brazil, underscoring its long-term commitment to the country and making it one of the main foreign investors in Brazil. ACTIVITY AND RESULTS Lending increased 16%. Credit to individual customers rose 18% and to companies 22%. Such growth is contributing to the country’s “bankarisation.” Savings, including mutual funds and deposits, grew 6% in 2010 (demand deposits +16% and mutual funds +12%). Santander Brazil’s market share of loans is 10.8% (11.5% in unrestricted lending) and 8.8% in deposits. The good performance of revenues and costs kept the efficiency ratio at 37%, while credit quality improved. The non-performing loan ratio declined to 4.91% from 5.27% in 2009. In local currency, the Group’s attributable profit increased 10.4% and in terms of continued operations (i.e. excluding the Torre Santander where 4,500 Santander employees work in São Paulo, Brazil. minority interests of Santander Brazil after its IPO in October 2009) it was 24.4% higher. ANNUAL REPORT 2010 41
  • 44.
    Latin America -Brazil INTEGRATION OF SANTANDER AND BANCO REAL At the beginning of 2011, the IT platforms of Santander and The Bank dedicated a large part of its efforts in 2010 to Real were already integrated, enabling the Group’s 25 million integrating Santander and Banco Real by implementing the best customers to access any of Santander’s 3,702 branches. operational and commercial practices of the two banks and unifying the brand and the IT platform. Santander aims to become the best bank in Brazil for customer satisfaction, shareholder remuneration, the best bank to work Right from the first moment of integration, the customers of for and to have the best corporate reputation in Brazil. The plan both networks benefited from the best products and services also includes commitment to grow organically, with the of each bank, such as “SantanderMaster”, which provides 10 opening of 600 new branches over the next three years. days of commission-free overdraft and can reduce interest payments for this item by half; the “Santander Van Gogh” Investors from Qatar invested $2,819 million in Banco Santander spaces in branches with special services for high income Brazil in 2010 ($2,719 million by Qatar Holding) through a customers; the Flex credit cards with five extra days without subscription of a bond issue which will be exchanged for shares interest; the “SuperGiro Premium” credit lines to optimise the in Banco Santander Brazil within three years. This will make cash flow of SMEs and the “Cuenta Integrada”, also for SMEs Qatar Holding the owner of a 5% stake in Banco Santander with point-of-sale terminal to receive credit card payments. Brazil and enables Banco Santander Brazil to advance in its objective of listing 25% of its capital. The brand was unified in the last part of the year, with the incorporation of the logo and Santander’s corporate identity to Real’s branches and points of customer attention. ATTRIBUTABLE PROFIT Million euros + 30.9%* CUSTOMERS Million + 2.3 mill. 2,836 24.7 22.4 2,167 2009 2010 2009 2010 (*) Excluding the exchange-rate impact: + 10.4% Santander branch in São Paulo, Brazil 42 ANNUAL REPORT 2010
  • 45.
    Advertising of theSantander Libertadores Cup MEXICO ARGENTINA Santander Mexico is the country’s third largest financial group, Santander Río is a leading franchise with 2.3 million customers with a market share of 13.5% in loans and 15.1% in bank and market shares of around 10% in loans and bank savings. It savings. It has 1,100 branches for its 9.1 million customers. The generated an attributable profit of $393 million, with a very magazine Euromoney named it the best bank in Mexico in 2010. positive performance of all items of the income statement. Attributable profit was $902 million, 6% of the Group’s total. In During 2010, 17 branches and all the retail businesses of BNP local currency, profit growth was 22.7%. The drivers were active Paribas Argentina were incorporated, strengthening Santander’s management of spreads on loans and deposits, appropriate presence in Buenos Aires. Santander will open 50 new branches management of commissions, control of costs and a focus on by the end of 2011, most of them in the interior of Argentina. loans in default, which reduced the requirement for provisions. Grupo Santander increased its investment in Mexico by $2,500 OTHER COUNTRIES million by acquiring Bank of America’s 25% stake in Santander Mexico. After this transaction, and taking into consideration the Santander Uruguay is the country’s largest private sector bank country’s good growth prospects, a three-year organic growth by business volumes and branches. It has a market share of plan was launched, based on retail banking, linkage of current 17.1% in loans and 16.7% in bank savings and 43 branches. customers and attracting new ones. The strategy in 2010 centred on linking individual customers and providing special attention to the tailored high-income customer attention model. Greater linkage of SMEs and CHILE companies was also sought, fostering greater use of transaction products. Santander Chile is the leading financial group by total assets and profits, with market shares of 20.9% in loans and 17.6% in In Colombia, Santander focused its business on linkage of bank savings. Attributable profit was $904 million, the efficiency high and medium income customers and on strengthening ratio 36.0% and ROE 30.5%. transaction businesses and insurance. The market share in loans was 2.9% and in bank savings 2.8%, respectively. The strategy in 2010 was to return to business growth, fuelled again by the development of retail banking and contributing In Puerto Rico, the Bank continued to be one of the three to greater “bankarisation.” This was accompanied by improved main financial institutions by loans, deposits and mutual funds. levels of customer linkage and the sale of products, particularly Its positive return makes it stand out from the market, thanks cards, insurance and mutual funds. Following the earthquake to appropriate management of prices, discipline in risk and strict that rocked Chile on February 27, 2010, Santander was one of control of costs. the country’s most active companies in supporting its customers from the very first day after the disaster as well as in the Activity in Peru centres on companies and tending to the subsequent reconstruction. Group’s global clients. ANNUAL REPORT 2010 43
  • 46.
    UNITED STATES-SOVEREIGN Sovereign generatednet attributable profit of EUR 424 million and continued to make progress in its integration Santander conducts retail banking in the US via Sovereign SOVEREIGN: ATTRIBUTABLE PROFIT 178 Bank, which has 721 branches, 2,337 ATMs and more than US$ million 8,600 employees serving 1.7 million customers. 157 132 Grupo Santander also has consumer finance businesses in the 95 US via Santander Consumer Finance USA1 and has a wholesale banking office in New York1. Sovereign is based in Boston and focuses its activity on the US 4 northeast, one of the country’s strongest regions. It has a noteworthy presence in New York, Massachusetts, Pennsylvania, -4 -10 Rhode Island, New Hampshire, Connecticut, New Jersey and Maryland. -25 Q1’09 Q2’09 Q3’09 Q4’09 Q1’10 Q2’10 Q3’10 Q4’10 When Santander completed the acquisition of Sovereign in 2009, this bank had made a loss during three consecutive years. GROSS INCOME AND COSTS* EFFICIENCY – 15.7 p.p. Since then the bank’s management has concentrated on US$ RATIO restoring stability and profitability to commercial business. (with amortisations) This was achieved in record time; in the fourth quarter of 2009, % less than a year after the acquisition, Sovereign made a profit, +26.5 which has increased in every quarter since then. 60.2 44.5 -8.1 Gross income Cost 2009 2010 (*) On a like-for-like basic UNITED STATES - SOVEREIGN Customers (million) 1.7 Branches (number) 721 Employees (number) 8,647 Customer loans* 36,724 Managed customer funds* 36,763 Net operating income* 1,169 Attributable profit* 424 Efficiency (%) 44.5 (*) Million euros 1. The results of these businesses are recorded within Santander Consumer Finance and the Global Wholesale Banking division, respectively. 44 ANNUAL REPORT 2010
  • 47.
    Branch of Sovereignin Federal Street, Boston, United States RESULTS IN 2010 ACTIVITY Sovereign posted attributable profit of $561 million compared Sovereign continued to optimise its balance sheet and to a loss of $35 million in 2009. increasing its returns on loans and funds. These results were supported by solid growth in gross income New lending grew 13% and the average spread on loans rose (+26.5%), driven by net interest income as a result of the 28 b.p., in line with the higher cost of liquidity and a stricter risk repricing of loans and a lower cost of deposits. policy. This growth in credit was centred on the more attractive business segments such as residential and multifamily. Operating costs fell 8.1%, in line with the strategy of cost saving and generation of synergies derived from Sovereign’s The profitability of business banking increased as a result of integration into Grupo Santander. The efficiency ratio continued campaigns to increase the degree of linkage of these clients, to improve quickly to 44.5% in 2010 (down from 74.5% at the while continuing to reduce the portfolio of higher risk loans. time of the acquisition). One of the main strategies undertaken during 2010 was Better Net loan-loss provisions continued to decline and in the fourth Banking, which aims to drive retail banking by offering better quarter of 2010 reached their lowest level in the last two years, products; grouping marketing campaigns in order to obtain thanks to prudent risk management and the effort made to greater visibility, attract a larger number of customers and push recover loans in default. The non-performing loan ratio dropped commercial actions via incentives for branch employees. to 4.61% from 5.35% and coverage rose from 62% to 75%. SOVEREIGN, A BANK IN TRANSFORMATION The process of transforming Sovereign began immediately after it was acquired, adopting the business model, organisational structures and the policies and models of Grupo Santander. In the first phase, the focus was on stabilising the income statement, through normalising risk and cost policies. At the same time, a deeper process of change was begun to streamline the retail banking model, focusing it mainly on individuals and SMEs and eliminating or reducing the least profitable business lines. This process of transformation will continue in 2011 with installation of the corporate IT platform Partenón, which will help to achieve additional synergies in costs and prepare the Bank for its commercial relaunch. Branch of Sovereign in Burlington, Massachusetts, United States ANNUAL REPORT 2010 45
  • 48.
    GLOBAL BUSINESSES Banco Santanderhas global GLOBAL WHOLESALE BANKING businesses that operate in an Santander Global Banking & Markets provides products and integrated way with local retail services to satisfy the financial needs of large corporations and institutional investors in 21 countries. It has local and global franchises teams (2,638 employees) with deep knowledge about their markets. Tailored solutions cover all financing, investment and hedging needs. Business is structured around six areas: 1. Global transaction banking 4. Rates Embraces cash management (services associated Cover all trading activities in financial markets with making and receiving payments and commercial involving interest and exchange rates. financing), trade finance and basic financing for institutions and corporations with an international 5. Global equities presence. Involves all businesses related to the equity markets. 2. Corporate and investment banking 6. Market making Integrates hedging at the global level of financial Manages the Group’s short and long-term positions institutions and large corporations, as well as M&A in various fixed-income and equity markets. and asset and capital structuring teams. 3. Credit markets Groups origination and distribution units for all structured credit and debt products. GLOBAL WHOLESALE BANKING ATTRIBUTABLE PROFIT – 1.8% Million euros Million euros 2,698 (1) Customer loans 69,179 2,748 Customer deposits 83,689 Net operating income 4,027 Attributable profit 2,698 Efficiency (%) 26.9 2009 2010 (1) EUR 2,733 million before the impact of applying Bank of Spain circular 3/2010 (-0.5%) 46 ANNUAL REPORT 2010
  • 49.
    Santander Global Banking& Markets posted net attributable profit of EUR 2,698 million in 2010, 1.8% less than in 2009 BUSINESS IN 2010 LARGE TRANSACTIONS IN 2010 Santander Global Banking & Markets generated attributable Santander Global Banking & Markets participated in the year’s profit of EUR 2,698 million, 24% of the Group’s total operating largest transactions, covering the needs of its clients in Europe areas and 1.8% lower than in 2009. Given that 2009 was an and the Americas. Some examples of this are: exceptional year with record revenues and profits for this type • Santander was the bookrunner in the largest equity issue of business because of a highly favourable competitive in the world by the Brazilian oil company Petrobras. environment, the performance in 2010 was noteworthy. Santander Global Banking & Markets consolidated in 2010 its • Santander advised Brisa, the largest manager of motorway market share and results attained in prior years in a still difficult concessions in Portugal, on selling its 16.35% stake in Brazil’s market context. CCR and placing the rest in the market. This was the largest infrastructure operation in Brazil in 2010. This positive performance was backed by a customer-focused • Santander Global Banking & Markets was the global business model, the division’s global scope and its coordinator for the international tranche of the IPO of OHL interconnection with local units. Other factors were strict Mexico in November, the largest in the Mexican market in control of risk and the strength of the Group’s capital and the last 10 years ($458 million). liquidity. • Copec, Chile’s main distributor of fuel and lubricants, acquired The Global Relationship Model, which unifies management Terpel, the Colombian leader in this sector, for $240 million. of 775 corporations and 158 institutions in the global sphere, Santander Global Banking & Markets was the sole advisor continued to be deepened in 2010. This focus on client of Copec, the largest merger and acquisition in Chile in 2010. revenues, which increased 3%, makes Santander’s wholesale banking business less dependent on the evolution of markets than its competitors. To reinforce its leadership positions in its core markets, Santander Global Banking & Markets made additional investments in 2010 in resources and capacities. This, combined with strict management of costs, enabled it to maintain an efficiency ratio of 26.9%, which continues to be the benchmark for its competitors. GROSS INCOME BY BUSINESS SEGMENT GROSS INCOME BY GEOGRAPHIC AREA % of the total % Transaction banking 27% Europe 50% US 3% Corporate and investment banking Mexico 8% Treasury 3% and portfolios 14% Credit 19% Rest 5% Equities 15% Brazil 31% Chile 4% Interest rates and exchange rates 22% ANNUAL REPORT 2010 47
  • 50.
    ASSET MANAGEMENT GLOBAL PRIVATE BANKING Santander Asset Management covers Grupo Santander’s The Global Banking division includes companies specialised asset management activities and offers a broad range in financial advice and wealth management for Grupo of savings and investment products to meet the needs of Santander’s high income clients. clients, distributed globally by all the Group’s networks. It conducts its business in Europe via: Its activity revolves around three business areas: • Banif in Spain. • Santander Asset Management for mutual and pension funds, • Santander Private Banking in Switzerland and Italy, Santander investment companies and discretional portfolios. Totta in Portugal and Santander Private Banking UK and • Santander Real Estate, which manages investment products. Abbey International in the UK. • Santander Private Equity for venture capital. In the Americas, Santander Private Banking operates in the US, Brazil, Chile and Mexico. The customer advisory model, based on excellence in the quality of products and their diversification and transparency in the All Funds Bank, the leader in distributing third party funds, service and information provided, was enriched in 2010. operates in Spain, Italy, the UK and Latin America. Santander Asset Management launched in 2010 a new global The Global Private Banking unit achieved the following in 2010: structure to facilitate the identification of synergies between countries and which will enable a global management model to • The corporate IT platform was successfully installed in Spain, be developed and increase the value-added for customers. Italy and Mexico and work began in Brazil. The range of funds continued to be streamlined and merged • In Spain, Banif occupies leadership positions in the private in order to supply the Group’s units with simple and easy to banking sector. understand products with high average volumes. • In the UK, the Global Private Banking project entered into Grupo Santander decided, for solely commercial reasons, force in Santander UK. to contribute funds to the Santander Banif Inmobiliario • In Italy, the portfolio of clients of Meliorbanca, the private investment fund by subscribing to new units and granting banking unit of Banca Emilia Romagna, was acquired. a two-year liquidity guarantee in order to meet the reimbursements of participants who so desire it. As a result of this measure, the suspension of reimbursements was lifted and the fund is now operating normally. ASSET MANAGEMENT GLOBAL PRIVATE BANKING Million euros Million euros Managed assets 124,475 Managed assets 97,888 Gross income 292 Gross income 796 Attributable profit 81 Attributable profit 283 Efficiency (%) 55.8 Efficiency (%) 47.8 48 ANNUAL REPORT 2010
  • 51.
    Santander- Ferrari card INSURANCE MEANS OF PAYMENT Santander Insurance conducts its business through networks Santander Cards covers all businesses related to means of in all the countries where the Group operates. It provides payment, in order to offer customers the credit and debit protection for more than 14 million customers. cards that best meet their needs. It also supplies point-of-sale terminals for shops. The division manages 83 million cards. Its strategy is based on covering simple risks and insurance savings for individuals and households through 14,082 Grupo This unit operates in 11 mature and emerging countries, Santander branches throughout the world and alternative which helps to diversify its business. Its strategy is based on channels such as the telephone and Internet. a global business model, which contributes best practices and methodologies and respects the commercial autonomy of Total revenues from insurance (gross income + commissions countries and their knowledge of the market. received by networks) amounted to EUR 2,688 million, 11% more than in 2009. In 2010, the division generated gross income of EUR 3,562 million (+10%), in a year of business growth and consolidation Activity in 2010 centred on: with good risk evolution. A factor at play here was the success of the integrations in Brazil and the UK, which produced • Consolidating the integration of insurance businesses in Brazil, significant synergies. the country that generates the most revenues. • Accompanying the Group’s strategy in management of The main achievements of Santander Cards in 2010 were: financial savings through competitive products. • The launch of the first Santander-Ferrari credit card in Spain, • Improving coverage for consumer finance customers in Brazil, Mexico and Portugal with significant success in sales Europe. (in Spain more than 100,000 sold in the first six weeks). • Launch of the acquiring business in Brazil, which will Banco Santander and the insurer Zurich Financial Services Group accelerate the Bank’s strategy with this country’s SMEs. reached an agreement in early 2011 to form a strategic alliance that will jointly develop the bancassurance business in Brazil, Chile, Mexico, Argentina and Uruguay over the next 25 years. Under the agreement, Santander will group its insurance firms in Latin American countries into a holding 51% owned by Zurich, while Santander will own 49% and receive 100% of the revenues from commissions on the distribution of products via the Group’s 5,600 branches in these markets, which will have a broader and more innovative range of products. Santander aims to increase its revenues from the distribution of insurance products in these countries ($972 million in 2010). The transaction values the insurance business of Grupo Santander, which is the subject of the transaction, at $3,275 million and will generate capital gains of $1,210 million. They will be used to strengthen the balance sheet. INSURANCE MEANS OF PAYMENT 1 Million euros Contribution to the Group: profit before tax + commissions 2,491 Total number of credit cards (million) 56 Gross income 790 Total number of debit cards (million) 27 Attributable profit 381 Lending (million euros) 13,490 Gross income (million euros) 3,562 1. Perimeter of retail banks excluding Banesto, Santander Consumer Finance and Open Bank ANNUAL REPORT 2010 49
  • 52.
    CORPORATE SOCIAL RESPONSIBILITY Sustainability, forBanco Santander, means contributing through its activity to economic and social progress and taking into account the impact of its business on the environment Banco Santander business activity contributes to the economic Sustainability, for Santander, also means knowing how to progress of local communities, bearing in mind the impact of respond at each moment to the real needs of stakeholders: its activity on society and on the environment. The international • shareholders, with maximum transparency in information, market values and recognises this management. The Santander through channels of continuous and fluid dialogue and share is present in the world’s main sustainability indexes, the fostering their participation; DJSI and the FTSE4Good. • customers, offering them the best products and services; Santander held meetings in 2010 with more than 50 investors • employees, with training and development policies, fostering and analysts interested in knowing in detail Banco Santander’s equality of opportunity and reconciling work and family life; sustainability strategy. • suppliers, with transparency in the contract awarding The sustainability committee is responsible for drawing up the processes. Group’s social responsibility strategy which is submitted for the board’s approval. The committee is chaired by the CEO and Santander’s activities in this area are always guided by a special comprises various business and support areas. It meets every six interest in society and the environment. months. At its last meetings, this committee approved significant strategic projects such as the energy efficiency plan, the financial education project and the corporate volunteering programme. It also adopted other important decisions such as the adherence by Santander Pensiones to the principles of socially responsible investment and the approval of the corporate policy on human rights. All of this, together with the significant role of Santander Brazil and Santander UK as two key The Bank’s main corporate social responsibility activities countries for the dissemination of best practices in sustainability are set out in the Sustainability Report, which is available at within the Group, enabled Santander to make decisive progress www.santander.com and remain one of the leaders in this sphere. El Bosque, Grupo Santander City, Boadilla del Monte, Madrid, Spain 50 ANNUAL REPORT 2010
  • 53.
    Investment in highereducation is the centrepiece of the Bank’s corporate social responsibility policy SANTANDER UNIVERSITIES GLOBAL DIVISION Investment in higher education is the centrepiece of the 938 corporate social responsibility strategy of the Bank, as it is co-operation agreements with universities convinced that this is the best way to contribute to the in 15 countries on four continents economic and social development of the countries in which it operates. The Santander Universities global division, with a team of 2,047 professionals in 14 countries, coordinates and manages Banco Santander’s commitment to higher education. Its long-term 4,629,655 strategic alliance with universities forged over the last 13 years intelligent university cards is unique in the world. Banco Santander’s contribution to in 201 universities co-operation projects with universities amounted to more than EUR 100 million in 2010. Santander co-operates with universities in launching projects to improve education, internationalisation, geographic mobility, innovation and the transfer of knowledge to society. The Bank has agreements with universities in Spain, Portugal, the UK, 13,352 Brazil, Mexico, Chile, Argentina, Colombia, Singapore, Puerto scholarships and aid for study granted in 2010 Rico, Uruguay, the US, China and Russia. Banco Santander’s co-operation with universities revolves around the following four pillars: • Integral cooperation agreements, which put into effect in 2010 4,149 academic, financial and technological projects 1,216 with universities. universities grouped in Universia • Support for international co-operation programmes between universities, such as national and international travel programmes for students and teachers. • Fostering co-operation with international academic networks, such as the Latin American University Network for the 174,728 Incubation of Companies (Red Emprendia). first jobs via Universia • Supporting global projects, such as Universia, the largest online network of university co-operation in the Spanish- and Portuguese-speaking world, and the Miguel de Cervantes Virtual Library, the portal with the largest digitalisation of Hispanic culture. ANNUAL REPORT 2010 51
  • 54.
    Corporate social responsibility SANTANDERUNIVERSITIES IN 2010 The main developments in 2010 were: • The holding of the second meeting of Universia rectors in Guadalajara, Mexico, which, with the participation of 1,000 rectors from 23 countries, gave a decisive push to the Latin American Knowledge Space. In this framework, Mr Emilio Botín announced Banco Santander’s commitment to invest EUR 600 million in 2011-2015 in co-operation projects with universities. • 25 new scholarship programmes were launched, enabling 2,000 universities to benefit from them. The Santander Fórmula programme, the Top Brazil, Top UK and Top USA programmes and the ITACA scholarships are examples of this co-operation. • Consolidation of activity in Brazil and Mexico and more co-operation with universities in the UK, the US and Singapore (these three countries account for 8% of the universities with The second meeting of Universia rectors, May 2010, Guadalajara, Mexico agreements). • Strong support to disseminate the Spanish language in Santander is firmly committed co-operation with the Cervantes Institute, the Real Academia de la Lengua and the Fundación Campus Comillas. to investing EUR 600 million • Publication of the book “La Universidad: una historia ilustrada” in 2011-2015 in co-operation with the participation of 45 authors from 17 countries. projects with universities • 174,728 university students obtained their first job via Universia in 2010. In 2011, Santander Universities will strengthen dissemination of its commitment to universities to all society. It will step up its co-operation by incorporating German universities to its network of agreements. It will also put into effect new Santander scholarship programmes for students studying for a bachelor’s degree and scholarships for young researchers. Moreover, It will launch new scholarship programmes to prevent the abandonment of university studies, foster international travel by young postgraduate students and researchers and boost the exchange of students between Asia and Latin America, in accordance with the commitment made at the second meeting of Universia rectors. GROWTH IN AGREEMENTS GROWTH IN CO-OPERATION PROJECTS WITH UNIVERSITIES Number Number 4,149 938 3,340 833 2,820 700 2,507 623 2,010 549 2006 2007 2008 2009 2010 2006 2007 2008 2009 2010 52 ANNUAL REPORT 2010
  • 55.
    “Pão para todos”project, Santander Totta, Portugal Thousand year old olive trees at Grupo Santander City SOCIAL ACTIONS THE ENVIRONMENT Although the main contribution is investment in higher Banco Santander is committed to protecting, conserving and education via Santander Universities, Santander also carries out recovering the environment. Its activities in this sphere are in those countries where it operates projects tailored to social structured around the following elements: and local economic circumstances and in many cases employees • Measuring the Group’s environmental footprint and drawing participate as volunteers. up an energy efficiency plan: In 2010, for the second year running, Santander calculated the main items consumed and In developing these projects the Bank works closely with the emissions in all the Group’s buildings throughout the world in third sector (NGOs and other non-profit making institutions) order to establish its environmental footprint. A tool was with whom Santander maintains a fluid and constant dialogue. developed to gather, calculate and consolidate all data in order to standardise management and treatment of In 2010, the Group’s sustainability committee approved a environmental information. At its meeting in July 2010, corporate project for volunteering. In order to launch it, the the Group’s sustainability committee approved a strategic Bank signed a co-operation agreement with UNICEF in order to plan for energy efficiency which set out common objectives contribute to the schooling of children in Latin America. The co- for improving and reducing the consumption of items in the operation with UNICEF will include various initiatives in which medium and long term. CO2 emissions are scheduled to be the Group’s professionals in Spain, first, can participate and then reduced by 3% in the Group’s five main countries and the those in other countries. whole Group’s energy consumption by 3%. This initiative joins others in which Santander participates and • Analysis of social and environmental risk in credit operations: co-operates in the countries where it operates such as: Santander has a systematic global process for analysing social and environmental risks. The corporate units of risk are • Brazil, with Escola de Brasil, in order to help improve state responsible for evaluating these types of risk in the projects schools. More than 2,000 volunteers from the Bank presented by the business areas for approval in accordance participate in this. with the Group’s policies. • The UK, with community days when employees are involved • Developing financial solutions to protect the environment: on a voluntary basis in local charities. The promotion and financing of renewable energy projects • Chile, where employees help to build homes for the poor via various financial products enables Banco Santander to under the “Un techo para Chile” programme. maintain its leadership position in this sphere. Of particular note is Banco Santander’s participation in the carbon fund for Spanish companies (FC2E). Banco Santander committed itself many years ago to contribute to the cultural, social and educational development of the communities in which it operates ANNUAL REPORT 2010 53
  • 56.
    HUMAN RESOURCES Banco Santander’smanagement of people is based on three pillars: leadership with talent, knowledge and corporate culture MANAGEMENT OF PEOPLE The “Santander is you” programme aims to disseminate value offer, in other words all that the Group does for its professionals Grupo Santander made further progress in 2010 in to generate pride in belonging to it through initiatives such implementing its people management model, focused on as the “Santander is you” week. The third edition was held in attracting, developing and being committed to the best talent at 2010 with more than 300 activities related to solidarity, the international level, in order to support the strategy and the environment, sport, the promotion of good health and sustainable business growth. The three pillars are: wellbeing, which are held in the same week in all countries where Santander operates. 1. Leadership with talent Santander launched various initiatives to reflect on the type of Another initiative was the second "Santander is You" race held leadership needed to ensure its success in the future. One of in Chile on 3-6 November, 2010. A total of 60 employees from them is the training programme “Leading the Group’s Growth” all the Group's divisions, companies and countries took part in for senior executives and whose 2010 edition revolved around a relay race in a mountainous area between Santiago de Chile the concept of the “responsible leader.” and Valparaíso under the slogan "Driven by values, Together we are more." 2. Knowledge Investment in training amounted to EUR 111 million in 2010 Santander also transmits its value offer and the meaning of (EUR 93.5 million in 2009). The total number of hours spent on the corporate values that comprise its culture to potential training was 7.0 million (7.7 million in 2009) and 179,000 employees via “Santander could be you”. The Group, for the employees were involved (more than 167,000 in 2009). second year running, visited the main business schools in the US, Europe and Asia in order to identify and recruit the best talent at The corporate school of retail banking was launched in 2010 as the international level. part of the business knowledge school. Its purpose is to gather and structure retail banking business knowledge, help various Another way to identify and attract the best international talent business teams apply this knowledge and support the process of is the route followed by the talent scholarship programme. This adapting and integrating new acquisitions. The governing initiative, in its third edition, selected 33 high potential students council of this school is chaired by Alfredo Sáenz, Banco throughout the world and gave them a full training course Santander’s CEO, and its members are senior executives of the tailored to the needs of a retail bank. Bank. This school joins other already existing: the corporate school of risks, which in 2010 celebrated its fifth anniversary. 3. Culture Grupo Santander is backed by a solid culture of values: leadership, innovation, strength, dynamism, commercial focus, ethics and sustainability. These inspire the work of Santander’s professionals, while the mission of the human resources division is to reinforce this culture by disseminating the values and the advantages of working for Grupo Santander. EMPLOYEES Number 178,869 170,961 169,460 2008 2009 2010 54 ANNUAL REPORT 2010
  • 57.
    ADVANCES IN OTHER RECOGNITIONS HUMAN RESOURCES POLICIES Santander’s corporate culture has become a reference in business circles, underscored by the prizes awarded to the Santander’s human resources policy has made progress in other Group in the countries where it operates. issues, such as: •Santander is the first ranked bank, the second European • The gender equality policy launched in 2009 to develop company and the fifth in the world in the Hay Group’s and female talent within the Group was consolidated. In Spain, Fortune’s ranking of leadership in the best companies 2010. 149 women participated in the Alcanza plan which supports the careers of women. Also, under the framework of •“Equality in the company 2010” recognition by Spain’s “Avanzamos Juntos”, the following steps were taken: equality ministry. a corporate command panel was created to monitor the • Santander Río was first in the ranking of the best companies corporate gender equality policy; an online training course on to work for in Argentina according to Great Place to Work. gender quality was launched for more than 16,000 employees and training sessions given on gender equality as part of the • The Ranking Merco Personas recognised Grupo Santander corporate programmes for the Group’s senior executives. as the third best company to work for in Spain in 2010. • Santander Totta (Portugal) launched "Red en Femenino", • Santander Totta was the first company in Portugal to obtain a communication platform for female executives to share texts, the responsible family company certificate from the Más ideas and experiences and, in the UK, the Santander Prize was Familia Foundation. created under the framework of the prestigious "Opportunity • Santander UK was awarded in 2010 the “Be the Best” and Now" prizes, which foster equality of opportunity through “Best Boss” awards which recognise the human resources education and learning. policies as a good company to work for. • Development and mobility: Santander offers its employees the opportunity to enhance their knowledge and work abroad for four months within their same division via the “Mundo Santander” programme. A total of 156 employees benefited from this corporate initiative in 2010, bringing the overall number to 347 in the three editions of the programme. • Of note in 2010 among Santander’s many measures to look after the health of its employees was the signing of the sponsorship, with the Fundación Botín, of the PESA-CNIC project, led by the National Council of Cardiovascular Research. Thanks to this project, headed by the world renowned cardiologist Mr Valentín Fuster, more than 3,000 of the Group’s employees in Spain participated in pioneering research for early identification of cardiovascular risk. ANNUAL REPORT 2010 55
  • 58.
    SANTANDER IN 2010 JANUARY 11 United Kingdom. The change to the Santander brand began in 1,000 branches of Abbey and Bradford & Bingley. MAY 31 JUNE 9 The second meeting of Mexico. Acquisition of Universia rectors is held in 25% of Santander Guadalajara, Mexico. Mexico from Bank of JANUARY 18 America. Help for Haiti. Banco Santander’s executive committee donated EUR 1 million. ENERO 2010 FEB/10 MAR/10 ABR/10 MAY/10 JUN/10 JUNE 11 Santander, Spain. Banco Santander holds its AGM. FEBRUARY 4 Grupo Santander City. The Bank announced an attributable profit of EUR 8,943 million in 2009. 56 ANNUAL REPORT 2010
  • 59.
    SEPTEMBER 10 Poland. Agreement to buy Bank Zachodni WBK. JULY 12 Germany. Santander acquires the retail banking businesses of the Swedish commercial banking group SEB. NOVEMBER 14 Abu Dhabi. Santander completes the first year of its alliance with the Scuderia Ferrari, with an advertising return of EUR 270 million. JUL/10 AGO/10 SEP/10 OCT/10 NOV/10 DICIEMBRE 2010 JULY 23 Spain. Santander is among SEPTEMBER 15 the best in solvency and Grupo Santander City. Third profitability in the stress test international banking on European banks. conference held. NOVEMBER 4 Brazil. Unification of the Santander and Banco Real brands. AUGUST 4 UK. Agreement to acquire 318 Royal Bank of Scotland branches. ANNUAL REPORT 2010 57
  • 60.
    CORPORATE GOVERNANCE REPORT PhotoPereda Building, Grupo Santander City, Boadilla del Monte, Madrid, Spain
  • 61.
    61 1. OWNERSHIP STRUCTURE 64 2. BANCO SANTANDER’S BOARD OF DIRECTORS 80 3. SHAREHOLDERS RIGHTS AND THE GENERAL SHAREHOLDERS’ MEETING 82 4. BANCO SANTANDER’S SENIOR MANAGEMENT 84 5. TRANSPARENCY AND INDEPENDENCE 86 6 UNIFIED GOOD GOVERNANCE CODE
  • 62.
    MAIN ACTIVITIES OFTHE BOARD IN 2010 ON MATTERS RESERVED THERETO GENERAL STRATEGIES OF THE BANK • During 2010, the board held twelve meetings. Two of them were devoted, as has been the practice every year since 2006, to solely discussing the Group’s strategy. DIVIDENDS • In 2010 the board maintained the same compensation per share as in financial year 2009, i.e., 0.60 euro. CONTROL OF ACTIVITIES AND RISK MANAGEMENT • During 2010, the chief executive officer submitted to the board eight management reports, and the third vice-chairman and head of the risk division submitted seven risk reports. • Each of the heads of internal and external audit reported to the board at three and two meetings, respectively. • The board analysed the business in Latin America (particularly Brazil) and in the United Kingdom, the Santander España and Banesto branch networks and the Group’s Asia Plan, as well as the liquidity of European banks and of Banco Santander and the new capital standards, BIS III. DIRECTOR REMUNERATION POLICY • In 2010, in line with the best international practices, the board submitted for the first time the report regarding the director remuneration policy to the shareholders at the general shareholders’ meeting held on 11 June, as a separate item on the agenda and as a consultative matter; 94.943% of the votes were in favour of the report. BYLAW-MANDATED PAYMENTS • In 2010, for the second consecutive year, the board resolved to maintain the same amounts as in the prior year for the annual allocation to which the board members are entitled for the performance of supervisory and collective decision-making duties, such that they have remained unchanged since 2008. REMUNERATION OF EXECUTIVE DIRECTORS • The board decided not to change the fixed remuneration payable to executive directors in 2011, with only one exception, and to increase by 10% the variable remuneration for 2010. The variable remuneration or bonus payable to executive directors as a whole for 2010 came to 170% of the fixed remuneration. In addition, the average deferred variable remuneration vis-à-vis the total variable remuneration of executive directors stands at 51.9%. Both parameters are within those approved by the board at the proposal of the appointments and remuneration committee, which were submitted to a consultative vote of the shareholders at the general shareholders’ meeting held on 11 June 2010. FINANCIAL INFORMATION PERIODICALLY PUBLISHED BY THE BANK • The board approved the quarterly financial information, the annual accounts, and the management report for 2009, in addition to other documents such as the annual report, the sustainability report, the Pillar III disclosures report, the annual corporate governance report, and the reports of the audit and compliance committee and the appointments and remuneration committee. APPOINTMENT OF MEMBERS OF SENIOR MANAGEMENT • The appointment of Ms Ana Patricia Botín-Sanz de Sautuola y O’Shea as chief executive officer of Santander UK and of Mr Antonio Basagoiti García-Tuñón as non-executive chairman of Banesto was proposed to the boards of directors of Santander UK and Banesto, respectively. • The executive vice president of the Bank Mr Jorge Morán Sánchez was appointed as country head in charge of all of the Group’s businesses in the United States of America. 60 ANNUAL REPORT 2010
  • 63.
    “We have anexperienced board of directors which also has a balanced composition of executive and non-executive directors.” Emilio Botín, Chairman. General shareholders’ meeting, 11 June 2010 1. OWNERSHIP STRUCTURE NUMBER OF SHARES SHAREHOLDERS’ AGREEMENTS AND AND SIGNIFICANT INTERESTS OTHER SIGNIFICANT AGREEMENTS NUMBER OF SHARES Section A.6 of the annual corporate governance report, which During financial year 2010, the Bank carried out two capital forms part of the management report, contains a description of increases that became effective on 7 October and 2 November, the shareholders’ agreement (pacto parasocial) executed in and pursuant to which there were issued 11,582,632 and February 2006 by Mr Emilio Botín-Sanz de Sautuola y García de 88,713,331 new shares, representing 0.139% and 1.065%, los Ríos, Ms Ana Patricia Botín-Sanz de Sautuola y O’Shea, respectively, of the Bank’s share capital at year-end 2010. Mr Emilio Botín-Sanz de Sautuola y O’Shea, Mr Francisco Javier The first increase was carried out in order to accommodate the Botín-Sanz de Sautuola y O’Shea, Simancas, S.A., Puente San conversion of 33,544 mandatorily convertible bonds (Valores Miguel, S.A., Puentepumar, S.L., Latimer Inversiones, S.L. and Santander), and the second one within the framework of the Cronje, S.L. Unipersonal providing for the syndication of the Santander Dividendo Elección (scrip dividend) programme. shares of the Bank held by them or in respect of which they have voting rights. Such agreement was also reported to the The Bank’s share capital at 31 December 2010 was represented National Securities Market Commission (Comisión Nacional del by 8,329,122,098 shares, whose value per the listing price on Mercado de Valores) (CNMV) as a material fact and is described Spain’s Electronic Trading System (continuous market) of the in the public records thereof. Spanish stock exchanges at such date was 66,033 million euros. All shares carry the same economic, voting and related rights. SIGNIFICANT INTERESTS No shareholder held significant interests (of more than 3% of the share capital* or interests that would permit a significant influence on the Bank) at 31 December 2010. The interests held by Chase Nominees Limited (10.24%), State Street Bank & Trust (9.52%), EC Nominees Ltd. (6.45%), The Bank of New York Mellon (5.05%), Guaranty Nominees Limited, (3.73%) and Société Générale (3.28%), which were the only ones in excess of 3%, were held by them on behalf of their customers. The Bank is not aware of any of them holding individual stakes of 3% or more of its share capital. Bearing in mind the current number of board members (20), the percentage of capital needed to exercise the right to appoint a director in accordance with article 243 of the Spanish Companies Law (Ley de Sociedades de Capital) is 5.00%. * Limit set by Royal Decree 1362/2007, of 19 October, for purposes of the annual corporate governance report. ANNUAL REPORT 2010 61
  • 64.
    TREASURY SHARES Authorisation The current authorisation for transactions in treasury shares KEY DATA arises from resolution no. 5 adopted by the shareholders acting At 31 December 2010, the Bank held 22,292,972 treasury at the general shareholders’ meeting held on 11 June 2010, shares, representing 0.268% of its share capital; at 31 item II) of which reads as follows: December 2009, it held 2,584,249 treasury shares, representing 0.031% of the Bank’s share capital at such date. “To grant express authorisation for the Bank and the subsidiaries comprising the Group to acquire shares The following table sets out the monthly average percentages representing the capital stock of the Bank for any valuable of treasury stock in 2010 and 2009. consideration permitted by Law, within the limits of and subject to any legal requirements, up to a maximum limit —including the shares they already hold— of a number of MONTHLY AVERAGE1 shares equivalent to 10 per cent of the capital stock existing percentages of treasury shares2 2010 2009 at any given time, or to such greater percentage as may be established by Law during the effectiveness of this January 0.200 1.195 authorisation, which shares shall be fully paid-in, at a February 0.523 1.795 minimum price per share equal to the par value and a March 0.335 1.807 maximum price of up to 3 per cent over the last listing price for transactions in which the Bank does not act for its own April 0.328 2.820 account on the Electronic Market of the Spanish Stock May 0.603 1.982 Exchanges (including the block market) prior to the acquisition June 0.482 1.250 in question. This authorization may only be exercised within July 0.382 0.413 five years from the date on which the general shareholders’ meeting is held. The authorisation includes the acquisition August 0.253 0.695 of shares, if any, that must be conveyed directly to the September 0.285 0.525 employees and management of the Company, or that must October 0.360 0.617 be conveyed as a result of the exercise of the options November 0.544 0.496 they hold.” December 0.525 0.414 Treasury stock policy 1. Further information in this regard can be found in section A.8 of the annual corporate governance At its meeting of 11 June 2010, the board of directors adopted report, which forms part of the management report, and in the capital and treasury stock section of the current resolution on treasury share policy, which is this latter report. published on the Group’s website (www.santander.com) and 2. Monthly average of daily positions of treasury stock. which governs aspects such as the purposes thereof, persons authorised to carry out treasury share transactions, general The transactions in treasury stock carried out by companies guidelines, prices, time limits and reporting obligations. belonging to the consolidated Group in the interest thereof during financial year 2010 consisted of the acquisition of The aforementioned policy excludes the use of treasury shares 794,732,640 shares, equal to a nominal amount of 397.4 as a defensive mechanism. million euros (actual amount of 7,372.0 million euros), and the sale of 774,974,286 shares in the nominal amount of 387.5 million euros (actual amount of 7,169.0 million euros). The average purchase price of shares of the Bank in financial year 2010 was 9.28 euros per share, and the average sales price of shares of the Bank in such financial year was 9.25 euros per share. The effect on equity (net of taxes) generated by transactions carried out during the financial year with shares issued by the Bank was equal to 18 million euros worth of loss, which was recorded in the Group’s equity section under “Shareholders’ equity – Reserves”. 62 ANNUAL REPORT 2010
  • 65.
    RESOLUTIONS IN EFFECTREGARDING THE POSSIBLE ISSUANCE OF NEW SHARES OR OF BONDS CONVERTIBLE INTO SHARES The additional authorised capital amounts to 2,038,901,430.50 2. Delegation to the board of directors of the power to issue euros, pursuant to the authorisation of the shareholders acting convertible and/or exchangeable fixed-income securities, at the 19 June 2009 annual general shareholders’ meeting. with the issuance or issuances coming to the total maximum The period available to the Bank’s directors to carry out and amount of 7 billion euros or the equivalent thereof in another make capital increases up to such limit expires on 19 June 2012. currency. The period available to the directors of the Such resolution gives the board the power to exclude pre- Bank within which to implement this resolution expires on emptive rights in whole or in part, pursuant to the provisions 11 June 2015. of article 159.2 of the Companies Law (Ley de Sociedades 3. Capital increase by a nominal amount of 500 million euros, Anónimas) (now, article 506 of the new Companies Law (Ley de with delegation to the board of directors of the broadest Sociedades de Capital)). powers such that, within one year of the date on which the aforementioned shareholders’ meeting was held, it may set At 31 December 2010, the aforementioned limit had not the date and the terms and conditions applicable to such been used. increase as to all matters not provided for by the shareholders. If the board does not exercise the powers In addition, the shareholders acting at the annual general delegated thereto within the period established by the shareholders’ meeting held on 11 June 2010 approved the shareholders for implementation of this resolution, such following resolutions in connection with the content of this powers shall be rescinded. section: 1. Two share capital increases, in each case in the maximum amount of one thousand million euros, within the shareholder compensation scheme —scrip dividend— (Santander Dividendo Eleccción) whereby the Bank offers the shareholders the possibility of opting for an amount equal to the second and the third dividend on account of dividends for financial year 2010, respectively, in cash or in new shares. For such purposes, the Bank’s executive committee, at its meetings of 2 November 2010 and 1 February 2011, approved the implementation of the aforementioned capital increases with a charge to voluntary reserves from undistributed profits, which had in turn been approved by the shareholders at the general shareholders’ meeting of 11 June 2010. The number of shares having a nominal value of 0.5 euro each which were issued in each case under the two capital increases by means of a scrip issue was 88,713,331 and 111,152,906, accounting for 1.05% and 1.32% of the current share capital of the Bank, respectively. ANNUAL REPORT 2010 63
  • 66.
    2. BANCO SANTANDER’S Mr Emilio Botín-Sanz de Sautuola y García de los Ríos BOARD OF DIRECTORS* Chairman Executive director Born in Santander (Spain) in 1934. Joined the board in 1960. Graduate in Economics and Law. Committees Executive (chairman) International (chairman) Technology, productivity and quality (chairman) Mr Fernando de Asúa Álvarez Mr Alfredo Sáenz Abad First vice-chairman Second vice-chairman and chief executive officer Non-executive (independent) director Executive director Born in Madrid (Spain) in 1932. Joined the board in 1999. Born in Getxo, Biscay (Spain) in 1942. Joined the board in 1994. Graduate in Economics, Information Technology, Business Graduate in Economics and Law. Administration and Mathematics. Other significant positions: former chief executive officer and Other significant positions: former chairman of IBM Spain, of first vice-chairman of Banco Bilbao Vizcaya, S.A. and chairman which he is currently honorary chairman. He is a non-executive of Banco Español de Crédito, S.A. (Banesto). vice-chairman of Técnicas Reunidas, S.A. Committees Committees Executive Executive International Risk (vice-chairman) Technology, productivity and quality Audit and compliance Appointments and remuneration (chairman) Technology, productivity and quality Mr Matías Rodríguez Inciarte Mr Manuel Soto Serrano Third vice-chairman Fourth vice-chairman Executive director Non-executive (independent) director Born in Oviedo (Spain) in 1948. Joined the board in 1988. Born in Madrid (Spain) in 1940. Joined the board in 1999. Graduate in Economics, and Government Economist. Graduate in Economics and Business. Other significant positions: former minister of the Presidency of Other significant positions: non-executive vice-chairman the Spanish Government (1981-1982). He is the chairman of the of Indra Sistemas, S.A. and non-executive director of Cartera Príncipe de Asturias Foundation, non-executive chairman of Industrial REA, S.A. He was formerly the chairman of Arthur Banco Santander Totta and a non-executive director of Banesto, Andersen’s Global Board and a manager for EMEIA (Europe, of Sanitas, S.A. de Seguros and of Financiera Ponferrada, S.A., Middle East, India and Africa) for the same firm. SICAV. Committees Committees Audit and compliance (charmain) Executive Appointmens and remuneration Risk (chairman) Technology, productivity and quality * Unless otherwise specified, the main activity of the members of the board is that carried out at the Bank in their capacity as directors, whether executive or non-executive. . 64 ANNUAL REPORT 2010
  • 67.
    Mr Antonio BasagoitiGarcía-Tuñón Ms Ana Patricia Botín-Sanz de Sautuola y O'Shea Non-executive director Executive director Born in Madrid (Spain) in 1942. Joined the board in 1999. Born in Santander (Spain) in 1960. Joined the board in 1989. Graduate in Law. Graduate in Economics. Main activity: non-executive chairman of Banesto. Main activity: chief executive officer of Santander UK plc. She joined the Bank after a period at JP Morgan (1981-1988). She has Other significant positions: former chairman of Unión Fenosa. been executive vice president of Banco Santander, S.A. since 1992, He is a proprietary non-executive vice-chairman of Faes Farma, and was executive chairwoman of Banesto from 2002 to 2010. S.A. and non-executive director of Pescanova, S.A. Other significant positions: she is a non-executive director of Committees Assicurazioni Generali S.p.A. and a member of the International Executive Advisory Board of the New York Stock Exchange and of the board Risk of Georgetown University. Technology, productivity and quality Committees Executive International Technology, productivity and quality Mr Guillermo de la Dehesa Romero Mr Rodrigo Echenique Gordillo Non-executive (independent) director Non-executive (independent) director Born in Madrid (Spain) in 1941. Joined the board in 2002. Born in Madrid (Spain) in 1946. Joined the board in 1988. Government Economist and head of office of Banco de España Graduate in Law, and Government Attorney. (on leave of absence). Other significant positions: former chief executive officer Main activity: international advisor to Goldman Sachs International. of Banco Santander, S.A. (1988-1994). Other significant positions: former state secretary of Economy, Committees general secretary of Trade and chief executive officer of Banco Executive Pastor, S.A. He is currently a non-executive director of Campofrío Audit and compliance Food Group, S.A. and of Amadeus IT Holding, S.A., chairman of Appointments and remuneration the Centre for Economic Policy Research of London, a member International of the Group of Thirty of Washington, chairman of the board of trustees of IE Business School and non-executive chairman of Aviva Vida y Pensiones, S.A. de Seguros y Reaseguros. Committees Executive Appointments and remuneration International Mr Antonio Escámez Torres Mr Francisco Luzón López Non-executive (independent) director Executive director Born in Alicante (Spain) in 1951. Joined the board in 1999. Born in Cañavate, Cuenca (Spain) in 1948. Joined the board Graduate in Law. in 1997. Graduate in Economics and Business. Other significant positions: chairman of Fundación Banco Other significant positions: former chairman of Argentaria and Santander, non-executive chairman of Santander Consumer member of the board of directors of Banco Bilbao Vizcaya, S.A. Finance, S.A., of Open Bank, S.A. and of Arena Media He is a non-executive director of Industria de Diseño Textil, S.A. Communications España, S.A., and non-executive vice-chairman (Inditex), global vice-chairman of Universia and second vice- of Attijariwafa Bank. chairman of the Royal Board of Trustees of the National Library. Committees Committees Executive Executive Risk International International Technology, productivity and quality ANNUAL REPORT 2010 65
  • 68.
    Banco Santander´s board AssicurazioniGenerali S.p.A. Mr Javier Botín-Sanz de Sautuola y O'Shea Non-executive director Non-executive (proprietary) director Joined the board in 1999. Represented by: Born in Santander (Spain) in 1973. Joined the board in 2004. Graduate in Law. Mr Antoine Bernheim Born in Paris (France) in 1924. Graduate in Law and Sciences. Main activity: chairman and chief executive officer of JB Capital Post-graduate degree in Private and Public Law. Markets, Sociedad de Valores, S.A. Main activity: honorary chairman of Assicurazioni Generali. Joined the board of Assicurazioni Generali in 1973, acting as chair from 1995 to 1999 and then again from September 2002 to April 2010. Other significant positions: he is vice-chairman of LVMH. Lord Burns (Terence) Mr Ángel Jado Becerro de Bengoa Non-executive director Non-executive (independent) director Born in Durham (United Kingdom) in 1944. Joined the board Born in Santander (Spain) in 1945. Appointed as director at in 2004. Graduate in Economics. the Bank’s general shareholders' meeting held on 11 June 2010. Graduate in Law. Main activity: non-executive chairman of Santander UK plc and of Alliance & Leicester plc. Other significant positions: director of Banco Santander from 1972 to 1999. He has been a director of Banco Banif, S.A. since Other significant positions: he is non-executive chairman of 2001. Channel Four Television Corporation. He has been permanent secretary of the UK Treasury, chairman of the Financial Services and Markets Bill Joint Committee of the British Parliament, non-executive chairman of Marks and Spencer Group plc and of Glas Cymru Ltd (Welsh Water), and non-executive director of British Land plc, of Legal & General Group plc and of Pearson Group plc. Mr Abel Matutes Juan Mr Juan Rodríguez Inciarte Non-executive (independent) director Executive director Born in Ibiza (Spain) in 1941. Joined the board in 2002. Graduate Born in Oviedo (Spain) in 1952. Member of the board since in Law and Economics. 2008. Graduate in Economics. Joined the Group in 1985 Main activity: chairman of Grupo de Empresas Matutes. as director and executive vice president of Banco Santander de Negocios. In 1989, he was appointed executive vice Other significant positions: former Spanish Foreign Minister president of Banco Santander, S.A. From 1991 to 1999 he was and European Union Commissioner for Loans and Investment, a director of Banco Santander, S.A. Financial Engineering and Policy for Small and Medium-Sized Enterprises (1989), North-South Relations, Mediterranean Policy Other significant positions: he is vice-chairman of Santander UK and Relations with Latin America and Asia (1989), Transport and plc and a director of Alliance & Leicester plc and of Santander Energy, and the Euroatom Supply Agency (1993). Consumer Finance, S.A. Committees Committee Audit and compliance Risk International 66 ANNUAL REPORT 2010
  • 69.
    Mr Luis ÁngelRojo Duque Ms Isabel Tocino Biscarolasaga Non-executive (independent) director Non-executive (independent) director Born in Madrid (Spain) in 1934. Joined the board in 2005. Born in Santander (Spain) in 1949. Joined the board in 2007. Graduate in Law, Doctor in Economics, Government Economist, Main activity: full professor at Universidad Complutense de and holder of honorary doctorates from the universities of Madrid. Doctor in Law. She has undertaken graduate studies in Alcalá de Henares and Alicante. business administration at IESE and the Harvard Business School. Other significant positions: at the Bank of Spain he was head Other significant positions: former Spanish Minister for the of the research department, deputy governor and governor. Environment, former chairwoman of the European Affairs He has been a member of the governing council of the Committee and of the Foreign Affairs Committee of the Spanish European Central Bank, vice-chairman of the European Congress and former chairwoman for Spain and Portugal and Monetary Institute, a member of the United Nations Planning former vice-chairwoman for Europe of Siebel Systems. She is and Development Committee and Treasurer of the International currently an elected member of the Spanish State Council Association of Economics. He is a member of the Royal and a member of the Royal Academy of Doctors. Academy of Moral and Political Sciences and of the Royal Spanish Academy of Language. Committees Audit and compliance Appointments and remuneration. Mr Luis Alberto Salazar-Simpson Bos Non-executive (independent) director Born in Madrid (Spain) in 1940. Joined the board in 1999. Graduate in Law and holder of a Degree in Treasury and Tax Law. Main activity: chairman of France Telecom España, S.A. Committees Audit and compliance Technology, productivity and quality Mr Ignacio Benjumea Cabeza de Vaca Mr Jaime Pérez Renovales General secretary and secretary of the board Deputy general secretary and deputy secretary of the board Born in Madrid (Spain) in 1952. Joined the Group in 1987, as Born in Madrid (Spain) in 1968. He was the head of cabinet general secretary and secretary of the board of Banco Santander of the second vice president of the Spanish Government and de Negocios. He was appointed general secretary and secretary Minister of Economy. He joined the Group in 2003 as secretary of the board of Banco Santander, S.A. in 1994. Graduate in Law, of the board of Banesto. In March 2009 he was appointed ICADE-E3, and Government Attorney. executive vice president of Banco Santander, deputy general Other significant positions: he is executive vice president of secretary and deputy secretary of the board. Graduate in Law Banco Santander, S.A., a non-executive director of Sociedad and Economics and Business (ICADE-E3), and Government Rectora de la Bolsa de Valores de Madrid, S.A., Bolsas y Mercados Attorney. Españoles, Sociedad Holding de Mercados y Sistemas Financieros, Other significant positions: director of Santander Seguros y S.A. and La Unión Resinera Española, S.A. Reaseguros, Compañía Aseguradora, S.A. Secretary of committees Executive Risk Audit and compliance Appointments and remuneration International Technology, productivity and quality ANNUAL REPORT 2010 67
  • 70.
    RE-ELECTION OF DIRECTORS At the 2011 annual general shareholders’ meeting, scheduled for 16 and 17 June 2011 on first and second call, respectively, AT THE 2011 ANNUAL GENERAL the re-election of the following directors will be proposed: SHAREHOLDERS’ MEETING Ms Ana Patricia Botín-Sanz de Sautuola y O’Shea (executive director), Mr Rodrigo Echenique Gordillo (independent non- Pursuant to article 55 of the Bylaws* and article 22 of the executive director), Lord Burns (non-executive director, neither Rules and Regulations of the Board,* directors are appointed proprietary nor independent) and Assicurazioni Generali S.p.A. to five-year terms (the maximum term being six years under (non-executive director, neither proprietary nor independent), Spanish law) and one-fifth of the board is renewed each year. whose professional profiles, together with a description of their activities, appear on the preceding pages. An amendment of the Bylaws and of the Rules and Regulations of the Board is being contemplated in order to reduce the The re-election will be submitted separately to a vote of the directors’ term of office to three years. shareholders at the general shareholders’ meeting (article 21.2 of the Rules and Regulations for the General Shareholders’ Meeting). In view of the fact that this election practice has been followed since the 2005 annual general shareholders’ meeting, the election of all of the current directors has been submitted to a separate vote at a general shareholders’ meeting. * The Bylaws and the Rules and Regulations of the Board of Banco Santander are published on the Group’s website, www.santander.com. C V P I Committee chairman Committee vice-chairman Proprietary Independent COMPOSITION AND STRUCTURE OF THE BOARD OF DIRECTORS N Non-executive, neither proprietary nor independent BOARD OF DIRECTORS COMMITTEES remuneration committee 6. Technology, productivity 5. International committee and quality committee 3. Audit and compliance 1. Executive committee 4. Appointments and 2. Risk committee Non-executive committee Executive Chairman Mr Emilio Botín-Sanz de Sautuola y García de los Ríos (1) C C C First vice-chairman Mr Fernando de Asúa Álvarez I V C Second vice-chairman and chief executive officer Mr Alfredo Sáenz Abad Third vice-chairman Mr Matías Rodríguez Inciarte (3) C Fourth vice-chairman Mr Manuel Soto Serrano I C Members Assicurazioni Generali S.p.A. N Mr Antonio Basagoiti García-Tuñón N Ms Ana Patricia Botín-Sanz de Sautuola y O’Shea (1) Mr Javier Botín-Sanz de Sautuola y O’Shea (1) (2) P Lord Burns (Terence) N Mr Guillermo de la Dehesa Romero I Mr Rodrigo Echenique Gordillo I Mr Antonio Escámez Torres I Mr Ángel Jado Becerro de Bengoa I Mr Francisco Luzón López Mr Abel Matutes Juan I Mr Juan Rodríguez Inciarte Mr Luis Ángel Rojo Duque I Mr Luis Alberto Salazar-Simpson Bos I Ms Isabel Tocino Biscarolasaga I Total General secretary and secretary of the board Mr Ignacio Benjumea Cabeza de Vaca Deputy general secretary and deputy secretary of the board Mr Jaime Pérez Renovales 1. Mr Emilio Botín-Sanz de Sautuola y García de los Ríos has the right to vote, at the general 2. Mr Javier Botín-Sanz de Sautuola y O'Shea is a proprietary non-executive director because on the shareholders’ meeting, 91,866,035 shares owned by Fundación Marcelino Botín (1.10% of the board of directors he represents 2.146% of the share capital, representing the aggregate interests share capital), 8,096,742 shares owned by Mr Jaime Botín-Sanz de Sautuola y García de los Ríos, owned by Fundación Marcelino Botín, Mr Emilio Botín-Sanz de Sautuola y García de los Ríos, 9,042,777 shares owned by Mr Emilio Botín-Sanz de Sautuola y O’Shea, 9,118,823 shares owned Ms Ana Patricia Botín-Sanz de Sautuola y O'Shea, Mr Emilio Botín-Sanz de Sautuola y O'Shea, by Ms Ana Patricia Botín-Sanz de Sautuola y O’Shea and 9,469,213 shares owned by Mr Javier Mr Jaime Botín-Sanz de Sautuola y García de los Ríos, Ms Paloma O’Shea Artiñano and his own Botín-Sanz de Sautuola y O’Shea. Accordingly, this table includes the direct and indirect interests of interest. each of the two last named, who are directors of the Bank, but in the column showing the total percentage of share capital that such interests represent they are computed together with those 3. Mr Matías Rodríguez Inciarte has the right to vote 78,644 shares owned by two of his children. owned or also represented by Mr Emilio Botín-Sanz de Sautuola y García de los Ríos. 68 ANNUAL REPORT 2010
  • 71.
    POWERS AND DUTIES discharge thereof; the appointment, remuneration and, if appropriate, removal of the other members of senior The basic responsibility of the board of directors is to supervise management and the determination of the basic terms of their the Group, delegating the day-to-day management thereof to contracts, as well as the creation or acquisition of interests in the appropriate executive bodies and the various management special purpose entities or in entities registered in countries or teams. territories regarded as tax havens. On the matters mentioned in this paragraph, the executive committee may make any The Rules and Regulations of the Board (article 3) reserve thereto appropriate decisions, by delegation of the board and the power to approve general policies and strategies and, in whenever justified by reasons of urgency. particular, strategic plans, management objectives and the annual budget, corporate governance, corporate social responsibility and The Bylaws (article 40) as well as the aforementioned Rules and dividend and treasury stock policies, the general risk policy, and Regulations (article 5) establish the board’s obligation to ensure the policies for the provision of information to and for that the Bank faithfully complies with applicable law, observes communication with the shareholders, the markets and the public usage and good practices of the industries or countries where it opinion, which power cannot be delegated. does business and abides by the social responsibility principles that it has voluntarily accepted. The board also reserves for itself, and likewise cannot delegate, decisions regarding the acquisition and disposition of In addition, the board of the Bank plays a special role in the substantial assets (except when the decisions come within the Group’s risk management. Fifteen of its 20 members are purview of the shareholders at a general shareholders’ members of at least one of the three board committees with meeting) and major corporate transactions; the determination powers in the area of risks: the executive committee, the risk of the remuneration of each director and the approval of the committee and the audit and compliance committee. Of these contracts governing the performance by the directors of duties 15 directors, one is the first vice-chairman of the Bank, who is a other than those of a director, including executive duties, as member of all three committees, and another 4 directors sit on well as the remuneration to which they are entitled for the two of the committees with powers in the area of risks. SHAREHOLDING AT 31 DECEMBER 2010 Date of last proposal of the appointments Shares % of share Date of first Date of last and remuneration Direct Indirect represented Total capital appointment appointment Expiration date (4) committee 8,191,268 42,916,473 109,005,554 160,113,295 2.146 04.07.1960 (5) 21.06.2008 First six months of 2013 16.04.2008 61,135 50,641 - 111,776 0.001 17.04.1999 11.06.2010 First six months of 2015 21.04.2010 952,729 1,259,475 - 2,212,204 0.027 11.07.1994 (5) 11.06.2010 First six months of 2015 21.04.2010 967,600 83,578 78,644 1,129,822 0.014 07.10.1988 (5) 19.06.2009 First six months of 2014 27.04.2009 61,500 364,752 - 426,252 0.005 17.04.1999 19.06.2009 First six months of 2014 27.04.2009 75,000 56,089,940 - 56,164,940 0.674 17.04.1999 23.06.2007 First six months of 2012 19.03.2007 708,246 - - 708,246 0.009 26.07.1999 23.06.2007 First six months of 2012 19.03.2007 5,094,687 4,024,136 - 9,118,823 0.000 04.02.1989 (5) 17.06.2006 First six months of 2011 18.04.2006 4,793,481 4,675,732 - 9,469,213 0.000 25.07.2004 11.06.2010 First six months of 2015 21.04.2010 30,102 27,001 - 57,103 0.001 20.12.2004 17.06.2006 First six months of 2011 18.04.2006 102 - - 102 0.000 24.06.2002 19.06.2009 First six months of 2014 27.04.2009 658,758 9,398 - 668,156 0.008 07.10.1988 17.06.2006 First six months of 2011 18.04.2006 757,594 - - 757,594 0.009 17.04.1999 23.06.2007 First six months of 2012 19.03.2007 1,877,500 4,950,000 - 6,827,500 0.082 11.06.2010 11.06.2010 First six months of 2015 21.04.2010 1,226,852 53,339 - 1,280,191 0.015 22.03.1997 (5) 23.06.2007 First six months of 2012 19.03.2007 124,969 2,319,463 - 2,444,432 0.029 24.06.2002 19.06.2009 First six months of 2014 27.04.2009 1,367,626 - - 1,367,626 0.016 28.01.2008 (5) 21.06.2008 First six months of 2013 21.01.2008 1 - - 1 0.000 25.04.2005 21.06.2008 First six months of 2013 16.04.2008 253,205 5,713 - 258,918 0.003 17.04.1999 21.06.2008 First six months of 2013 16.04.2008 39,860 - - 39,860 0.000 26.03.2007 11.06.2010 First six months of 2015 21.04.2010 27,242,215 116,829,641 109,084,198 253,156,054 3.039 4. However, and pursuant to the provisions of article 55 of the Bylaws, one-fifth of the board will be renewed each year, based on length of service and according to the date and order of the respective appointment. An amendment of the Bylaws and of the Rules and Regulations of the Board is being contemplated in order to reduce the directors’ term of office to three years. 5. The date on which they were appointed for the first time as executive directors coincides with their first appointment as a director. ANNUAL REPORT 2010 69
  • 72.
    COMMITMENT AND EXPERIENCEOF THE BOARD The directors have, on average, thirteen years’ experience working on the Bank’s board BOARD’S INTEREST IN THE BANK’S CAPITAL EXPERIENCE OF THE BOARD Data as of the end of 2010 More than 15 years 5 2,007 million euros 0 to 4 years 3 stock market value 253,156,054 3.039% of share capital number of shares of the board 5 to 9 years 5 7,928 euros 10 to 14 years 7 stock price The 10 independent non-executive directors have an average of 9.6 years’ experience on the board. In the case of the 6 executive directors, their experience exceeds 21 years on average. CORPORATE GOVERNANCE OF RISK MANAGEMENT • Mr Matías Rodríguez Inciarte, third vice-chairman of the Bank and chairman of AVERAGE ATTENDANCE RATE AT MEETING OF THE COMMITTEES OF THE BOARD the risk committee, reports directly to the % executive committee and to the board, which guarantees the independence of the risk Executive committee function. Risk committee • The risk committee held 99 meetings in 2010, Audit and compliance committee 92.7 each of which lasted approximately 3 hours. 92.5 92.2 92.0 90.5 89,1 89.5 90.7 90.9 • The executive committee held 55 meetings in 90.3 89.1 2010 and devoted a significant amount of 88,3 88,2 87.1 time to discussions on risks. 86.2 • Of the 20 members currently making up the board, 15 sit on at least one of the three committees with powers and duties in the area of risks: executive committee, risk committee, and audit and compliance 2006 2007 2008 2009 2010 committee. NUMBER OF DIRECTORS PARTICIPATING IN THE EXECUTIVE, NUMBER OF MEETINGS OF THE EXECUTIVE , THE RISK THE RISK AND THE AUDIT AND COMPLIANCE COMMITTEES AND THE AUDIT AND COMPLIANCE COMMITTEES Committees 2006 2007 2008 2009 2010 Executive committee 51 55 59 56 55 Risk committee 100 98 102 99 99 1 director is a Audit and compliance committee 12 13 11 11 11 10 member of all 3 out of the committees Total meetings 163 166 172 166 165 20 directors participate in at least 1 of the 3 4 directors committees participate in 2 of the 3 committees 70 ANNUAL REPORT 2010
  • 73.
    SIZE AND COMPOSITIONOF THE BOARD The Bank believes that the current size and composition of the INDEPENDENT NON-EXECUTIVE DIRECTORS board reflect the principles of representativeness of the Independent non-executive directors account for 50% of ownership structure and equilibrium in governance of the Bank, the Board. also taking into account the size, complexity and geographical diversity of the Group. Article 6.2.c) of the Rules and Regulations of the Board includes the definition of independent director established in the Unified In 2006, the shareholders acting at a general shareholders’ Code. In the light thereof, taking into account the circumstances meeting approved a bylaw amendment whereby the maximum of each case, and upon the prior report of the appointments number of directors was reduced from 30 to 22, with the and remuneration committee, the board considers the following minimum remaining at 14. to be independent non-executive directors: Mr Fernando de Asúa Álvarez, Mr Manuel Soto Serrano, Mr Guillermo de la Pursuant to article 6.3 of the Rules and Regulations of the Dehesa Romero, Mr Rodrigo Echenique Gordillo, Mr Antonio Board, the appointments and remuneration committee, at its Escámez Torres, Mr Ángel Jado Becerro de Bengoa, Mr Abel meeting of 16 March 2011, verified the status of each director. Matutes Juan, Mr Luis Ángel Rojo Duque, Mr Luis Alberto Its proposal was submitted to the board, which approved it at Salazar-Simpson Bos and Ms Isabel Tocino Biscarolasaga. its meeting of 21 March 2011 and established the composition of the board upon the terms set forth below. At 31 December 2010, the average length of service of independent non-executive directors in the position of board Of the 20 directors currently sitting on the board of directors, member was 9.6 years. 6 are executive and 14 are non-executive. Of the 14 non- executive directors, 10 are independent, 1 is proprietary and Taking the board as a whole, the average length of service is 3 are, in the opinion of the board, neither proprietary nor 13 years, which is greater than that of independent independent. non-executive directors due to the longer continuity in office of executive directors (21.3 years). EXECUTIVE DIRECTORS Pursuant to the Rules and Regulations of the Board (article OTHER NON-EXECUTIVE DIRECTORS 6.2.a)), the following are executive directors: Mr Emilio Botín- Lord Burns is a non-executive, non-proprietary director. Since he Sanz de Sautuola y García de los Ríos, Mr Alfredo Sáenz Abad, currently receives remuneration in his capacity as non-executive Mr Matías Rodríguez Inciarte, Ms Ana Patricia Botín-Sanz de chairman of the Group’s subsidiaries, Santander UK plc and Sautuola y O’Shea, Mr Francisco Luzón López and Mr Juan Alliance & Leicester plc, in the opinion of the board of directors Rodríguez Inciarte. and upon a prior report of the appointments and remuneration committee, he cannot be classified as an independent director. PROPRIETARY NON-EXECUTIVE DIRECTORS Since 2002, the standard used by the appointments and The same applies to Mr Antonio Basagoiti García-Tuñón, who, remuneration committee and the board of directors as a in his capacity as non-executive chairman of Banesto, receives necessary but not sufficient condition to designate or consider a remuneration in addition to his remuneration as a director of director as a non-executive proprietary director (as expressly set Banco Santander. forth in article 6.2.b) of the Rules and Regulations of the Board of Directors) is that he/she hold at least 1% of the share capital In the opinion of the board, upon a prior report of the of the Bank. This percentage was set by the Bank exercising its appointments and remuneration committee, the non-executive powers of self-regulation. director Assicurazioni Generali S.p.A. cannot be classified as proprietary in view of the fact that its interest in the Bank’s Taking into account the circumstances of the case, and upon the capital has decreased below 1%, which is the limit set by article prior report of the appointments and remuneration committee, 6.2.b) of the Rules and Regulations of the Board as a minimum the board believes that Mr Javier Botín-Sanz de Sautuola y O’Shea in order for the directors holding or representing such is a proprietary non-executive director. percentage interest to be considered proprietary directors. COMPOSITION OF THE BOARD Independent Proprietary non-executive directors 10 non-executive 50% directors 1 5% Other non-executive directors 3 15% Executive directors 6 30% ANNUAL REPORT 2010 71
  • 74.
    EXECUTIVE CHAIRMAN AND SUCCESSION PLANS FOR THE CHIEF EXECUTIVE OFFICER CHAIRMAN AND THE CHIEF EXECUTIVE The Bank has chosen to have an executive chairman because it OFFICER believes that it is the position that best suits its circumstances. Succession planning for the main directors is a clear element of the good governance of the Bank, tending to assure an orderly The chairman of the board is the highest-ranking officer of the leadership transition at all times. Along these lines, article 24 of Bank (article 48.1 of the Bylaws and article 8.1 of the Rules and the Rules and Regulations of the Board provides that: Regulations of the Board) and accordingly, all the powers which may be delegated under the Law, the Bylaws and the Rules and “In the cases of withdrawal, announcement of renunciation or Regulations of the Board have been delegated to him. He is resignation, disability or death of the members of the board responsible for directing the Bank’s management team, always of directors or its committees or withdrawal, announcement in accordance with the decisions and standards set by the of renunciation or resignation of the chairman of the board of shareholders acting at a general shareholders’ meeting and by directors or of the managing director or directors, as well as the board within their respective purview. from other positions on such bodies, at the request of the chairman of the board of directors or, in his absence, at the The chief executive officer, acting by delegation from and request of the highest-ranking vice-chairman, the reporting to the board of directors and the chairman, as the appointments and remuneration committee will be convened highest-raking officer of the Bank, is charged with the conduct in order for such committee to examine and organise the of the business and the highest executive duties. process of succession or replacement in an orderly manner and to present the corresponding proposal to the board of There is a clear separation of duties between the executive directors. Such proposal shall be communicated to the chairman, the chief executive officer, the board and the executive committee and subsequently submitted to the committees thereof, as well as various checks and balances, board of directors on the following meeting scheduled to be which assure proper equilibrium in the corporate governance held by the board’s annual calendar of meetings or at such structure of the Bank. The following are some particularly extraordinary meeting as may be called if deemed necessary.” important aspects: • The board and its committees exercise supervisory and control Article 44.2 of the Bylaws sets out interim replacement rules for duties over the actions of both the chairman and the chief the temporary performance (in cases of absence, inability to act executive officer. or indisposition) of the duties of the chairman of the board in the absence of the vice-chairmen. • The first vice-chairman, who is an independent non-executive director, is the chairman of the appointments and The board determines the numerical sequence for such purpose remuneration committee and acts as coordinator of non- every year based on the directors’ seniority. In this regard, at its executive directors. meeting of 11 June 2010, the board unanimously resolved to • The powers delegated to the chief executive officer are assign the following order of priority for the temporary the same as those delegated to the chairman, which powers performance of the duties of chairman in the absence of the do not include, in either case, those reserved by the board vice-chairmen of the board: for itself. 1) Mr Rodrigo Echenique Gordillo 2) Ms Ana Patricia Botín-Sanz de Sautuola y O’Shea 3) Mr Francisco Luzón López 4) Assicurazioni Generali S.p.A. 5) Mr Antonio Escámez Torres 6) Mr Luis Alberto Salazar-Simpson Bos 7) Mr Antonio Basagoiti García-Tuñón 8) Mr Guillermo de la Dehesa Romero 9) Mr Abel Matutes Juan 10) Mr Javier Botín-Sanz de Sautuola y O’Shea 11) Lord Burns 12) Mr Luis Ángel Rojo Duque 13) Ms Isabel Tocino Biscarolasaga 14) Mr Juan Rodríguez Inciarte 15) Mr Ángel Jado Becerro de Bengoa 72 ANNUAL REPORT 2010
  • 75.
    SECRETARY OF THEBOARD CONDUCT OF MEETINGS The Bylaws (article 45.2) include among the duties of the In 2010, the board was kept continuously and fully informed of secretary those of caring for the formal and substantive legality the running of the various business areas of the Group through of the activities of the board, safeguarding observance of the the eight management reports and seven risks reports presented good governance recommendations assumed by the Bank, by the chief executive officer and the third vice-chairman in and ensuring that governance procedures and rules are charge of the risk division, respectively, at the twelve meetings observed and regularly reviewed. held during the financial year. In addition, the board analysed in detail the business in Latin America (particularly Brazil) and in The secretary of the board is the general secretary, who also the United Kingdom, the Santander España and Banesto branch acts as secretary of all of the committees of the board. networks and the Group’s Asia Plan, as well as the liquidity of European banks and of Banco Santander and the new capital Article 17.4.d) of the Rules and Regulations of the Board standards, BIS III. provides that the appointments and remuneration committee must report on proposals for the appointment or withdrawal During the year, the board of directors also addressed other of the secretary of the board prior to submission thereof to matters that come within its area of supervision, as are the the board. compliance function, the sustainability policy and the definition of the Group’s structure and off-shore centres. PROCEEDINGS OF THE BOARD Finally, the board was informed of the conclusions of the external and internal audits and of the Group’s internal control There were twelve meetings during financial year 2010. model. The board holds its meetings in accordance with an annual calendar. The Rules and Regulations of the Board provide that STRATEGY MEETINGS the board shall hold not less than nine annual ordinary meetings. The board shall also meet whenever the chairman so decides, In addition to the ordinary meetings, the board held specific acting on his own initiative or at the request of not less than meetings to discuss Santander’s strategy. For such purpose, three directors (article 46.1 of the Bylaws). the directors held two meetings in 2010: the first one, on 18 May, and the second one, on 18 and 19 December. When directors cannot attend a meeting personally, they may give a proxy to any other director, in writing and specifically for Among the matters discussed were: each meeting, to represent them for all purposes at such meeting. • The economic environment and the situation of the financial industry, with special focus on the Spanish credit system Any member of the board may propose the inclusion of any (banks and savings associations). other item not included in the draft agenda that the chairman proposes to the board (article 46.2 of the Bylaws). • The challenges and management priorities of Santander’s businesses in the United Kingdom: integration of acquired Meetings of the board shall be validly held when more than businesses, regulatory framework, and strengthening of the one-half of its members are present in person or by proxy. franchise and the distribution network. • Banco Santander’s living will. Except in instances in which a greater majority is specifically required pursuant to legal provisions, the Bylaws or the Rules • The future regulation of the capital and liquidity of financial and Regulations of the Board, resolutions are adopted by institutions. absolute majority of the directors attending in person or by proxy. In the event of a tie, the chairman has a tie-breaking vote. ANNUAL REPORT 2010 73
  • 76.
    TRAINING OF DIRECTORSAND SELF-EVALUATION BY THE BOARD ORIENTATION PROGRAMME As in prior financial years, a self-evaluation was performed with the support of Spencer Stuart on the basis of a questionnaire As a result of the self-evaluation of the board carried out in and personal interviews with the directors, and also included 2005, an on-going director training programme was put —in line with the recommendation of the Unified Code and the in place. provisions of the Rules and Regulations of the Board— a special section for the individual evaluation of the chairman, the chief Seven meetings were held in 2010 with the attendance of an executive officer and the other directors. average of thirteen directors, who devoted approximately one hour and a half to each session. Various issues were reviewed in The process of self-evaluation by the board focused on the depth at such meetings in connection with the management of organisation, proceedings and content of board and committee risks, especially standardised risks, business lines, capital and meetings, a comparison with other international banks, solvency, the causes of the collapse of some banks, and the and open questions on issues related to the future (strategy, technology of Santander. internal and external factors). The Rules and Regulations (article 21.7) provide that the board The directors highlighted the following as strengths of the shall make available to new directors an information programme Group’s corporate governance: knowledge of the banking providing quick and adequate understanding of the Bank and its business, experience, balance between executive and non- Group, including its governance rules. This programme was thus executive directors, dedication of board members, and made available to the newest directors. involvement in risk control. In the opinion of the directors, these strengths have enabled the Group to become a benchmark for management amid the current crisis and to capitalise on the business opportunities that have arisen. Furthermore, in connection with the organisation, proceedings and content of board meetings, the following aspects were highlighted: high level of strategic debate; composition of the board and directors’ expertise; director training programme; excellent operation of the chairman/chief executive officer team; promotion of debate; high level of commitment on the part of the directors; and involvement of the board in the control of credit risk, among others, including reputational, operational and technological risks. APPOINTMENT, RE-ELECTION AND RATIFICATION OF DIRECTORS The proposals for appointment, re-election and ratification of directors, regardless of the status thereof, that the board of directors submits to the shareholders for consideration at a general shareholders’ meeting, as well as the appointment decisions made by the board itself in the exercise of its powers to make interim appointments (cooptación) as permitted by law, must, in turn, be preceded by the corresponding proposal of the appointments and remuneration committee. Although the proposals of such committee are not binding, the Rules and Regulations of the Board provide that if the board does not follow them, it must give reasons for its decision. Currently, all directors have been appointed or re-elected at the proposal of the appointments and remuneration committee. 74 ANNUAL REPORT 2010
  • 77.
    REMUNERATION REPORT ON THE DIRECTOR REMUNERATION POLICY As provided in the Bylaws (article 59.1), the board of directors REMUNERATION SYSTEM annually approves a report on the director remuneration policy, Article 58 of the Bylaws provides that the directors shall have which sets forth the standards and grounds that determine the the right to receive, in consideration for the performance of remuneration for the last and current financial year, making such their duties as board members and as a share in the profits for report available to the shareholders on occasion of the call to each financial year, remuneration equal to 1% of the Bank’s net the annual general shareholders’ meeting. profits for the respective financial year, although a director may agree to reduce such percentage. In exercise of its powers, the In 2010, such report was submitted for the first time to the board set the amount for financial year 2010 at 0.183% of the shareholders at the general shareholders’ meeting held on Bank’s profits for the year. This percentage was calculated by 11 June 2010, as a separate item on the agenda and as a including in the numerator not only the annual allocation, but consultative matter; 94.943% of the votes were in favour also the attendance fees accrued by the directors during the of the report. financial year, as provided in such article 58. TRANSPARENCY The remuneration of directors is approved by the board at the Pursuant to the Bylaws (article 59.2), the annual accounts proposal of the appointments and remuneration committee, includes itemised information on the remuneration received by except for such remuneration as consists of the delivery of each director, with a statement of the amounts for each item of shares or options thereon, or that is paid under other remuneration. The report also sets forth, on an individual basis remuneration systems established by reference to the value of for each item, the remuneration for the executive duties the shares of the Bank, the approval of which, under the Law entrusted to the executive directors of the Bank. and the Bylaws, is within the purview of the shareholders acting at a general shareholders’ meeting, at the proposal of the board All such information is contained in note 5 to the Group’s made after a report of the appointments and remuneration legal report. committee. The Group’s policy provides that only executive directors may be beneficiaries of remuneration systems consisting of the delivery of shares or rights thereon. BOARD’S REMUNERATION IN 2010 In 2010, for the second consecutive year, the board resolved to maintain the same amounts as in the prior year for the annual allocation to which the board members are entitled for the performance of supervisory and collective decision-making duties, such that they have remained unchanged since 2008. With regards to the executive directors, the board has agreed to keep with only one exception the fixed remuneration for 2011 and to increase the variable remuneration by 10% for 2010. ANTICIPATION OF AND ADAPTATION TO THE REGULATORY FRAMEWORK For some years, the board of directors, at the proposal of the appointments and remuneration committee, has initiated measures based on the need for a remuneration system that fosters rigorous risk management. This initiative, together with continuous monitoring of the recommendations of the principal domestic and international bodies in this area, has allowed the Bank to apply the principles contained in many of the more recent guidelines, on some occasions even before they go into effect. One example of this is the deferred shares portion of variable remuneration that the Bank’s board approved in 2007 and that the Financial Stability Board included among the principles for sound compensation practices announced in 2009. ANNUAL REPORT 2010 75
  • 78.
    DUTIES OF DIRECTORS,RELATED-PARTY COMMITTEES OF THE BOARD TRANSACTIONS AND CONFLICTS OF INTEREST GENERAL The board has set up, as decision-making committees, DUTIES an executive committee, to which it has delegated general The duties of the directors are governed by the Rules and decision-making powers, and a risk committee, to which it Regulations of the Board, which conform both to the provisions has delegated powers specifically relating to risks. of current Spanish law and to the recommendations of the Unified Good Governance Code. The board also has the following committees with supervisory, reporting, advisory and proposal-making powers: the audit and The Rules and Regulations expressly provide for the duties compliance committee, the appointments and remuneration of diligent management, fidelity in furtherance of the Bank’s committee, the international committee, and the technology, interests, loyalty, secrecy and inactivity in the event of productivity and quality committee. knowledge of confidential information. EXECUTIVE COMMITTEE The duty of diligent management includes the directors’ duty to The executive committee is a basic instrument for the corporate inform themselves adequately of the running of the Bank and to governance of the Bank and its group. Its duties and dedicate to their duties the time and effort needed to carry them composition are established in the Bylaws (article 51) and in the out effectively. The directors must inform the appointments and Rules and Regulations of the Board (article 14). remuneration committee of their other professional obligations, and the maximum number of boards of directors on which they There are currently 10 directors sitting on the committee, may sit is governed by the provisions of Law 31/1968 of 27 July. of whom 5 are executive and 5 are non-executive directors. Of the latter, 4 are independent and 1 is neither proprietary RELATED-PARTY TRANSACTIONS nor independent. To the best of the Bank’s knowledge, no member of the board of directors, no person represented by a director and no The executive committee proposes to the board those decisions company of which such persons, or persons acting in concert that are within its exclusive purview. It also reports to the board with them or through nominees therein, are directors, members on the matters dealt with and the resolutions adopted by of senior management or significant shareholders, in financial making the minutes of its meetings available to the directors year 2010 and to the date of publication of this report, has (article 14.7 of the Rules and Regulations of the Board), among carried out unusual or significant transactions with the Bank. other ways of reporting. CONTROL MECHANISMS RISK COMMITTEE As provided in the Rules and Regulations of the Board (article 30), It is governed by the Bylaws (article 52) and the Rules and directors must inform the board of any conflict of interest, Regulations of the Board (article 15), which define the whether direct or indirect, that they may have with the interests composition and duties of this committee, including within its of the Bank. If the conflict relates to a transaction, the director powers and duties the responsibilities set forth in the Unified may not carry it out without the approval of the board, following Code regarding risk control and management. a report of the appointments and remuneration committee. The committee is currently made up of five directors, of whom The director involved must refrain from participating in the two are executive and three are non-executive. Of these three discussion and voting on the transaction to which the conflict non-executive directors, two are independent and one is neither refers. proprietary nor independent. Its chairman is a vice-chairman with executive duties pursuant to the Rules and Regulations of In the case of directors, the body in charge of resolving any the Board (article 15.1). disputes is the board of directors itself. Pages 150 to 207 of this annual report contain broad SPECIFIC SITUATIONS OF CONFLICT information regarding the risk committee and the Group’s risk In financial year 2010 there were 39 cases in which directors, policies, the responsibility for which (article 3 of the Rules and including those who are members of senior management, Regulations of the Board) is part of the board’s general duty abstained from participating and voting in the discussions of the of supervision. board of directors or of the committees thereof. The breakdown of the 39 cases is as follows: on 16 occasions, the situation of conflict was due to proposals for appointment, re-election and renewal of powers of the directors; on 13 occasions, the matter under consideration was the approval of terms of remuneration; on 5 occasions, the situation arose from the annual verification of the status of the directors made by the appointments and remuneration committee at its meeting of 17 March 2010 pursuant to article 6.3 of the Rules and Regulations of the Board; on 4 occasions, proposals were discussed regarding the financing of companies related to various directors; and on one occasion, the matter at hand was the approval of a corporate social responsibility activity in favour of a foundation chaired by a director. 76 ANNUAL REPORT 2010
  • 79.
    AUDIT AND COMPLIANCECOMMITTEE During financial year 2010, none of the members of the As provided in the Bylaws (article 53) and the Rules and appointments and remuneration committee was an executive Regulations of the Board (article 16), the audit and compliance director, member of senior management or employee of the committee must be made up of non-executive directors, the Bank, and no executive director or member of the senior majority of whom must be independent. Its chairman shall be management of the Bank sat on the board (or on the an independent director. It is currently composed of remuneration committee) of companies that employed independent non-executive directors only. members of the appointments and remuneration committee. Its duties, listed in the above-mentioned provisions, conform to The Rules and Regulations of the Board establish the duties of the recommendations of the Unified Code for audit committees this committee, including all those recommended by the Unified and the internal audit function. Code for appointments and remuneration committees. The coordination required by the best international practices Since 2004 the appointments and remuneration committee has between the activities of the risk committee and those of the published an activities report which, since 2006, also includes audit committee is guaranteed within the Group because, on the report on director remuneration policy. the one hand, the general secretary is the secretary of both the risk committee and the audit and compliance committee, TECHNOLOGY, PRODUCTIVITY AND and on the other hand, because of the presentations QUALITY COMMITTEE regarding risk management made at the audit and compliance The technology, productivity and quality committee (article 13 committee. of the Rules and Regulations of the Board) is responsible for studying and reporting on the plans and actions relating to Specifically, during the last financial year, the third vice-chairman information and application programming systems, investments and chairman of the risk committee reported to the audit and in computer equipment, design of operational processes to compliance committee, at its meeting of 21 April, regarding the improve productivity, and programmes to improve service quality status of risks within the Group, submitting a detailed and measurement procedures, as well as programs relating to presentation on the following issues: resources and costs. 1. Principles governing risk management. It is made up of eight directors, three executive and five non-executive directors. Of the latter, four are independent 2. Reference indicators (review of the Group’s balance sheet, and 1 is neither proprietary nor independent. credit risk and market risk). 3. Principal risks, delinquency, and features of the main INTERNATIONAL COMMITTEE portfolios. The international committee (article 13 of the Rules and 4. Other issues, such as stress test on credit portfolios, Regulations of the Board) is responsible for monitoring the real estate risk in Spain and structured financing. progress of the Group’s strategy and the activities, markets and countries in which the Group wishes to operate through direct investments or through the deployment of specific business. Moreover, other presentations were made in 2010 regarding The committee is informed of the commercial initiatives and specific risk issues. strategies of the various Group units and of any new projects presented to it. It also reviews the progress of financial The report prepared by the audit and compliance committee investments and business as well as the international economic regarding its activities in 2010, which is distributed together climate so that it can make, where appropriate, suitable with the annual report, contains detailed information on internal proposals to correct country risk limits, their structure and control systems and risk management. returns and their allocation by business and/or unit. APPOINTMENTS AND REMUNERATION COMMITTEE The committee is made up of eight directors, four executive The Bylaws (article 54) and the Rules and Regulations of the directors and four independent non-executive directors. Board (article 17) provide that this committee is also to be made up exclusively of non-executive directors and that its chairman shall be an independent director, as is in fact the case. All its current members are independent non-executive directors. COMMITTEES OF THE BOARD Audit and Appointments Executive Risk compliance and remuneration committee committee committee committee No. of members 10 5 5 5 Executive 5 2 - - Non-executive 5 3 5 5 No. of meetings 55 99 11 9 Hours* 285 297 55 28 (*) Estimated hours of average dedication per director. ANNUAL REPORT 2010 77
  • 80.
    INTERNATIONAL ADVISORY BOARD The international advisory board, established in 1997 and governed by article 18 of the Rules and Regulations of the Board, cooperates with the board in the design, development and, if applicable, implementation of the overall business strategy by contributing ideas and suggesting business opportunities. During 2010, the international advisory board held two meetings, during which the following issues were discussed, among others: the situation in the US, Spain and the rest of Europe, the Bank’s living will, Santander’s image plan and sporting sponsorships, the Group’s results and the prospects thereof, with special focus on the integration of the main businesses acquired over the last years. The international advisory board is made up of leading Spanish and foreign personalities who are not members of the Bank’s board. It is currently composed of the following 8 members, representing 6 nationalities: Chairman Mr Antonino Fernández, former chairman of Grupo Modelo in Mexico Members Mr Bernard de Combret, chairman of Total Trading Geneve Mr Carlos Fernández González, chairman and executive vice president of Grupo Modelo in Mexico Mr Santiago Foncillas, former chairman of Grupo Dragados Mr Richard N. Gardner, former US ambassador to Spain Mr Francisco Pinto Balsemâo, former prime minister of Portugal Sir George Mathewson, former chairman of the Royal Bank of Scotland Mr Fernando Masaveu, chairman of Grupo Masaveu Secretary Mr Ignacio Benjumea Cabeza de Vaca 78 ANNUAL REPORT 2010
  • 81.
    ATTENDANCE AT MEETINGSOF ATTENDANCE AT BOARD MEETINGS % THE BOARD OF DIRECTORS AND ITS COMMITTEES IN 2010 97.1 92.7 91.9 90.1 90.2 Pursuant to the Rules and Regulations of the Board (article 20.1), absences from meetings must be limited to unavoidable cases. The average attendance rate at board of directors’ meetings in financial year 2010 was 90.1%. 2006 2007 2008 2009 2010 The attendance rate as present at meetings of the board has exceeded 90% in each of the last five years. ATTENDANCE AT MEETINGS OF THE BOARD OF DIRECTORS AND ITS COMMITTEES IN 2010 Decision-making Reporting Appointments Technology, Audit and and productivity Board Executive Risk compliance remuneration and quality International Average attendance 90.13% 92.18% 90.71% 89.09% 91.11% 100.00% 100.00% Individual attendance Mr Emilio Botín-Sanz de Sautuola y García de los Ríos 12/12 50/55 – – – 2/2 1/1 Mr Fernando de Asúa Álvarez 12/12 53/55 96/99 11/11 9/9 2/2 – Mr Alfredo Sáenz Abad 12/12 53/55 – – – 2/2 1/1 Mr Matías Rodríguez Inciarte 12/12 55/55 99/99 – – – – Mr Manuel Soto Serrano 11/12 – – 11/11 9/9 2/2 – Assicurazioni Generali S.p.A. (1) 9/12 – – – – – – Mr Antonio Basagoiti García-Tuñón 12/12 53/55 93/99 – – 2/2 – Ms Ana Patricia Botín-Sanz de Sautuola y O’Shea 12/12 45/55 – – – 2/2 1/1 Mr Javier Botín-Sanz de Sautuola y O’Shea 11/12 – – – – – – Lord Burns (Terence) 9/12 – – – – – – Mr Guillermo de la Dehesa Romero 12/12 52/55 – – 9/9 – 1/1 Mr Rodrigo Echenique Gordillo (2) 12/12 49/55 – – 8/9 – 1/1 Mr Antonio Escámez Torres 10/12 53/55 88/99 – – 2/2 1/1 Mr Ángel Jado Becerro de Bengoa (3) 5/5 – – – – – – Mr Francisco Luzón López 10/12 44/55 – – – – 1/1 Mr Abel Matutes Juan 11/12 – – 9/11 – – 1/1 Mr Juan Rodríguez Inciarte 12/12 – 73/99 – – – – Mr Luis Ángel Rojo Duque 3/12 – – 8/11 6/9 – – Mr Luis Alberto Salazar-Simpson Bos 11/12 – – 10/11 – 2/2 – Ms Isabel Tocino Biscarolasaga 12/12 – – – – – – Note: the denominator refers to the number of meetings held during the year during which a director served as such or as a member of the respective committee. (1) Represented on the board of the Bank by Mr Antoine Bernheim. (2) Appointed as a member of the audit and compliance committee on 20 December 2010. From such date through the end of the year, this committee held no meetings. (3) Appointed as a director by the shareholders at the general shareholders’ meeting held on 11 June 2010. He accepted his appointment on such date, and from then on, the board held 5 of its 12 meetings in the year. ANNUAL REPORT 2010 79
  • 82.
    3. SHAREHOLDER RIGHTSAND THE GENERAL SHAREHOLDERS’ MEETING ONE SHARE, ONE VOTE, ONE DIVIDEND NO DEFENSIVE MECHANISMS CONTEMPLATED IN THE BYLAWS The Bank has eliminated all defensive mechanisms in ENCOURAGEMENT OF INFORMED the Bylaws, fully conforming to the one share, one vote, one dividend principle. PARTICIPATION OF SHAREHOLDERS AT SHAREHOLDERS’ MEETINGS The Bylaws of Banco Santander provide for only one class of shares (ordinary shares), granting all holders thereof the Noteworthy measures adopted by the Bank to encourage same rights. informed participation of the shareholders at shareholders’ meetings include the following: There are no non-voting or multiple-voting shares, or preferences • Shareholders may attend meetings even if they hold only in the distribution of dividends, or limitations on the number of one share. votes that may be cast by a single shareholder, or quorum requirements or qualified majorities other than those established • Absence of a share blocking system to identify the persons by law. who are entitled to attend shareholders’ meetings. The only requirement is for any number of shares to be registered in Any person is eligible for the position of director, subject only the name of the shareholder five days prior to the date of the to the limitations established by law. meeting. • Remote attendance by means of data transmission and exercise of voting rights by postal correspondence, physical QUORUM AT THE ANNUAL GENERAL means and electronic communication. SHAREHOLDERS’ MEETING HELD IN 2010 • Shareholders may exercise their right to receive information by sending an e-mail to the address The informed participation of shareholders at general junta.accionistas@santander.com after the date the general shareholders’ meetings is an objective expressly acknowledged shareholders’ meeting is called. by the board (article 31.3 of the Rules and Regulations of the • Separate voting on matters such as the appointment of Board). directors and on articles or groups of articles which are substantially independent in the event of amendments to The quorum at the 2010 annual general shareholders’ meeting the Bylaws or to the Rules and Regulations for the General was 55.854%, above 50% for the fourth consecutive year, Shareholders’ Meeting, except in the case of voting on the despite the increase in the number of the Bank’s shareholders full text of the Bylaws or of the Rules and Regulations for the by almost 900 thousand over the last four years and its high General Shareholders’ Meeting. free float. QUORUM AT THE ANNUAL GENERAL MEETINGS % of capital present and by proxy 56.6 55.8 54.6 54.3 46.0 2006 2007 2008 2009 2010 80 ANNUAL REPORT 2010
  • 83.
    • In addition,it is planned that the annual accounts and the GENERAL SHAREHOLDERS’ MEETING corporate management of the Bank and its consolidated group, all for financial year 2010, be put to a vote under HELD IN 2010 separate items on the agenda at the 2011 annual general shareholders’ meeting. INFORMATION ON THE CALL TO MEETING, THE ESTABLISHMENT OF A QUORUM, ATTENDANCE, • Granting of proxy to any person, whether or PROXY-GRANTING AND VOTING not a shareholder. • Attendance of a notary to prepare the minutes of Annual general shareholders’ meeting of 11 June 2010 the meeting. Notice of the call to meeting was published on 4 May, 38 days prior to the date of the meeting. A total of 326,826 The Bank usually calls general shareholders’ meetings by giving shareholders attended, in person or by proxy, with advance notice in excess of the minimum mandatory 30 days’ 4,596,121,057 shares. The quorum was thus 55.854% of the notice, and makes available to the shareholders, through the share capital of the Bank. Group’s website and from the date of publication of the announcement, all relevant information, including the proposed The average percentage of affirmative votes upon which the resolutions submitted to the shareholders at the meeting. proposals submitted by the board were approved was 96.937%. The following data are stated as percentages of the Bank’s share capital: INFORMATION PROVIDED TO THE SHAREHOLDERS AND COMMUNICATION MEETING OF 11 JUNE 2010 WITH THEM Physically present 0.364% 1 By proxy 34.840% 2 On occasion of the 2010 annual general shareholders’ meeting, the chairman once again sent a letter to all shareholders inviting Remote votes 20.651% 3 them to suggest the matters they would like to see dealt with, Total 55.854%v without prejudice to their rights to receive information and (1) Of such percentage (0.364%), 0.002% is the percentage of share capital that attended by remote make proposals. means through the Internet. (2) The percentage of share capital that granted proxies through the Internet was 0.015%. 849 letters and e-mails were received, all of which were (3) Of such percentage (20.651%), 20.647% is the percentage of votes cast by postal mail and 0.004% is the percentage of electronic votes. duly answered. During 2010, the Bank held 661 meetings with investors and Resolutions adopted at the shareholders’ meeting maintained an on-going relationship with analysts and rating held in 2010 agencies, which entailed personal contact with more than 1,350 The full text of the resolutions adopted at the 2010 annual investors/analysts. For the third consecutive year, the general shareholders’ meeting is available on the websites of department of relations with investors and analysts was chosen both the Group (www.santander.com) and the CNMV by investors (buy side) as the best IR Team in the financial (www.cnmv.es). industry in Europe, according to the survey conducted by the specialised magazine Institutional Investor. The department also continued to inform the main investors and analysts of the Group’s policies in the area of corporate social responsibility. Santander has continued to strengthen the channels for shareholder information and service through the seven Shareholder’s Offices it has in significant markets in which it is present (Spain, United Kingdom, United States of America, Brazil, Mexico, Portugal and Chile). CHANNELS FOR SHAREHOLDER INFORMATION AND SERVICE Telephone service lines 247,057 questions Shareholder’s mailbox 20,704 e-mails answered 127,706 subscriptions Forums 14,230 participants 179 held Web 1,430,542 visits Letters 692,091 letters answered Finally, in compliance with recommendations of the National Securities Market Commission (Comisión Nacional del Mercado de Valores or CNMV) on meetings with analysts and investors, both notices of meetings and the documentation to be used thereat are being published sufficiently in advance. ANNUAL REPORT 2010 81
  • 84.
    4. BANCO SANTANDER’S SENIOR MANAGEMENT COMPOSITION The Bank is managed at the highest level through the executive vice presidents, under the control of the chairman and the chief executive officer. Accordingly, the chairman, the chief executive officer and the following executive vice presidents make up the Bank’s senior management, regardless of their positions, if any, on the board of directors: BANCO SANTANDER’S SENIOR MANAGEMENT America Mr Francisco Luzón López Mr Marcial Portela Álvarez Mr Jesús Mª Zabalza Lotina Internal Audit Mr Juan Guitard Marín Global Wholesale Banking Mr Adolfo Lagos Espinosa Mr Jorge Maortua Ruiz-López Global Private Banking, Asset Management and Insurance Mr Javier Marín Romano Banesto Mr José García Cantera* Communication, Corporate Marketing and Research Mr Juan Manuel Cendoya Méndez de Vigo Unites States of America Mr Jorge Morán Sánchez Mr Juan Andrés Yanes Luciani Strategy and Asia Mr Juan Rodríguez Inciarte Financial and Investor Relations Mr José Antonio Álvarez Álvarez Financial Accounting and Control Mr José Manuel Tejón Borrajo Human Resources Mr José Luis Gómez Alciturri Santander Branch Network - Spain Mr Enrique García Candelas Risk Mr Matías Rodríguez Inciarte Mr Javier Peralta de las Heras Mr José María Espí Martínez Consumer Financing Ms Magda Salarich Fernández de Valderrama Santander Totta Mr Nuno Manuel da Silva Amado Santander UK Ms Ana Patricia Botín-Sanz de Sautuola y O’Shea Mr José María Nus Badía General Secretariat Mr Ignacio Benjumea Cabeza de Vaca Mr César Ortega Gómez Mr Jaime Pérez Renovales Technology and Operations Mr José María Fuster van Bendegem * Chief executive officer of Banesto (he is not an executive vice president of Banco Santander). In addition, Mr Ramón Tellaeche Bosch, a deputy executive vice president of the Bank, is the head of the Means of Payment division, and Mr José Antonio Villasante Cerro, also a deputy executive vice president of the Bank, is the head of the Santander Universidades global division. 82 ANNUAL REPORT 2010
  • 85.
    REMUNERATION Information on theremuneration of executive vice presidents is provided in note 5 of the Group’s legal report. RELATED-PARTY TRANSACTIONS AND CONFLICTS OF INTEREST RELATED-PARTY TRANSACTIONS To the knowledge of the Bank, no member of senior management who is not a director, no person represented by a member of senior management who is not a director, and no company in which such persons or persons with whom they act in concert or who act through nominees therein are directors, members of senior management or significant shareholders, has made any unusual or significant transaction with the Bank during financial year 2010 and through the date of publication of this report. CONFLICTS OF INTEREST The control mechanisms and the bodies in charge of resolving this type of situation are described in the Code of Conduct in Securities Markets, which is available on the Group’s website (www.santander.com). ANNUAL REPORT 2010 83
  • 86.
    5. TRANSPARENCY AND INDEPENDENCE FINANCIAL INFORMATION AND OTHER In addition, the Rules and Regulations of the Board establish limits upon hiring the audit firm for the provision of services SIGNIFICANT INFORMATION other than audit services that could jeopardise the independence thereof. In this connection, the audit and FINANCIAL INFORMATION compliance committee approves non-audit services provided to Pursuant to the provisions of its Rules and Regulations (article the Group by the auditor, which, in 2010, related mainly to the 34.2), the board has taken the necessary actions to ensure that issuance of securities, tax advice, work related to capital the quarterly and semi-annual financial information and the requirements, preparation of financial studies and due diligence. other information made available to the markets is prepared following the same principles, standards and professional The Rules and Regulations impose on the board the duty to practices as are used to prepare the annual accounts. To such make public the overall fees paid by the Bank to the auditor for end, the aforementioned information is reviewed by the audit services other than audit services. The information for financial and compliance committee prior to the release thereof. year 2010 is contained in note 48 of the Group’s legal report. As regards the annual accounts, they are reported on by the audit The Rules and Regulations determine the mechanisms to be and compliance committee and certified by the head of financial used to prepare the accounts such that there is no room for accounting prior to the preparation thereof by the board. qualifications in the auditor’s report. Nevertheless, the Bylaws as well as the Rules and Regulations also provide that, whenever OTHER SIGNIFICANT INFORMATION the board believes that its opinion must prevail, it shall provide Pursuant to the provisions of the Code of Conduct in Securities an explanation, through the chairman of the audit and Markets, the compliance division is responsible for compliance committee, of the content and scope of the communicating to the CNMV the significant information discrepancy and shall endeavour to ensure that the auditor generated in the Group. informs in this regard. The annual accounts of the Bank and of the consolidated Group for financial year 2010 are submitted Such communication shall be simultaneous to the release of without qualifications. significant information to the market or the media, as soon as the decision in question is made or the resolution in question At its meeting of 15 March 2011, the audit and compliance has been signed or carried out. Significant information shall be committee received from the auditor a written confirmation of disseminated in a true, clear, complete and equitable fashion its independence in respect of the Bank and the entities directly and on a timely basis and, whenever practicable, such or indirectly related thereto, as well as information regarding information shall be quantified. additional services of any kind provided to such entities by the auditors or by entities related thereto, pursuant to the provisions In financial year 2010, the Bank published 85 material facts, of Law 19/1988, of 12 July, on the Audit of Accounts. which are available on the websites of the Group and the CNMV. At its meeting of 15 March 2011, such committee issued a report setting forth a favourable opinion regarding the RELATIONSHIP WITH THE AUDITOR independence of the auditors and passing, among other matters, upon the provision of the additional services mentioned INDEPENDENCE OF THE AUDITOR in the preceding paragraph. The shareholders acting at the general shareholders’ meeting of 11 June 2010 approved the re-election of Deloitte, S.L. as The aforementioned report, issued prior to the audit report, auditor for one year, with the affirmative vote of 98.430% of has the content provided by the Securities Market Law (Ley del the capital present in person or by proxy. Mercado de Valores). The Bank has mechanisms in place to preserve the independence of the auditor; worth noting is the obligation of the board to refrain from hiring audit firms in which the fees intended to be paid to them for any and all services are more than two per cent of the total income thereof during the last financial year. 84 ANNUAL REPORT 2010
  • 87.
    INTRA-GROUP TRANSACTIONS The announcement of the call to the 2011 annual general shareholders’ meeting will be viewable as from the date of There were no intra-group transactions in financial year 2010 publication thereof, together with the information relating that were not eliminated in the consolidation process and that thereto, including proposed resolutions and mechanisms for are not part of the ordinary course of business of the Bank or the exercise of the rights to receive information, to grant proxies of the companies of its Group as regards the purpose and and to vote, as well as an explanation of the mechanisms for conditions thereof. the exercise of such rights by means of data transmission. WEBSITE A new practice is that the announcement of the call to the 2011 annual general shareholders’ meeting shall include the rules Since 2004, the Group’s website (www.santander.com) has applicable to the electronic shareholders’ forum that the Bank disclosed in the Information for Shareholders and Investors will make available on its website (www.santander.com) in order section of the main menu all information required under article to facilitate communication among the shareholders prior to 528 of the restated text of the Companies Law (Ley de the meeting. Sociedades de Capital) and under Order ECO/3722/2003, thus carrying out the resolution adopted by the board at its meeting of 23 January 2004. The website contents are presented with specific sections for institutional investors and shareholders and the information is accessible in Spanish, English and Portuguese. The following information is available on such website: • The Bylaws. • The Rules and Regulations for the General Shareholders’ Meeting. • The Rules and Regulations of the Board. • The professional profiles of and other information regarding the directors, as proposed by Recommendation 28 of the Unified Code. • The annual report. • The annual corporate governance report. • The Code of Conduct in Securities Markets. • The General Code of Conduct. • The sustainability report. • The reports of the audit and compliance committee and the appointments and remuneration committee. • The Santander-Banesto relationship framework established by application of recommendation 2 of the Unified Code. ANNUAL REPORT 2010 85
  • 88.
    6. UNIFIED GOOD GOVERNANCE CODE In 2007, Banco Santander carried out a process of adjustment NUMBER OF MEMBERS OF to the Unified Good Governance Code, approved by the National Securities Market Commission (Comisión Nacional del THE BOARD OF DIRECTORS Mercado de Valores or CNMV) on 22 May 2006, based on the Although the current number of directors (20) exceeds the principle of self-regulation, which was completed in 2008 with maximum number of 15 proposed by recommendation 9, the approval of new Bylaws and, in 2009, with new Rules and the board believes that its size is commensurate to the scale, Regulations of the Board. complexity and geographical diversification of the Group. In the opinion of the board, the manner in which it operates, sitting Banco Santander follows practically all of the recommendations both as a full body and through committees —with delegated of the Unified Code, and does not follow (i.e., does not adopt in supervisory, advisory, reporting and proposal-making powers—, full) a small number of them (3 out of 58). Such guarantees its effectiveness and the participation of its recommendations from which the Bank departs are described members. in the following sections, together with the rationale for the board’s position. 86 ANNUAL REPORT 2010
  • 89.
    INDEPENDENT DIRECTORS determined by the board following a report of the appointments and remuneration committee, with just cause being deemed to The board believes that its unity is essential to determine its exist whenever such director fails to perform the duties inherent composition. All the directors must act in furtherance of the in his position or if he becomes subject to any of the interests of the Bank and of its shareholders and are equally circumstances that deprive him of independence. In this case, responsible for the decisions of the board. The board believes the decision of the board not to adopt recommendation 31 is that independence must apply to judgment, be an attribute of also based on the fact that there may be reasons of corporate all the directors, and be based on the probity, integrity, interest which, in the opinion of the board itself, may lead to a reputation and professionalism of each of them. In the opinion proposal for withdrawal from the board for reasons other than of the board, it would be contrary to such principles to those contemplated in the recommendation. establish a different treatment for independent directors than for other directors. The board has also not deemed it appropriate to adopt recommendation 29 to the effect that the term of office of Accordingly, it believes that it would not be in keeping with the independent directors be limited to a maximum of 12 years, as this aforementioned principles to adopt the recommendation that would lead to having to dispense with the services of directors the board of directors not propose the withdrawal of any whose continuation on the board serves the corporate interest independent director prior to the expiration of the term fixed by because of their qualifications, contribution and experience, the bylaws for which he was appointed, except for just cause, without such continuation affecting their independence. ANNUAL REPORT 2010 87
  • 90.
    ECONOMIC AND FINANCIALREVIEW Photo: The headquarters of Santander UK, Triton Square, London, UK 88 ANNUAL REPORT 2010
  • 91.
    90 CONSOLIDATED FINANCIAL REPORT 108 INFORMATION BY SEGMENTS 109 1. Principal segment or geographic areas 142 2. Secondary segments or by business
  • 92.
    ECONOMIC AND FINANCIAL REVIEW GENERALBACKGROUND The global economy recovered strongly in 2010 from the Analysing in greater detail the main economies where the recession in 2009 (-0.6%) and grew by around 5%, higher than Group operates, the US economy grew 2.9% in 2010, following the average of the decade before the world crisis (+4%). This accelerated growth in the fourth quarter of 2.6% annualized, recovery, which was firmer in the first half of the year, was spurred by private consumption and the external sector (higher fuelled, on the one hand, by the monetary and fiscal stimulus exports and lower imports). Despite some weaknesses related to measures adopted in the large developed economies to offset the property sector and medium-sized banks, the extension of weak domestic demand and, on the other, by the greater tax advantages, the incipient improvement in the labour market growth capacity of emerging economies, particularly in Asia and and the better financial position of companies point to Latin America, which were less leveraged and with fewer continued economic expansion. Core inflation of less than 1% growth restrictions and less affected by the downturn. (0.8%) and an unused surpluss from the producing capacity close to 6% of GDP enabled the Federal Reserve to launch a These differences led to a two-speed recovery, with a faster new programme of quantitative easing (purchase of $600 billion pace of growth in emerging than in developed economies, a of debt in eight months) and hold its key interest rate. These trend which held until the last part of 2010 and the beginning trends are not expected to change in the short term. of 2011. However, the positive surprises in US and German growth paint a panorama of a more solid recovery and more Latin America benefited from a favourable external environment balanced among regions in 2011, although still with (higher raw material prices and capital inflows) and from uncertainties. stronger domestic demand. The region grew by more than an estimated 6% in 2010, with record growth in the second • The US economy ended 2010 with signs of more buoyant quarter of 7.8%, largely due to the big economies. domestic demand (consumption and investment), although still incipient. In Germany, growth in the manufacturing sector, Brazil’s growth slowed in the second half of 2010 and ended spurred by external demand, is also feeding through to the year at 7.5% (-0.7% in 2009). This strong expansion put domestic demand via job creation and confidence. Meanwhile, pressure on inflation which reached 5.6% in the fourth quarter, in the rest of Europe, the uncertainty over the fiscal situation in well above the Bank of Brazil’s central objective of 4.5%. countries on the periphery of the euro zone such as Greece Although the central bank held its Selic rate in the second half and the bail-out of the Irish banking system added in the of the year in order to avoid a greater appreciation of the real second half of the year more risk to the euro zone. (the rate had risen by 2 p.p. to 10.75%), the evolution of inflation and its expectations led the bank to lift the Selic rate • Emerging economies continue to grow strongly, driven by at the beginning of 2011 (to 11.75% in mid March). This trend greater international trade, capital inflows, higher oil prices is likely to continue in the coming months. The real and the strength of their domestic demand. strengthened during 2010 to BRL 1.66/$1. This strength, however, raises two challenges for its Mexico, which surprised in the fourth quarter with high growth sustainability. On the one hand, the rise in inflation in many (4.6%), grew by around 5.5% for the whole year, due to greater countries already growing above their potential and, on the demand for its exports to the US and the pick up in domestic other, the large capital inflows which are strengthening their demand. Inflation rose a little (4.4% in December), but is not currencies more than desired, particularly Latin America’s. threatening growth, enabling the Bank of Mexico to hold its The economic policies of these countries face a complicated rate at 4.5% since the end of 2009. As a result of these trends, challenge of controlling inflation without appreciating their the peso appreciated to MXN 12.4/$1. currencies. 90 ANNUAL REPORT 2010
  • 93.
    SUMMARY OF 2010FOR GRUPO SANTANDER Chile’s growth was also surprisingly strong (7.2% year-on-year Grupo Santander generated an attributable profit of EUR 8,181 in the third quarter) and around 5.4% for the whole of 2010. million in 2010. This was the fourth consecutive year, since the Inflation rose because of higher oil and some food prices (3% in onset of the global crisis, that Santander’s profit exceeded EUR December). After raising its interest rates to 3.25% in November 8,000 million (EUR 35,060 million in all). High and recurring (0.5% at the beginning of the year), the Bank of Chile called a generation of earnings make Santander the third bank in the temporary halt to rises, which picked up again in 2011 to 3.5%. world and the leading international one by the profits posted The peso’s appreciation (CLP 468/$1) led to the launch of a during this period, clearly above its competitors who have programme to buy dollars in the currency markets in order to try higher levels of assets and capital. to moderate the strength of the peso. In a complex environment in the many markets where it The euro zone grew by 1.7% in 2010, following a fourth operates, Santander again proved the resistance of its business quarter (1.1% annualized) that maintained the tone and pointed model, which, with a differentiated management, is adapted to to stronger growth in early 2011. Inflation, which rose because the various markets and environments and enables it to of higher oil prices, ended the year at 2.2%, above the target of generate high recurring profits while also preparing the income the European Central Bank (ECB) which, however, held its repo statement for the coming years. rate at 1% in 2010. The drivers behind this model are a focus on the customer and Rising oil prices at the beginning of 2011 are putting pressure on retail business, geographic diversification and continuous on inflation, leading the European Central Bank to tighten its efforts to improve commercial efficiency, prudent risk anti-inflation stance. All of this increases the probability of a management and discipline in capital and liquidity, all of which preventive rise in interest rates in the first half of 2011 in order is strengthened by the Santander brand, recognized as one of to anchor inflation expectations. The euro strengthened in the the world’s main financial brands. last months of 2010 to EUR/$1.34 and is maintaining this trend in 2011 because of the new interest rate expectations. Six key features sum up management of Grupo Santander in 2010: European activity continues to be largely backed by Germany (3.5% GDP growth for the whole year). Of note is the better 1) Solid generation of profits. Attributable profit of EUR performance in manufactures, exports and investment which, 8,181 million was 8.5% lower than in 2009 and earnings per according to the latest data on confidence and the good level of share were EUR 0.9418. job creation, is already feeding through to domestic demand. The profit includes the impact of the EUR 693 million (EUR The Spanish economy did better than expected in 2010, with 472 million after tax) allowance resulting from the new Bank zero growth in the third quarter and 0.2% in the fourth. Growth of Spain regulations on provisions (Circular 3/10) and their for the whole year was 0.1% negative. Consumption declined in application under criteria of maximum prudence. Excluding the second half of the year (purchases were brought forward in this effect, attributable profit would have been EUR 8,653 the first half because of the rise in VAT as of July), while the million (-3.2%) and earnings per share EUR 0.9961. external sector led growth. The income statement reflects the diversification and focuses The slightly better growth figure, however, was not sufficient to of management adapted to each market: create jobs and the unemployment rate topped 20%. Higher oil prices and taxes (tobacco) pushed up inflation to 3% in – Profits grew strongly in emerging markets (Brazil and the December, a trend that intensifies at the beginning of 2011. rest of Latin America), which recovered pre-crisis business levels. There was also growth in developed countries with The UK ended 2010 with a sharp deceleration in growth (-2.1% still weak macroeconomic environments but which are annualized in the fourth quarter), largely due to severe weather benefiting from their business moment (restructuring in the conditions, after a good third quarter (+2.9%). Growth for the UK and the US, consumer business ahead of the cycle). All whole year was 1.4%, a trend which is likely to be maintained. of this is offsetting the sharp fall in profits in Spain and Inflation continued to be high (3.7%), partly due to the rise in Portugal, affected by intense processes of deleveraging. indirect taxes and sterling’s slide. – Of note was the consistency of basic revenues. Active In this context, the Bank of England held its base rate at 0.5% management of spreads was vital here to soften the throughout the year, although inflationary pressures make a rise impact of low growth in lending, with interest rates at in the rate more probable in the first half of 2011. Sterling lows, particularly in developed markets, and higher strengthened a little against the euro (EUR 1/£0.86). financing costs. Gross income rose 6.8% and net interest income 11.1%. ANNUAL REPORT 2010 91
  • 94.
    – Good managementof total operating costs which 5) High shareholder remuneration. The total shareholder increased 2.0% excluding a small perimeter effect and the return in 2010 was EUR 0.60 per share, including the scrip impact of exchange rates. The efficiency ratio of 43.3% dividends, the same as in 2009. A total of EUR 4,999 million was at the level of the best of our peers. was distributed among shareholders. – Strict management of risk reduced provisions for possible Recurring profits and solid capital are the keys to making loan losses in the large units and countries except for Santander the international bank that best remunerated its Spain. Recurring provisions (excluding the impact of the shareholders in the last three years (more than EUR 14,700 regulatory change) were 8.5% lower excluding the million). perimeter and exchange rate effects. 6) Better strategic positioning of the Group. Santander 2) Improved trend in credit quality ratios. Non-performing continued to combine organic growth initiatives with various loan (NPL) entries and the risk premium for both the Group agreements to boost its presence in emerging and mature as a whole and for the large business units dropped. countries, enabling it to end the year in a well diversified position and with greater growth potential. This produced a notably slower rate of growth in the Group’s NPL ratio, which ended 2010 at 3.55% (up 0.31 p.p. Among the first was: compared to more than one point in 2009). Of note was the trend in Santander Consumer Finance, Brazil and Sovereign. – The agreement to acquire 25% of the minority interests in Coverage remained virtually stable at 73%. The NPL ratio in Mexico, an operation completed in September. Spain was 4.24% and coverage 58%. – Purchase of Bank Zachodni WBK, the third largest Polish 3) Significant improvement in the financing structure bank by branches and profits. Once the Polish authorities and in the Group’s liquidity ratios. The loan-to-deposit have authorized this operation, an acquisition offer for all ratio was 117%, down from 135% in 2009 and 150% in of the bank’s capital was made. After its completion, the 2008. This was made possible by the strategy to capture Group’s participation will be 95.67%. retail funds, which aimed to gain market share and improve the financing structure with more stable deposits. This As regards developed countries strategy increased the Group’s deposits by EUR 109,400 million, well above the rise in lending (+EUR 41,600 million), – The retail business of Skandinaviska Enskilda Banken (SEB which was more stable as a result of the deleveraging Group) in Germany was acquired. This operation was process in mature markets. completed in January 2011 and enables the Group to almost double its branch network in Germany. The Group also developed a very conservative policy in medium-and long-term issues, which exceeded the year’s – Agreement was reached with The Royal Bank of Scotland maturities. to acquire 311 RBS branches in England and Wales and seven NatWest branches in Scotland, as well as 40 banking 4) Further rise in solvency. The Group’s core capital ratio at centres for SMEs, four centres for company banking and the end of 2010 was 8.80%, above 2009’s 8.61%. The three for private banking. This agreement is yet another generation of free capital, thanks to solid results and significant strategic step for Santander UK, as it increases management of risk assets, together with the positive impact our distribution and cross-selling capacity, and accelerates of the two scrip dividends, which were accepted by 84% and growth in the SMEs segment, where the Group’s market 87% of shareholders respectively, enabled the Group to share is lower than that corresponding to its presence. improve its core capital for the fourth year in a row. These operations, which will be completed, for the most The ratio is very solid, as befits our business model and risk part, during 2011, paint a profile of strong growth for profile and places us in a comfortable position to meet the Santander in the coming years. The units in emerging new Basel requirements and the stricter ones recently countries, those with the best macroeconomic outlook, approved by Spain's regulators. today account for around 45% of the Group’s profits (in a EXCHANGE RATES: 1 EURO / CURRENCY PARITY 2010 2009 Year-end Average Year-end Average US$ 1.3362 1.3228 1.4406 1.3906 Pound sterling 0.8608 0.8570 0.8881 0.8901 Brazilian real 2.2177 2.3262 2.5113 2.7577 New Mexican peso 16.5475 16.6997 18.9223 18.7756 Chilean peso 625.2748 673.9214 730.7444 775.2659 Argentine peso 5.3074 5.1737 5.4761 5.1760 Colombian peso 2,565.5040 2,507.2221 2,949.6285 2,984.2729 Uruguayan peso 26.5904 26.4588 28.1637 31.2598 92 ANNUAL REPORT 2010
  • 95.
    pro forma statementincluding Poland), developed countries RATING AGENCIES with faster prospects of recovery produce about 40% and the rest, in markets still undergoing adjustments, generate less The Group’s AA rating for long-term debt with the four main than 20%. agencies was affirmed in the latest reviews, making Santander one of the few international banks with such a rating or higher The main developments of geographic areas were as follows: with all of them. • Continental Europe: attributable profit of EUR 3,885 The main features of the latest reviews are set out below. million, 22.8% less than in 2009 and hit by the environment of low growth and deleveraging and by the Bank of Spain’s • Standard & Poor’s affirmed in July 2010 the AA rating, valuing new regulations on provisions. Excluding this, profit was the strength of the Bank’s business, the high degree of 13.4% lower. The profits of the three commercial networks geographic diversification, the soundness of business shares in were lower but that of Santander Consumer Finance was core markets, the success and good execution of the strategy, 28.9% higher. the strong resistance of net operating income and the Group’s solid capitalisation. The continued negative outlook • United Kingdom: attributable profit £1,701 million (EUR reflects the difficult macroeconomic situation in Spain and 1,985 million), 10.7% more than in 2009. This was the sixth globally. straight year of double-digit growth in profits. The efficiency ratio was 39.4%, clearly better than our competitors in the • In September, Fitch Ratings affirmed Banco Santander’s AA UK. rating and maintained the stable outlook, valuing the strategic sense of the acquisitions as they were mainly in markets • Latin America: attributable profit of EUR 4,804 million where the Bank is already present. It also affirmed that the (+25.3%). In local currency, and excluding the impact of businesses incorporated complement the fundamental activity minority interests and discontinued operations, profit of retail banking and provide the Group with greater increased 17.0%, due to net interest income (+6.2%), costs geographic diversification. (+4.5%) rising below the inflation rate and lower needs for provisions (-19.5%). Fitch also stressed the strength of the retail franchises in core markets, the quality of management and their strategy, the Both the area as a whole as well as the main countries, led robustness of profits, the diversification and good mix of by Brazil, ended 2010 with lending growth of around 15% or business and the quality of the risk systems. higher. All began the year with negative growth rates. • DBRS confirmed in February 2011 the AA rating, and stable • Sovereign: attributable profit of EUR 424 million ($561 outlook, following the presentation of the Group’s results and million) compared to losses in 2009. Since its incorporation to emphasizing the strong international diversification and high the Group, Sovereign’s contribution has improved quarter level of efficiency. after quarter, backed by a good evolution of revenues, costs and provisions, which has enabled the bank to exceed the • On March 24, 2011, under the review with negative outlook targets announced at the time of the purchase. of 30 Spanish banks last December, Moody's reaffirmed the Aa2 rating of Banco Santander's senior debt due to its strong Corporate Activities: covers a series of centralised activities financial strength. and acts as the Group’s holding. As a result its contribution to results is usually negative. RATING AGENCIES Long Short Financial The area made a loss of EUR 2,918 million in 2010 compared term term strength to a loss of EUR 1,632 million in 2009. This was mainly due to Standard & Poor’s AA A1 + lower net interest income and to losses in financial Fitch Ratings AA F1 + A/B transactions, basically in hedging positions of exchange rates Moody’s Aa2 P1 B- and to lower revenues from hedging interest rates in financings DBRS AA R1(high) of a structural nature. ANNUAL REPORT 2010 93
  • 96.
    GRUPO SANTANDER. RESULTS Grupo Santander showed in 2010 its capacity to produce recurring profits in a difficult environment. Geographic diversification and differentiated management on the basis of • The Group once again showed its capacity to generate each market’s conditions resulted in an attributable profit of recurring profits: more than EUR 8,000 million a year in EUR 8,181 million, 8.5% less than in 2009. Earnings per share the last four years of crisis were EUR 0.9418. • The income statement reflects the management’s focal In order to better interpret the results, several aspects need to points: be taken into account. – Gross income at a record high, due to resistance to the cycle in developed markets and recovery in • The first is the impact on results of the change in the Bank emerging markets. of Spain’s regulations on provisions, which came into force on September 30. These regulations unify and accelerate the – Flexibility in costs and generation of synergies. calendars for provisions for all bad loans, and this meant a one-off and extraordinary provision in the third quarter (in – Active managemengt of risks and recoveries. the units in Spain) of EUR 693 million. Its after tax impact on attributable profit was EUR 472 million. • Profits benefiting from diversification: double-digit growth in the UK, Latin America, Sovereign and The Group has been prudent, both in the criteria used for Santander Consumer Finance. applying the Circular as well as charging all of the provision to the year’s profits, without offsetting its impact through the release of generic provisions. INCOME STATEMENT Million euros Variation 2010 2009 Amount % 2008 Net interest income 29,224 26,299 2,926 11.1 20,945 Dividends 362 436 (74) (17.0) 553 Income from equity-accounted method 17 (1) 17 — 117 Net fees 9,734 9,080 654 7.2 9,020 Gains (losses) on financial transactions 2,606 3,423 (817) (23.9) 2,597 Other operating income/expenses 106 144 (38) (26.2) 258 Gross income 42,049 39,381 2,668 6.8 33,489 Operating expenses (18,196) (16,421) (1,775) 10.8 (14,949) General administrative expenses (16,256) (14,825) (1,431) 9.7 (13,580) Personnel (9,330) (8,450) (879) 10.4 (7,758) Other general administrative expenses (6,926) (6,374) (552) 8.7 (5,822) Depreciation and amortisation (1,940) (1,596) (344) 21.5 (1,370) Net operating income 23,853 22,960 893 3.9 18,540 Net loan-loss provisions (10,258) (9,484) (774) 8.2 (6,601) Impairment losses on other assets (471) (402) (69) 17.3 (91) Other income (1,072) (1,311) 239 (18.2) (426) Profit before taxes (w/o capital gains) 12,052 11,764 288 2.4 11,421 Tax on profit (2,923) (2,336) (587) 25.1 (2,391) Profit from continuing operations (w/o capital gains) 9,129 9,427 (299) (3.2) 9,030 Net profit from discontinued operations (27) 31 (58) — 319 Consolidated profit (w/o capital gains) 9,102 9,458 (356) (3.8) 9,349 Minority interests 921 516 405 78.6 473 Attributable profit to the Group (w/o capital gains) 8,181 8,943 (762) (8.5) 8,876 Net extraordinary capital gains and allowances (1) — — — — — Attributable profit to the Group (2) 8,181 8,943 (762) (8.5) 8,876 EPS (euros) (2) (3) 0.9418 1.0454 (0.1036) (9.9) 1.2207 Diluted EPS (euros) (3) 0.9356 1.0382 (0.1026) (9.9) 1.2133 Pro memoria: Average total assets 1,190,361 1,099,018 91,343 8.3 970,413 Average shareholders' equity 69,334 64,335 4,999 7.8 51,986 (1).- In 2008 and 2009 extraordinary capital gains and extraordinary allowances for the same amount are included, and thus the net amount is zero. (2).- In 2010, before the impact from the application of Bank of Spain’s Circular 3/2010, attributable profit to the Group EUR 8,653 million (-3.2%) and EPS EUR 0.9961 (-4.7%). (3).- 2008 data have been adjusted to the capital increase with preemptive rights at the end of 2008. 94 ANNUAL REPORT 2010
  • 97.
    • There isa small positive perimeter impact from the against the euro. The impact with regard to the euro was consolidation of 11 months of Sovereign by global around +8 p.p. for the whole Group, +4 p.p. in the United integration in 2009 and the incorporation into Santander Kingdom, 16 p.p. in Latin America and 5/6 p.p. in Sovereign. Consumer Finance of Triad, HSBC and AIG portfolios, and a small negative impact of around one percentage point from This positive effect in the operating areas was partly offset in the sale of Banco de Venezuela in 2009. This bank’s results Corporate Activities by the losses recorded in hedging in the months when it consolidated have been eliminated positions. from the various items of the income statement and recorded in discontinued operations. The performance of the income statement and comparisons with 2009 was as follows: • There was also a negative effect of some 5 percentage points from higher minority interests, the net effect between Net interest income continued to be the main driver of the placement of Banco Santander Brazil shares, mainly in revenue growth. It increased 11.1% to EUR 29,224 million. October 2009, and the acquisition, in September 2010, of This was due to a moderate increase in volumes and the minority interests of Santander Mexico in the hands of appropriate management of spreads in all units, adapted in Bank of America. each case to the particular circumstances of markets. • Lastly, the comparison of gross income and expenses is The spreads on loans for the Group as a whole increased from affected by the evolution of the average exchange rates of 3.1% to 3.4%, mainly due to the UK and Sovereign, as well as sterling, the dollar and the main Latin American currencies consumer businesses and wholesale banking. QUARTERLY Million euros 2009 2010 Q1 Q2 Q3 Q4 Q1 Q2 Q3 Q4 Net interest income 6,039 6,617 6,822 6,820 7,122 7,378 7,396 7,329 Dividends 87 153 94 102 47 144 60 111 Income from equity-accounted method (13) 10 1 2 3 5 5 4 Net fees 2,164 2,374 2,291 2,252 2,326 2,483 2,481 2,445 Gains (losses) on financial transactions 862 977 777 806 724 567 599 715 Other operating income/expenses 80 16 19 29 38 38 22 9 Gross income 9,221 10,147 10,004 10,010 10,260 10,614 10,563 10,613 Operating expenses (3,967) (4,087) (4,086) (4,282) (4,263) (4,548) (4,687) (4,698) General administrative expenses (3,587) (3,681) (3,679) (3,877) (3,812) (4,070) (4,206) (4,168) Personnel (2,059) (2,106) (2,095) (2,190) (2,182) (2,317) (2,408) (2,421) Other general administrative expenses (1,529) (1,575) (1,583) (1,687) (1,629) (1,753) (1,798) (1,746) Depreciation and amortisation (379) (405) (407) (405) (451) (478) (481) (531) Net operating income 5,254 6,060 5,918 5,728 5,997 6,066 5,876 5,915 Net loan-loss provisions (2,209) (2,417) (2,574) (2,284) (2,436) (2,483) (2,935) (2,404) Impairment losses on other assets (25) (241) (42) (94) (57) (63) (41) (310) Other income (278) (232) (418) (382) (331) (362) (364) (16) Profit before taxes (w/o capital gains) 2,742 3,171 2,883 2,967 3,173 3,158 2,535 3,186 Tax on profit (614) (629) (559) (535) (734) (680) (634) (874) Profit from continuing operations (w/o capital gains) 2,128 2,542 2,325 2,432 2,439 2,477 1,901 2,311 Net profit from discontinued operations 67 (6) (7) (23) (12) (1) (4) (10) Consolidated profit (w/o capital gains) 2,195 2,536 2,318 2,409 2,427 2,476 1,897 2,301 Minority interests 99 113 97 207 212 246 262 201 Attributable profit to the Group (w/o capital gains) 2,096 2,423 2,221 2,202 2,215 2,230 1,635 2,101 Net extraordinary capital gains and allowances (1) — — — — — — — — Attributable profit to the Group (2) 2,096 2,423 2,221 2,202 2,215 2,230 1,635 2,101 EPS (euros) (2) 0.2472 0.2846 0.2588 0.2547 0.2553 0.2574 0.1884 0.2408 Diluted EPS (euros) 0.2460 0.2831 0.2584 0.2508 0.2537 0.2558 0.1854 0.2406 (1).- In 2009 extraordinary capital gains and extraordinary allowances for the same amount are included, and thus the net amount is zero. (2).- In Q3'10, before the impact from the application of Bank of Spain’s Circular 3/2010, attributable profit to the Group EUR 2,107 million and EPS EUR 0.2429. ANNUAL REPORT 2010 95
  • 98.
    NET INTEREST INCOME Millioneuros +11.1% NET FEES Million euros +7.2% 2010-2009 2010-2009 29,224 9,734 26,299 20,945 9,080 9,020 2008 2009 2010 2008 2009 2010 Spreads on deposits were affected by the lower interest rates Gross income increased 6.8% to EUR 42,049 million. in the commercial units and the Group’s policy of giving Excluding the perimeter and exchange-rate impact, it declined priority to capturing deposits and liquidity, particularly in the 2.2% due to Corporate Activities as operating areas repeated European units, as in Latin America spreads are much more the figure of 2009. stable. The higher cost of wholesale financing is also reflected. The favourable evolution of revenues was due to the progress Net fee income increased 7.2%, with a favourable (excluding the exchange-rate impact) in the UK, Brazil and performance of those from insurance, cards, administration of Sovereign, which offset the lower contributions of Continental accounts and pension funds. Europe, more affected by the conditions of the market in which activity is conducted, and the rest of Latin America, If to net interest income and fee income we add revenues where two factors were at play. The first was the weakness of from insurance activity (+11.5%), the most commercial and business volumes in the first half of the year and the second, recurring revenues increased 10.1% to EUR 39,336 million. the change of mix toward low risk products, which meant Apart from Continental Europe, all areas evolved positively. lower revenues but also a reduced cost of credit. The evolution of revenues thus needs to be seen jointly with provisions. Dividends received dropped from EUR 436 million in 2009 to EUR 362 million, largely due to the reduced ones following the Operating expenses rose 2.0% excluding the perimeter and placement of Visanet, as well as some companies bringing exchange-rate effects. forward payment of dividends to the fourth quarter. Income by the equity accounted method was EUR 17 million compared to All units in continental Europe and the UK reduced their costs a loss of EUR 1 million in 2009. a little. Sovereign’s reduction was the largest because of synergies, while Brazil’s and Mexico’s increased at a slower Gains on financial transactions declined 23.9%, due to pace than the inflation rate. The only noteworthy rises were in Corporate Activities, where the cost of hedging exchange rates Chile, because of the impact of the earthquake, the signing of is recorded, and to lower results in some Latin American a collective bargaining agreement and business dynamics, countries (due to the sale of portfolios in 2009). Good Argentina (collective agreement at rates of 23%) and Global performance of revenues from wholesale businesses in Europe, Banking and Markets (investments made to consolidate mainly from customers. positions reached in 2009 in its main markets). NET FEES Million euros Variation 2010 2009 Amount % 2008 Commissions from services 5,632 5,267 366 6.9 4,799 Mutual & pension funds 1,267 1,178 89 7.5 1,627 Securities services 784 774 10 1.3 732 Insurance 2,051 1,861 190 10.2 1,862 Net fees 9,734 9,080 654 7.2 9,020 96 ANNUAL REPORT 2010
  • 99.
    GROSS INCOME ANDEXPENSES Million euros NET OPERATING INCOME +3.9% Million euros 2010-2009 42,049 39,381 23,853 33,489 22,960 18,540 18,196 16,421 14,949 Gross inc. Expenses Gross inc. Expenses Gross inc. Expenses 2008 2009 2010 2008 2009 2010 The efficiency ratio including amortisations was 43.3% perimeter and exchange-rate effects, provisions declined (38.7% excluding them). Good evolution in the UK and, 8.5%. particularly, at Sovereign where in just two years the ratio improved from 74.5% at the time of its integration into the This reduction was due to lower provisions in Latin America Group to 44.5% (close to the Group’s average). (-19.5% excluding the forex impact), which is beginning to benefit from the improvement in the economic cycle and the Revenue growth and control of expenses lifted net operating change of mix of products, and the good trend in the UK income by 3.9% to EUR 23,853 million, all of it due to the and Sovereign. operating areas. Eliminating the favourable perimeter and exchange rate impact, costs were almost the same as in 2009, Spain and Portugal, on the other hand, still required higher thanks to Brazil, the UK and Sovereign. provisions in 2010 because of the increase in bad loans and the Bank of Spain’s Circular. This underscored the Group’s capacity to keep on generating revenues in the current difficult environment and absorb the Net operating income after provisions was EUR 13,595 larger provisions resulting from the environment and changes million. Of note by units were the strong rises (all excluding the in regulations. Net operating income was 2.3 times more than forex impact) in the UK (+15.0%), Brazil (+16.6%), Latin America the provisions made during the period. Provisions represented excluding Brazil (+11.7%), Santander Consumer Finance 3.4% of the Group’s loans. (+31.5%) and Sovereign (from EUR 11 million to EUR 659 million). Decline in Spain and Portugal. Loan-loss provisions increased 8.2% to EUR 10,258 million, due to the change in regulations. Excluding this and the Asset impairment losses and other results and OPERATING EXPENSES Million euros Variation 2010 2009 Amount % 2008 Personnel expenses 9,330 8,450 879 10.4 7,758 General expenses 6,926 6,374 552 8.7 5,822 Information technology 798 786 12 1.6 668 Communications 670 632 39 6.1 609 Advertising 634 594 39 6.6 632 Buildings and premises 1,553 1,405 148 10.6 1,167 Printed and office material 178 209 (31) (14.8) 173 Taxes (other than profit tax) 376 313 63 20.2 284 Other expenses 2,718 2,436 282 11.6 2,290 Personnel and general expenses 16,256 14,825 1,431 9.7 13,580 Depreciation and amortisation 1,940 1,596 344 21.5 1,370 Total operating expenses 18,196 16,421 1,775 10.8 14,949 ANNUAL REPORT 2010 97
  • 100.
    NET LOAN-LOSS PROVISIONS Millioneuros Variation 2010 2009 Amount % 2008 Non performing loans 11,457 10,516 942 9.0 7,306 Country-risk 2 (117) 119 — 100 Recovery of written-off assets (1,201) (915) (287) 31.3 (805) Total 10,258 9,484 774 8.2 6,601 provisions, which reflect allowances for possible operations (impact of the sale of Banco de Venezuela) and contingencies, were EUR 1,543 million negative compared to minority interests (placement of shares of Banco Santander EUR 1,713 million also negative in 2009. In 2010 there were Brazil and purchase of 25% of Santander Mexico), was 8.5% larger allowances in operating areas, while in 2009 the lower at EUR 8,181 million. centralised ones (premises, pensions and others such as Metrovacesa) were larger. Earnings per share were EUR 0.9418, 9.9% lower than in 2009. Despite this, the Group’s solid financial position and Profit before tax was EUR 12,052 million, up 2.4%. This did recurring profits since the start of the crisis enabled us to not feed through to attributable profit, however, because of maintain shareholder remuneration in 2010 at EUR 0.60 per the higher tax charge and minority interests, which together share. absorbed around 5 p.p. of growth each one. After the tax charge, the profit from continued operations was 3.2% lower. Attributable profit, after incorporating discontinued PROFIT BEFORE TAX +2.4% ATTRIBUTABLE PROFIT TO THE GROUP -8.5% Million euros 2010-2009 Million euros 2010-2009 8,943 8,876 12,052 8,181 11,764 11,421 2008 2009 2010 2008 2009 2010(1) (1) Before the impact from the application of Bank of Spain’s Circular 3/2010: 8,653 million 98 ANNUAL REPORT 2010
  • 101.
    BALANCE SHEET Million euros Variation 2010 2009 Amount % 2008 ASSETS Cash on hand and deposits at central banks 77,785 34,889 42,896 122.9 45,781 Trading portfolio 156,762 135,054 21,707 16.1 151,817 Debt securities 57,871 49,921 7,951 15.9 43,896 Customer loans 755 10,076 (9,321) (92.5) 684 Equities 8,850 9,248 (398) (4.3) 6,272 Trading derivatives 73,069 59,856 13,212 22.1 95,815 Deposits from credit institutions 16,216 5,953 10,263 172.4 5,150 Other financial assets at fair value 39,480 37,814 1,667 4.4 25,817 Customer loans 7,777 8,329 (551) (6.6) 8,973 Other (deposits at credit institutions, debt securities and equities) 31,703 29,485 2,218 7.5 16,844 Available-for-sale financial assets 86,235 86,621 (386) (0.4) 48,920 Debt securities 79,689 79,289 399 0.5 42,548 Equities 6,546 7,331 (785) (10.7) 6,373 Loans 768,858 736,746 32,112 4.4 699,615 Deposits at credit institutions 44,808 57,641 (12,833) (22.3) 64,731 Customer loans 715,621 664,146 51,475 7.8 617,231 Debt securities 8,429 14,959 (6,530) (43.7) 17,653 Investments 273 164 108 65.9 1,323 Intangible assets and property and equipment 14,584 11,774 2,810 23.9 10,289 Goodwill 24,622 22,865 1,757 7.7 18,836 Other 48,901 44,602 4,300 9.6 47,233 Total assets 1,217,501 1,110,529 106,971 9.6 1,049,632 LIABILITIES AND SHAREHOLDERS' EQUITY Trading portfolio 136,772 115,516 21,255 18.4 136,620 Customer deposits 7,849 4,658 3,191 68.5 4,896 Marketable debt securities 365 586 (221) (37.7) 3,570 Trading derivatives 75,279 58,713 16,566 28.2 89,167 Other 53,279 51,559 1,719 3.3 38,987 Other financial liabilities at fair value 51,020 42,371 8,648 20.4 28,639 Customer deposits 27,142 14,636 12,506 85.4 9,318 Marketable debt securities 4,278 4,887 (609) (12.5) 5,191 Due to central banks and credit institutions 19,600 22,848 (3,248) (14.2) 14,130 Financial liabilities at amortized cost 898,969 823,403 75,566 9.2 770,008 Due to central banks and credit institutions 79,537 73,126 6,410 8.8 79,795 Customer deposits 581,385 487,681 93,703 19.2 406,015 Marketable debt securities 188,229 206,490 (18,261) (8.8) 227,642 Subordinated debt 30,475 36,805 (6,330) (17.2) 38,873 Other financial liabilities 19,343 19,300 43 0.2 17,681 Insurance liabilities 10,449 16,916 (6,467) (38.2) 16,850 Provisions 15,660 17,533 (1,873) (10.7) 17,736 Other liability accounts 23,717 20,919 2,798 13.4 19,777 Total liabilities 1,136,586 1,036,659 99,927 9.6 989,630 Shareholders' equity 77,334 71,832 5,502 7.7 65,887 Capital stock 4,165 4,114 50 1.2 3,997 Reserves 66,258 61,071 5,187 8.5 55,707 Attributable profit to the Group 8,181 8,943 (762) (8.5) 8,876 Less: dividends (1,270) (2,297) 1,027 (44.7) (2,693) Equity adjustments by valuation (2,315) (3,165) 850 (26.9) (8,300) Minority interests 5,896 5,204 692 13.3 2,415 Total equity 80,914 73,871 7,044 9.5 60,001 Total liabilities and equity 1,217,501 1,110,529 106,971 9.6 1,049,632 ANNUAL REPORT 2010 99
  • 102.
    DISTRIBUTION OF TOTALASSETS BY GEOGRAPHIC SEGMENT GRUPO SANTANDER. BALANCE SHEET December 2010 Activity reflected the current market context: Sovereign 4% Other 3% • Lower demand for loans in Europe, mainly Spain and Other Latin America 3% Portugal. Chile 3% Spain 27% • Double-digit rise in lending in Latin America after falls in Mexico 4% 2009. • In capturing of funds, preference for deposits, mainly in Brazil 13% Europe. Portugal 4% Core capital (8.8%) rose for the fourth year running and Germany 3% very solid, in accordance with the Group's business model and our risk profile. Other Europe 7% Further rise in shareholders’ equity per share to EUR 8.58 United Kingdom 29% (+EUR 0.54). Total managed funds at the end of 2010 amounted to EUR Lending 1,362,289 million, of which EUR 1,217,501 million (89%) were The Group’s net lending amounted to EUR 724,154 million, 6% on-balance sheet and the rest off-balance sheet mutual and higher than in 2009 and 1% more after eliminating the pension funds and managed portfolios. exchange rate impact. In order to correctly interpret this information, it is necessary to Lending to the public sector increased 24% in the year and that take into account two positive effects. The first was the to other resident sectors dropped 2%. Secured loans, the lowest exchange rate impact from the appreciation of currencies risk part of the portfolio and with the largest share (59%), against the euro over the last 12 months (with end of period increased 2%, while the commercial portfolio was similar to rates): 17% for the Chilean peso, 14% for the Mexican peso, 2009 and other loans declined 8%. 13% for the Brazilian real, 8% for the dollar and 3% for sterling. The second was a small rise in the perimeter due to the Lending to the non-resident sector grew 10%, due to the acquisitions of Santander Consumer Finance. favourable impact of the perimeter and forex effects. The impact of both on growth in customer balances was 5 p.p. The geographic distribution (main segments) was very different positive in loans and in customer funds. by markets. CUSTOMER LOANS Million euros Variation 2010 2009 Amount % 2008 Public sector 12,137 9,803 2,335 23.8 7,668 Other residents 217,497 222,355 (4,858) (2.2) 230,783 Commercial bills 11,146 11,134 11 0.1 14,874 Secured loans 127,472 125,397 2,076 1.7 123,566 Other loans 78,879 85,824 (6,945) (8.1) 92,343 Non-resident sector 514,217 468,267 45,950 9.8 400,903 Secured loans 311,048 286,381 24,667 8.6 229,761 Other loans 203,168 181,886 21,283 11.7 171,142 Gross customer loans 743,851 700,424 43,427 6.2 639,354 Loan-loss allowances 19,697 17,873 1,824 10.2 12,466 Net customer loans 724,154 682,551 41,603 6.1 626,888 Pro memoria: Doubtful loans 27,908 24,027 3,880 16.1 13,968 Public sector 42 18 25 138.5 1 Other residents 12,106 9,898 2,208 22.3 6,208 Non-resident sector 15,759 14,111 1,648 11.7 7,759 100 ANNUAL REPORT 2010
  • 103.
    GROSS CUSTOMER LOANS +6.2%* GROSS CUSTOMER LOANS Billion euros 2010-2009 % o/ operating areas. December 2010 744 Sovereign 5% Other Latin America 2% 700 Chile 4% Mexico 2% 639 Brazil 10% Spain 32% Portugal 4% Germany 3% 2008 2009 2010 United Kingdom 32% Other Europe 6% (*) Excluding exchange rate impact: +2.4% Spain and Portugal’s lending fell by 4% and 7%, respectively, In the specific case of Grupo Santander, 94% of mortgages are due to deleveraging and the selective growth policy followed by for the first residence, the portfolio has a large concentration in the Group in these countries. Santander Consumer Finance’s the lowest tranches of loan-to-value (85% with an LTV lower lending increased 11%. than 80%) and the NPL ratio is very low (2.2%). Gross lending in Spain amounted to EUR 235,993 million, with Loans to SMEs and companies not related to the construction an adequate structure (see below). and real estate sectors amounted to EUR 94,406 million, virtually the same as in 2009. Loans to public administrations rose 24% to EUR 12,137 million. Loans to the construction and real estate sectors, Lending to individuals amounted to EUR 91,240 million, of distinguishing between those without a real estate purpose which EUR 61,387 million were household mortgages. These and those directly related (with the greatest risk) which stood are the healthiest part and with the least risk of further at EUR 27,334 million. deterioration of the portfolio in Spain because of the different features of this product compared to similar ones in This figure represents only 3.7% of the Group’s lending and other countries. For example, the principle is amortised as of 12% of its total loans in Spain, a notably lower proportion the first day, the borrower’s responsibility extends to all their than that of its competitors (more than 16%). Moreover, it is assets and almost all loans are for the first residence, where 12% lower than in 2009 and 27% below 2008, a sharper fall the customer has ownership with a very low expected loss. than that of the rest of the portfolio and reflecting the Group’s strategy of reducing the exposure to this higher risk segment. In Portugal, the fall in lending was mainly to large companies, LOAN PORTFOLIO IN SPAIN Billion euros where there was a shift from loans to capital markets. In addition, balances in construction and real estate, which represent only 3% of lending, declined 10% in 2010. 254 Total 245 236 Public Sector 7 Balances to individuals increased a little (+1% in mortgages). 10 12 Household mortgages 65 64 61 Santander Consumer Finance’s balance increased 11%, due to Other loans to organic growth and the integration of the portfolios acquired in 33 the US and Poland, as commented on in greater retail in the individuals 31 30 section on this area. New loans increased 9%, a significant change of trend, as 2009 evolution showed a downward trend. Companies (without 98 95 95 construction & real estate) In the United Kingdom, the balance of lending was very similar to 2009. In local criteria, residential mortgages in a still No real estate Construction & real estate { purposes Real estate purposes 13 38 2008 13 31 2009 11 27 2010 depressed market grew 3% and loans to SMEs 26%, while personal loans dropped 24%, continuing with the policy of reducing this type of loans. ANNUAL REPORT 2010 101
  • 104.
    CREDIT RISK MANAGEMENT* Millioneuros Variation 2010 2009 Amount % 2008 Non-performing loans 28,522 24,554 3,969 16.2 14,191 NPL ratio (%) 3.55 3.24 0.31 p. 2.04 Loan-loss allowances 20,748 18,497 2,251 12.2 12,863 Specific 14,901 11,770 3,131 26.6 6,682 Generic 5,846 6,727 (881) (13.1) 6,181 NPL coverage (%) 73 75 (3 p.) 91 Credit cost (%) ** 1.56 1.57 (0.01 p.) 1.16 Ordinary non-performing and doubtful loans *** 18,061 17,641 420 2.4 10,626 NPL ratio (%) *** 2.28 2.35 (0.07 p.) 1.53 NPL coverage (%) *** 115 105 10 p. 121 * Excluding country-risk ** Net specific allowance / computable assets *** Excluding mortgage guarantees Note: NPL ratio: Non-performing loans / computable assets Lending in Latin America gradually accelerated in year-on-year Risks terns and ended 2010 with growth of 15% excluding the The still weak economy in some markets caused non-performing exchange-rate effect. These comments also applied to Brazil, loans (NPL) ratios to rise because of the increase in the Group’s Mexico and Chile whose growth rates were 16%, 15% and bad and doubtful loans and the slower pace of growth in lending. 14%, respectively (negative rates in 2009). However, the pace of growth in non-performing loans Sovereign’s loans declined 2% in dollars, affected by the decelerated, as active management produced a good evolution reduction of the portfolio in run-off (-32% in 2010 and -62% in NPL entries and in the risk premium for the whole Group and since Sovereign joined the Group). This resulted in a reduction for the main business units. Bad and doubtful loans amounted to from $9,700 million to $4,000 million. In addition, the focus EUR 28,522 million at the end of 2010, 16% more than in 2009 during 2010 was on new loans and renewals, concentrating on and compared to growth of 130% in 2008 and 73% in 2009. the most attractive mortgage segments (residential and multifamily), which grew 17%. Grupo Santander’s NPL ratio stood at 3.55% at the end of 2010, 31 b.p. more than a year earlier and much lower than in These changes are reflected in the lesser share of lending in 2008 and 2009 when the increase was more than 100 b.p. in Europe and the increase in Latin America. At the end of 2010, each year. Continental Europe accounted for 45% of the Group’s total lending (32% Spain), the UK 32%, Latin America 18% (10% Provisions to cover the NPLs amounted to EUR 20,748 million, Brazil) and Sovereign 5%. The respective figures a year earlier of which EUR 5,846 million were generic provisions. Total were 47% for Continental Europe, 33% for the UK, 15% for provisions have increased by almost EUR 8,000 million in the last Latin America and 5% for Sovereign. two years. Coverage at 73% was very similar to 2009 (75%). LOAN-LOSS ALLOWANCES +12.2% Million euros 2010-2009 20,748 18,497 NON-PERFORMING LOANS Million euros 2010 2009 2008 12,863 Balance at beginning of year 24,554 14,191 6,179 Net additions 13,478 18,234 13,000 Increase in scope of consolidation 257 1,033 2,089 Exchange differences 1,147 890 (871) Write-offs (10,913) (9,795) (6,206) Balance at year-end 28,522 24,554 14,191 2008 2009 2010 102 ANNUAL REPORT 2010
  • 105.
    NET NPLs ENTRIES(1).TOTAL GROUP -26.1% NET NPLs ENTRIES(1). MAIN UNITS Base 100: 2009 Billion euros 2010-2009 SAN + Banesto SCF United Kingdom Latin America 18.2 100 100 100 100 13.5 13.0 94 87 81 42 2008 2009 2010 2009 2010 2009 2010 2009 2010 2009 2010 (1) Excluding perimeter and exchange rate impact (1) Excluding perimeter and exchange rate impact The Group’s NPL ratio in Spain was 4.24%, well below the standard, 100% of which is also up to date with payments. This sector’s average, and coverage 58%. The ratio rose by 83 b.p., means that 75% of doubtful and substandard loans are up to much lower than the increase in 2009. date with payments, while both have appropriate levels of coverage via provisions and guarantees. More than 80% of the portfolio (including mortgages and companies) had an excellent NPL ratio of 3% or lower. Of note Portugal’s NPL ratio was 2.90% at the end of 2010 (+63 b.p.) were mortgages to buy a home whose ratio was 2.2%, which and coverage was 60%. compares very well with the sector. This ratio was 2.5% in 2009 Santander Consumer Finance’s NPL ratio was 4.95% and and its improvement underscored the quality of the portfolio. coverage 128%, improvements of – 44 b.p. and +31 p.p. respectively As regards loans to the construction and real estate development sectors, the NPL ratio for loans not related to real The UK’s NPL ratio was 1.76% (+5 b.p.) and coverage 46% (+2 estate was 4.4%, in line with the average ratio of the portfolio, p.p.). The mortgage portfolio is focused on first residence loans while that for loans with a real estate purpose was 17.0%. and has a high quality of risk in terms of loan-to-value (average of 51%) and a NPL ratio of 1.41%. This ratio reflects, on the one hand, the larger volumes of bad loans in this segment and, on the other, the anticipative policy Brazil’s NPL ratio was 4.91% (-36 b.p.) and improved for the followed by the Group, which is reflected in the fact that 50% fourth straight quarter. Coverage remained at around 100%. of the EUR 4,636 million of doubtful loans are up to date with Latin America excluding Brazil had a NPL ratio of 3.07% (2.96% payments. In addition, EUR 4,932 million was recorded as sub at the end of 2009), with coverage of 110%. NPL RATIO NPL COVERAGE NPL RATIO IN SPAIN % % % No real estate Construction { purposes: 4.4% 3.55 13.3 & real estate Real estate 3.24 purposes: 17.0% 91 8.7 2.04 75 73 3.4 4.2 Total portfolio Spain 3.3 3.0 Other portfolio 2.5 2.0 2.2 Household mortgages 1.9 2.4 1.5 2008 2009 2010 2008 2009 2010 2008 2009 2010 ANNUAL REPORT 2010 103
  • 106.
    CUSTOMER FUNDS UNDERMANAGEMENT Billion euros +9.5%* CUSTOMER FUNDS UNDER MANAGEMENT % o/ operating areas. December 2010 2010-2009 985 Sovereign 4% 900 Other Latin America 4% 145 +0.9% 827 Chile 3% 144 Mexico 4% Other 131 269 -6.4% Spain 30% Other on balance 288 318 sheet Brazil 15% 571 +21.9% Deposits 468 378 Portugal 4% w/o REPOs Germany 3% Other Europa 2% 2008 2009 2010 United Kingdom 31% (*) Excluding exchange rate impact: +5.3% Sovereign's NPL ratio was 4.61% and coverage 75%. Both ratios Customer funds under management were better than in 2009 and better than the forecasts made at Total managed funds at the end of 2010 amounted to EUR the beginning of the year. 985,269 million, 10% more than in 2009. More detailed information on credit risk, particularly real estate After deducting the perimeter and forex effects, growth was 5% risk in Spain, the control and monitoring systems and the and distributed as follows: 17% rise in deposits without repos internal models for calculating provisions are included in the (demand deposits: +4%; time: +36%), the balance of repos, section on risk management in this report. marketable securities and subordinated debt declined 6% and the aggregate of mutual and pension funds hardly changed. The sharp rise in deposits reflects the focus on capturing customer funds by all the Group’s units, using two strategies. CUSTOMER FUNDS UNDER MANAGEMENT Million euros Variation 2010 2009 Amount % 2008 Public sector 9,655 13,293 (3,638) (27.4) 13,720 Other residents 161,096 126,189 34,907 27.7 117,776 Demand deposits 67,077 61,000 6,077 10.0 51,300 Time deposits 81,145 49,177 31,968 65.0 46,783 REPOs 12,873 16,012 (3,138) (19.6) 19,693 Non-resident sector 445,625 367,495 78,131 21.3 288,734 Demand deposits 210,490 195,823 14,668 7.5 151,774 Time deposits 197,590 148,485 49,105 33.1 115,620 REPOs 30,623 18,403 12,220 66.4 17,187 Public Sector 6,922 4,784 2,138 44.7 4,153 Customer deposits 616,376 506,976 109,400 21.6 420,229 Debt securities 192,872 211,963 (19,091) (9.0) 236,403 Subordinated debt 30,475 36,805 (6,330) (17.2) 38,873 On-balance-sheet customer funds 839,723 755,744 83,979 11.1 695,506 Mutual funds 113,510 105,216 8,293 7.9 90,306 Pension funds 10,965 11,310 (345) (3.0) 11,128 Managed portfolios 20,314 18,364 1,950 10.6 17,289 Savings-insurance policies 758 9,422 (8,664) (92.0) 12,338 Other customer funds under management 145,547 144,313 1,234 0.9 131,061 Customer funds under management 985,269 900,057 85,213 9.5 826,567 104 ANNUAL REPORT 2010
  • 107.
    MUTUAL FUNDS Million euros Variation 2010 2009 Amount % 2008 Spain 34,310 40,616 (6,306) (15.5) 44,694 Portugal 3,209 3,982 (773) (19.4) 3,031 United Kingdom 14,369 10,937 3,432 31.4 7,180 Latin America 61,621 49,681 11,940 24.0 35,400 Total 113,510 105,216 8,293 7.9 90,306 • The strategy in developed countries was one of deleverage, Sovereign’s deposits declined 4% in dollars, due to the bank’s with growth in deposits much greater than that of loans. This policy of reducing high cost balances. Low cost retail deposits closed the commercial gap significantly. increased 3% and more expensive ones dropped 18%. • In emerging countries, the strategy was to self-finance the Continental Europe accounted for 39% of managed customer larger relative rise in lending with a very similar increase in funds (30% Spain), the UK 31%, Latin America 26% (Brazil deposits. 15%) and Sovereign 4%. The respective figures in 2009 were 40% for Continental Europe, 31% for the United Kingdom, 23% Continental Europe increased its deposits excluding repos 31%. for Latin America and 6% Sovereign. In Spain, which accounts for three out of every four of As well as capturing large volumes of funds in 2010, the Group, Continental Europe’s deposits, the increase was 21%, due to for strategic reasons, maintained an active policy of issuing the strategy of growth and customers’ preference for this type securities in the international fixed income markets (EUR 37,981 of product. This produced a gain in market share in demand million). deposits (+1.4 p.p.) and in time deposits (+1.7 p.p.). Mutual and pension funds declined 13%, impacted by the deposit capturing The Group issued, respectively, EUR 27,225 million, EUR 10,613 campaign. million and EUR 143 million of senior debt, covered bonds and subordinated debt. Santander Consumer Finance’s deposits excluding repos increased 16%, while in Portugal they rose 45% and mutual and This issuing activity shows the capacity of the Group via its pension funds declined 16%. parent bank Banco Santander and its main subsidiaries to access the different institutional markets in the countries where it In the UK, customer deposits excluding repos increased 6% in operates: Spain, with Banesto, Portugal, the UK, Chile, Brazil sterling and mutual funds rose 27%. and Mexico. In Latin America, savings rose 8% excluding the forex impact. As regards securitisations, the Group’s subsidiaries placed in the Mexico’s grew 14%, Brazil’s 6% and Chile’s 2%. The strategy in market a total of EUR 19,174 million (the UK with EUR 12,873 these countries was similar: double digit growth in demand million). deposits, more moderate in mutual funds (except for Chile) and lower balances in time deposits (except for Mexico), anticipating Issues of senior debt, covered bonds and subordinated debt that the next interest rate movements in markets. matured in 2010 were EUR 22,390 million, EUR 3,550 million PENSION FUNDS Million euros Variation 2010 2009 Amount % 2008 Spain 9,650 9,912 (262) (2.6) 9,734 Individuals 8,161 8,429 (268) (3.2) 8,381 Collective plans 262 266 (4) (1.5) 236 Group employee plans 1,227 1,217 10 0.8 1,117 Portugal 1,315 1,398 (83) (5.9) 1,394 Total 10,965 11,310 (345) (3.0) 11,128 ANNUAL REPORT 2010 105
  • 108.
    and EUR 3,753million, respectively. The whole of the Series V of LOANS / DEPOSITS. TOTAL GROUP the preferential shares of Santander Finance Capital (EUR 1,000 % million) were amortised. 150 The Group successfully completed in the first quarter a purchase 135 offer for a series of subordinated debt issues. This meant the acceptance and subsequent cancellation of issues for the 117 following nominal amounts: EUR 181 million, ₤1,309 million and US$ 1,632 million. This capturing of stable funds, via deposits and issues, combined with the reduced growth in lending, enabled the credit / deposit ratio to be lowered to 117% (135% in 2009 and 150% in 2008). The ratio of deposits plus medium and long-term financing over loans increased to 115% (106% in 2009), 2008 2009 2010 underscoring the appropriate structure of financing the Group’s lending. More detailed information on management of financing in markets, the management framework of liquidity and the Group’s structural liquidity position is set out on the section on The rise in the trading portfolio was largely due to derivatives risk management in this report, under the heading whose increase was similar in assets and liabilities, because of “management of financing and liquidity risk.” the evolution of the market value, mainly of interest rate swaps. Other items of the balance sheet This growth does not mean an increase in risk, as it is normal Total goodwill was EUR 24,622 million at the end of 2010, split practice in these products to require collateral for the positive between Europe and the Americas. Goodwill increased by EUR mark to market. The balance at the end of 2010 was EUR 1,757 million in 2010, mainly due to the impact of exchange 73,069 in assets and EUR 75,279 in liabilities. rates, which have their counterparty in their positive impact on valuation adjustments. Of note in the rest of the items were: Cash on hand and deposits in central banks rose from EUR 34,889 million to EUR 77,785 million, mainly in the UK and Brazil and in both cases due to the tougher regulations on liquidity requirements established by the respective central banks. 106 ANNUAL REPORT 2010
  • 109.
    SHAREHOLDERS' EQUITY ANDMINORITY INTERESTS Million euros Variation 2010 2009 Amount % 2008 Capital stock 4,165 4,114 50 1.2 3,997 Additional paid-in surplus 29,457 29,305 152 0.5 28,104 Reserves 36,993 31,796 5,197 16.3 28,024 Treasury stock (192) (30) (163) 546.2 (421) Shareholders' equity (before profit and dividends) 70,423 65,186 5,237 8.0 59,704 Attributable profit 8,181 8,943 (762) (8.5) 8,876 Interim dividend distributed (1,270) (1,285) 15 (1.2) (1,711) Interim dividend not distributed (2,060) (2,837) 777 (27.4) (3,102) Shareholders' equity (after retained profit) 75,273 70,006 5,267 7.5 63,768 Valuation adjustments (2,315) (3,165) 850 (26.9) (8,300) Minority interests 5,896 5,204 692 13.3 2,415 Total equity (after retained profit) 78,854 72,045 6,809 9.5 57,883 Preferred shares and securities in subordinated debt 7,352 7,745 (393) (5.1) 8,673 Total equity and capital with the nature of financial liabilities 86,207 79,791 6,416 8.0 66,555 Shareholders’ equity and solvency ratios The BIS ratio was 13.1%, Tier I 10.0% and core capital rose for Total shareholders’ equity after retained earnings, was 8% the fourth year running to 8.8%. This improvement was due to higher at EUR 75,273 million (+EUR 5,267 million), mainly due the free generation of capital and the scrip dividend, which to the increase in reserves. comfortably offset the negative impact of the acquisition of minority interests in Mexico. Two capital increases were carried out in 2010. In the first one, 11,582,632 shares were issued in October to tend to the This core capital is of very high quality, very solid and adjusted exchange of 33,544 Valores Santander and in the second to our risk profile, as underscored by the results of the stress 88,713,331 shares were issued for November’s scrip dividend, in tests conducted by the Committee of European Banking which 84% of the capital opted to receive the amount Supervisors (CEBS) and the Bank of Spain last July. equivalent to the second interim dividend in shares. Lastly, of note is the high and sustained capacity to generate Including valuation adjustments, minority interests and retained profits, after deducting dividends in accordance with preference shares, total net equity and capital with the nature of the Group's pay-out policy. At the end of 2010, shareholders’ financial liabilities increased 8% to EUR 86,207 million (+EUR equity per share was EUR 8.58 (+EUR 0.54), which is added to 6,416 million) at the end of 2010. Valuation adjustments were the rise in the last four years. EUR 850 million higher because of the favourable impact of the appreciation of currencies against the euro. As regards capital ratios, Grupo Santander’s eligible shareholders’ equity, in accordance with the criteria of the Bank for International Settlements (BIS II), amounted to EUR 79,276 million (EUR 30,885 million surplus and 64% above the minimum requirement). COMPUTABLE CAPITAL AND BIS II RATIO CAPITAL RATIOS (BIS II) Million euros % 2010 2009 2008 14.2 13.3 13.1 Core capital 53,205 48,366 38,968 Basic capital 60,617 56,615 46,894 Supplementary capital 20,670 24,309 25,225 BIS Ratio 10.1 10.0 Deductions (2,011) (1,221) (3,816) 9.1 Computable capital 79,276 79,704 68,302 Tier I 8.6 8.8 Risk-weighted assets 604,885 561,684 514,003 7.5 BIS II ratio 13.1 14.2 13.3 Core capital Tier I (before deductions) 10.0 10.1 9.1 Core capital 8.8 8.6 7.5 Shareholders' equity surplus (BIS II ratio) 30,885 34,769 27,182 2008 2009 2010 ANNUAL REPORT 2010 107
  • 110.
    DESCRIPTION OF THESEGMENTS Grupo Santander maintained in 2010 the general criteria used in In addition, Sovereign’s figures are recorded on their own. This 2009, with the following exceptions: bank began to be consolidated by global integration in February 2009, after its acquisition had gone ahead. • The annual adjustment to the Global Customer Relationship Model was made. This does not mean any changes in the Secondary level (or business). This segments the activity of the principal (geographic) segments, but it does affect the figures operating units by the type of business. The reported for Retail Banking and Global Wholesale Banking. segments are: • Exit of Open Bank from the Santander Consumer Finance • Retail Banking. This covers all customer banking division, as it is being managed in a differentiated way outside businesses (except those of Corporate Banking, managed this sphere. through the Global Customer Relationship Model). Because of their relative importance details are provided by the main None of these changes was significant for the Group and do not geographic areas (Continental Europe, United Kingdom and alter its figures. The figures for 2009 were restated and include Latin America) and Sovereign, as well as by the main the changes in the affected areas. countries. The results of the hedging positions in each country are also included, conducted within the sphere of With the sale of Banco de Venezuela, effective in July 2009, this each one’s Assets and Liabilities Committee. bank’s results for 2009 were eliminated from the various lines of the income statement and recorded in discontinued operations. • Global Wholesale Banking (GBM). This business reflects the revenues from Global Corporate Banking, Investment The financial statements of each business area have been drawn Banking and Markets worldwide including all treasuries up by aggregating the Group’s basic operating units. The managed globally, both trading and distribution to information relates to both the accounting data of the customers (always after the appropriate distribution with companies in each area as well as that provided by the Retail Banking customers), as well as equities business. management information systems. In all cases, the same general principles as those used in the Group are applied. • Asset Management and Insurance. This includes the contribution of the various units to the Group in the design In accordance with the IFRS, the business areas are structured and management of mutual and pension funds and into two levels: insurance. The Group uses, and remunerates through agreements, the retail networks that place these products. Principal level (or geographic). The activity of the Group’s This means that the result recorded in this business is net (i.e. operating units is segmented by geographical areas. This deducting the distribution cost from gross income). coincides with the Group’s first level of management and reflects its positioning in the world’s three main currency areas As well as these operating units, which cover everything by (euro, dollar and sterling). The segments reported on are: geographic area and by businesses (their totals are the same), the Group continues to maintain the area of Corporate • Continental Europe. This covers all retail banking business Activities. This area incorporates the centralised activities (including Banif, the specialised private bank), wholesale relating to equity stakes in industrial and financial companies, banking and asset management and insurance conducted in financial management of the structural exchange rate position Europe with the exception of the United Kingdom. Given the and of the parent bank’s structural interest rate risk, as well as importance of some of these units, the financial information management of liquidity and of shareholders’ equity through of the Santander Branch Network, Banesto, Santander issues and securitisations. Consumer Finance (including Santander Consumer USA) and Portugal is also set out. As the Group’s holding entity, this area manages all capital and reserves and allocations of capital and liquidity. It also • United Kingdom. This includes retail and wholesale banking, incorporates amortisation of goodwill but not the costs related asset management and insurance conducted by the various to the Group’s central services except for corporate and units and branches of the Group in the country. institutional expenses related to the Group’s functioning. • Latin America. This embraces all the Group’s financial activities conducted via its subsidiary banks and subsidiaries. It also includes the specialised units of Santander Private Banking, as an independent and globally managed unit, and New York’s business. Because of their specific importance, the financial statements of Brazil, Mexico and Chile are also provided. 108 ANNUAL REPORT 2010
  • 111.
    1. PRINCIPAL SEGMENTSOR GEOGRAPHIC INCOME STATEMENT Million euros Net operating income Attributable profit to the Group 2010 2009 Amount % 2010 2009 Amount % Continental Europe 9,794 10,312 (519) (5.0) 3,885 5,031 (1,146) (22.8) o/w: Santander Branch Network 2,769 3,240 (470) (14.5) 1,243 2,005 (762) (38.0) Banesto 1,376 1,551 (175) (11.3) 419 738 (319) (43.2) Santander Consumer Finance 3,361 2,972 389 13.1 811 629 182 28.9 Portugal 650 726 (75) (10.4) 456 531 (75) (14.2) United Kingdom 3,567 3,231 337 10.4 1,985 1,726 259 15.0 Latin America 12,805 11,071 1,734 15.7 4,804 3,833 971 25.3 o/w: Brazil 9,037 7,376 1,660 22.5 2,836 2,167 669 30.9 Mexico 1,458 1,542 (84) (5.5) 682 495 188 37.9 Chile 1,311 1,196 115 9.7 683 563 120 21.3 Sovereign 1,169 582 587 100.8 424 (25) 449 — Operating areas 27,335 25,196 2,139 8.5 11,099 10,565 533 5.0 Corporate Activities (3,482) (2,236) (1,246) 55.7 (2,918) (1,623) (1,295) 79.8 Total Group 23,853 22,960 893 3.9 8,181 8,943 (762) (8.5) RATIOS % Efficiency ratio(1) ROE NPL ratio* NPL coverage* 2010 2009 2010 2009 2010 2009 2010 2009 Continental Europe 38.6 36.4 14.15 18.78 4.34 3.64 71 77 o/w: Santander Branch Network * 42.8 39.2 17.38 26.65 5.52 4.38 52 65 Banesto 42.8 39.9 9.43 17.24 4.11 2.97 54 64 Santander Consumer Finance 27.5 27.3 10.31 9.06 4.95 5.39 128 97 Portugal 45.4 42.8 20.34 25.38 2.90 2.27 60 65 United Kingdom 39.4 40.8 22.72 29.62 1.76 1.71 46 44 Latin America 38.4 37.3 22.66 23.67 4.11 4.25 104 105 o/w: Brazil 37.0 37.0 23.11 25.64 4.91 5.27 101 99 Mexico 38.7 34.2 19.52 18.43 1.84 1.84 215 264 Chile 36.0 33.2 30.53 32.29 3.74 3.20 89 89 Sovereign 44.5 60.2 14.87 — 4.61 5.35 75 62 Operating areas 38.9 38.3 18.42 21.02 3.53 3.21 75 76 Total Group 43.3 41.7 11.80 13.90 3.55 3.24 73 75 (1) With amortisations * Santander Branch Network is the retail banking unit of Banco Santander S.A. The NPL ratio of Banco Santander S.A. at the end of December 2010 stood at 4.24% (3.41% in December 2009) and NPL coverage was 54% (73% in December 2009). OPERATING MEANS Employees Branches 2010 2009 2010 2009 Continental Europe 54,518 49,870 6,063 5,871 o/w: Santander Branch Network 18,893 19,064 2,931 2,934 Banesto 9,742 9,727 1,762 1,773 Santander Consumer Finance 13,852 9,362 519 310 Portugal 6,214 6,294 759 763 United Kingdom 23,649 22,949 1,416 1,322 Latin America 89,526 85,974 5,882 5,745 o/w: Brazil 53,900 50,961 3,702 3,593 Mexico 12,500 12,466 1,100 1,093 Chile 11,595 11,751 504 498 Sovereign 8,647 8,847 721 722 Operating areas 176,340 167,640 14,082 13,660 Corporate Activities 2,529 1,820 Total Group 178,869 169,460 14,082 13,660 ANNUAL REPORT 2010 109
  • 112.
    CONTINENTAL EUROPE Million euros Variation 2010 2009 Amount % INCOME STATEMENT Net interest income 10,957 11,456 (499) (4.4) Net fees 3,748 3,787 (38) (1.0) Gains (losses) on financial transactions 843 609 234 38.3 Other operating income (1) 397 364 33 9.1 Gross income 15,946 16,217 (271) (1.7) Operating expenses (6,152) (5,904) (248) 4.2 General administrative expenses (5,513) (5,335) (179) 3.3 Personnel (3,429) (3,306) (123) 3.7 Other general administrative expenses (2,084) (2,028) (56) 2.8 Depreciation and amortisation (639) (569) (70) 12.2 Net operating income 9,794 10,312 (519) (5.0) Net loan-loss provisions (4,190) (3,111) (1,079) 34.7 Other income (192) (151) (41) 26.9 Profit before taxes 5,412 7,050 (1,638) (23.2) Tax on profit (1,417) (1,882) 464 (24.7) Profit from continuing operations 3,995 5,169 (1,174) (22.7) Net profit from discontinued operations (14) (45) 31 (69.3) Consolidated profit 3,981 5,124 (1,143) (22.3) Minority interests 96 93 3 3.4 Attributable profit to the Group 3,885 5,031 (1,146) (22.8) BALANCE SHEET Customer loans (2) 323,660 322,026 1,634 0.5 Trading portfolio (w/o loans) 57,690 50,764 6,926 13.6 Available-for-sale financial assets 23,843 20,132 3,711 18.4 Due from credit institutions (2) 66,925 90,530 (23,605) (26.1) Intangible assets and property and equipment 4,965 5,054 (88) (1.7) Other assets 22,160 21,955 204 0.9 Total assets/liabilities & shareholders' equity 499,243 510,461 (11,217) (2.2) Customer deposits (2) 247,715 198,144 49,571 25.0 Marketable debt securities (2) 48,413 50,610 (2,196) (4.3) Subordinated debt (2) 1,740 2,079 (339) (16.3) Insurance liabilities 933 10,287 (9,354) (90.9) Due to credit institutions (2) 77,029 117,509 (40,480) (34.4) Other liabilities 95,993 105,366 (9,373) (8.9) Shareholders' equity (3) 27,420 26,466 953 3.6 Other customer funds under management 53,968 70,289 (16,322) (23.2) Mutual funds 37,519 44,598 (7,079) (15.9) Pension funds 10,965 11,310 (345) (3.0) Managed portfolios 5,484 5,499 (15) (0.3) Savings-insurance policies — 8,882 (8,882) (100.0) Customer funds under management 351,836 321,122 30,714 9.6 (1).- Including dividends, income from equity-accounted method and other operating income/expenses (2).- Including all on-balance sheet balances for this item (3).- Not including profit of the year 110 ANNUAL REPORT 2010
  • 113.
    ACTIVITY LOANS / DEPOSITS CONTINENTAL EUROPE % variation 2010 / 2009 % • Commercial strategy: capturing deposits given priority +31.1 and continued selective growth in loans. • Revenues affected by the weak economic environment, 163 reduced activity and low interest rates. • Control of expenses, with commercial units as a whole flat on a like-for-like basis. 131 +0.5 • Provisions affected by the Bank of Spain Circular (negative after tax impact on profits of EUR 472 million). 2009 2010 Loans Deposits* (*) W/o REPOs NET OPERATING INC. ATTRIBUTABLE PROFIT Million euros -5.0% Million euros -22.8% Attributable profit was EUR 3,885 million, 22.8% less than in 10,312 2009 and impacted by the application of the Bank of Spain's 9,794 Circular (-13.4% excluding its impact). 5,031 Continental Europe includes all activities carried out in this 3,885 geographic area: retail banking, global wholesale banking, asset management and insurance. Strategy In an environment that still remains weak, the Group’s strategy focused on capturing deposits, which, combined with low demand for loans, is reflected in the rapid improvement in the 2009 2010 2009 2010(1) gap between credits and deposits; managing spreads on loans (1) Before the impact from the application of Bank of Spain’s Circular 3/2010: 4,357 million; -13.4% in a context of very low interest rates; control of costs and risk management centred on recoveries. Meanwhile, the sale of products and services was strongly aimed at capturing and linking customers. Activity Operating expenses increased slightly because of a perimeter Lending remained virtually unchanged from 2009, due to lower effect in Santander Consumer Finance and an increase in costs demand in Spain and Portugal, partly offset by the growth in the at Global Banking & Markets, as the Santander Branch Network, business of Santander Consumer Finance. Banesto and Portugal reduced their costs a little. Provisions for loan losses increased 34.7%, due to the environment and Deposits (without repos) increased 31%, fuelled by the strategy applying the Bank of Spain’s new regulations, whose impact is of capturing deposits in the networks in Spain and Portugal. fully reflected in Continental Europe, (-13.4% excluding this impact). The strategy aimed, on the one hand, to bolster the Group’s liquidity position (the credit/deposits ratio improved by 32 p.p.) and, on the other, increase the market share by capturing and linking high-income customers. The Group improved its market share of deposits in Spain in 2010, after capturing more than 100,000 customers. This also had a favourable impact on transactions, according to the National Service of Electronic Settlement. NPL RATIO NPL COVERAGE Growth in mutual funds and pension funds remained affected % % by the strategy of greater preference for deposits. Total funds 4.34 (deposits, mutual and pension funds) increased 22%. 3.64 Results 77 Gross income fell 1.7% due to the decline in net interest income 71 in the three large networks. The repricing of mortgages and the higher cost of funds was almost offset by the better evolution of Santander Consumer Finance and higher gains on financial transactions from wholesale business. 2009 2010 2009 2010 ANNUAL REPORT 2010 111
  • 114.
    CONTINENTAL EUROPE. MAINUNITS Million euros Santander Santander Branch Network Banesto Consumer Finance Portugal 2010 Var (%) 2010 Var (%) 2010 Var (%) 2010 Var (%) INCOME STATEMENT Net interest income 3,682 (9.0) 1,521 (12.9) 3,663 13.4 724 (8.7) Net fees 1,080 (9.0) 617 1.6 955 11.8 357 3.9 Gains (losses) on financial transactions 110 (14.0) 196 18.9 (6) (60.1) 67 (17.3) Other operating income (1) (31) 1.4 69 8.0 22 4.7 42 (17.4) Gross income 4,841 (9.1) 2,403 (7.0) 4,634 13.3 1,190 (6.2) Operating expenses (2,072) (0.8) (1,027) (0.4) (1,273) 13.8 (540) (0.6) General administrative expenses (1,910) (1.0) (904) (0.6) (1,156) 13.9 (467) (0.3) Personnel (1,234) (0.1) (666) (2.4) (595) 17.3 (321) 1.1 Other general administrative expenses (676) (2.7) (237) 4.8 (561) 10.5 (146) (3.2) Depreciation and amortisation (161) 1.9 (124) 0.8 (117) 13.3 (73) (2.4) Net operating income 2,769 (14.5) 1,376 (11.3) 3,361 13.1 650 (10.4) Net loan-loss provisions (1,091) 127.1 (709) 87.0 (2,017) 2.6 (110) 20.8 Other income 25 — (29) 26.3 (143) 215.0 20 132.4 Profit before taxes 1,703 (38.0) 637 (44.5) 1,201 25.1 560 (12.9) Tax on profit (460) (38.0) (161) (51.7) (339) 23.9 (104) (6.5) Profit from continuing operations 1,243 (38.0) 476 (41.6) 861 25.5 457 (14.2) Net profit from discontinued operations — — — — (14) (69.3) — — Consolidated profit 1,243 (38.0) 476 (41.6) 847 32.1 457 (14.2) Minority interests 0 (33.7) 57 (26.0) 37 192.2 1 (41.9) Attributable profit to the Group 1,243 (38.0) 419 (43.2) 811 28.9 456 (14.2) BALANCE SHEET Customer loans (2) 111,372 (3.4) 75,624 0.2 63,342 11.4 30,102 (6.8) Trading portfolio (w/o loans) — — 6,575 (4.1) 1,146 (0.5) 1,741 35.4 Available-for-sale financial assets — — 9,025 15.2 558 16.1 6,458 67.0 Due from credit institutions (2) 214 937.3 17,103 (27.2) 8,016 17.2 3,401 (39.6) Intangible assets and property and equipment 1,201 (0.9) 1,374 (3.5) 889 4.3 480 (1.3) Other assets 481 (13.0) 7,520 2.6 2,892 3.2 7,091 45.7 Total assets/liabilities & shareholders' equity 113,268 (3.2) 117,222 (4.2) 76,844 11.4 49,272 1.7 Customer deposits (2) 85,667 18.3 59,721 7.5 25,950 16.1 21,727 45.4 Marketable debt securities (2) — — 27,684 (7.4) 11,717 58.4 7,544 (35.4) Subordinated debt (2) — — 1,304 (2.7) 428 (7.9) 0 (99.9) Insurance liabilities — — — — — — 79 (98.4) Due to credit institutions (2) 457 18.2 13,422 (26.9) 25,864 (6.4) 16,818 23.0 Other liabilities 20,089 (45.8) 10,611 (17.7) 4,273 15.3 1,171 (11.7) Shareholders' equity (3) 7,056 (1.8) 4,480 3.4 8,611 15.5 1,933 9.7 Other customer funds under management 26,864 (7.2) 9,616 (12.9) 24 — 4,655 (54.3) Mutual funds 20,347 (6.1) 5,712 (22.5) 19 — 3,209 (19.4) Pension funds 6,132 (1.1) 1,337 (5.6) 5 — 1,315 (5.9) Managed portfolios — — 117 1.7 — — 131 7.1 Savings-insurance policies 385 (64.9) 2,450 14.8 — — — (100.0) Customer funds under management 112,531 11.0 98,325 0.5 38,118 26.1 33,927 (8.5) (1).- Including dividends, income from equity-accounted method and other operating income/expenses (2).- Including all on-balance sheet balances for this item (3).- Not including profit of the year 112 ANNUAL REPORT 2010
  • 115.
    ACTIVITY LOANS / DEPOSITS SANTANDER BRANCH NETWORK % variation 2010 / 2009 % • Successful strategy to capture deposits, with market +18.3 share gains in demand deposits, time deposits and mutual funds. 159 • Lower gross income due to reduced lending and low official interest rates. • Flat expenses in the last three years. 130 • Better non-performing loans than the sector and higher provisions due to the Bank of Spain Circular. -3.4 • Best Bank in Spain prize from Euromoney. Loans Deposits 2009 2010 Attributable profit was EUR 1,243 million, 38.0% lower than in and Cuenta Crecimiento. The direct results were an 2009 (-23.4% excluding the application of the Bank of Spain's improvement in the financing structure (the lending/deposits Circular 3/2010). ratio was improved by 29 p.p.), and a significant gain in market share of more than 100 b.p. Banking was conducted in 2010 in an unfavourable environment, with strong pressures from the markets and The growth in deposits was accompanied by an improvement in continued weak economic activity. Non-performing loans the market share of mutual funds of 130 b.p., as their evolution continued to rise and interest rates remained at low levels. was better than the market’s. Funds managed by Santander declined 6% compared to a fall of 15% for the sector. As a Strategy result, the Group recovered leadership in mutual funds with a In this environment, the Santander Branch Network focused on market share of 18.5%. capturing deposits, defending spreads, controlling expenses and risk management, which together with capturing, linking and In lending, the overall balance dropped 3% because of the slight retaining customers, were the main priorities. It was also very fall in mortgages and the double-digit reduction in balances active in selling new products and services, tailored to with a real estate purpose. Balances with institutions increased customers’ needs and aimed at specific segments. 21%, with businesses 5% and with large companies 5%. The Cuenta con Nosotros was launched for individual Of note in the sphere of public institutions was the plan to customers. It offers up to eight products and is very focused on capture civil servants. Their number reached 125,000 (+10,500 capturing and linking customers from the start. The Santander in 2010). Ferrari card, aligned with the global brand strategy, was also launched for individual customers, and in just six weeks 100,000 As regards the ICO lending programme for businesses and were sold. SMEs, the Santander network held its leadership position (market share of 18%), after formalising 53,000 operations The Cuenta Bienvenida Negocios was launched for companies, amounting to more than EUR 3,800 million. particularly SMEs and businesses. This product boosts the level of new customer transactions. In personal banking, Santander Select, a new business model based on an integral service for customers, was marketed. It is offered through 370 specialised managers and provides a range NET OPERATING INC. ATTRIBUTABLE PROFIT of specific products including the Fondos Select, which combine Million euros -14.5% Million euros -38.0% investments in own and third party products. 3,240 2,769 All these measures are part of the We want to be your Bank 2,005 strategic plan, launched five years ago and which has benefited 4.2 million customers, who don't pay any service fees. This plan 1,243 is thriving, as shown by the copies of it launched by our competitors during 2010. Activity The strategy was mainly focused on capturing customer funds. Deposits rose 18%, with demand deposits up 13% (setting us 2009 2010 2009 2010(1) apart in the sector) and time deposits up 25%, reflecting the (1) Before the impact from the application of Bank success of the campaign with the products Depósito Ganador of Spain’s Circular 3/2010: 1,536 million; -23.4% ANNUAL REPORT 2010 113
  • 116.
    Results BANESTO The results in 2010 reflect the impact of the Bank of Spain’s new regulations on provisions (anticipation and simplification of calendars) in the third quarter. This one-off charge amounted to • The balance sheet and the capital and liquidity positions EUR 402 million recorded in specific provisions for loan losses. were strengthened. As no generic provisions were released, the whole charge was • Revenue growth benefited from the capturing and made against the unit’s results. The impact on profits, net of linking of individual customers and SMEs. tax, was EUR 293 million. • Very disciplined expenses, which continued to decline. After absorbing this impact, attributable profit was EUR 1,243 • Good evolution of credit risk quality, better than that of million, 38.0% lower than in 2009 (-23.4% excluding the our competitors, and higher provisions because of the change in regulations). Bank of Spain’s Circular. Gross income was 9.1% lower at EUR 4,841 million. This was • Best Bank in Spain prize from Euromoney. due to net interest income, affected by the lower demand for loans, the repricing of mortgages and the higher cost of funds resulting from stiffer competition for deposits, as well as to net fee income and gains on financial transactions, where those Banesto’s attributable profit was EUR 419 million, 43.2% lower most directly linked to activity (securities, commercial bills and than in 2009 (-28.1% excluding application of the Bank of derivatives) declined. Those linked to transfers, domiciling, Spain's Circular), while provisions notably strengthened the factoring and confirming increased, as well as those from Group’s financial position. pension funds. Strategy Operating expenses were 0.8% lower. This reduction was These results were due to the involvement of all employees in achieved without reducing installed capacity, enabling business selecting priorities focused on capturing and linking customers to be strengthened and a gain in market share. The efficiency in order for Banesto to be the reference bank for individuals and ratio, including amortisations, was 42.8% and 39.5% excluding companies. The three pillars of the strategy were: defence of them. revenues, cost control and prudent risk management. Net operating income of EUR 2,769 million underscored These policies went hand in hand with the quality of service as Santander’s capacity to generate recurring results even in the the foundation of the value offer. Banesto improved its most difficult environments. standards of quality during 2010, as shown, among other things, by having attained the best rating of Spanish banks in This figure was almost three times higher than the provisions the EFQM evaluation conducted by the Excellence Club in made during 2010 (EUR 1,091 million) including the EUR 402 Management. million resulting from the change in the Bank of Spain’s regulations, and four times the recurring provisions (EUR 689 This was made possible, among other circumstances, by the million excluding this impact). competitive advantage provided by Banesto’s technology capacity whose innovative solutions are a differential factor over Active management of non-performing loans was reflected in a our competitors, as well as by the Bank’s financial strength. 15% fall in gross entries and a recovery ratio of around 70%. The NPL ratios of Banco Santander parent bank (4.24%) and of All of these factors enabled Banesto to become more efficient, the Santander Branch Network (5.52%), excluding wholesale improve its procedures and products and launch new initiatives, activity, were lower than the sector’s. Coverage for Banco such as the Nómina iPad, IPF Selección and the Banesto Santander parent bank was 54% and 52% for the Network. Fidelidad programme for greater customer linkage. As in the rest of segments, Banesto’s figures were drawn up again in accordance with the criteria set out on page 108 of this report. The figures presented here, therefore, do not coincide with those published by Banesto itself. NPL RATIO NPL COVERAGE % % Activity The evolution of the balance sheet was consistent with the 5.52 management policy developed in 2010. Capturing and linking 4.38 customers was one of the priorities in 2010. The customer base 65 grew significantly. Deposits excluding repos increased 18% and 52 time deposits rose by an even stronger 36%. Off-balance sheet managed funds were 13% lower than in 2009. 2009 2010 2009 2010 114 ANNUAL REPORT 2010
  • 117.
    ACTIVITY LOANS / DEPOSITS NET OPERATING INC. ATTRIBUTABLE PROFIT % variation 2010 / 2009 % Million euros -11.3% Million euros -43.2% 1,551 1,376 +17.7 136 738 419 127 +0.2 Loans Deposits* 2009 2010 2009 2010 2009 2010(1) (*) W/o REPOs (1) Before the impact from the application of Bank of Spain’s Circular 3/2010: 531 million; -28.1% In 2010 demand for loans was lower. In this context, Banesto Net operating income dropped 11.3% to EUR 1,376 million. continued its policy of selective growth. Customer loans at the end of 2010 stood at EUR 75,624 million, almost the same as a Net loan-loss provisions rose 87.0% to EUR 709 million, due, on year earlier. the one hand, to the rise in non-performing loans, although Banesto’s are increasing at a slower pace than the banking Non-performing loans (NPLs) continued to rise because of the system’s as a whole, and, on the other, the impact of the weak economic environment. The NPL ratio was 4.11% and change in the Bank of Spain’s regulations, which meant a coverage 54%. charge against earnings of EUR 178 million (EUR 112 million after tax) Results Net interest income was 12.9% lower at EUR 1,521 million. Profit before tax was EUR 637 million. Attributable profit after Management of spreads and of the balance sheet largely offset taxes and minority interest was EUR 419 million, 43.2% lower the impact of slower business growth. than in 2009 (-28.1% excluding the impact of the extraordinary charge). Net fee income amounted to EUR 617 million, 1.6% more than in 2009. The business model, backed by growth in the customer base and linkage, is producing continuous improvement in transactions and boosting revenue from services and insurance (+2.7% in 2010). Revenue from management of mutual and pension funds, however, dropped 5.8%. NPL RATIO NPL COVERAGE % % Gains on financial transactions, whose main component is still 4.11 distribution of treasury products to customers, increased 18.9% to EUR 196 million. 2.97 64 54 Gross income was 7.0% less at EUR 2,403 million. As a result of disciplined cost control, operating expenses declined 0.4% to EUR 1,027 million and together with revenue produced an efficiency ratio of 42.8%, (37.6% excluding amortisations). 2009 2010 2009 2010 ANNUAL REPORT 2010 115
  • 118.
    ACTIVITY REDUCED FINANCING RECOURSE SANTANDER CONSUMER FINANCE % variation 2010 / 2009 TO THE PARENT BANK Billion euros • Rise in revenues, due to higher volumes, management of prices, fee income from the incorporation of portfolios in +16.1 the US and a still low cost of financing. • Lower expenses on a like-for-like basis. 15 +11.4 • Lower specific provisions because of the sharp fall in the risk premium (to levels of the second quarter of 2008). 9 • Improved quality of the credit portfolio, with a lower NPL ratio and higher coverage. • The business of AIG in Poland was incorporated in the 0 Target second half of 2010 and the unit in Russia sold. Loans Deposits 2009 2010 in 2012 Attributable profit was EUR 811 million, 28.9% more than in Activity 2009 (+31.8% excluding the impact of the Bank of Spain’s Lending amounted to EUR 63,342 million, 11% more than in Circular). 2009 because of organic growth and the portfolios integrated in the US and Poland. The area also manages the servicing of Strategy EUR 6,000 million of third parties in the US. The focus was on organic growth and cross-selling, backed by brand agreements and greater penetration in the used card New lending (EUR 24,650 million) was on a very positive trend, segment, which offset the decline in new car sales in Europe. as it began the year with negative growth rates and ended it up There was also a notable effort in risk control, admission and 9%. The main engine of lending was auto finance for used cars recoveries, which enhanced credit quality. (+25% y-o-y), which offset the weakness in other segments, particularly new vehicles (+1%) although this segment The area also continued to actively manage its businesses: performed better than the market (-5% y-o-y in Europe). expansion into high potential markets and exit from businesses without critical mass, such as the sale of the unit in Activity was stronger in the US (new loans doubled), Spain Russia. (+18%), the UK (+16% in sterling) and Nordic countries (+13% in local currency). All of this offset the 10% fall in new loans in Of note was the consolidation in Poland of AIG Bank, making Germany because of the end of the scrappage scheme (new car Santander Consumer Poland one of the leaders in consumer sales fell 23%). finance, and the acquisition in the US of the portfolios of third parties at a discount, which improved the quality of the portfolio Customer deposits increased 16% to EUR 25,950 million, fuelled and increased the profile of the target customers of Santander by the capacity to capture funds in Germany and the Consumer USA. incorporation of Poland. In addition, and as part of the strategy developed by the Group to optimise the use of liquidity, Significant progress was also made in the integration of new Santander Consumer Finance stepped up the volume of issues units. Of note in Germany, was the integration of GE and sharply reduced its recourse to the Group’s parent bank in combined with the migration to the Partenón corporate order to attain total self-financing in 2012. platform of most of the business modules. This process is expected to be completed this year. This will be the operating Results base for integrating the retail business of SEB acquired in These actions were clearly reflected in the income statement: January 2011. • Gross income increased 13.3%, backed by the most basic NEW LENDING BY COUNTRIES NET OPERATING INC. ATTRIBUTABLE PROFIT % Million euros +13.1% Million euros +28.9% Austria 2% Netherlands 2% 3,361 Portugal 2% 2,972 United Kingdom 7% 811 Poland 3% Germany 36% 629 Nordic countries 15% Italy 13% 2009 2010 2009 2010(1) (1) Before the impact from the application of Bank USA 12% of Spain’s Circular 3/2010: 829 million; +31.8% Spain 8% 116 ANNUAL REPORT 2010
  • 119.
    revenues: net interestincome (+13.4%), due to the rise in the PORTUGAL average portfolio and management of spreads and fee income (+11.8%), due to greater activity and servicing in the US. • Revenues dented by low interest rates, reduced activity and strong competition for liquidity. • Higher expenses (+13.8%) due to the expansion in Poland and the US. At constant perimeter and exchange rates, they were • Lower expenses for the second year running. 1.4% lower, due to control and the synergies obtained from the integration of GE, particularly in Germany. • Prudent management in risks and provisions. • Improvement in the commercial gap and in the balance • The efficiency ratio was 27.5%, much better than that of its sheet structure as a result of the large rise in deposits and competitors, and net operating income was 13.1% higher. selective growth in lending • Stable loan-loss provisions (+2.6% y-o-y) pushed up growth in • Best bank in Portugal prize from Global Finance, net operating income after provisions to 33.6% (+0.5% in 2009). Euromoney and The Banker. The provisions reflect the impact of the more demanding regulatory requirements in Spain (+EUR 26 million) and the Santander Totta’s attributable profit of EUR 456 million was higher generic provisions from larger volumes and portfolios. 14.2% lower than in 2009. Both were offset by lower specific provisions from the enhanced credit quality. The non-performing loan ratio declined from Activity was conducted in a very difficult environment, due to 5.39% to 4.95% and coverage rose by 31 p.p. to 128%. the economic downturn, the drop in investment and private consumption, the persistence of the sovereign debt crisis and • In the rest of items, lower negative impact of discontinued the lack of liquidity. operations and higher minority interests in Poland. Strategy The trends for the whole area were similar in individual countries, In this environment, Santander maintained solid capital ratios, though with varying degrees of intensity. Germany, which an efficiency ratio of 45.4% and a high return on equity of more generates the largest profits, increased its contribution to the than 20%. In all of them, Santander Totta was better than its Group by 6.9% in an environment of weak activity, thanks to competitors. management of spreads, lower costs (-0.9%) and stable provisions. One of the main strategic priorities in 2010 was the stronger Santander Consumer USA, the second largest contributor, focus on capturing funds in order to gain market share, capture increased its attributable profit 54.7% in dollars. The main factors and link customers and improve the balance sheet structure behind this were larger volumes (organic generation and with more stable funds. Various products were marketed such integration of portfolios), higher revenues from servicing and the as the DP Vencedor, the DP Ganhador, the DP Champion and lower cost of credit from the improved quality of the portfolio. the Super Poupança Ídolos with very attractive returns, within a strategy of differentiating Santander from its rivals. The evolution was also very positive in Nordic countries (+69.6% in attributable profit) and the UK (doubled), albeit from low Risks and recoveries continued to be actively managed, in line bases. In both cases the better results were due to greater with the cycle of deterioration in credit quality indicators. This activity and lower provisions. management enabled Santander Totta to maintain better ratios than the system’s, according to the latest available figures. In other countries, Spain’s performance was still weak, reflected in lower revenues, which the area is offsetting with lower costs Throughout 2010, Santander Totta again received some of the and provisions clearly below those of 2009 (-29.3%) due to the main prizes, such as Best Bank in Portugal from Global Finance, better credit quality. Lastly, the business volume in Poland after Euromoney and The Banker. The prizes singled out various the integration of AIG Bank was larger (in December EUR 3,300 aspects related to growth, profitability, efficiency, solvency, cost million in loans and EUR 1,000 million in deposits). control and risks in a complicated environment. Activity The main development was the 45% growth in deposits which, NPL RATIO NPL COVERAGE combined with the 7% fall in lending, produced a big % % improvement in the loan / deposit ratio (from 216% to 139%) and in the financing structure of the balance sheet, key elements in an environment of significant restrictions in financing in international markets. 128 5.39 4.95 The evolution of funds reflected the intense activity of 97 campaigns under a strategy focused on capturing deposits. They increased, largely due to time deposits, while mutual and pension funds declined 16%. Gross lending amounted to EUR 30,634 million. Its main components were mortgages to individuals (EUR 16,452 million) 2009 2010 2009 2010 ANNUAL REPORT 2010 117
  • 120.
    ACTIVITY LOANS / DEPOSITS NET OPERATING INC. ATTRIBUTABLE PROFIT % variation 2010 / 2009 % Million euros -10.4% Million euros -14.2% +45.4 216 726 650 531 456 139 -6.8 Loans Deposits 2009 2010 2009 2010 2009 2010 and loans to SMEs (EUR 9,481 million). The most problematic The efficiency ratio was 45.4% and net operating income balances – those related to construction and real estate 10.4% lower at EUR 650 million. development – only amounted to EUR 1,169 million (less than 4% of total lending). Loan-loss provisions increased 20.8% to EUR 110 million, reflecting a prudent policy of adjusting to the economic cycle Total lending was 7% lower, due to a 10% reduction in balances with higher NPL ratios. The ratio of Santander Totta inched up with the construction and real estate development sectors and to 2.90% and coverage was 60%. to large companies, a segment where there has been a shift from lending to financing via issues of securities. Mortgages and On a like-for-like basis (i.e. local criteria), Santander Totta’s balances with small firms rose a little. performance was better than the sector’s and its NPL ratios lower, according to the latest available figures. Lastly, its investment in Portuguese bonds, as part of its ordinary management of assets and liabilities, amounted to EUR 2,364 Profit before tax was EUR 560 million, 12.9% lower. Attributable million at the end of 2010. profit was EUR 456 million, down 14.2%. Results Net interest income was 8.7% lower at EUR 724 million, due to the reduced business volumes, the strong competition for deposits and the higher cost of financing. Moreover, in 2009 net interest income benefited from results relating not only to the lag between the evolution of Euribor and the repricing of loans, but also to results obtained in hedging the sensitivity of the net interest margin. NPL RATIO NPL COVERAGE Net fee income increased 3.9% to EUR 357 million, due to the % % increase from credit cards, mutual funds, asset management, insurance and GBM. Gains on financial transactions dropped 2.90 17.3% to EUR 67 million. 2.27 65 Income accounted for by the equity method was lower and 60 revenue from insurance was higher at EUR 37 million. Gross income declined 6.2% to EUR 1,190 million. Rigorous control of operating expenses continued to be a strategic priority, and particularly important at a time of weaker revenues. Costs evolved better than the sector (-0.3% in general expenses 2009 2010 2009 2010 and -2.4% in amortisations) 118 ANNUAL REPORT 2010
  • 121.
    REST OF EUROPE Therest of businesses in this geographic area (GBM, asset management, insurance and Banif) generated attributable profit of EUR 957 million, 15.2% lower than in 2009 (-10.9% excluding the impact of the Bank of Spain’s Circular). The attributable profit of Global Wholesale Banking, the main unit included here (95% of total profits), dropped 9.0% to EUR 914 million. Gross income was stable, which was noteworthy given that the first half of 2009 was exceptional, given the market conditions. 2009 was a record year in revenues and profits. Costs increased because of investments made to consolidate positions attained in 2009 in target businesses. Provisions increased because of the environment, the reduced use of generic provisions and the impact of the Bank of Spain’s Circular. The attributable Profit of Asset Management and insurance was 4.2% lower, in line with gross income performance. The latter was 4.6% lower due to the net of two factors. On the one hand, lower fee income from the decline in management of mutual and pension funds, under the Group’s strategy in developed countries, which gave priority to liquidity, and customers’ preference for attractive offers in deposits. And, on the other hand, higher revenues from insurance. ANNUAL REPORT 2010 119
  • 122.
    UNITED KINGDOM Million euros Variation 2010 2009 Amount % INCOME STATEMENT Net interest income 4,431 3,934 497 12.6 Net fees 957 993 (36) (3.6) Gains (losses) on financial transactions 465 506 (41) (8.2) Other operating income (1) 29 27 2 5.8 Gross income 5,882 5,460 422 7.7 Operating expenses (2,315) (2,229) (85) 3.8 General administrative expenses (2,029) (1,997) (32) 1.6 Personnel (1,209) (1,170) (40) 3.4 Other general administrative expenses (819) (827) 8 (0.9) Depreciation and amortisation (286) (233) (53) 22.7 Net operating income 3,567 3,231 337 10.4 Net loan-loss provisions (760) (881) 121 (13.8) Other income (85) 17 (103) — Profit before taxes 2,722 2,367 355 15.0 Tax on profit (737) (641) (96) 15.0 Profit from continuing operations 1,985 1,726 259 15.0 Net profit from discontinued operations — — — — Consolidated profit 1,985 1,726 259 15.0 Minority interests 0 0 0 — Attributable profit to the Group 1,985 1,726 259 15.0 BALANCE SHEET Customer loans (2) 233,856 227,713 6,144 2.7 Trading portfolio (w/o loans) 45,187 41,245 3,941 9.6 Available-for-sale financial assets 204 897 (693) (77.3) Due from credit institutions (2) 29,137 28,745 392 1.4 Intangible assets and property and equipment 2,323 1,424 899 63.1 Other assets 42,063 24,522 17,540 71.5 Total assets/liabilities & shareholders' equity 352,769 324,546 28,223 8.7 Customer deposits (2) 184,548 166,607 17,941 10.8 Marketable debt securities (2) 64,326 58,611 5,714 9.7 Subordinated debt (2) 8,143 8,577 (433) (5.1) Insurance liabilities 1 3 (2) (64.4) Due to credit institutions (2) 54,159 57,879 (3,721) (6.4) Other liabilities 29,831 26,946 2,885 10.7 Shareholders' equity (3) 11,762 5,923 5,838 98.6 Other customer funds under management 14,369 10,937 3,432 31.4 Mutual funds 14,369 10,937 3,432 31.4 Pension funds — — — — Managed portfolios — — — — Savings-insurance policies — — — — Customer funds under management 271,386 244,731 26,655 10.9 (1).- Including dividends, income from equity-accounted method and other operating income/expenses (2).- Including all on-balance sheet balances for this item (3).- Not including profit of the year 120 ANNUAL REPORT 2010
  • 123.
    ACTIVITY LOANS / DEPOSITS UNITED KINGDOM % variation 2010 / 2009 (sterling) % • Double-digit growth in profits for the sixth straight year. • Larger number of products and services offered: market +7.4 share gains in mortgages and loans to SMEs. 137 • Further improvement in the efficiency ratio (39.4%): better than the competitors in the UK. +3.8 • The non-performing loan ratio performed better than the market. 127 • Change of brand completed in 2010 and agreement reached to acquire 318 RBS branches and 40 corporate centres. Loans* Deposits 2009 2010 • Best Bank in the UK prize from The Banker and Euromoney (*) w/o REPOs Santander UK generated an attributable profit of EUR 1,985 Among the measures to achieve this was the agreement in million, 15.0% higher than in 2009. In sterling, the profit was August with the Royal Bank of Scotland (RBS) to acquire 311 of £1,701 million (+10.7%, the sixth straight year of double digit its branches in England and Wales and seven of NatWest in growth). Scotland, as well as 40 banking centres for SMEs, four company banking centres and three private banking centres. This Economic environment agreement is another important strategic step for Santander UK, GDP growth for the whole year was 1.4%, a trend which is as it increases its distribution and cross-selling capacity and likely to be maintained in the coming quarters. Inflation was accelerates business growth in the segment of SMEs. 3.7%, partly due to the rise in indirect taxes and sterling’s slide. In this context, the Bank of England held its base rate at 0.5%. Lastly, as envisaged, brand unification was completed in 2010. The Group now operates in the UK with 1,416 Santander brand Retail lending for the sector remained almost unchanged (+1%) branches. with lending to companies declining 4-5%. Customer deposits grew at a slower pace to end the year at 3%. Activity All figures are in sterling, and as with the other segments, Strategy figures have been restated according to the criteria on page 108 Thanks to the developments of recent years, Santander UK has of this report. This means that the figures given below may not attained significant market shares in core segments such as coincide with those published by Santander UK on the basis of mortgages (13.9%), deposits (10.2%) and current accounts local criteria. (9.2%). The main components of lending are residential mortgages The strategy in 2010 focused mainly on strengthening the (85% of total loans), personal loans (2%) and credits to relationship with customers via greater linkage, increasing the companies (13%, with SMEs accounting for 4%). The portfolio range of products and services with special offers for existing of mortgages is high quality, as there is no exposure to self- customers, including: certified mortgages or subprime and buy-to-let loans account for less than 1%. • The Loyalty Tracker Bond, which provides customers with one of the best interest rates. More than £1,300 million of deposits were captured since the launch in August 2010. • The Santander Zero Account, which is free of certain services commissions and on account overdrafts for customers with a NET OPERATING INC. ATTRIBUTABLE PROFIT mortgage, an investment product or whose main current Million euros +10.4%* Million euros +15.0%* account is with Santander UK. More than 194,000 accounts were opened since the launch in January 2010. 3,567 3,231 • Exemption of the 3% transfer commission in the Zero Credit 1,985 Card for customers with a mortgage or a current account. 1,726 • Free access to the close to 4,300 ATMs of the Santander Branch Network in Spain for all Santander UK customers. We continued to work to make Santander UK a universal bank offering all types of services and products. 2009 2010 2009 2010 (*) In sterling: +6.3% (*) In sterling: +10.7% ANNUAL REPORT 2010 121
  • 124.
    Furthermore, the structureof the balance sheet has improved in In Retail Banking, there was a positive impact from greater recent years, both from the standpoint of the loan/deposits ratio retention of mortgages and customers’ preference for variable (+ 10 p.p. in 2010) as well as exiting from non-strategic assets, rate mortgages. In addition, growth in bank account liability which is commented on later. balances and hedging strategies helped to reduce the impact of lower interest rates on deposits. In SMEs and corporations, Loans to customers (local criteria) amounted to £195,431 prudent management of spreads and growth in loans and million at the end of 2010, 3% more than in 2009, due to 3% deposits, also helped to lift net interest income. growth in residential mortgages and 26% in loans to SMEs. Net fee income was lower than in 2009, in line with the market Gross mortgages granted in 2010 amounted to £24,200 million, trend in the UK. In retail business, revenue was reduced by the 8% less than in 2009 and reflecting the lower activity, while the lower cancellation of mortgages and the policy of reducing market share of 18% was in line with that in 2009. The focus on UPLs. The change in the mix from structured products to providing loans to low risk customers continued. The loan-to- managed customer funds also continued, reducing current value (LTV) of the stock remained unchanged at 51%. revenues but producing higher fees in the future. A share of new loans above that corresponding to that of our Gains on financial transactions declined 11.6%, as the market branch network, combined with a good rate of retention, situation in 2009 was not repeated in 2010 and there were produced a further improvement in the share of the stock of losses in the sale of the portfolio of Alliance & Leicester, which mortgages (from 13.5% to 13.9%). has been discontinued. Santander UK continued to boost lending to SMEs via its Operating expenses were virtually flat in 2010 (-0.1%). The network of regional business centres. The stock of these loans savings obtained from the integration of Alliance & Leicester reached £8,500 million (market share of 3.6%, +0.9 p.p. since were reinvested in growth in Corporate Banking and Global the end of 2009). Banking & Markets. On the other hand, under the policy of reducing UPLs pursued The goal of achieving £180 million of cost savings from over the last few years, the volume of these loans was 24% synergies from the acquisition of A&L for 2011 remains lower than in 2009 at £3,300 million. unchanged. We continued to eliminate overlapping in back office and support functions in all businesses. By the end of The non-performing loan ratio ended 2010 at 1.76%, 0.11 p.p. 2010, over 90% of the target had been met. less than in March 2010 as of when it declined. The stock of foreclosed properties remained very low at 0.05% of the total Loan-loss provisions were 17.0% lower than in 2009, thanks to portfolio. The evolution, in general, was better than the sector, the better evolution of retail products, mainly mortgages, which according to the Council of Mortgage Lenders (CML). enabled high coverage levels to be maintained. Santander UK continued to dispose of non-strategic assets (-21% The combined effect of higher revenues, stable costs and lower since 2009 and -37% since 2008). A&L’s treasury portfolio provisions was a 15.0% rise in net operating income after dropped by £10,000 million since the end of 2008 (-66%), provisions. This did not fully feed through to attributable profit £4,500 million of it in 2010. because of the establishment, in the fourth quarter, of a £74 million provision for possible contingencies. Retail deposits increased 7% to £153,500 million, with a net inflow of £9,600 million during 2010 and backed by all business areas. The opening of more than 450,000 current accounts in the second half of 2010 brought the total number close to one million for the year, similar to that in 2009. The sale of credit cards was also good. The number reached 435,000 (+13%), with the focus on existing customers. Results Santander UK continued to perform well, spurred by revenue NPL RATIO NPL COVERAGE % % growth, strict control of costs and lower needs for provisions. Profit was 10.7% higher at EUR 1,985 million (£1,701 million). Gross income increased to EUR 5,041 million, strongly fuelled by 1.76 1.71 net interest income (+8.5%). 46 44 The increase in net interest income reflects the balanced growth of loans and deposits. The higher spread on loans was partly offset by the higher cost of the deposit capturing campaign. Moreover, the increased cost of funds and of liquid assets, stemming from the new liquidity requirements, mainly in the second half of the year, partly offset the strength of the core 2009 2010 2009 2010 activity adding pressure to the net interest income which will continue in 2011. 122 ANNUAL REPORT 2010
  • 125.
    LATIN AMERICA Million euros Variation 2010 2009 Amount % INCOME STATEMENT Net interest income 14,778 11,959 2,820 23.6 Net fees 4,661 3,925 736 18.7 Gains (losses) on financial transactions 1,410 1,663 (253) (15.2) Other operating income (1) (74) 121 (195) — Gross income 20,776 17,668 3,108 17.6 Operating expenses (7,971) (6,597) (1,373) 20.8 General administrative expenses (7,193) (6,032) (1,161) 19.3 Personnel (3,955) (3,210) (745) 23.2 Other general administrative expenses (3,238) (2,822) (416) 14.7 Depreciation and amortisation (778) (566) (212) 37.5 Net operating income 12,805 11,071 1,734 15.7 Net loan-loss provisions (4,687) (4,970) 283 (5.7) Other income (747) (673) (74) 11.0 Profit before taxes 7,371 5,428 1,943 35.8 Tax on profit (1,717) (1,257) (460) 36.6 Profit from continuing operations 5,654 4,171 1,483 35.6 Net profit from discontinued operations — 90 (90) (100.0) Consolidated profit 5,654 4,261 1,393 32.7 Minority interests 850 428 422 98.5 Attributable profit to the Group 4,804 3,833 971 25.3 BALANCE SHEET Customer loans (2) 127,268 97,901 29,367 30.0 Trading portfolio (w/o loans) 31,580 22,521 9,059 40.2 Available-for-sale financial assets 30,697 29,154 1,543 5.3 Due from credit institutions (2) 21,632 22,146 (515) (2.3) Intangible assets and property and equipment 4,880 3,926 954 24.3 Other assets 57,186 38,105 19,082 50.1 Total assets/liabilities & shareholders' equity 273,243 213,753 59,490 27.8 Customer deposits (2) 137,848 108,122 29,726 27.5 Marketable debt securities (2) 15,376 8,411 6,964 82.8 Subordinated debt (2) 5,683 4,888 794 16.3 Insurance liabilities 9,515 6,627 2,888 43.6 Due to credit institutions (2) 38,026 32,765 5,262 16.1 Other liabilities 45,989 34,994 10,996 31.4 Shareholders' equity (3) 20,805 17,946 2,859 15.9 Other customer funds under management 77,180 62,759 14,421 23.0 Mutual funds 61,621 49,681 11,940 24.0 Pension funds — — — — Managed portfolios 14,800 12,538 2,262 18.0 Savings-insurance policies 758 540 218 40.4 Customer funds under management 236,087 184,181 51,906 28.2 (1).- Including dividends, income from equity-accounted method and other operating income/expenses (2).- Including all on-balance sheet balances for this item (3).- Not including profit of the year ANNUAL REPORT 2010 123
  • 126.
    NET OPERATING INC. ATTRIBUTABLE PROFIT LATIN AMERICA Million euros +15.7%* Million euros +25.3%* • Strong business, reflected in a faster pace of activity, 12,805 particularly in lending. 11,071 4,804 • Control of expenses, whose growth was below that of inflation. 3,833 • Intense management of early bad loans and of their recovery, reflected in a notable decline in loan-loss provisions. • On a like-for-like basis, attributable profit was 17.0% higher in local currency. 2009 2010 2009 2010 • Best bank in the region by The Banker and Euromoney. (*) Excluding exchange rate impact: -0.6% (*) Excluding exchange rate impact: +10.5% Santander generated attributable profit of EUR 4,804 million, The global economic recovery, and in particular the dynamism 25.3% more than in 2009 (+10.5% excluding the exchange-rate of Asian economies, is fuelling Latin American exports. The impact). On a like-for-like basis, excluding the business in trade surplus was more than 1% of GDP. The current account Venezuela sold in 2009 and the impact of higher minority deficit, which had dropped sharply in 2009, widened in 2010 interests (net of the placement of Santander Brazil shares in but at 1.5% of GDP was comfortably financed by direct 2009 and the acquisition of the minority interests of Santander investment flows (+27%). Mexico in September 2010), profit from continued operations increased 35.6% (+17.0% excluding the exchange rate impact). In the current context of abundant global liquidity, Latin America has become one of the preferred destinies for The trends in 2010 were upward quarter after quarter in all investors. Comfortable current account positions and significant items of the income statement and there was a notable pick up inflows of capital are strengthening the region’s currencies in in lending in almost all countries. nominal terms and producing a build up of international reserves, which have already topped $560,000 million. Economic environment After showing in 2008 and 2009 a considerable resistance to the The evolution of public accounts is also good, spurred by external shocks emanating from the difficult economic growth in tax revenues. The budgets for 2011 aim to further environment, Latin American economies registered a solid recovery improve the situation and reduce the level of public debt, in 2010. Average GDP growth was around 6.5%. This growth was although it is already low (around 30% of GDP on average). increasingly due to domestic demand, particularly investment and private consumption, which are replacing the drive from restocking In the countries where Santander operates, banking business is and from the fiscal and monetary policies in 2009. picking up (+16% excluding Puerto Rico). Lending by the region’s banking systems increased 19% excluding the forex Inflation remained moderate at close to 5% on average, impact. Loans to individuals rose 21% (cards: +10%; consumer although in some countries inflationary pressures were in credits: +19% and mortgages: +29%), while loans to companies evidence and central banks took measures to counter them. and institutions rose 18%. Interest rates began to rise in Chile, Brazil and Peru, by 275 b.p., 200 b.p. and 175 b.p. respectively, while in Mexico and Savings maintained their growth (+15%), rising more quickly in Colombia, where inflation was moderate, monetary stimuluses the second half after the deceleration in 2009. In general terms, have not yet begun to be withdrawn. and considering the financial systems with the greatest weight, Brazil grew the most and Chile more moderately. LATIN AMERICA. INCOME STATEMENT Million euros Gross Net operating Attributable income income profit to the Group 2010 Var (%) 2010 Var (%) 2010 Var (%) Brazil 14,352 22.7 9,037 22.5 2,836 30.9 Mexico 2,380 1.6 1,458 (5.5) 682 37.9 Chile 2,048 14.4 1,311 9.7 683 21.3 Puerto Rico 363 8.9 186 12.5 38 13.2 Colombia 187 17.3 75 11.3 41 24.1 Argentina 827 16.4 454 8.9 297 31.5 Uruguay 169 17.4 76 14.4 67 30.3 Rest 167 (15.3) 46 (29.9) 21 (80.7) Subtotal 20,493 17.9 12,643 16.0 4,665 26.9 Santander Private Banking 283 (2.5) 162 (7.2) 139 (10.7) Total 20,776 17.6 12,805 15.7 4,804 25.3 124 ANNUAL REPORT 2010
  • 127.
    Because of theirimpact on business and on converting figures Main focuses of management in 2010 into euros, the evolution of interest rates and exchange rates is commented on: 1 Management by type of customer, with greater emphasis on linkage via transactions, particularly with companies – Average short-term interest rates, based on the region’s and institutions. average weighted rate, fell between 2009 and 2010, although they increased in some countries as of the second 2 Focus on greater linkage of high and medium income half of 2010. customers and payrolls. – The evolution of results in euros is affected by average 3 Greater emphasis on growth in savings and maintaining exchange rates. In global terms, Latin American currencies high levels of liquidity. appreciated against the dollar, while the dollar, the reference currency in Latin America, strengthened 5% against the euro. 4 Consolidation of the policy of integral management of The Brazilian real strengthened against the euro on average customer lending in all its phases (admission, from 2.76 to 2.33, the Mexican peso from 18.8 to 16.7 and management, monitoring and recovery). the Chilean peso from 775 to 674. 5 Selective growth in lending, with particular attention on Strategy consumer credit and maximising the profitability of The return to a more favourable economic environment in the shareholders’ equity. region energised the financial systems. In this context, the Group reacted agilely, stepping up activity and, consequently, 6 Strengthen service strategies and multichannel distribution the generation of gross income through management of in order to improve productivity and the quality of service. spreads and development of fee-generating businesses. At the same time, the Group’s basic values were preserved, such as 7 Strict control of costs and investments. prudence in granting loans, strong recovery activity and efficiency in costs. 8 Integration in Brazil. In Brazil, Banco Real’s integration into the Group and the IPO of Santander Brazil in the second half of 2009, in order to finance its strategic plan, gave the strategy in this country some distinguishing features. Results Net interest income increased 6.2%, due to greater volumes, At the end of 2010, the Group had 5,882 traditional branches the change of mix toward lower risk products and defending and points of banking attention and 27,550 ATMs. spreads in an environment of lower interest rates than in 2009. The number of customers increased by 2.7 million to 40.3 Net fee income rose 3.1%, driven by that from insurance activity million. The Group is placing more emphasis on linking (+18%), mutual funds (+14%), cards (+10%), cash management customers than capturing them. (+8%) and foreign trade (+7%). On the other hand, income from the administration of accounts was lower. Also, there was The Group continued to receive some of the main prizes a negative impact from regulatory changes. awarded to banks in the region. Revenue from banking activity increased 5.1%. The main developments in business and results in 2010 are set out below. All percentage changes exclude the exchange-rate Gains on financial transactions dropped 27.0%, largely due to impact. large capital gains in securities portfolios in 2009 that were not repeated in 2010. Activity The year-on-year pace of lending accelerated as of the beginning of the year and growth ended at 15%. Cards LOANS SAVINGS (excluding Mexico) grew 28%, commercial bills (companies in all % y-o-y variation w/o forex impact % y-o-y variation w/o forex impact their range and institutions) 19%, mortgages 14% and consumer credit 13%. Loans to individuals increased 14%, those +14.7 to SMEs 17% and to companies overall 25%. +8.1 Savings (deposits excluding repos + mutual funds) increased 8%. Demand deposits grew 16%, mutual funds 9% and time deposits barely 1%. -2.5 The market shares in the countries where we operate are 11.4% -10.4 in loans, 10.0% in deposits and 9.8% for total banking business. 2009 2010 2009 2010 ANNUAL REPORT 2010 125
  • 128.
    Operating expenses rose4.5%. In Brazil, Mexico, Colombia, Net operating income after provisions increased 14.8%, Uruguay and Puerto Rico, costs grew in line with or below their profit from continued operations 17.0% and attributable respective inflation rates. In Argentina, they increased 26.9% profit 10.5%, the latter as a result of the sale of Banco de due to the renegotiation of the collective bargaining agreement Venezuela and the negative net impact of higher minority (+23%) in a context of significant growth in inflation. In Chile, interests. the impact of the earthquake and the signing of a collective agreement produced an increase of 7.8%. By segments and excluding both impacts, Retail Banking’s attributable profit was 32.8% higher, Wholesale Banking’s The efficiency ratio remained at around 38%. declined 8.5%, notably influenced by a very good results in 2009, and Asset Management and Insurance’s rose 9.5%. The better macroeconomic environment and outlook, together with active risk management and a notable improvement in risk premiums (from 4.8% in 2009 to 3.6% in 2010), is beginning to be reflected in provisions (-19.5%). The NPL ratio declined 14 b.p., from 4.25% to 4.11%, while coverage was stable at 104%. NET INTEREST INCOME / NET OPERATING INC. + NPL RATIO NPL COVERAGE PROVISIONS AFTER LLPs 33.1%* % % % o/ ATAs Million euros 4.25 5.77 4.11 8,118 5.72 105 Net interest 104 income 3.34 6,101 3.94 2.38 Provisions 1.83 2009 2010 2009 2010 2009 2010 2009 2010 (*) Excluding exchange rate impact : +14.8% RECOGNITION AS THE BEST BANK IN THE PRIZES AWARDED DURING 2010 The Banker Euromoney Global Finance Region ⎷ ⎷ Mexico ⎷ Chile ⎷ ⎷ Argentina ⎷ ⎷ Uruguay ⎷ ⎷ ⎷ Puerto Rico ⎷ 126 ANNUAL REPORT 2010
  • 129.
    LATIN AMERICA. MAINUNITS Million euros Brazil Mexico Chile 2010 Var (%) 2010 Var (%) 2010 Var (%) INCOME STATEMENT Net interest income 10,490 27.7 1,638 7.7 1,514 27.3 Net fees 3,001 20.7 568 11.5 411 15.4 Gains (losses) on financial transactions 975 7.4 177 (46.6) 90 (57.3) Other operating income (1) (114) — (3) (83.3) 33 (3.3) Gross income 14,352 22.7 2,380 1.6 2,048 14.4 Operating expenses (5,316) 22.9 (922) 15.2 (737) 24.0 General administrative expenses (4,807) 20.9 (815) 14.2 (651) 23.6 Personnel (2,592) 27.0 (430) 12.0 (409) 27.5 Other general administrative expenses (2,215) 14.4 (385) 16.7 (242) 17.6 Depreciation and amortisation (509) 45.9 (107) 23.6 (85) 27.1 Net operating income 9,037 22.5 1,458 (5.5) 1,311 9.7 Net loan-loss provisions (3,709) 5.3 (469) (38.9) (323) (22.7) Other income (746) 13.4 (29) 14.5 31 (11.2) Profit before taxes 4,582 43.4 960 28.1 1,019 25.4 Tax on profit (1,207) 33.0 (148) 57.1 (159) 40.4 Profit from continuing operations 3,375 47.5 812 23.9 860 22.9 Net profit from discontinued operations — — — — — — Consolidated profit 3,375 47.5 812 23.9 860 22.9 Minority interests 539 345.4 130 (19.2) 177 29.9 Attributable profit to the Group 2,836 30.9 682 37.9 683 21.3 BALANCE SHEET Customer loans (2) 71,027 31.7 15,156 31.9 25,732 32.8 Trading portfolio (w/o loans) 11,529 42.9 13,004 43.6 3,532 40.8 Available-for-sale financial assets 21,257 12.6 3,716 (8.0) 2,825 0.3 Due from credit institutions (2) 10,863 (4.4) 4,478 (14.0) 2,349 (7.2) Intangible assets and property and equipment 3,813 29.2 401 9.3 374 6.4 Other assets 41,775 73.4 4,394 20.3 3,987 51.6 Total assets/liabilities & shareholders' equity 160,264 34.4 41,148 21.7 38,799 28.4 Customer deposits (2) 75,669 27.7 21,144 33.2 18,108 23.8 Marketable debt securities (2) 9,164 99.8 363 (13.2) 5,590 75.6 Subordinated debt (2) 4,372 13.9 — (100.0) 1,100 35.3 Insurance liabilities 8,857 43.3 303 34.0 332 67.7 Due to credit institutions (2) 24,211 79.8 7,489 (14.3) 5,555 (11.2) Other liabilities 26,384 24.0 7,858 29.0 5,926 71.6 Shareholders' equity (3) 11,608 8.9 3,991 66.1 2,187 29.6 Other customer funds under management 48,727 28.3 10,114 22.8 5,875 10.3 Mutual funds 43,942 27.3 10,005 22.8 5,806 9.8 Pension funds — — — — — — Managed portfolios 4,205 38.6 — — — — Savings-insurance policies 580 40.1 109 25.1 69 78.3 Customer funds under management 137,931 30.5 31,622 28.6 30,674 28.1 (1).- Including dividends, income from equity-accounted method and other operating income/expenses (2).- Including all on-balance sheet balances for this item (3).- Not including profit of the year ANNUAL REPORT 2010 127
  • 130.
    NET OPERATING INC. ATTRIBUTABLE PROFIT BRAZIL Million euros +22.5%* Million euros +30.9%* • Lending continued to grow and ended the year at double 9,037 digits. 2,836 • Revenues: new record of net interest income (which rose 7,376 for the twelfth straight quarter) and fee income. • Expenses: rise slower than that of inflation. 2,167 • Loan-loss provisions: lower thanks to improved performance of NPLs. • Net operating income after provisions was 16.6% higher and profit before minority interests increased 24.4%. 2009 2010 2009 2010 (*) Excluding exchange rate impact: +3.3% (*) Excluding exchange rate impact: +10.4% Grupo Santander in Brazil generated attributable profit of EUR Strategy 2,836 million, 30.9% more than in 2009 (+10.4% in local The Santander Brazil plan centres on the integration process, currency). On a like-for-like basis, excluding minority interests, which since the onset has been focused on improving the the increase was 24.4% in local currency. operational and commercial practices, extracting the best from each bank, pursuing greater efficiency and capturing synergies. Santander Brazil is the third largest private sector bank in terms of assets, with a market share of 9%. It operates in the main The new products included the Conta Integrada for shops and regions, with 3,702 branches and points of banking attention, companies, Santander bonds to capture funds in the domestic 18,312 ATMs and 24.7 million customers, of whom 10 million market and provide greater stability to balance sheets by have current accounts. extending maturities, and the launch of three cards, Santander Elite Premium, Santander Style Platinum and Santander Economic environment Ferrari. Various alliances were also forged, such as GetNet to The economy continued to grow on a sustained basis. Growth strengthen business with companies and the creation of for the whole year was around 7.5%. This was a substantial Credlmob21 with Century21 to supply mortgages. improvement over 2009 (-0.6%). Further progress was made in integrating the platform of credit This improvement was due to the greater confidence of cards, in insurance, in the training of the network’s teams and businessmen and consumers, the significant reduction of the unification of the brand was completed, with incorporation of unemployment rate, already at minimum levels. It was 5.3% at the Santander brand to branches, points of banking attention, the end of 2010, down from an average of 9.4% for the mini-branches, electronic service points, points of public previous five years and to the improved conditions in the credit attention and kiosks of the Real brand. Finally, the retail market. networks were integrated. Inflation was 5.6%, above the central bank’s target of 4.5%. Lastly, Santander Brazil became a reference bank in corporate The key Selic rate ended 2010 at 10.75% (+200 b.p.). The governance in the country, as it is the only large private sector Monetary Policy Committee in 2011 raised it to 11.75% bank to attain level 2 in this sphere from BM&FBOVESPA. Since because of inflationary pressures. the end of 2009 the bank has been consolidating its management in order to create and improve its corporate Total lending in Brazil grew at a faster pace. It increased 20.5% governance mechanisms and guarantee the principles of (+21.5% state banks). State banks’ share of lending was transparency, equity, rendition of accounts and corporate social 41.9%, followed by private sector Brazilian banks (40.7%) and responsibility. foreign banks (17.4%). Activity Loans to individuals (33% of the total) grew 19%, spurred by As in the rest of the segments, Brazil’s figures have been credits linked to the depositing of payroll cheques in accounts restated in accordance with the criteria set out on page 108 of and auto finance, that to companies (33% of the total) rose this report. This means that the figures here do not coincide 15% and directed credit (including BNDES, rural and housing, with those published locally. 34%) continued to grow at a faster pace than to the rest of segments (+27%). Both lending and savings grew strongly. Lending began the year with negative growth and then gradually picked up and ended Savings, including mutual and pension funds, increased 16%. 2010 up 16% and with significant rises in all segments. Growth Mutual funds rose 17%, followed by demand deposits + was largely due to the 22% rise in loans to businesses and savings (+16%) and time deposits (+14%). companies and the 18% rise to individuals (+27% in mortgages and cards). Lending to large companies increased 9%. On the funding side, demand deposits grew 16% and mutual 128 ANNUAL REPORT 2010
  • 131.
    LOANS LOANS, BREAKDOWN SAVINGS SAVINGS, BREAKDOWN % y-o-y variation w/o forex impact % var. 2010 / 2009 w/o forex impact % y-o-y variation w/o forex impact % var. 2010 / 2009 w/o forex impact +15.5 +16.3 +6.5 +22.3 +12.4 +18.1 +8.9 +8.8 -0.3 -5.0 -6.8 2009 2010 Individuals Consumer Businesses Corporate 2009 2010 Demand Time Mutual Finance +companies +GBM funds funds 12%. Time deposits, on the other hand, under a policy +2.0%), clearly below the inflation rate. This evolution was based on the environment for rises in interest rates in 2010 and compatible with the opening of 109 points of customer reduction in institutional balances of very low return, declined attention and the hiring of more employees, as the synergies 7%. Overall, savings increased 6%. obtained (BRL 1,862 million) were higher than forecast (BRL 1,600 million). The bank’s market share in loans is 10.8% (11.5% for unrestricted lending) and 8.8% in deposits. Provisions for loan losses were 11.2% lower than in 2009, due to the improvement in the risk premium and in the NPL ratio. Results The ratio dropped from 5.27% to 4.91%, while coverage As regards results, (and always in local currency) the main increased to 101%. component of growth was net interest income (+7.7%), which has risen every quarter for the last three years. The Profit before minority interests was EUR 3,375 million, 24.4% trend of fee income was also good. Excluding regulatory more than in 2009 in local currency. changes, it rose 6%, fuelled by revenue from credit cards, insurance and mutual funds, which registered double-digit Attributable profit, after higher minority interests (EUR 539 growth. million compared with EUR 121 million in 2009) because of the listing in the second half of 2009, was EUR 2,836 million This positive performance, however, was not fully reflected in (+10.4% in local currency and +30.9% in euros). gross income (+3.5%), due to the fall in gains on financial transactions (-9.4%), affected by greater wholesale banking Retail Banking’s profit was 34.2% higher and that of GBM was revenues in 2009 and the recording in the third quarter of the 18.9% lower because of reduced gains on financial capital gains obtained in the Visanet green shoe (EUR 95 transactions. million), which were assigned to generic provisions. The efficiency and recurrence ratios were 37.0% and 62.4%, Operating expenses increased 3.7% (personnel and general, respectively, and ROE was 23.1%. NET INTEREST INCOME / NET OPERATING INC. NPL RATIO NPL COVERAGE PROVISIONS AFTER LLPs +38.3%* % % % o/ ATAs Million euros 5.27 4.91 7.65 5,328 101 7.53 99 Net interest income 4.37 3,854 4.87 3.28 Provisions 2.66 2009 2010 2009 2010 2009 2010 2009 2010 (*) Excluding exchange rate impact: +16.6% ANNUAL REPORT 2010 129
  • 132.
    NET OPERATING INC. ATTRIBUTABLE PROFIT MEXICO Million euros -5.5%* Million euros +37.9%* • Faster growth in lending, increasing at double-digits. 1,542 1,458 682 • Basically flat costs (growth below inflation). 495 • Emphasis on integral management of risk, with lower provisions. • Net operating income after loan-loss provisions rose 13.5%, despite lower gains on financial transactions. 2009 2010 2009 2010 (*) Excluding exchange rate impact: -15.9% (*) Excluding exchange rate impact: +22.7% Attributable profit was EUR 682 million, 37.9% higher than in September, giving Santander 99.9% of the capital. Positive 2009 (+22.7% in local currency). impact on results of EUR 64 million. Santander is the third largest banking group in Mexico by Activity business volume, with a market share in loans of 13.5% and Lending began the year with negative growth rates and ended 15.1% in savings. It has 1,100 branches and 9.1 million up 15%, with a very good evolution in individuals, SMEs and customers. companies. Mortgages and loans to individuals grew 17% (especially for new homes, +107 b.p. in market share) and Economic environment consumer credit grew 9%. Lending via cards dropped 16%, The economy expanded 5.5% in 2010. Domestic demand grew partly for market reasons and partly due to applying very 6.1%, thanks to the recovery in private consumption and rigorous criteria. investment in fixed capital and in building up stocks, while exports continued to grow in real terms at high rates. Savings increased 14%, with demand and time deposits growing 20% and 16%, respectively, and mutual funds 7%. Job creation is a very important factor in this evolution (close to 732,000 created). Results In results (local currency), gross income declined 9.6%, strongly Inflation rose in the last months to 4.4% in December, although impacted by gains on financial transactions which were half it was still within the central bank’s range. After the inflation those in 2009 when there were significant capital gains in the spike brought on mainly by food and energy prices, the rate securities portfolios. eased in January 2011 to 3.8% and is expected to come down to around 3.5%. In this context, the Bank of Mexico is expected Net interest income was 4.2% lower, in line with growth more to keep its key rate stable for most of 2011. tilted toward products and segments with lower spreads (sharp reduction in the last few years in volumes related to cards), but Growth in banking business recovered in 2010. Lending rose 7% (consumer and cards: +2%) and savings 15%. Strategy The strategy centred on accelerating business dynamics and revenue generation, as well as continuing to deepen the already established priorities: strengthen the franchise via greater relations with customers and more transactions, and bolster integral management of risk, particularly in recovering loans in LOANS SAVINGS an irregular situation. % y-o-y variation w/o forex impact % y-o-y variation w/o forex impact +15.4 New products and services were offered in 2010 for particularly attractive segments such as high-income customers. Of note was the success in insurance. The bank’s mission is not only to +13.9 extend “bankarisation” but also the idea of “protection”. In accordance with this strategy, the Group significantly increased the number of linked customers, while recovery of +1.8 bad loans continued to be a priority in all segments. -11.2 The agreement with Bank of America to acquire its stake of 24.9% in Santander Mexico for $2,500 million materialised in 2009 2010 2009 2010 130 ANNUAL REPORT 2010
  • 133.
    NET INTEREST INCOME/ NET OPERATING INC. PROVISIONS AFTER LLPs +27.7%* CHILE % o/ ATAs Million euros • Double-digit growth in loans, after negative rates in 4.05 4.04 Net interest 2009. income • Expenses rose because of the impact of the earthquake, 989 2.01 the signing of a collective bargaining agreement and 2.88 faster business growth. 775 2.04 • Significant decline in provisions, thanks to consolidation Provisions of the risk management model. 1.16 • Net operating income after loan-loss provisions increased 2009 2010 2009 2010 (*) Excluding exchange rate impact: +13.5% 10.4%. NET OPERATING INC. ATTRIBUTABLE PROFIT Million euros +9.7%* Million euros +21.3%* also with a lower risk premium. The stability of the key interest rate at 4.50% gave rise to a drop of 52 b.p. in the average spread on deposits and on loans of 113 b.p. 1,311 683 Fee income was 0.8% lower, still affected by the fall in card 1,196 business. Excluding this, income from other products grew 10% 563 (+32% from insurance). Operating expenses increased 2.5%, below inflation (4.4%). Net loan-loss provisions declined 45.7%, from around EUR 225 million in the first half of 2009 to almost EUR 100 million in the 2009 2010 2009 2010 second half of 2010. Net operating income after provisions (*) Excluding exchange rate impact: -4.7% (*) Excluding exchange rate impact: +5.4% increased 13.5%. Attributable profit was 22.7% higher in local currency at EUR 682 million. Retail Banking’s profit increased 29.5%, Global Attributable profit was EUR 683 million in 2010, 21.3% higher Wholesale Banking’s 11.0% and Asset Management and than in 2009 (+5.4% in local currency). Insurance’s 22.5%. Excluding the impact of the minority interests acquired, profit from continued operations was Santander is the largest financial group in Chile in terms of 10.2% higher. assets and results. Its market shares are 20.9% in loans and 17.6% in savings. It has 504 branches and 3.1 million The efficiency ratio was 38.7%, the recurrence ratio 69.7% and customers. ROE 19.5% The NPL ratio was unchanged at 1.84% and coverage an excellent 215%. Economic environment The economy, hit by the earthquake in the early part of the year, recovered strongly. GDP growth was more than 5% in the first nine months and domestic demand, also reflecting the reconstruction programmes, rose by around 16%. Both private consumption and investment in fixed capital and in stocks grew strongly. Inflation rose during the year and ended at 3.0%. NPL RATIO NPL COVERAGE The central bank took preventative action, lifting interest rates % % (+275 b.p.). Lending began to recover at the start of the year and rose 9%, fuelled by mortgages and commercial credit. Savings increased 264 215 9% (+21% in demand deposits). Strategy 1.84 1.84 Santander Chile concentrated on taking advantage of the economic recovery. It managed spreads well in an environment of interest rates at maximum levels. Issues such as strengthening customer linkage through all channels, recovery management and costs are still very much on the agenda. 2009 2010 2009 2010 ANNUAL REPORT 2010 131
  • 134.
    The number ofinsurance policies, a risk-free product and one NET INTEREST INCOME / NET OPERATING INC. generating fee income, amounted to more than 5.0 million and PROVISIONS AFTER LLPs +27.0%* consumer loans totalled more than 1 million. Payrolls, a very % o/ ATAs Million euros binding product, increased 9% and helped to enhance the 4.40 4.25 quality of the customer base and future business prospects. The Net interest income 988 number of cards reached 1.7 million. Of note was the renewal of the card co-branding alliance with LAN, Chile’s main airline, 2.76 and various new alliances, which have made Santander the clear 778 3.46 leader in the country’s means of payment market. Meanwhile, the rise in transactions and customer linkage sustained the 1.49 growth of these revenues in an adverse environment. Provisions 0.94 In addition, management of the effects of the earthquake, from 2009 2010 2009 2010 social and business standpoints, was in the centre of the (*) Excluding exchange rate impact: +10.4% strategy. Activity Stronger economic growth and the positive impact of Net fee income rose 0.3%. Of note was the 29% rise from asset reconstruction accelerated growth in lending (+14%), with all management, 28% from securities and 16% from insurance, products and segments performing well. Mortgages grew 12%, which offset the falls in administration of accounts, foreign consumer credit 17% and cards 32%, while in segments growth trade and cash management. Gains on financial transactions was more than 15% to individuals, SMEs and companies. dropped from EUR 210 million to EUR 90 million, as there were capital gains not repeated in 2010. Savings rose 2%, with demand deposits up 17%, time deposits down 2% and mutual funds down 6%. Operating expenses increased 7.8%, higher than inflation, and impacted by the earthquake and the signing of the collective The bank reached several milestones in fixed-income markets. In bargaining agreement, while provisions declined 32.8%. The April, Santander Chile was the first bank in the region to issue a rate at which they fell accelerated during the year, thanks to risk floating rate short-term note, a market reserved for high-grade management. issuers. In September, the bank placed the first ever international bond in Chilean pesos by a private company. Lastly, in December Attributable profit was 5.4% higher at EUR 683 million. Retail the bank was the first Chilean issuer to make an issue in the Banking’s profit (76% of the total in Chile) rose 14.9%, Asset Swiss market. All these bonds attained the best risk rating of a Management and Insurance’s 1.2% and Global Wholesale Latin American company (Aa3/AA-). Banking’s dropped 24.6%, due to lower gains on financial transactions. Results In results (and always in local currency), gross income slid The efficiency ratio was 36.0%, the recurrence ratio was 63.0% slightly (-0.5%), although with a differentiated performance by and ROE 30.5%. The NPL ratio was 3.74% and coverage 89%. lines. Net interest income grew 10.6%, backed by the recovery in lending and higher inflation than in 2009. Interest rates, although higher in the last part of the year, were lower than in 2009. This impacted on the spread (-78 b.p.). LOANS SAVINGS NPL RATIO NPL COVERAGE % y-o-y variation w/o forex impact % y-o-y variation w/o forex impact % % +13.6 3.74 3.20 +2.0 89 89 -3.0 -6.3 2009 2010 2009 2010 2009 2010 2009 2010 132 ANNUAL REPORT 2010
  • 135.
    ARGENTINA URUGUAY Attributable profit amounted to EUR 297 million in 2010, Attributable profit amounted to EUR 67 million in 2010, 31.5% higher than in 2009 (+31.4% in local currency). 30.3% higher than in 2009 (+10.3% in local currency). Santander Río is one of the country’s leading banks, with Santander is the largest private sector bank in the country in market shares of 9.8% in lending and 10.1% in savings. It has terms of profits, number of branches (43) and business (market 324 branches and 2.3 million customers. share of 17.1% in lending and 16.7% in deposits and mutual funds). It has 258,000 customers. The economy grew by close to 9%, driven by buoyant domestic demand. Inflation spurted in the first half to 11% The economy expanded 8.8% year-on-year in the first nine from 7.7% at the end of 2009, but in the second half it was months, one of the fastest growing in the region. Growth was stable. Interest rates remained at around 11%. fuelled by domestic demand, which rose in line with GDP, and exports (+11% in real terms). Market indicators were very positive (lower yield on bonds, 4.3% depreciation of the peso against the dollar) after the Moody’s revised Uruguay’s sovereign rating from Ba3 to Ba1, reopening of the debt exchange (adherence of 66%) and the an increase of two notches and only one away from improved sovereign rating. investment grade. The rating agency said the reason for the upward revision was the improvement in fiscal and debt The pace of growth in savings and lending in the whole indicators, combined with an outlook of continuous financial system was 27% and 35%, respectively. The quality of improvement. the balance sheet continued to improve and high levels of liquidity were maintained. Growth in the financial system’s lending and deposits was 18% and 16%, respectively. The Group’s strategy focused on taking advantage of the strengths of its commercial franchise, with greater importance The Group’s strategy focused on taking advantage of the attached to customer linkage and transaction banking and synergies from the Santander/ABN merger, fostering retail selective growth in lending, with particular attention paid to business and expanding and linking the customer base. managing the whole risk cycle and control of costs. Another element was to boost attention to the high income segment via the Van Gogh project. Lending rose 38% in local currency and savings 34%. Of note was the 42% growth in demand deposits. These increases Lending increased 23% in local currency, higher than the were higher than the market’s and produced gains in the sector and deposits rose 14%. market shares of these three items. Gross income increased 2.7%, operating expenses remained Gross income rose 16.4%, net interest income 15.2% and fee almost flat and provisions continued to be insignificant thanks income 22.3%. Operating expenses were 26.9% higher, to the bank’s exceptional credit quality. The NPL ratio was only impacted by the new collective bargaining agreement (+23%), 0.22% and the level of coverage was very high, underscoring and loan-loss provisions declined 59.0%. Attributable profit one of the bank’s strengths. was EUR 297 million, as already mentioned. Attributable profit was 10.3% higher at EUR 67 million The efficiency ratio was 45.1%, the recurrence ratio 90.6% (+30.3% in euros). and ROE 61.8%. The NPL ratio was 1.69% and coverage 149%. Both of these ratios were better than in 2009. The efficiency ratio is 55.1% and the recurrence ratio 33.6%. ACTIVITY ATTRIBUTABLE PROFIT ACTIVITY ATTRIBUTABLE PROFIT % var. 2010 / 2009 w/o forex impact Million euros +31.5%* % var. 2010 / 2009 w/o forex impact Million euros +30.3%* +37.8 297 +22.8 +33.6 67 226 +13.6 51 Loans Savings 2009 2010 Loans Savings 2009 2010 (*) Excluding exchange rate impact: +31.4% (*) Excluding exchange rate impact: +10.3% ANNUAL REPORT 2010 133
  • 136.
    COLOMBIA PUERTO RICO Attributable profit was EUR 41 million in 2010, 24.1% higher Attributable profit was 7.6% higher in dollars at EUR 38 million, than in 2009 (+4.2% in local currency). due to the 4.0% rise in basic revenues and almost flat costs and provisions. The efficiency ratio was 48.7%, the recurrence ratio The Group has 76 branches, 297,000 customers and a 2.9% 42.6%, the NPL ratio 10.6% and coverage 58%. share in lending and 2.8% in savings. Santander Puerto Rico has 121 branches, 514,000 customers The economy grew 4.1% in the first nine months year-on-year and market shares of 9.3% in loans, 10.2% in deposits and compared to zero growth in 2009. Inflation, after remaining at 22.6% in mutual funds. close to 2.5% for almost all the year, rose in December to end at 3.2%. The central bank held its key rate at 3% after cutting The economy remained in recession, affecting both the growth it by 50 b.p. in April 2010. of the financial system and its profitability. The Group concentrated on credit risk management and The bank continued to position itself as one of the three main selective growth in lending, preserving adequate levels of financial institutions in lending, deposits and mutual funds. It liquidity. It also strengthened transaction businesses and paid made further efforts to bolster recovery of loans in an irregular close attention to controlling costs. situation and grow selectively in lending to individuals and companies. Lending rose 12%, with loans to individuals increasing 26% and those to companies 18%. Savings increased 15%, with In 2010, the Group fully owned the subsidiary, following its demand deposits up 29%, mutual funds 11% and time delisting deposits only rose 4%. Basic revenues increased 7.1%, fuelled by net interest income (+6.2%) and by fee income (+9.7%). Gains on financial ACTIVITY ATTRIBUTABLE PROFIT transactions were halved because of losses in 2010 in the % var. 2010 / 2009 w/o forex impact Million euros +13.2%* derivatives portfolio. Operating expenses were 2.2% higher, below inflation, and +0.2 provisions were 27.9% lower thanks to good credit quality. 38 The NPL ratio was 1.56% and coverage 200%, both figures 33 better than in 2009. Profit before tax increased 14.8% and attributable profit only -3.0 rose 4.2%, because of the higher tax charge. Loans Savings 2009 2010 (*) Excluding exchange rate impact: +7.6% The efficiency ratio is 59.9% and the recurrence ratio 48.4%. PERU Attributable profit was EUR 7 million (EUR 4 million in 2009 ACTIVITY ATTRIBUTABLE PROFIT % var. 2010 / 2009 w/o forex impact Million euros +24.1%* and only EUR 1 million in 2008). The Peruvian economy surged 8.8%, making it one of the most dynamic in the region. The domestic drivers were the +15.2 improvement in household and business confidence, growth in lending and job creation. In this context, activity was focused +11.7 41 on companies and tending to the Group’s global customers. 33 ACTIVITY ATTRIBUTABLE PROFIT 2009 2010 % var. 2010 / 2009 w/o forex impact Million euros +72.7%* Loans Savings (*) Excluding exchange rate impact: +4.2% +69.1 +52.2 7 4 2009 2010 Loans Savings (*) Excluding exchange rate impact: +54.0% 134 ANNUAL REPORT 2010
  • 137.
    SOVEREIGN Million euros Variation 2010 2009* Amount % INCOME STATEMENT Net interest income 1,736 1,160 575 49.6 Net fees 408 380 27 7.2 Gains (losses) on financial transactions 29 13 16 124.0 Other operating income (1) (66) (91) 24 (26.9) Gross income 2,106 1,463 643 44.0 Operating expenses (937) (881) (56) 6.4 General administrative expenses (832) (766) (66) 8.6 Personnel (468) (457) (11) 2.3 Other general administrative expenses (364) (309) (55) 17.9 Depreciation and amortisation (105) (114) 10 (8.5) Net operating income 1,169 582 587 100.8 Net loan-loss provisions (510) (571) 61 (10.7) Other income (92) (58) (34) 58.5 Profit before taxes 567 (47) 614 — Tax on profit (143) 22 (165) — Profit from continuing operations 424 (25) 449 — Net profit from discontinued operations — — — — Consolidated profit 424 (25) 449 — Minority interests — — — — Attributable profit to the Group 424 (25) 449 — BALANCE SHEET Customer loans (2) 36,724 34,605 2,119 6.1 Trading portfolio (w/o loans) 211 163 48 29.3 Available-for-sale financial assets 10,203 9,568 635 6.6 Due from credit institutions (2) 722 496 226 45.7 Intangible assets and property and equipment 507 391 116 29.7 Other assets 3,430 3,568 (138) (3.9) Total assets/liabilities & shareholders' equity 51,797 48,791 3,006 6.2 Customer deposits (2) 32,007 30,888 1,119 3.6 Marketable debt securities (2) 1,945 11,236 (9,292) (82.7) Subordinated debt (2) 2,781 2,129 652 30.6 Insurance liabilities — — — — Due to credit institutions (2) 9,567 736 8,830 — Other liabilities 2,297 1,689 608 36.0 Shareholders' equity (3) 3,200 2,113 1,088 51.5 Other customer funds under management 30 327 (297) (90.9) Mutual funds — — — — Pension funds — — — — Managed portfolios 30 327 (297) (90.9) Savings-insurance policies — — — — Customer funds under management 36,763 44,581 (7,818) (17.5) (*).- Data February-December (1).- Including dividends, income from equity-accounted method and other operating income/expenses (2).- Including all on-balance sheet balances for this item (3).- Not including profit of the year ANNUAL REPORT 2010 135
  • 138.
    ATTRIBUTABLE PROFIT. QUARTERLY SOVEREIGN Million US$ 178 • The franchise’s profitability was consolidated. 157 Attributable profit of $561 million, above target. 132 • Higher revenues, lower costs and reduced provisions. 95 • Improved trend in loans and core deposits, with focus 4 on profitability. -4 -10 • Enhanced credit quality: reduction in non-performing -25 loans and higher coverage. Q1’09 Q2’09 Q3’09 Q4’09 Q1’10 Q2’10 Q3’10 Q4’10 Attributable profit was EUR 424 million ($561 million), In Asset Management and Insurance, 2010 saw the compared to a loss of EUR 25 million in 2009 ($35 million). consolidation of the Save & Invest product, launched in 2009. Of note in insurance were the campaigns to launch families of Despite a difficult environment with reduced demand for loans products in line with the Group’s bancassurance model. and low interest rates, Sovereign consolidated the profitability of its franchise in 2010 and secured the breakeven point reached in Also noteworthy was the STARR project (Steps to Achieve the fourth quarter of 2009, thanks to management of spreads, Remarkable Results) started in the fourth quarter of 2010 in the better mix of loans and deposits, control of costs and order to apply the sales culture in branches, and whose main enhanced credit quality. focus is to improve the productivity of the network. Economic environment Sovereign’s integration into the Santander model offers a solid Sovereign conducted its business in a recovering economy, but base for tackling 2011, when we will put the emphasis on one still marked by a jobless rate close to recent highs and low further improvement in the franchise and in commercial interest rates. efficiency with new products and better segmentation. The Partenón operational platform will help to achieve this. After several quarters of declines in lending, the first signs of stabilisation began to appear in the third quarter of 2010 (-0.1% Activity quarter-on-quarter), with slight growth to companies (+0.3% q- 2010 was characterised by the focus on profitability and on o-q) and stabilisation in consumer credits (-0.5% q-o-q). In improving the mix of lending and funding products. deposits, continued flow into demand deposits (+2.7% q-o-q) from time deposits (-0.5% q-o-q). In an environment of low demand for loans, Sovereign centred on improving the spreads on new loans and renewals, reflecting Strategy the higher cost of liquidity and risk. Sovereign, with 721 branches, 2,337 ATMs and more than 1.7 million customers, is developing a business model focused on retail customers and companies. It operates in the northeast of the US, one of the country’s most prosperous areas, where it has significant market shares and manages close to $100,000 million of loans and deposits. ACTIVITY. TOTAL LOANS(1) LOANS BREAKDOWN(1) % (US$) % variation 2010 / 2009 (US$) There were significant improvements in activity, backed by +17 campaigns. Of note in retail banking were the Get More with 4 and Better Banking campaigns, the first focused on retail +0 customers and the second on SMEs. Both campaigns were the -1 first to concentrate on cross-selling. -6 Of note in corporate banking was the Race to Finish campaign to attract new customers. Backed by the advantages of the Group’s global customer relation model, the foundations were -32 -12 laid in 2010 for Global Wholesale Banking, which already is doing better than expected. Multifamily Commercial Other Run-off 2009 2010 + residential & industrial loans loans (1) W/o securitisations, local criteria 136 ANNUAL REPORT 2010
  • 139.
    In lending (localcriteria), the decision to exit higher risk DEPOSITS(1) NET INTEREST INCOME / ATAs segments was offset by the rise in activity in the most attractive % variation 2010 / 2009 (US$) % (US$) mortgage segments such as residential and multifamily (+17%). The volume of loans, which declined 12% in 2009, picked up in +3 2010 and ended almost flat, despite a 32% cut in run-off credits 3.28 (60% since Sovereign joined the Group). Excluding the portfolio in run-off, other loans increased 3%. In deposits, the emphasis was on improving the mix of products. 2.39 Core deposits rose 3% (mainly retail demand deposits), partly -18 due to the success of the retail campaigns, while other balances (time, wholesale and government) of a higher cost declined 18%. Core Other 2009 2010 deposits deposits Results (1) Local criteria As in other businesses, Sovereign’s financial statements have been restated in accordance with the criteria set out on page 108 of this report, and so the figures shown here do not coincide with those published by Sovereign with local criteria. Gross income rose 26.5% to $2,786 million on a like-for-like Attributable profit was $561 million, consolidating the upward basis (only February to December was recorded by global path begun in 2009 and reflected in an improvement in all integration). This was largely due to net interest income quarters of 2009 and 2010. (+31.5%), whose increase was due to the management of prices in loans, the lower cost of deposits and ALCO In short, 2010 showed Sovereign to have a solid income management, which offset the lower volumes of loans. statement, backed by the generation of recurring revenues, control of costs and improved levels of provisions resulting from Operating expenses reflected the positive impact of synergies proactive credit risk management. All of this, steming from and the optimisation of structures and are on a clear downward improved balance sheet structure, and together with the trend: 8.1% lower than 2009 on a like-for-like basis. This, recovery of basic lending provides an optimum starting point for coupled with revenues, produced a notable gain in efficiency the coming years. from 60.2% in 2009 to 44.5% and a sharp rise in net operating income (+81.4%) to $1,547 million. Net loan-loss provisions were 21.1% lower, thanks to containment of bad loans and the recovery capacity during the whole credit cycle. This is reflected in a better than expected evolution of credit quality: the NPL ratio declined from 5.35% to 4.61% and coverage rose from 62% to 75%. NET OPERATING INC. ATTRIBUTABLE PROFIT NPL RATIO NPL COVERAGE Million US$ +91.0%* Million US$ % % 1,547 5.35 4.61 75 62 810 561 -35 2009 2010 2009 2010 2009 2010 2009 2010 (*) In euros: +100.8% ANNUAL REPORT 2010 137
  • 140.
    CORPORATE ACTIVITIES Million euros Variation 2010 2009 Amount % INCOME STATEMENT Net interest income (2,678) (2,210) (468) 21.2 Net fees (40) (6) (35) 622.2 Gains (losses) on financial transactions (142) 631 (773) — Dividends 64 121 (58) (47.5) Income from equity-accounted method (2) (15) 14 (89.1) Other operating income/expenses (net) 137 52 85 162.7 Gross income (2,660) (1,427) (1,234) 86.5 Operating expenses (822) (809) (12) 1.5 General administrative expenses (689) (695) 7 (0.9) Personnel (268) (307) 39 (12.7) Other general administrative expenses (420) (388) (32) 8.4 Depreciation and amortisation (133) (114) (19) 16.4 Net operating income (3,482) (2,236) (1,246) 55.7 Net loan-loss provisions (111) 50 (161) — Other income (428) (848) 420 (49.6) Profit before taxes (w/o capital gains) (4,021) (3,034) (987) 32.5 Tax on profit 1,091 1,421 (330) (23.2) Profit from continuing operations (w/o capital gains) (2,930) (1,614) (1,316) 81.6 Net profit from discontinued operations (13) (15) 1 (9.3) Consolidated profit (w/o capital gains) (2,943) (1,628) (1,315) 80.8 Minority interests (25) (5) (20) 383.6 Attributable profit to the Group (w/o capital gains) (2,918) (1,623) (1,295) 79.8 Net extraordinary capital gains and allowances — — — — Attributable profit to the Group (2,918) (1,623) (1,295) 79.8 BALANCE SHEET Trading portfolio (w/o loans) 5,123 4,331 792 18.3 Available-for-sale financial assets 21,288 26,870 (5,581) (20.8) Investments 38 32 6 19.9 Goodwill 24,622 22,865 1,757 7.7 Liquidity lent to the Group 27,766 49,677 (21,911) (44.1) Capital assigned to Group areas 63,187 52,448 10,739 20.5 Other assets 64,806 64,511 296 0.5 Total assets/liabilities & shareholders' equity 206,830 220,733 (13,903) (6.3) Customer deposits (1) 14,258 3,216 11,042 343.4 Marketable debt securities (1) 62,812 83,094 (20,282) (24.4) Subordinated debt (1) 12,128 19,131 (7,004) (36.6) Other liabilities 47,210 50,106 (2,896) (5.8) Group capital and reserves (2) 70,423 65,186 5,237 8.0 Other customer funds under management — — — — Mutual funds — — — — Pension funds — — — — Managed portfolios — — — — Savings-insurance policies — — — — Customer funds under management 89,198 105,442 (16,244) (15.4) (1).- Including all on-balance sheet balances for this item (2).- Not including profit of the year 138 ANNUAL REPORT 2010
  • 141.
    CORPORATE ACTIVITIES Management of the exposure to exchange-rate movements, both from investments in the shareholders' equity of units in currencies other than the euro as well as that • This area’s losses were EUR 1,295 million more than in regarding the results generated for the Group by each of the 2009 because of: units, also in various currencies, is conducted too on a • Gains on financial transactions were EUR 773 million centralised basis. lower, basically losses in hedging positions against the profits of 2009. This management (dynamic) is carried out by exchange-rate derivative instruments, optimising at each moment the • Net interest income was down EUR 468 million because financial cost of hedging. of the higher cost of financing. In this sense, hedging of net investments in the • The net of the rest of the income statement had an shareholders' equity of businesses abroad aims to almost neutral impact. neutralise the impact on them of converting to euros the balances of the main consolidated entities whose functional The area made a loss of EUR 2,918 million in 2010 compared currency is not the euro. to a loss of EUR 1,632 million in 2009. This was mainly due to lower net interest income and the losses on financial The Group considers it necessary to immunise the impact transactions, as later explained. which, in situations of high volatility in the markets, sharp movements in exchange rates would have on these exposures Corporate Activities covers, on the one hand, a series of of a permanent nature. The investments which are currently centralised activities to manage the structural risks of the covered are those in Brazil, the UK, Mexico and Chile, and the Group and of the parent bank. It coordinates and/or executes instruments used are spot contracts, FX forwards or tunnel the necessary activities for managing interest rates, exposure options. to exchange-rate movements and measures to obtain the required levels of liquidity in the Group. On the other, it acts as The objective of the hedging is set as part of the shareholders' the Group’s holding, managing global capital as well as that of equity of the unit equivalent to a percentage of risk-weighted each of the units. assets, which can be changed, As regards interest rate management, this activity is Meanwhile, exposures of a temporary nature (i.e. those conducted on a coordinated basis by all the units, but this regarding the results which the Group’s units will business only registers the part relative to the balance sheet of contribute over the next 12 months), when they are in the parent bank, via the ALCO portfolios (at the volume levels currencies other than the euro, are also covered on and duration considered optimum at each moment). centralised basis. These results, generated in the local currencies of the units, are hedged with exchange-rate These portfolios, which normally take the form of sovereign derivatives. The objective is to establish the euros resulting bonds of European countries, aim to mitigate the impact of from the exchange rate at the beginning of the year. These interest rate movements on the balance sheet of retail policies immunise both the investment in the shareholders' banking, structurally sensitive by maturities to these equity as well as the contribution to results of the various movements and managing to maintain recurrent results units. recorded as net interest income. The impact of the hedging is in gains/losses on financial In order to achieve these goals, and in so far as market interest transactions, and the hedging of results compensates, in the rate changes are envisaged, the Group’s financial management opposite way, the greater or lesser value in euros from the can decide to immunise the net interest income of these contribution of businesses. portfolios to possible adverse movements in results by hedging interest rates. ANNUAL REPORT 2010 139
  • 142.
    Management of structuralliquidity aims to finance the Lastly, and more marginally, the equity stakes that the Group Group’s recurrent activity in optimum conditions of maturity takes within its policy of optimising investments is reflected in and cost. The decisions whether to go to the wholesale corporate activities. Since 2009 following Cepsa’s disposal, this markets to capture funds and cover stable and permanent item was significantly reduced. liquidity needs, the type of instrument used, the structure by maturity dates, as well as management of the associated risks The area made a loss of EUR 2,918 million in 2010 compared of interest rates and exchange rates of the various financing to a loss of EUR 1,632 million in 2009. This was mainly due to sources, are also conducted on a centralised basis. two factors. The overriding objective of this activity is to maintain an First, the deterioration of net interest income from the higher appropriate liquidity profile by diversifying the sources of financial costs resulting from the increase in the cost of credit. financing and controlling short-term financing (diversity in Second, the losses from financial transactions, basically in maturities, currencies and markets) and medium-and long- hedging positions of exchange rates (due to the appreciation term. of the main currencies, whose positive impact is reflected in the operating areas), compared to revenue in 2009 from the Logically, the objectives that the Group wants to cover may or net results of hedging interest rates in financings. may not coincide with the financing provided to the units and which is based more on their individual needs. The mismatch The main developments were: in maturities, currencies or instruments is a corporate decision and is reflected in this unit in a centralised way. • Net interest income was EUR 2,678 million negative compared to EUR 2,210 million also negative in 2009. The The financial cost of the various financing sources recorded in increase was largely due to the higher cost of credit of the books of the parent bank (although part of them reflects issues. the Group’s needs as such) are registered in corporate activities and can be issues of commercial paper, senior debt, As previously explained, corporate activities mainly provides covered bonds, subordinated debt, preference shares and liquidity to the businesses of the parent bank in Spain at the securitisation of assets. euribor or swap rate. The higher cost of credit, largely due to liquidity tensions in the market, was not transmitted with The financial management area usually covers in new issues the same intensity and speed to the cost for the various the interest rate and exchange rate risks from the start of the businesses. operation. It uses financial derivatives for this. The net impact of this hedging is recorded in the gains/loss on financial This increased cost was also reflected in the financing of the transactions in corporate activities. goodwill of the Group’s investments, which by definition is negative, but also raised the cost of their financing This area also analyses the strategies for structural proportionately. management of credit risk where the aim is to reduce concentrations by sectors, which naturally occur as a result of The net interest income of the ALCO portfolios registered commercial activity. Derivative operations here achieve an here shows no substantial changes. effect similar to that of the sale of assets and their compensation by the acquisition of other assets enables us to • Dividends from equity stakes (reduced in the last year) diversify the credit portfolio as a whole. dropped from EUR 121 million to EUR 64 million. Lastly, and separately from the financial management activities • Gains on financial transaction, which includes those from described here, corporate activities acts as the Group’s centralised management of interest rate and currency risk of holding. It manages all capital and reserves and allocations of the parent bank as well as from equities, were EUR 142 capital to each of the units as well as providing liquidity that million negative compared to EUR 631 million in 2009. The some of the business units might need (mainly the Santander difference was due to hedging. Branch Network and corporate in Spain). The price at which these operations are carried out is the market rate (euribor or In 2009, the impact from hedging the results of units was swap without liquidity premium for their duration) for each of low, and, moreover, there were positive returns on the the maturities of repricing operations. business of equity stakes and hedging of interest rates. 140 ANNUAL REPORT 2010
  • 143.
    In 2010, thesituation reverted, with higher losses from the hedging of the results of subsidiaries (which, however, were compensated in the business units with higher results in euros) and allowances for financial investments in the portfolio of equity stakes. • Operating costs were almost flat (+1.5%). The growth in general costs from the increase in rents was offset by the reduction in personnel costs from variable remuneration. • Net loan-loss provisions include an allowance of EUR 111 million as against a release of EUR 50 million in 2009. In 2009, there were releases from country risk but not in 2010. Furthermore, there was a generic provision in 2010 to strengthen the balance sheet. Other small movements were recorded in this item from normal allocations and releases from portfolios that configure the ALCO strategies, and from others that constitute positions of centralised management. • “Other income”, which includes various provisions and writedowns, was EUR 428 million negative compared to EUR 848 million negative in 2009. This item includes allowances derived from the management and sale of foreclosed properties. These were higher in 2009 because of a larger inflow than in 2010. Other types of writedowns are included such as derivatives of goodwill and losses in the value of equity stakes. Of note in 2009 was the EUR 196 million allowance for Metrovacesa. • Lastly, the tax line reflects a lower rate arising from the recovery of losses as a result of the different impact that certain one-off items had in both years. ANNUAL REPORT 2010 141
  • 144.
    2. SECONDARY SEGMENTSOR BY BUSINESS NET OPERATING INC. ATTRIBUTABLE PROFIT RETAIL BANKING Million euros +9.7% Million euros +7.0% • Small growth in business and management of spreads 22,569 increased net interest income. 20,576 7,940 • Rigorous discipline in expenses, which remained flat on a 7,417 like-for-like basis and without the exchange rate impact. • Risk management reflected in lower provisions in the Americas and the UK. One-off increase in Europe because of the imapct of the Bank of Spain’s Circular (EUR 437 million, net of taxes). 2009 2010 2009 2010(1) (1) Before the impact from the application of Bank of Spain’s Circular 3/2010: 8,377 million; +13.0% Attributable profit was 7.0% higher at EUR 7,940 million. Retail Operating expenses rose 10.7%, but remained flat without Banking generated 85% of the operating areas’ total gross perimeter and forex impact. As a result, the efficiency ratio income and 72% of attributable profit. remained at around 40% and net operating income was 9.7% higher at EUR 22,569 million. Gross income increased 10.1% to EUR 38,121 million, due to the 12.4% rise in net interest income thanks to management of Net loan-loss provisions increased 5.9%. Excluding the perimeter spreads against a background of weak business growth. Net fee and forex impact, provisions were 3.4% lower. These figures income grew 7.0%. reflect the impact of the extraordinary provision in Spain made in the third quarter of 2010 because of the Bank of Spain’s new All these variations were positively impacted by the perimeter regulations. Excluding this one-off and the perimeter and forex and by exchange rates. Excluding them, gross income was in effects, provisions were 10.1% lower, reflecting the quality of line with that in 2009. integral management of risk in all the Group’s units. INCOME STATEMENT AND BUSINESS VOLUMES SECONDARY SEGMENTS Million euros Operating Retail Global Asset Management business areas Banking Wholesale Banking and Insurance 2010 Var (%) 2010 Var (%) 2010 Var (%) 2010 Var (%) INCOME STATEMENT Net interest income 31,902 11.9 28,994 12.4 2,676 6.7 232 15.6 Net fees 9,774 7.6 8,058 7.0 1,292 14.6 425 (1.5) Gains (losses) on financial transactions 2,747 (1.6) 1,333 (3.0) 1,364 (1.4) 49 45.0 Other operating income (1) 286 (32.2) (264) 221.0 175 5.7 375 10.9 Gross income 44,710 9.6 38,121 10.1 5,508 6.2 1,081 7.7 Operating expenses (17,374) 11.3 (15,552) 10.7 (1,480) 17.7 (343) 10.3 General administrative expenses (15,567) 10.2 (13,929) 9.8 (1,343) 15.0 (295) 5.9 Personnel (9,061) 11.3 (8,002) 10.6 (898) 18.6 (161) 7.9 Other general administrative expenses (6,506) 8.7 (5,927) 8.8 (445) 8.3 (134) 3.7 Depreciation and amortisation (1,807) 21.9 (1,623) 19.2 (137) 54.4 (47) 48.3 Net operating income 27,335 8.5 22,569 9.7 4,027 2.6 739 6.5 Net loan-loss provisions (10,147) 6.4 (10,142) 5.9 (5) — (0) — Other income (1,116) 29.0 (1,083) 33.3 (16) — (17) (68.0) Profit before taxes 16,073 8.6 11,345 11.4 4,007 1.1 721 11.4 Tax on profit (4,014) 6.8 (2,743) 11.7 (1,071) (1.2) (200) (8.6) Profit from continuing operations 12,059 9.2 8,602 11.2 2,936 2.0 521 21.6 Net profit from discontinued operations (14) — (14) — — — — — Consolidated profit 12,045 8.6 8,588 10.4 2,936 2.0 521 21.6 Minority interests 946 81.6 648 79.3 238 81.1 59 114.1 Attributable profit to the Group 11,099 5.0 7,940 7.0 2,698 (1.8) 462 15.2 BUSINESS VOLUMES Total assets 1,177,052 7.2 862,055 6.0 281,937 10.9 33,060 11.1 Customer loans 721,509 5.8 651,871 5.4 69,179 9.4 459 (22.2) Customer deposits 602,118 19.5 514,330 14.1 83,689 60.0 4,100 710.3 (1).- Including dividends, income from equity-accounted method and other operating income/expenses 142 ANNUAL REPORT 2010
  • 145.
    RETAIL BANKING. INCOMESTATEMENT Million euros Gross Net operating Attributable income income profit to the Group 2010 Var (%) 2010 Var (%) 2010 Var (%) Continental Europe 13,520 (2.4) 8,194 (5.4) 2,774 (27.8) o/w: Spain 7,855 (10.2) 4,403 (16.4) 1,553 (43.4) Portugal 985 (8.7) 485 (15.6) 340 (19.3) United Kingdom 5,159 6.8 3,058 10.2 1,557 16.0 Latin America 17,351 19.9 10,163 18.8 3,196 41.6 o/w: Brazil 12,190 25.7 7,289 27.1 1,798 59.1 Mexico 1,841 (2.6) 1,038 (12.7) 430 45.6 Chile 1,721 17.0 1,067 12.5 519 32.2 Sovereign 2,091 42.9 1,154 98.2 413 — Total Retail Banking 38,121 10.1 22,569 9.7 7,940 7.0 Total lending rose 5% and customer deposits increased 14%. Global Private Banking includes institutions that specialise in financial advice and asset management for high-income clients The performance by geographic areas reflects the varying (mainly Banif in Spain, Santander Private Banking in the UK, Italy economic environments, with lower growth in developed and Latin America), as well as the units of domestic private economies and a better macroeconomic environment in banking in Portugal and Latin America, jointly managed with emerging countries. local retail banks. • Retail Banking in Continental Europe was the most affected by The division continued to deepen and adapt its common the environment. Gross income declined 2.4% and net business model, paying particular attention to the commercial operating income 5.4%. Attributable profit dropped 27.8%, processes of advice, training, career plans, standardisation of because of higher provisions, as it is Continental Europe that investment strategies and discretional management and bears the impact of Bank of Spain Circular 3/2010. unification of products. The IT platform for management of clients is also being worked on intensely so that it is common to The main drivers were moderate business volumes and even all units in the future. This platform is currently operating in falls in lending, good management of assets spreads in an Spain, Italy and Mexico. The rest of units will gradually join it. environment of strong pressure and low interest rates, the impact of the Group's policy for capturing deposits, control of All of this will help to enhance the quality of customer service, costs and the effect of the extra provisions under the new maintain a constant watch on portfolios to ensure they are in regulations. line with objectives, align the value offer of all units and obtain significant synergies. • The profit of Retail Banking in the United Kingdom was 11.7% higher in sterling than in 2009. Growth in gross The environment in which activity was conducted in 2010 was income was spurred by net interest income and lower costs, very difficult. As well as the international financial crisis, interest which produced a further gain in the efficiency ratio to rates were low and the main stock market indices were lower 40.7%. than at the beginning of the year. • The results of Retail Banking in Latin America (at constant Despite the negative impact of markets, the volume of exchange rates) came from growth in basic revenues (net managed assets was higher on a like-for-like basis, due to the interest income and fee income), control of costs capturing of new business and more customers. This compatible with business development (benefiting from underscored the good commercial and management processes. Brazil’s synergies) and lower loan-loss provisions. Gross The volume stood at EUR 97,888 million at the end of 2010, income and costs rose moderately and the efficiency ratio +10.6% above 2009 at constant perimeter. (including amortisations) was around 41%. Despite the determining factors, private banking posted an As a result of a lower level of provisions, net operating income attributable profit of EUR 283 million. Gross income was hit by after provisions increased 31.1%, while attributable profit rose net interest income due to the evolution of interest rates, offset 26.1% (higher minority interests). by higher fee income. Expenses, thanks to continued strict control, remained almost stable and provisions continued to have a low share of costs. ANNUAL REPORT 2010 143
  • 146.
    NET OPERATING INC. ATTRIBUTABLE PROFIT GLOBAL WHOLESALE BANKING Million euros +2.6% Million euros -1.8% • Rigorous management of risk, liquidity and capital. 4,027 3,927 • Strong attributable profits, though less than in 2009, 2,698 2,748 which was a record in revenues and earnings • Activity mainly underscored by customer revenues (86% of the total). • Impact on provisions and profits (-EUR 35 million after 2009 2010 2009 2010(1) tax) of the new Bank of Spain Circular. (1) Before the impact from the application of Bank of Spain’s Circular 3/2010: 2,733 million; -0.5% This segment, managed by Santander Global Banking and Net operating income rose 2.6% to EUR 4,027 million. This Markets, posted EUR 2,698 million of attributable profit, 1.8% growth, partly absorbed by provisions including EUR 49 lower than in 2009. This area contributed 12% of the operating million from the impact of the new Circular on the area, left areas’ gross income and 24% of attributable profit. consolidated profit 2.0% higher. Attributable profit, after higher minority interests, was 1.8% lower. Excluding the Strategy in 2010 Circular’s impact, attributable profit would have dropped by The area strengthened its capacities in core markets in order to 0.5%. consolidate the liquidity positions attained in 2009. This greater potential enhanced the Group’s capital and liquidity strength The results were supported by strong and diversified client and enabled it to keep up a high level of activity in 2010 in an revenues (86% of the total). They were 3.4% higher than in environment of greater competition, while maintaining rigorous 2009; the weak evolution in Spain was offset by a higher management of risk. A good example of this was Santander’s contribution in euros from other large areas. notable participation in some of the year’s main operations, which consolidated it as a major player. In order to boost client revenues, Santander Global Banking & Markets continued to deepen the global focus of business, by Meanwhile, adjustment of structures achieved in the past and focusing more on the Global Customer Relation Model and effective management of costs and operations enabled fostering inter-relation between the product areas and Santander to assume the increased capacity while maintaining specialised units. The model, which concentrates management an efficiency ratio, which is a benchmark for its peers. of global corporations and institutions, increased its revenues 15% and lifted its share of total revenues. Results and activity These actions were reflected in the income statement. The rise The product areas also made further progress in their in revenues was offset by higher costs and provisions and increasingly global business vision, adapted to the changing contributed to a 1.8% fall in attributable profit to EUR 2,698 needs of markets and clients. Their performance was the million. The other reasons for this were higher minority interests following: in Brazil, because of the listing in October 2009, and the impact of the new Circular on provisions in the third quarter. Global Transaction Banking This area, which includes Cash Management, Trade Finance and Nonetheless, the performance in 2010 was still notable as it was Basic Financing, increased its client revenues 15%. Growth was the second best year ever, only slightly behind 2009, a record solid but lower than in 2009 because of a smaller rise in year in revenues and profits which were spurred by high spreads volumes and lower spreads. and volatility and reduced competition. The normalisation of the environment in 2010 lifted the value of the results, which Trade Finance performed the best (+32%), with rises in almost continued to be backed by a customer-focused business model, all countries thanks to the Group’s solid position in its natural the area’s global reach and its interconnection with local units. markets. Of note was the strong growth in Brazil and Mexico, and the recovery of business in Spain. These three markets Gross income increased 6.2%. Net fee income grew the most account for almost 80% of revenues and of their growth. (+14.6%), aided by the disintermediation trends in some Latin American countries, net interest income increased 6.7% after The area also received recognitions in the four main Latin absorbing the deleveraging of mature markets, the higher cost American countries where we operate including Argentina and of liquidity and the normalisation of spreads and gains on Chile. The magazine Trade Finance named Santander the best financial transactions remained virtually unchanged. international bank for trade in Brazil and Chile Operating expenses reflected the investments made and some exchange-rate impact and were 17.7% higher. The efficiency ratio was 26.9%. 144 ANNUAL REPORT 2010
  • 147.
    Cash Management’s revenuesrose 18% as the weakness of GROSS INCOME BREAKDOWN European markets, due to lower volumes and interest rates, was Million euros offset by the large potential of Latin American business, with growth rates that doubled those of the area in the three large markets. Santander was also named the best bank in cash Total +6% 5,508 5,184 management in Latin America and first in the TMI ranking in Proprietary trading & +27% 793 South America. portfolios -10% 848 Equity In Basic Financing, revenues grew 8%. In Europe, the strong -10% 1,179 Rates Customers deleveraging of the balance sheets of economic agents resulted +3% +14% 1,018 in flat revenues. The evolution in the US and Latin America was Credit 166 Corporate Finance +44% better, the latter spurred by activity in Brazil. Global Transaction Banking +15% 1,503 Corporate Finance 2009 2010 This area (including Mergers and Acquisitions and Asset & Capital Structuring, -A&CS-) performed well after accelerated growth in the second half of the year. Client revenues rose 44% thanks to a very active fourth quarter in Brazil and the UK, Credit Markets which returned business to pre-crisis levels. Credit Markets, which include origination and risk management units and distribution, with capital market instruments as well as Mergers and Acquisitions recovered the positive trend in pure loans and structured financings for the corporate, financial revenues, mainly due to activity in the large Latin American and public sectors, continued to generate solid client revenues countries, an area where the Group continued to accompany its (+14%), with a good performance by products and countries. clients in key operations for their expansion. This offset the weak business in Spain where we maintained our leadership as In loans, Santander had a leading role in major operations in the main bank by number of transactions announced. Europe and the Americas (combined volume close to $80,000 million). Of note was the refinancing of the loan to Inbev to Of note among the operations in which the Group participated acquire its rival Anheuser-Busch where the Bank was the book was advising the Isolux-Elecnor-Cobra (ACS) consortium on the runner. sale of eight electricity transmission lines in Brazil to a Chinese group and selling the stake of Portugal’s Brisa in the Brazilian In Project and Acquisition Finance, Santander consolidated its holding company CCR with interests in private interstate position as one of the leading banks at the global level. The highway concessions. Also noteworthy was our participation in Group is present in major operations in the energy and other cross-border operations such as those conducted by ENI, electricity sectors in Spain, the UK and Italy. Of note was the Dufry and Telefónica-Infosel. Castor project (Europe Oil & Gas Deal of the Year for Project Finance International) to create the third underground The revenues of Asset & Capital Structuring (A&CS) grew the warehouse for the Spanish gas system, in financing the fastest thanks to the growing number of clients in Europe and purchase of 25.83% of Abertis by both companies in which CVC Latin America. Of note was the activity of Spanish Operating and ACS have stakes and in the acquisition of the gas Lease (purchase and lease of assets) with several operations distribution and transport networks of Endesa and Gas Natural completed and mandates on transport assets with clients in by infrastructure funds in Spain, or the acquisition of the gas Spain, the UK, France and Brazil. In Brazil, we won Jane’s distribution and transport networks of Eon in Italy. Transport Finance Awards in two categories: 2010 Aircraft Leasing Innovator of the Year and 2010 Latin American Aircraft In Latin America Santander capitalized on its experience in Leasing Deal of the Year. financing renewable energy and infrastructure, acting as the structuring bank for financing many projects in Brazil, Mexico Also notable was solar energy business in Italy and wind power and Chile. Of note was the construction and operation of the in Brazil and the US, as well as in the segment of R&D+i, which first large-scale cogeneration plant of Pemex in Mexico. Project optimizes the development funds of Spain’s Industry Ministry Finance International named Santander Bank of the Year and the Centre for the Development of Industrial Technology Americas. (CDTI). Lastly, we completed a CER monetization operation (CO2 emission rights) for a wind power park in Oaxaca, Mexico. The evolution in the segment for bonds and securitisations was also good, particularly due to activity in Latin America where the Group took Brazilian, Mexican, Argentine and Chilean issuers to the international market, added to significant operations in Europe in the public and private sectors. All of this enabled Santander to scale positions in the world of bonds and attain new recognitions in markets such as the 2010 European Institutional Performance Award for the best MTN newcomer given by Mtn-i. Of note among the main operations in Latin America were: the issue of the first corporate bond in Argentine in three years; the largest issue in Chile, which included for the first time a tranche in Chilean pesos; and, because of its complexity and innovation, a 10-year $1,500 million bond for Brazil’s Odebrecht. This operation received the IFR award as Latam Bond of the Year. ANNUAL REPORT 2010 145
  • 148.
    Rates Equities The client revenues of this area (including trading activities, The revenues of the Global Equities area (activities related to the structuring and distribution of FX and public bonds and interest equity markets, settlement and custody) were 10% lower than rate derivatives for the Group’s wholesale and retail clients) in 2009 (a record year). declined 10%. The larger volumes with institutional and mid- corp clients did not offset the impact on revenues of the The factors behind the fall were the considerable degree of normalization of spreads since the highs reached in 2009. uncertainty in the markets, the significant fall in share prices, high volatility and sharp declines in trading volumes, despite Geographic diversification of revenues is enabling the Group to which Santander managed to defend its position in key markets. build up an increasingly solid position. Four of our key countries Among the position attained in the sector’s main rankings were (Spain, Portugal, Chile and Uruguay) received Best Foreign first in Iberia and in Latin America in equity capital markets by Exchange provider awards from the magazine Global Finance. Bloomberg and first by Institutional Investors and Thomson Reuters in equities research in Iberia. Of note in Europe was the increase in sales to institutional investors and large companies, particularly in bonds and simple Significant operations in 2010 included global coordinator of derivatives, as well as the recovery of retail activity in Spain Petrobrás’s IPO, the largest in history ($70,000 million) and book supported by mid corps. The evolution was also very good in runner in Deutsche Bank’s capital increase launched in October. the UK in the three large segments, consolidating it as the third largest unit in revenue generation. Strong growth in Latin The sale of investment solutions and hedging via derivatives America fuelled by the retail segment in the three large markets slowed down because of the increased remuneration of where the Group operates, particularly Brazil, and firmly backed deposits, which triggered demand for these products. by Santander Global Connect. In the US, the Group’s franchise model for clients is beginning to generate significant revenues. Lastly, custody and settlement activity began to pick up, due largely to Latin America and particularly Brazil. This offset the weak performance in Europe from stock markets and a slower than expected recovery in the volume of managed funds. RANKINGS IN 2010 Activity Area Country / Region Source Award Best Cash Management Bank 2010 GTB Latin America TMI N1. Cash Management in South America GTB Latin America TMI Award Best International Trade Bank GTB Brazil/Chile Trade Finance Award Best Trade Bank GTB Mexico Trade Finance Award Best Argentinean trade Bank GTB Argentina Trade Finance Award Aircraft Leasing Innovator of the Year CIB Brazil Jane's Transport Finance Award Latinamerican Aircraft Leasing Deal of the Year CIB Latin America Jane's Transport Finance Award Latin America Bond of the Year - PF Odebrecht CM Latin America / Brazil IFR /Bond Radar / Euromoney Award Latin America Wind Deal of the Year : SIIF CM Latin America / Brazil Euromoney Award Bank of the year Americas CM America Project Finance International Award Transport Deal of the Year Asia: Peninsula Link CM Asia Project Finance International Award Europe Oil & Gas Deal of the Year: Castor CM Europe Project Finance International Award Best MTN newcomer for Institutional Clients CM Europe Mtn-i Award Best Foreing Exchange Provider RT Chile/Portugal/Spain/Uruguay Global Finance N1. Equity Capital Markets de Latin America EQ Latin America Bloomberg N1. Equities Research en Iberia EQ Spain and Portugal Institutional Investors N1. Equities Research en Iberia EQ Spain and Portugal Thomson Reuters N1. Equity Capital Markets en Iberia EQ Spain and Portugal Bloomberg N2. Equities Research en Mexico EQ Mexico Institutional Investors (*).- Prize or ranking depending on the criterion (**),- Prize or ranking by volume GTB: Global Transaction Banking CIB: Corporate and Investment Banking CM: Credits and Markets RT: Rates EQ: Equity 146 ANNUAL REPORT 2010
  • 149.
    NET OPERATING INC. ATTRIBUTABLE PROFIT ASSET MANAGEMENT AND INSURANCE Million euros +6.5% Million euros +15.2% • Total revenues accounted for 9% of all the Group’s operating areas. 739 • Customer preference for deposits continued to negatively 694 462 impact the sale of mutual funds and insurance. 401 • Mutual funds: higher volumes in Brazil and the UK, with a still limited impact on fee income. Leadership recovery in Spain in mutual funds. • Insurance: better evolution, backed by growth in Latin America. 2009 2010 2009 2010 Strategy strengthen bancassurance in five key markets in Latin America: Attributable profit was EUR 462 million, 15.2% more than in Brazil, Mexico, Chile, Argentina and Uruguay. Santander will 2009 (4% of the operating areas’ total). create a holding company for its insurers in Latin America, which will be 49% owned by it and 51% by Zurich. At the global level Santander Asset Management continued to streamline the range and merger of funds in various markets. This agreement combines Banco Santander’s commercial The aim is to supply the Group’s networks with simple strength and distribution capacity with the experience and products, well known and with high average volumes. leadership of Zurich in developing and managing products. In each of the countries Banco Santander will distribute Of note was the creation of the multi manager team to bancassurance products for 25 years. manage funds of funds, which maximises synergies in all units. Progress was also made in developing the platform in Results Luxembourg to unify distribution of products from anywhere in Gross income increased 7.7%, more strongly supported by the world and managed by the best teams from any of the insurance as revenue from mutual funds was stable. Costs Group’s fund managers. almost flat in the last few quarters, ended the year up 10.3% because of the one-off impact of the change in accounting These efforts were recognised in 2010 with prizes to fund criteria for amortisation of intangible insurance assets. management institutions (Spain, Chile, UK and Mexico) and for the performance of funds in several countries and categories. Net operating income amounted to EUR 739 million, 6.5% more than in 2009. As a result of lower provisions and a more Santander Insurance advanced in its global business model, favourable tax rate, which offset the higher minority interests creating new products via its distribution channels and preserving in Brazil, attributable profit grew at a faster pace than net its low risk profile and high level of efficiency in operations. operating income. A strategic alliance was reached with the insurer Zurich to Total revenues contributed to the Group by asset management and insurance activities, without deducting those recorded by the distribution network, amounted to EUR 3,966 million, 9% of the Group's total and 10.1% more than in 2009. TOTAL GROUP REVENUES Million euros The total contribution to Group profits (income before tax and the fee income paid to the networks) was EUR 3,591 million (+11.2%). +10% 3,966 Total 3,603 Asset Management Santander Asset Management generated an attributable profit Insurance 2,688 of EUR 81 million, better than in 2009 and reflecting the +11% recovery in volumes, the rise in average commissions in the main markets due to the better product mix and more “normal” provisions. Asset Management +8% 1,278 Total revenues from mutual and pension funds, before 2009 2010 distribution to the distribution networks, amounted to EUR ANNUAL REPORT 2010 147
  • 150.
    1,278 million (+8%),while the total contribution to profits Management Brazil and Moody’s the MQ1 investment rose 12.3% to EUR 1,099 million. manager quality rating. Volumes were weak in developed countries because of the Managed assets also rose in the UK, spurred by increasing strong preference of agents for on-balance sheet funds and sales in branches of multimanager funds. The retail balance the impact of the markets on portfolios, and stronger in Latin at the end of 2010 was EUR 14,000 million (+27% in America within the recovery trend begun in 2009. sterling). Total managed assets amounted to more than EUR 124,000 Mexico also benefited from the launch of new mixed funds million at the end of 2010 (+7% and benefiting from the which helped increase the volume of managed assets to EUR appreciation of currencies against the euro) 10,000 million (+7% in local currency) and improve its product mix. The main elements by units and countries were as follows: Of note in other markets, which account for 10% of managed • In traditional management of assets, mutual fund assets, was Chile which benefited from a personal banking business continued to recover, with the incorporation of product and the Elite portfolios. Its managed assets stood at more markets and greater interest by clients and distributors, EUR 5,800 million and its average fee improved, offsetting the particularly in Latin America. exit of funds into other savings instruments (-6% in local currency). At the end of 2010, the Group managed EUR 121,000 million (+7%) in mutual funds, investment companies and Portugal, on the other hand, notably improved its average pension plans, 90% of which was in four large markets fee which offset the impact on revenues and earnings of the (Spain, UK, Brazil and Mexico). 16% decline in volumes, the result of the bad performance of markets and the appetite for deposits. In Spain, the improvement in volumes at the end of 2009 was interrupted by the preference for on-balance sheet funds • In real estate management, Grupo Santander decided, with attractive offers for deposits. This, coupled with the for solely commercial reasons, to contribute funds to the impact of markets, brought total assets managed in Spain, Santander Banif Inmobiliario investment fund by subscribing including pension funds, to EUR 40,000 million (-14%). to new units and granting a two-year liquidity guarantee in order to meet the reimbursements of participants who so Santander Asset Management recovered its leadership of desire it. As a result of this measure, the suspension of mutual funds in Spain with a market share of 17.4%, reimbursements was lifted and the fund is now operating according to Inverco. normally. This recovery, backed by management of the networks, was • In alternative management, we continued to restructure focused on the sale of mixed and guaranteed fixed income the funds and structures of Optimal Investment Services, in funds, which were well received. Of note was the EUR 2,400 line with the current scant demand for this type of product million captured in the range of 100X100 funds and the EUR and with the forced reduction in its managed assets. 700 million in Santander Revalorización Activa. The reorganisation of the range of funds improved the product • In venture capital funds (a product aimed at institutional mix and the average fee. Santander Asset Management clients who invest very long term in unlisted companies), continued to focus on contributing value and at the end of assets remained at around EUR 300 million. 2010 launched the Gama Select of profiled funds, which are expected to perform well in 2011. The trend in Brazil was good, with net sales and average commissions higher than in 2009. Of note was the reception given to new guaranteed products for the retail segment, particularly the fund Capital protegido 6 which surpassed placement expectations. At the end of 2010, managed funds amounted to almost EUR 44,000 million (+12% in local currency). Also noteworthy is that in 2010 Standard & Poor’s affirmed the AMP-1 rating (very strong) for Santander Asset 148 ANNUAL REPORT 2010
  • 151.
    Insurance INSURANCE (DISTRIBUTION PBT + FEES) %. December 2010 The global area of Santander Insurance generated attributable profit of EUR 381 million, 9.0% more than in 2009. The main reason for this was greater activity, which absorbed the higher Other Latin America Spain 15% minority interests in Brazil. 15% Total revenues (the area’s gross income plus fee income paid to the networks) were EUR 2,688 million, 11% more than in Germany 13% 2009 (+3.5% without the exchange rate impact) and representing 6% of the operating areas’ total gross income The total contribution to the Group’s results (profit before tax Brazil 33% of the insurance companies and brokers and fees received by Other networks) increased 10.7% to EUR 2,491 million (+3.3% Europe 14% excluding the exchange-rate impact). Sovereign 1% United Kingdom 8% Total premium income was 6% lower, impacted by clients’ preference for liquidity and the consequent lower demand for savings-investment products. Premium income from protection insurance, on the other hand, increased 16%. Latin America contributed EUR 1,213 million (49% of the total) Continental Europe, which contributed 42% of the total, and 34% more than in 2009 (+15% excluding the exchange- maintained its stable contribution despite the weakness of the rate impact). All countries increased their contributions at main euro zone economies. Spain’s contribution (excluding double-digit rates in euros and in local currency. Santander Consumer Finance) was EUR 373 million (-7%), with a good performance of revenues from protection insurance The greater efficiency in selling products via the banking which partially offset the fall in savings-investment. networks and other channels, coupled with development of simple products independent of lending operations lifted the Portugal maintained good levels of fee income and results region’s level of activity and of results. from the insurance company. Its total contribution increased 2% to EUR 134 million. Of note was Brazil (+12% in local currency and 69% of the region’s contribution), and Mexico (+26% in pesos). In Chile, Santander Consumer Finance maintained its pace, adjusting its the country’s earthquake in February 2010 had no significant levels of penetration to activity and generation of loans in each impact on insurance results thanks to the Group’s reinsurance market. Its total contribution was EUR 544 million, in line with policy for this type of disaster. Its contribution was 15% higher 2009. in local currency. The UK’s total contribution was 16% lower in sterling at EUR Sovereign, in the first phases of its insurance model, already 193 million. This was due to lower placement of savings contributed EUR 34 million (+5% in dollars), basically due to insurance products because of the stronger demand for other fee income from distribution of savings insurance. products. ASSET MANAGEMENT AND INSURANCE. INCOME STATEMENT Million euros Gross Net operating Attributable income income profit to the Group 2010 Var (%) 2010 Var (%) 2010 Var (%) Mutual funds 267 7.9 113 8.7 70 77.7 Pension funds 25 (13.2) 16 (18.4) 11 (11.0) Insurance 790 8.4 610 6.9 381 9.0 Total Asset Management and Insurance 1,081 7.7 739 6.5 462 15.2 ANNUAL REPORT 2010 149
  • 152.
    RISK MANAGEMENT REPORT Photo:El Bosque, Grupo Santander City, Boadilla del Monte, Madrid, Spain 150 ANNUAL REPORT 2010
  • 153.
    152 EXECUTIVE SUMMARY 154 CORPORATE PRINCIPLES OF RISK MANAGEMENT 158 CORPORATE GOVERNANCE OF THE RISK FUNCTION 159 INTEGRAL CONTROL OF RISK 161 CREDIT RISK 182 MARKET RISK 197 OPERATIONAL RISK 200 REPUTATIONAL RISK 202 ADJUSTMENT TO THE NEW REGULATORY FRAMEWORK 204 ECONOMIC CAPITAL 207 RISK TRAINING ACTIVITIES ANNUAL REPORT 2010 151
  • 154.
    RiSk MANAgEMENT REPORT ExEcUTivESUMMARy BANCO SANTANDER’S Independence All the Bank’s organs RISK MANAGEMENT of the risk of government are Collegiate decisions PRINCIPLES function deeply involved pages 154 a 157 Control and Cutting-edge Support for management of risk tools and systems in business, integrated via a risk measurement maintaining risk corporate structure and analysis quality with global scope MARKET RISK VAR PERFORMANCE IN 2010 pages 182 a 196 Million euros 40 • Santander maintains a low risk profile in activities Max. (37.5) subject to market risk. 36 • In trading activity, lower exposure than in 2009 in 32 a high volatility environment due to Europe’s sovereign debt crisis. 28 • In 2010, the exposures of Grupo Santander related to complex structured assets, from already 24 very low levels, were reduced. 20 Min. (21.2) 4 Jan. 10 11 Feb. 10 02 Mar. 10 28 Apr. 10 17 May. 10 05 Jun. 10 13 Jul. 10 20 Aug. 10 27 Sep. 10 16 Oct. 10 23 Nov. 10 31 Dec. 10 MANAGEMENT OF FUNDING LIQUIDITY MONITORING METRICS AND LIQUIDITY RISK Metrics 2010 2009 pages 192 a 194 Loans/Net assets 75% 79% • Santander has a stable structural liquidity position Customer deposits, insurance backed by customer deposits and medium- and and medium and long-term long-term wholesale funding (4.1 years on average). funding/lending 115% 106% • Strong improvement in 2010 in liquidity ratios after Customer deposits, insurance capturing EUR 109,000 million in deposits and and medium and long-term financing and other EUR 38,000 million in medium and long-term issues. liabilities/Loans+fixed assets 117% 110% Santander has no need in 2011 and 2012 to cover the envisaged maturities of its debt. Short-term financing/Net liabilities 3% 5% • Discounting capacity in central banks of around EUR 100,000 million. • Santander has a decentralized model of liquidity independent of the subsidiaries and within coordinated management at the Group level.
  • 155.
    CREDIT PORTFOLIO INSPAIN Billion euros change -3.5% -3.6% 08/10 TOTAL 254 % 245 Public administrations 7 236 -7.0 10 12 +70.1 Residential mortgages 65 64 61 -5.4 Other loans to individuals 33 31 30 -9.6 companies excluding construction 98 and real estate 95 95 -3.6 Non-real estate purpose 13 13 construction 11 -15.5 and real estate 38 31 Real estate purpose 27 -27.5 2008 2009 2010 Net foreclosed assets 4.3 4.5 5.2 EXPOSURE TO REAL ESTATE CREDIT RISK IN SPAIN pages 172 a 174 At the end of 2010: • Total lending to households to acquire homes with mortgage guarantee amounted to EUR 61,387 million (26% of loans in Spain). The non-performing loan ratio was 2.2% (2.5% in 2009). • The exposure to the construction and real estate activity sectors was EUR 27,334 million (3.7% of the Group’s total and 12% of lending in Spain). This exposure dropped by 27% in the last two years. • Santander’s estimated market share of this business is 10%, much lower than the market share of all the Group’s businesses in Spain (15%). • The non-performing loan ratio of this portfolio is 17.0%. Total doubtful loans (EUR 4,636 million) and sub standard loans (EUR 4,932 million) amounted to EUR 9,568 million and the level of coverage with provisions was 28%.* • The net balance of acquired and foreclosed properties was EUR 5,195 million.* EXPOSURE TO THE CONSTRUCTION NON-PERFORMING LOAN RATIO IN SPAIN AND REAL ESTATE ACTIVITY SECTORS % Million euros Construction and real estate Rest of portfolio Total portfolio in Spain Residential mortgages 15 Total: 27,334 mill. Finished buildings Non-real estate purpose: 4.4% (12,709) 47% Real estate purpose 17.0% 12 13.3 Land that can be developed 9 (2,023) 7% 8.7 Developed land 6 (3,678) 13% 4.2 3.4 3 3.3 3.0 Buildings under Without mortgage 2.5 construction Other land guarantee 2.0 2.2 1.9 2.4 (2,548) 10% (252) 1% (6,124) 22% 1.5 0 2008 2009 2010 * Pages 172-173 of this report set out the structure of risk coverage in the construction and real estate development sectors and the volume of acquired and foreclosed properties.
  • 156.
    cORPORATE PRiNciPLES OFRiSk MANAgEMENT, cONTROL AND RiSk APPETiTE The importance of grupo Santander’s risk policy was GRUPO SANTANDER’S BANKING highlighted once again in 2010. The policy is focused on maintaining a medium-to-low, predictable profile in all risks, BUSINESS MODEL FROM THE RISK which, together with the group’s diversification, were again the STANDPOINT differentiating factors that enabled Santander to maintain a leading position in this sphere. The banking business model chosen by the group mainly determines grupo Santander’s risk management, control and Santander’s risk management policies were particularly appetite. effective in countering the turmoil that has affected financial • Santander focuses on retail banking and maintains an markets since July, 2007. internationally diversified presence characterised by market shares of more than 10% in the main markets where it For grupo Santander, quality risk management is one of its operates. Wholesale banking business is conducted above all hallmarks and thus a priority in its activity. Throughout its 150 in core markers. years, Santander has combined prudence in risk management with use of advanced risk management techniques, which have • The model enables Santander to generate results with a high proven to be decisive in generating recurrent and balanced degree of recurrence, with a strong capital base and liquidity. earnings and creating shareholder value. • Santander operates in markets via subsidiaries that are autonomous in terms of capital as well as liquidity and compatible with corporate control. The corporate structure has to be simple, minimising the use of non-functional subsidiaries. • Santander develops its model for operational and technology integration via corporate platforms and tools. This provides an agile aggregation of information in time and form. • All the activity that the group carries out is part of its social and reputational commitment, in accordance with its strategic objectives. 154 ANNUAL REPORT 2010
  • 157.
    The risks modelthat underpins the business model is based on Management and control of risks at grupo Santander is the following principles structured around the following phases: • independent working from the business areas. Mr Matías • Establishment of risk policies and procedures. They constitute Rodríguez inciarte, the group’s third vice-chairman and the basic framework for regulating risk activities and chairman of the board’s risk committee, reports directly to the processes. At the local level, the risk units incorporate the executive committee and to the board. The establishment of corporate rules to their internal policies. separate functions between the business areas (risk takers) • Defining and assessing risk methodologies. The and the risk areas responsible for measurement, analysis, methodologies enable us to develop the internal risk models control and information provides sufficient independence and applied by the group, and require risk measures, methods for autonomy to control risks appropriately. evaluating products and for constructing yield curves. • involvement of senior management in all decisions taken. • Risk measurement. This considers all the risk positions taken • collective decision-making (including at the branch level), throughout the business perimeter and uses methodologies which ensures a variety of opinions and does not make results and models put into use in accordance with a process of dependent on decisions solely taken by individuals. Joint validation and approval, based on components and responsibility for decisions on credit operations between risk dimensions of risk in the whole life cycle. and business areas. • Define and limit the risk appetite. The aim is to delimit • Defining functions. Each risk taker unit and, where efficiently the maximum risk levels by setting the global and appropriate, risk manager has clearly defined the types of specific limits for the different types of risk, products, activities, segments, risks in which they could incur and customers, sectors and countries. decisions they might make in the sphere of risks, in • Execute a system to monitor and control risks, which verifies accordance with delegated powers. How risk is contracted, every day and with the corresponding reports the extent to managed and where operations are booked is also defined. which Santander’s risk profile is in line with the risk policies • centralised control. Risk control and management is approved and the limits established. conducted on an integrated basis through a corporate structure, with global scope responsibilities (all risk, all businesses, all countries). ANNUAL REPORT 2010 155
  • 158.
    Santander’s risk managementis fully identified with the Basel GRUPO SANTANDER’S RISK APPETITE principles as it recognises and supports the industry’s most advanced practices which the group has been anticipating and, The risks in which Santander incurs must be delimited and as a result, it has been using for many years various tools and quantified within the risk appetite framework defined and techniques which will be referred to later in this section. approved by the board. Santander defines the risk appetite They include: as the amount and type of risks considered as reasonable to assume in the execution of its business strategy. • internal rating and scoring models which, by assessing the various qualitative and quantitative components by client and The board, at the proposal of senior management, is responsible operation, enable the probability of default to be estimated for establishing and monitoring Santander’s risk appetite and its first and then, on the basis of estimates of losses, the tolerance to risk. Senior management is responsible for expected loss. achieving the desired risk profile as well as managing risks on • Economic capital, as the homogeneous metric of the risk a day to day basis. The group has the necessary metrics and assumed and the basis for measuring management, using infrastructure to guarantee management. RORAc, for pricing operations (bottom up) and for analysis of portfolios and units (top down), and vaR, as the element of The risk appetite has quantitative and qualitative aspects, and is control and setting the market risk limits of the various trading directly linked to Santander’s global strategy, including assessing portfolios. growth opportunities in businesses and key markets, liquidity and financing capacity and capital. Pillar 2, with its • Analysis of scenarios and stress tests to complement the corresponding exercises of planning and stress test of capital, analysis of market and credit risk, in order to assess the impact complements the risk appetite reference framework. of alternative scenarios, including on provisions and on the capital. Formulating the risk appetite delimits the budgetary process, in which the main strategic parameters are analysed and approved grupo Santander calculates the minimum regulatory capital in as well as their results, liquidity, capital, bad loans, vaR, etc. accordance with Bank of Spain circular 3/2008 on determining and controlling the minimum equity of credit institutions. This regulation completed the transfer to Spanish banking legislation of the Directives (2006/48Ec and 2006/49/Ec), which incorporate to European Union (EU) regulations the new Basel capital Accord (BiS ii). As a result of the new elements introduced into the regulatory framework, commonly known as BiS iii, grupo Santander took steps to apply with sufficient prevision the future requirements indicated in BiS iii. This entails a greater requirement for high quality capital, sufficiency of capital conservation and counter cyclical. grupo Santander also foresaw the application of the two new liquidity ratios indicated in BiS iii, which guarantee sufficient liquidity even in stress scenarios. These ratios are the liquidity coverage ratio (LcR) for the short term (30 days) and the net stable funding ratio (NSFR) regarding the financing structure. As regards the new liquidity requirements, and especially concerning the ratio of stable financing, the group believes it is very important that the final definition to attain after agreed periods of observation and review reflects the differences associated with the various banking business models and avoids penalising the flow of loans to the real economy. 156 ANNUAL REPORT 2010
  • 159.
    RISK APPETITE MANAGEMENTCRITERIA As for the risk concentration appetite, Santander’s main FOR EACH SPECIFIC RISK objective is to maintain a well diversified risk portfolio from the The main criteria and metrics used are approved by the risk standpoint of its exposure to large risks, certain markets and committee, the executive committee and, where appropriate, specific products. it is measured via three focal points the board at least yearly. control and monitoring is conducted in (customers, products and sector) which include limits set such as accordance with various time frames (from daily to annual), on warning or control signs. the basis of the metric and corresponding level of responsibility. • Market risk: Trading activity is customer-focused. The consistency between the proposed limits and the budget of criteria, metrics and limits (“hard” and “alert/control”) where the business is verified. Metrics are used such as vaR, P&L of necessary are set for each risk. We now look briefly at the management and capital. The vaR is established on the basis general criteria for each risk, which are developed in the of the historic evolution of losses, and as consumption/P&L of following chapters: management up to a certain percentage. Stress tests are also • Credit risk: The credit risk appetite in general is articulated used. around control limits that can change during the year in the case of market/structural risks, these are linked to depending on banking business needs and the group’s risk conservative management of the group’s assets and liabilities, appetite, on the basis of segmenting the risk established liquidity and structural Fx. criteria and metrics are used that (individualised management, standardised and wholesale). are mentioned in greater detail in the relevant sections. The results of the stress tests under various scenarios are also taken into account. • Operational and technology risk: Risk appetite is monitored on the basis of management and daily mitigation, via the ratio of gross losses/gross income, self-assessment The main features for each credit risk segment are as follows: questionnaires/risk maps and management indicators. • Standardised risks: Scoring models and automated decisions • Compliance and reputational risk: The appetite for this risk is are used. The risks are grouped in credit management zero. Active policies to manage reputational risk are programmes (cMPs), with credit policies designed and established by the corporate office created for this purpose. approved on the basis of the unit’s risk appetite and in accordance with their level of predictability. The annual cMPs Support indicators are used to monitor it: are approved at the local level, in accordance with the group’s – Antimoney laundering. structure of powers. – institutional relations with regulatory bodies. • Individualised management: classified as of a certain risk exposure per customer. Each analyst is assigned a portfolio of – codes of conduct of the securities markets. customers to monitor. The ratings of each one are updated at – Marketing of products. least once a year. – Markets in financial instruments directive (MiFiD). • Global wholesale banking risk (GWB: includes corporate and financial institutions/iFis): the distribution of the risk level by – Others: Bank of Spain/Supervisors customer complaints rating is used as the parameter for monitoring the portfolio. and data protection (law on data protection). Limited for each group/customer are assigned at least once a year and all aggregated limits are analysed, breaking them down by the level of rating. The revisions are done by sectors (corporate) and countries (iFis). ANNUAL REPORT 2010 157
  • 160.
    1. cORPORATE gOvERNANcE OF THE RiSk FUNcTiON The risk committee is responsible for proposing to the board the The board’s risk committee delegates some of its powers in risk group’s risk policy, approval of which corresponds to the board committees which are structured by geographic area, business under its powers of administration and supervision. The and types of risk, all of them defined in the corporate committee also ensures that the group’s activities are consistent governance risk model. with its risk tolerance level and establishes the global limits for the main risk exposures, reviewing them systematically and in addition, both the executive committee and the Bank’s board resolving those operations that exceed the powers delegated in pay particular attention to management of the group’s risks. bodies lower down the hierarchy. grupo Santander’s risks function is conducted via two The committee is of an executive nature and takes decisions in directorates-general of risks which are independent of the the sphere of the powers delegated in it by the board. it is business areas, both from the hierarchical and functional chaired by the third vice-chairman of grupo Santander and four standpoint. Both of them report to the group’s third vice- other board members are also members of the committee. chairman, the maximum executive responsible for the group’s risk management. The organisational and functional framework The committee met 99 times during 2010, underscoring the is as follows: importance that grupo Santander attaches to appropriate • general directorate of integral control and internal validation management of its risks. of risks, with responsibilities of global scope and corporate nature and support for the group’s organs of governance, The main responsibilities of the board’s risk committee are: which are: • Propose to the board the risk policy for the group, which - validation of internal models of risk to assess the suitability must, in particular, identify: and appropriateness of the classification systems, internal - The different types of risk (operational, technological, processes and treatment of data, in accordance with Basel ii. financial, legal and reputational, among others) facing it; - integral control of risks to guarantee that the management - The information and internal control systems used to control and control systems of the various risks are in line with the and manage these risks; Bank’s global risk profile. - Set the level of risk considered acceptable: • Directorate general of risks, with functions in the following blocks: - The measures envisaged to mitigate the impact of identified risks, in the event that they materialise; - A corporate structure, with global scope responsibilities (“all risks, all countries”), which establishes the policies, • Systematically review exposures with the main customers, methodologies and control: solvency, market and economic sectors, geographic areas and types of risk. methodology. • Authorise the management tools and risk models as well be - A business structure, centred on the execution and familiar with the results of the internal validation. integration in management of the risks function in the • Ensure that the group’s actions are consistent with the group’s retail, global and local businesses. previously decided risk tolerance level. • know, assess and monitor the observations and recommendations periodically formulated by the supervisory authorities in the exercise of their function. • Resolve operations beyond the powers delegated to bodies lower down the hierarchy, as well as the global limits of pre- classification of economic groups or in relation to exposures by classes of risk. 158 ANNUAL REPORT 2010
  • 161.
    2. iNTEgRAL cONTROL OF RiSk grupo Santander launched in 2008 the function of integral The main features of this function are: control of risks, anticipating the new regulatory requirements, • global and corporate scope: all risks, all businesses, then being discussed in the main organisations and forums – all countries; Basel committee, cEBS, FSF, etc, - as well as the recommendations on best risk management practices • it is configured as a third layer of control, following the one formulated by various public and private bodies. by the person responsible for managing and controlling each risk in the sphere of each business or functional unit (first layer of control) and the corporate control of each risk (second ORGANISATION, MISSION AND layer). This ensures the vision and thus integral control of all risks incurred during the year. FEATURES OF INTEGRAL CONTROL • Special attention is paid to the development of best practices OF RISKS in the sphere of the financial industry, in order to be able to incorporate within Santander and at once any advances The organisation of this function is part of the directorate deemed opportune. general of integral control and internal validation of risk. This function supports the group’s governance bodies in risk • Both the information available as well as the resources that management and control. grupo Santander assigns to controlling the various risks are optimised, avoiding overlapping. Particular attention is paid to credit risk (including the risks of concentration and counterparty); market risk (including liquidity risk as well as structural risks of interest rates and exchange rates); operational and technology risks and risk of compliance METHODOLOGY AND TOOLS and reputational risk. in order to systemise the function and adjust it to Santander’s specific needs, internal development of methodology and tools integral control of risk is treated in three modules: to support it was completed. This makes application of the methodology traceable. The methodology and the tools are Module 1. Ensure that the management and control systems of articulated through the three modules previously referred to for the various risks inherent in grupo Santander’s activity meet the all risks treated: most demanding criteria and the best practices observed in the industry and/or required by regulators. Module 1. A guide of tests or reviews exists for each risk, divided in spheres of control (for example, corporate Module 2. Ensure that senior management has at its disposal an governance, organisational structure, management systems, integral vision of the profile of the various risks assumed and integration in management, technology environment, that these risks are in line with the previously agreed appetite contingency plans and business continuity, etc). for risks. Applying the tests and obtaining the relevant evidence which is Module 3. Supervise appropriate compliance in time and form assessed and enables the parameters of control of the various with the recommendations drawn up for risk management risks to be homogenised is done every 12 months. New tests are matters following inspections by internal auditing and by the incorporated where needed. The support tool is the risk control supervisors to whom Santander is subject. monitor, which is a repository of the results of each test and of their work papers. A half yearly review of the state of each risk is integral control of risk supports the work of the risk committee, also carried out, monitoring the recommendations emanating providing it with the best practices in risk management. from the annual report of integral control. ANNUAL REPORT 2010 159
  • 162.
    Module 2. Seniormanagement is able to monitor integral During 2010: vision of the various risks assumed and their adjustment to a) The second cycle of reviewing the various risks was the previously formulated risk appetites. completed in close contact with the corporate areas of control, contrasting and assessing the control and Module 3. The SEgRE tool is used to track the management systems of these risks. improvements were recommendations made by internal auditing and by the identified and made into recommendations – with their supervisors regarding risk control and management and it also corresponding schedule for implementation agreed with the includes the recommendations by integral control. Use of this areas – along with half yearly monitoring of the progress tool is coordinated with the relevant risk control areas so that achieved in the recommendations made in 2009. monitoring is optimised. The Bank of Spain can access these tools if it so wishes. b) The board and the executive committee were regularly informed and given an integral vision of all risks; and c) Work continued on extending the integral control of risks model to the group’s main units. We will now look at the group’s main risks: credit, market, operational and reputational. 160 ANNUAL REPORT 2010
  • 163.
    3. cREDiT RiSk INTRODUCTIONTO THE TREATMENT • Those under individualised management are assigned, mainly because of the risk assumed, a risk analyst. This category OF CREDIT RISK includes the companies of wholesale banking, financial institutions and some of the companies of retail banking. Risk credit risk is the possibility of losses stemming from the failure management is conducted through expert analysis backed up of clients or counterparties to meet their financial obligations by tools to support decision making based on internal models with the group. of risk assessment. The group’s risks function is organised on the basis of the type • Standardised: a customer who has not been specifically of customer in order to distinguish during the risk management assigned a risk analyst. This category includes individuals, process companies under individualised management from individual businessmen and retail banking companies that are standardised customers. not segmented. Management of these risks is based on internal models of assessment and automatic decisions, complemented where the model does not go far enough or is not sufficiently precise by teams of analysts specialised in this type of risk. ANNUAL REPORT 2010 161
  • 164.
    MAIN VOLUMES Spain was still the main unit as regards exposure to credit risk, although it share of the total was 3 p.p. less than at the end of AND PERFORMANCE 2009. Of note in the rest of Europe, which accounts for more than one-third of the credit exposure, is the presence in the Uk. The group’s credit risk profile is characterised by diversified Overall, Europe, including Spain, accounted for 71% of the total geographic distribution and predominantly retail banking exposure. activity. in Latin America, which accounted for 23% of the exposure, A. GLOBAL MAP OF CREDIT RISK, 2010 96% of the exposure to credit risk is classified as investment- The table below sets out the global credit risk exposure in grade. nominal amounts (except for derivatives and repos exposure which is expressed in equivalent credit) at December 31, 2010. The US accounted for 6.5% of the group’s total credit exposure at the end of 2010. growth in lending was moderate, due to reduced demand. The exposure to credit risk increased 8.8%. Of this growth, 48% was due to the exchange rate effect during the year of the main currencies against the euro. The rest was concentrated in similar percentages between outstanding and commitments to customers and outstanding to credit entities. GRUPO SANTANDER. GROSS EXPOSURE TO CREDIT RISK Outstanding Million euros to Out- commit- Sovereign Private fixed cred. ent. commit- Derivatives standing ments to fixed income income and central ments to and Repos %/ to custumers customers (exc. trading) (exc. trading) banks credit entities (EcR) Total % Dec. 09 Spain 277,583 61,492 26,956 7,674 19,260 1,484 32,644 427,092 35.4% -3.0% Parent Bank 168,070 45,097 16,210 4,892 14,059 1,210 26,568 276,105 22.9% -1.6% Banesto 79,842 10,154 7,980 1,198 3,204 273 5,905 108,556 9.0% -5.7% Others 29,671 6,241 2,765 1,584 1,997 1 171 42,430 3.5% -4.9% Rest of Europe 320,158 42,791 6,022 9,163 34,224 1 16,167 428,525 35.5% 9.6% germany 21,879 295 0 111 694 0 6 22,984 1.9% 0.5% Portugal 23,062 7,831 5,515 3,517 1,466 1 1,880 43,272 3.6% 11.6% Uk 242,864 32,154 145 5,431 31,380 0 13,650 325,624 27.0% 11.7% Others 32,353 2,511 362 103 684 0 631 36,645 3.0% -2.6% Latin America 136,084 63,200 25,602 3,745 31,544 6 10,926 271,106 22.5% 30.0% Brazil 81,684 42,159 18,040 2,613 24,008 0 5,758 174,263 14.4% 32.0% chile 27,397 7,929 1,764 948 2,313 6 2,938 43,296 3.6% 24.8% Mexico 14,621 11,508 3,977 2 3,431 0 1,822 35,361 2.9% 34.0% Others 12,382 1,603 1,820 183 1,791 0 407 18,186 1.5% 18.5% United States 53,288 10,888 1,682 8,953 2,984 0 795 78,590 6.5% 16.8% Rest of World 747 102 1 1 158 0 0 1,009 0.1% -33.9% Total Group 787,860 178,473 60,262 29,536 88,169 1,491 60,532 1,206,322 100% 8.8% % of Total 65,3% 14,8% 5,0% 2,4% 7,3% 0,1% 5,0% 100,0% % Change/Dec 09 6,9% 19,6% 1,2% -24,0% 43,9% 9,4% -0,7% 8,8% Data at December 31, 2010, drawn up on the basis of legal company criteria. EcR (equivalent credit risk: net value of replacement plus the maximum potential value. includes mitigants) Outstanding balances with customers including contingent risk and excluding repos (EUR 1,395 million) and other customer credit assets (EUR 12,406 million). Total fixed income excludes the trading portfolio and investments of third party takers of insurance. Balances with credit institutions and central banks include contingent risks and exclude repos, trading portfolio and other financial assets. Of the total, EUR 65,351 million are deposits in central banks. 162 ANNUAL REPORT 2010
  • 165.
    B. EVOLUTION OFTHE VOLUMES IN 2010 Specific provisions for loan losses, net of recoveries, amounted The evolution of non-performing loans and the cost of credit to EUR 12,342 million, 1.56% of the average credit exposure reflect the impact of the deterioration of the economic with customers (the year’s average lending plus financial environment softened by prudent risk management which guarantees), down from 1.57% in 2009. enabled, in general, these figures to remain lower than the levels of competitors. As a result, the group maintains a significant level of coverage and available generic provisions. The group’s ratio of non-performing loans (NPLs) was 3.55% at the end of 2010, up from 3.24% at the end of 2009 but reflecting a slower pace of growth in this ratio in the last few years. NPLs declined in Santander consumer Finance, Brazil and Sovereign and rose in businesses in Spain. NPL coverage was 72.7% compared to 75.3% at the end of 2009. GRUPO SANTANDER: RISK, NPLS, COVERAGE, PROVISIONS AND COST OF CREDIT Million euros credit risk Spec. prov net with customers * NPL ratio coverage recovered write-offs ** credit cost (million euros) % % (million euros) (% of risk)3 2010 2009 2010 2009 2010 2009 2010 2009 2010 2 2009 1 Continental Europe 370,673 366,970 4.34 3.64 71.4 76.6 6,190 5,084 1.62 1.39 Santander Branch Network 126,705 129,099 5.52 4.38 51.8 64.9 2,454 1,851 1.89 1.41 Banesto 86,213 86,681 4.11 2.97 54.4 64.1 1,272 737 1.52 0.89 Santander consumer Finance 67,820 60,214 4.95 5.39 128.4 96.8 1,884 2,005 2.85 3.38 Portugal 32,265 34,501 2.90 2.27 60.0 64.6 105 95 0.30 0.27 United Kingdom 244,707 238,215 1.76 1.71 45.8 43.8 826 1,018 0.34 0.43 Latin America 149,333 117,146 4.11 4.25 103.6 105.2 4,758 5,053 3.53 4.44 Brazil 84,440 65,611 4.91 5.27 100.5 99.2 3,703 3,537 4.93 5.88 Mexico 16,432 12,676 1.84 1.84 214.9 264.4 469 824 3.12 6.13 chile 28,858 21,384 3.74 3.20 88.7 89.0 390 402 1.57 1.98 Puerto Rico 4,360 4,132 10.59 9.60 57.5 53.3 143 89 3.22 1.99 colombia 2,275 1,719 1.56 1.83 199.6 187.5 15 31 0.68 1.94 Argentina 4,097 2,936 1.69 2.60 149.1 141.0 26 91 0.72 2.99 Sovereign Rest 40,604 38,770 4.61 5.35 75.4 62.5 479 578 1.16 Total Group 804,036 758,347 3.55 3.24 72.7 75.3 12,342 11,760 1.56 1.57 Memo item Spain 283,424 284,307 4.24 3.41 57.9 73.4 4,352 3,497 1.53 1.20 * includes gross customer loans, guarantees, documentary credits and retail segment derivatives (EcR EUR 2,375 million). ** Bad debts recovered. 1. Excludes Sovereign 2. Excludes the incorporation of Aig in Santander consumer Finance Poland. 3. (Specific allowances - recovery of bad debts)/ Total average credit risk. ANNUAL REPORT 2010 163
  • 166.
    C. DISTRIBUTION OFCREDIT RISK The charts below show the diversification of Santander’s loans by countries and customer segments. The group is diversified and focused on its main markets. grupo Santander’s profile is essentially retail (86.3% retail banking), and most portfolios are products with a real guarantee (e.g. mortgages). DISTRIBUTION OF CREDIT RISK % By gEOgRAPHic AREA By TyPE OF RiSk Spain 33% Others 2% individuals 57% Public sector Others 9% 3% United States 5% global wholesale 14% Portugal 4% Uk 30% Latin America 19 % companies and SMEs 24% The distribution by geographic area and product of lending in the segment of standardised risks is set out below. STANDARDISED % By gEOgRAPHic AREA By PRODUcT Uk 44% Mortgages 66% SMEs and others Santander 8% consumer Finance 14% cards 3% United States 3% Spain 18% consumer 23% Latin America 16% Portugal 4% 164 ANNUAL REPORT 2010
  • 167.
    3.3 METRICS AND B. PARAMETERS OF CREDIT RISK The assessment of a customer or operation, through ratings or MEASUREMENT TOOLS scorings, constitutes a judgement of the credit quality, which is quantified via probability of default (PD). A. RATING TOOLS The group has been using since 1993 its own models for As well as evaluating the customer, quantifying credit risk assigning solvency and internal ratings, which measure the requires other parameters to be estimated such as exposure at degree of risk of a client or transaction. Each rating or scoring default (EaD) and the percentage of EaD that might not be corresponds to a certain probability of default or non-payment, recovered (loss given default or LgD). Other aspects are also the result of the entity’s past experience, except for some included such as quantifying off-balance sheet exposures, which termed low default portfolios. The group has around 200 depend on the type of product, or analysis of expected internal rating models for risk admission and monitoring. recoveries, related to the guarantees existing and other features of the operation: type of product, maturity, etc. global rating tools are used for the segments of sovereign risk, financial institutions and global wholesale banking. Their These factors comprise the main credit risk parameters. Their management is centralised in the group, both for determining combination enables the probable or expected loss (EL) to be their rating as well monitoring the risk. These tools assign a calculated. This loss is considered as one more cost of the rating for each customer, based on balance sheet ratios or activity as it reflects the risk premium and should be macroeconomic variables, and supplemented by the expert view incorporated into the price of operations. of an analyst. The following charts show the distribution of failed consumer in the case of companies and institutions under individualised loans and mortgages since 2001 on the basis of the percentage management, the parent company of grupo Santander has recovered after discounting all the costs – including the financial defined a single methodology for formulating a rating in each or of opportunity – of the recovery process. country. The rating is determined by an automatic model which reflects a first intervention by the analyst and which can or not be later complemented. The automatic model determines the rating in two phases, one quantitative and the other qualitative based on a corrective questionnaire which enables the analyst to modify the automatic scoring by a maximum of ±2 points of rating. The quantitative rating is determined by analysing the credit performance of a sample of customers and the correlation SPAIN-PARENT BANK. MORTGAGES with their financial statements. The questionnaire has 24 Distribution of operations by the percentage recovered questions divided into six areas of assessment. The automatic 70% rating (quantitative +corrective questionnaire) can be changed 60% by an analyst by writing over it or by using a manual assessment model. 50% % operations The ratings accorded to customers are regularly reviewed, 40% incorporating new financial information available and the 30% experience in the development of the banking relation. The regularity of the reviews increases in the case of clients who 20% reach certain levels in the automatic warning systems and in 10% those classified as special watch. The rating tools are also reviewed so that their accuracy can be fine-tuned. 0% >10%& >20%& >30%& >40%& >50%& >60%& >70%& >80%& <=10% <=20% <=30% <=40% <=50% <=60% <=70% <=80% <=90% >90% During 2010 the quantitative model for rating wholesale banking was adjusted and new expert rating models developed % recovered for funds, fund mangers and leveraged buy outs (LBOs). in the case of standardised risks, both for transactions with SPAIN- PARENT BANK. CONSUMER-RETAIL Distribution of operations by the percentage recovered companies as well as individuals, there are scoring tools which automatically assess the operations. 70% 60% These admission systems are complemented by performance assessment models which enable the risk assumed to be better 50% % operations predicted. They are used for both preventative activities as well as sales. 40% 30% 20% 10% 0% >10%& >20%& >30%& >40%& >50%& >60%& >70%& >80%& <=10% <=20% <=30% <=40% <=50% <=60% <=70% <=80% <=90% >90% % recovered ANNUAL REPORT 2010 165
  • 168.
    The risk parametersalso calculate the regulatory capital in C. MASTER SCALE OF GLOBAL RATINGS accordance with the rules of the new Basel capital Accord (BiS The following tables are used to calculate regulatory capital. ii). The regulatory capital is the difference between the They assign a PD on the basis of the internal rating, with a unexpected and the expected loss. minimum value of 0.03%. The unexpected loss is the basis for calculating the capital and These PDs are applied uniformly throughout the group in makes reference to a very high level of loss, but not very accordance with the global management of these portfolios. probable, not considered recurrent and which must be met As can be seen, the PD assigned to the internal rating is not with equity. exactly equal for a same rating in both portfolios, although it is very similar in the tranches where most of the exposure is in portfolios where the internal experience of defaults is scant, concentrated (i.e. in tranches of rating of more than six). such as banks, sovereigns or global wholesale banking, estimates of the parameters come from alternative sources: market prices or studies by external agencies which draw on the shared experience of a sufficient number of institutions. These REGULATORY CAPITAL portfolios are called low default portfolios. PD For the rest of portfolios, estimates are based on the institution’s internal experience. The PD is calculated by internal Wholesale observing NPL entries and putting them in relation to the final rating Banking Banks Sovereigns rating assigned to the customer or with the scoring assigned to 8.5 to 9.3 0.030% 0.030% 0.030% the operations. 8.0 to 8.5 0.049% 0.039% 0.045% The LgD calculation is based on observing the recovery process 7.5 to 8.0 0.077% 0.066% 0.072% of operations not fulfilled, taking into account not only the 0.123% 0.111% 7.0 to 7.5 0.115% revenues and costs associated with this process, but also the moment when they are produced and the indirect costs incurred 6.5 to 7.0 0.195% 0.186% 0.184% in recovery activity. 6.0 to 6.5 0.311% 0.311% 0.293% 5.5 to 6.0 0.494% 0.521% 0.468% The estimation of the EaD comes from comparing the use of the 5.0 to 5.5 0.786% 0.874% 0.746% lines committed at the moment of default and a normal situation, in order to identify the real consumption of the lines 4.5 to 5.0 1.251% 1.465% 1.189% at the time of default. 4.0 to 4.5 1.989% 2.456% 1.896% 3.5 to 4.0 3.163% 4.117% 3.022% The parameters estimated for global portfolios are the same for 3.0 to 3.5 5.031% 6.901% 4.818% all the group’s units. A financial institution with a rating of 8.5 will have the same PD regardless of the unit in which its 2.5 to 3.0 8.002% 11.569% 7.681% exposure is recorded. On the other hand, retail portfolios have 2.0 to 2.5 12.727% 19.393% 12.246% specific scoring systems in each unit of the group. This requires 20.241% 32.509% 1.5 to 2.0 19.524% separate estimates and specific assignment in each case. < 1.5 32.193% 54.496% 31.126% The parameters are then assigned to the operations present in the balance sheet of units in order to calculate the expected losses and the capital requirements associated with their exposure. 166 ANNUAL REPORT 2010
  • 169.
    D. DISTRIBUTION OFEAD AND 3.4. LOSS OBSERVED: EXPECTED LOSS (EL) ASSOCIATED The table below sets out the distribution by segments of the MEASUREMENTS OF CREDIT COST outstanding credit exposure to customers in terms of EaD. PD, As well as using these advanced models, other usual measures LgD and EL. Approximately 77% of total risk with clients are employed which provide prudent and effective management (excluding sovereign, counterparty risks and other assets) of credit risk on the basis of the loss observed. corresponds to companies, SMEs and loans to individuals, underlining the retail focus of business and of Santander’s risks. grupo Santander’s cost of credit is measured by various means: The expected loss from customer exposure is 1.39% (1.10% for change in net entries (final doubtful loans –initial doubtful loans the group’s total credit exposure), which can be considered as a +write offs –recovered write offs), net loan-loss provisions medium-to-low risk profile. (net specific provisions – recovered write-offs) and net write-offs (write offs –recovered write-offs). SEGMENTATION OF CREDIT RISK EXPOSURE GRUPO SANTANDER’S TOTAL COST OF CREDIT Million euros and % % of average portfolio Average Average EAD 1 % PD LgD EL Average 2002-2010 change in net entries: 0,89% Sovereign debt 160,764 15.38% 0.14% 10.64% 0.01% Net loan-loss provisions: 0,59% counterparty 63,264 6.05% 0.41% 74.94% 0.31% Net write-offs: 0,76% Public sector 12,539 1.20% 0.73% 12.01% 0.09% 2.5% corporate 154,725 14.80% 0.90% 37.40% 0.34% 2.2% SMEs 172,547 16.51% 5.79% 31.50% 1.83% 1.9% Mortgages (individuals) 312,865 29.93% 3.20% 7.44% 0.24% consumer loans 119,921 11.47% 8.69% 54.57% 4.74% 1.6% credit cards of individuals 31,193 2.98% 5.46% 63.74% 3.48% 1.3% Other assets 17,361 1.66% 1.83% 28.09% 0.51% 1.0% Memorandum item customers2 803,791 76.90% 4.18% 33.31% 1.39% 0.7% Total 1,045,180 100.00% 3.29% 33.44% 1.10% 0.4% Data at December 2010 1. Excluding doubtful loans 0.1% 2. Excluding sovereign debt, banks and other financial entities and other assets. Dec. 02 Dec. 03 Dec. 04 Dec. 05 Dec. 06 Dec. 07 Dec. 08 Dec. 09 Dec. 10 The data for 2009 reflects the incorporation of A&L and in 2010 Sovereign. The three approaches measure the same reality and, consequently, converge in the long term although they represent successive moments in credit cost measurement: flows of non-performing loans (changes in net entries) coverage of doubtful loans (net loan-loss provisions, NLLPs) and becoming write offs (net write-offs), respectively. And this without detriment that in the long term and within the same economic cycle, the three show differences at certain times, particularly significant at the start of a change of cycle. These differences are due to the various moments at which the losses are calculated, which are basically determined by accounting rules (for example, mortgages have a calendar of coverage and become write-offs more slowly than consumer loans). in addition, the analysis can be complicated by changes in the policy of coverage and entry into write offs, composition of the portfolio, doubtful loans of entities acquired, changes in accounting rules, sale of portfolios, etc. ANNUAL REPORT 2010 167
  • 170.
    The following chartsreflect the cost of grupo Santander’s credit risk in its main areas of activity in 2010 and the comparison with prior years, measured in various ways: NET ENTRIES change in doubtful loans plus net write-offs (% of average balances) 6.25 2006 2007 2008 2009 2010 4.67 2.61 2.85 2.35 1.73 1.62 1.67 1.93 1.49 1.41 1.57 1.34 1.17 1.37 1.36 0.70 0.53 0.69 0.40 0.16 0.34 0.21 0.23 0.37 group Spain Uk Rest of Europe Latin America NET LOAN-LOSS PROVISIONS Net specific provisions less recovered write offs 4.91 (% of average balances) 2006 2007 2008 2009 2010 3.70 3.86 2.28 1.57 1.56 1.51 1.16 1.18 0.95 1.18 1.60 0.73 0.55 0.44 0.65 0.32 0.50 0.43 0.46 0.06 0.15 0.20 0.23 0.25 group Spain Uk Rest of Europe Latin America NET WRITE-OFFS Write-offs less recovery of write-offs (% of average balances) 4.56 3.68 2006 2007 2008 2009 2010 2.44 1.77 1.67 1.17 1.23 0.72 0.73 0.91 0.43 0.55 0.52 0.47 0.45 0.43 0.64 0.26 0.08 0.16 0.20 0.18 0.20 0.17 0.36 group Spain Uk Rest of Europe Latin America Note: Data drawn up in accordance with legal company criteria. The figures for 2010 reflect the incorporation of Sovereign. 2008 excludes A&L and 2009 excludes Sovereign and venezuela The year-on-year change includes the exchange-rate impact which for Latin America was around -44.1% in net entries, 2.2% in net provisions and -17.2% in net write offs. The general trend over the past few years has been to maintain the cost of Santander’s credit at low levels. in 2010, there was a small decline of one basis point in the cost of credit as a result of the still significant deterioration of the economic environment and the mix of retail portfolios which, although with a higher expected loss, have higher levels of direct and indirect profitability and a more predictable nature of risk. These portfolios performed well during the year, particularly in Latin America, which contained the amount of provisions made. 168 ANNUAL REPORT 2010
  • 171.
    3.5 CREDIT RISKCYCLE B. RISK STUDY AND PROCESS OF CREDIT RATING The study of risk is obviously a prior requirement for authorising Risk management consists of identifying, measuring, analysing, customer operations by the group. it consists of analysing the controlling, negotiating and deciding the risks incurred by the capacity of the customer to meet their contractual obligations group’s operations. The process involves risk takers and senior with the Bank. This entails analysing the customer’s credit management, as well as the risk areas. quality, risk operations, solvency and return in accordance with the risk assumed. The process emanates from senior management, via the board of directors and the risk committee; they set the risk policies and The risk study is carried out every time there is a new customer procedures, the limits and delegating of powers, and approve or operation or with a pre-established regularity, depending on and supervise the framework of the risks function. the segment. in addition, the rating is studied and reviewed every time there is an alert or something that affects the The risk cycle has three phases: pre-sale, sale and after sale: customer/operation. • Pre-sale: this includes the planning and setting of objectives, C. DECISIONS ON OPERATIONS determining the appetite for risk, approving new products, The purpose of the decision-making process is to analyse and studying the risk and rating loans, and establishing limits. resolve operations, taking into consideration both the risk • Sale: this covers the phase of decision-making both for appetite as well as those elements of the operation that are operations under pre-classification as well as one-off relevant in the search for the balance between risk and return. transactions. The group has been using RORAc methodology (return on risk • After sale: monitoring, measurement, control and recovery adjusted capital) since 1993 to analyse and set prices for management. operations and businesses. A. PLANNING AND SETTING LIMITS D. MONITORING Setting limits is a dynamic process which identifies the group’s As well as the tasks carried out by the internal auditing division, risk appetite by discussing business proposals and the opinion the directorate general of risks, through local and global teams, of risks. controls credit quality by monitoring the risks and has the resources and specific people to do it. The global plan of limits, the document drawn up on the basis of consensus which provides complete management of the The monitoring is based on a continuous process of permanent balance sheet and of the inherent risks, establishes the risk observation, which enables incidents to be detected in advance appetite in the various factors. in the evolution of risk, operations, customers, and their environment in order to take steps to mitigate them. The The limits are based on two structures: customers/segments monitoring is conducted on the basis of customer and products. segmentation. The most basic level in individualised management is the The group has a system called companies in special watch customer and when certain features are present - generally of (FEvE) which identifies four levels on the basis of the degree of relative importance – an individual limit (pre-classification) is set. concern arising from the circumstances observed (extinguish, secure, reduce, monitor). The inclusion of a company in FEvE A pre-classification model based on a system for measuring and does not mean there have been defaults, but rather the monitoring economic capital is used for large corporate groups. advisability of adopting a specific policy toward that company A more simplified version is used for those companies which and establishing the person and time frame for it. clients in meet certain requirements (high knowledge, rating, etc). FEvE are reviewed at least every six months, and every quarter for the most serious cases. A company can end up in special in the sphere of standardised risk, the planning and setting of watch as a result of monitoring, a review conducted by internal limits is done through credit management programmes (cMPs), auditing, a decision of the person responsible for the company a document reached by consensus between the business and or the entry into functioning of the system established for risk areas and approved by the risk committee or committees automatic warnings. delegated by it. The cMPs set out the expected results of business in terms of risk and return, as well as the limits to Ratings are reviewed at least every year, but if weaknesses are which activity is subject and management of the associated detected, or on the basis of the rating, it is done more regularly. risks. As regards the risks of standardised clients, the main indicators are monitored in order to detect shifts in the performance of the loan portfolio with respect to the forecasts made in the credit management programmes. ANNUAL REPORT 2010 169
  • 172.
    FEVE DECEMBER 2010 in accordance with Bank of Spain rules, the group regards as Million euros doubtful loans those which have not been serviced for more than 90 days and includes the total debt of the customer when Total the unpaid part represents more than 25% of it or when pre- Extinguish Secure Reduce Monitor FEVE judicial actions are taken. Also considered as doubtful loans are Retail banking Spain 5,148 379 12,975 11,582 30,084 those which, without entering into non-compliance, have Banesto 8,499 460 2,720 11,116 22,795 reasonable doubts of being fully repaid. Portugal 339 69 920 1,926 3,236 The non-performing loan (NPL) ratio in Spain was 4.24%, United kingdom 236 14 933 2,318 3,502 concentrated in those sectors which were more affected by the Sovereign 2,640 231 742 1,992 5,605 economic downturn. This ratio is higher than in 2009, but is on Latin America 1,262 425 1,657 6,223 9,567 a slower growth trend as the NPL ratios of a high percentage of credit portfolios in Spain were stable during 2010. Total 18,124 1,577 19,930 35,157 74,789 The NPL ratio in Spain is well below the aggregate of Note: 2010 shows the application of the FEvE tool in Sovereign. The classification of risk in FEvE is independent in each institution and responds to the various criteria for classification of these risks and commercial banks as a whole, according to the Bank of Spain, management of them on the basis of the category in which they are classified. underscoring the group’s traditionally prudent risk management criteria. Credit exposure in Spain Total provisions for covering the possible loss of these risks represent coverage of 58%. a. General view of the portfolio grupo Santander’s credit portfolio at the end of 2010 stood at in addition, and in line with the Bank of Spain’s rules and EUR 236,000 million. if we mainly add to this figure guarantees indications, loans classified as substandard are those which, and documentary credits the total credit risk of Santander’s while being up to date on payments and with no reason to be businesses in Spain amounted to EUR 283,424 million, 35% of classified as doubtful, shows some weakness which could lead the group’s total and with an appropriate level of to non-payments and losses, as they involve the weakest diversification, both by product as well as customer segment. customers from certain collectives or sectors affected by The credit risk of commercial networks of the main businesses in extraordinary circumstances of greater risk. This category has Spain (Santander Branch Network, Banesto, Banif and Santander EUR 10,808 million of classified risks. consumer) accounted for 26% of the group’s total, distributed as follows: SEGMENTATION OF THE CREDIT RISK OF COMMERCIAL MONTHLY EVOLUTION OF NON-PERFORMING LOANS 2008-2010 NETWORKS IN SPAIN % % comps. indiv.man. Banks (total system) 44% Total group in Spain Other segments 6.00 5.83 4% 5.50 5.34 5.00 5.02 institutions 7% Standardised 4.50 companies 4% 4.00 4.02 Other 4.24 3.50 (individuals) 2% 2.80 3.71 3.00 consumer 6% 3.41 Mortgages 33% 2.50 2.00 2.72 1.50 1.95 includes the commercial networks of the main businesses in Spain (Santander Retail Banking, Banesto, 1.00 Banif and Santander consumer). 0.50 Dec. 08 Feb. 09 Apr. 09 Jun. 09 Aug. 09 Oct. 09 Dec. 09 Feb. 10 Apr. 10 Jun. 10 Aug. 10 Oct. 10 Dec. 10 170 ANNUAL REPORT 2010
  • 173.
    b. Analysis ofthe mortgage portfolio of LOAN TO VALUE individual customers LTv < 50% 51% in line with the Bank of Spain’s guidelines for greater 50% < LTv < 80% 2% transparency in information for the market regarding property, 80% < LTv < 100% the table below sets out the loans granted to households to buy LTv > 100% homes by the main businesses in Spain. This portfolio, one of 13% the main ones, stood at EUR 61,936 million at the end of 2010 (26% of lending in Spain). Of this, EUR 61,387 million had mortgage guarantees. LOANS TO HOUSEHOLDS FOR THE ACQUISITION OF PROPERTY 34% Million euros gross amount Of which: doubtful AFFORDABILITY RATE Loans to acquire property 61,936 1,388 Average 29% 52% Without mortgage guarantee 549 30 TE < 30% With mortgage guarantee 61,387 1,358 30% < TE < 40% TE > 40% 23% The NPL ratio of the portfolio with mortgage guarantee improved notably at the end of 2010, in a negative macroeconomic environment, to 2.2% from 2.5% a year earlier. The portfolio of mortgages for property in Spain held its medium-low risk profile and had limited expectations of further 25% deterioration: Note: The affordability rates does not include Banif. • All mortgages pay principal from the very first day of Loan to value: relation between the amount of the loan and the appraised value of the mortgaged the operation. property. On the basis of management criteria, the average LTv of the portfolio of mortgages for individuals to buy homes was 50.5% • The usual practice is to repay it ahead of time and so Affordability rate: relation between the annual payments and the customer’s net income. the average life of the operation is well below that of the contract. • The borrower responds with all assets and not just the property. • Most mortgages have variable interest rates with spreads over Euribor. Despite the economy’s situation and its gradual deterioration during 2010, which reduced the demand for loans in 2009 • High quality of collateral: 94% of the portfolio is financing and in 2010, the measures taken in admission produced an for the first residence. increasingly better evolution of vintages. For new loans between • 85% of the portfolio has a LTv of less than 80%. 2008 and 2010 in the Santander Branch Network in Spain, the maturity of vintages is shown below: • The average affordability rate remained at close to 29%. LOAN TO VALUE RANGES. TOTAL EVOLUTION OF THE DEFAULT RATE BY THE NUMBER Million euros OF OPERATIONS BY VINTAGES LTv < 50% 50% < LTv < 80% 80% < LTv < 100% LTv > 100% 5,0% gross amount 20,583 31,519 8,299 986 4,0% Of which: doubtful 247 638 440 33 3,0% 2,0% 2008-1 2008-2 2.55% 1,0% 2008-3 1.53% 1.15% 2009-4 2009-2 2009-1 2008-4 2010-4 2010-3 2010-2 2010-1 0.44% 0.60% 0.01% 0.00% 0.03% 0.09% 0.17% 2009-3 0.29% 0,0% 0.10% 5 10 15 20 25 30 35 40 ANNUAL REPORT 2010 171
  • 174.
    c. Financing providedfor construction A particularly important product in the real estate promotion and real estate development portfolio is mortgage loans to real estate developers. At the end Lending to these sectors, in line with the Bank of Spain’s of 2010, this amounted to EUR 9,854 million and represented guidelines regarding classification by purpose, amounted in around 1.3% of grupo Santander’s total credit portfolio. The Spain to EUR 27,334 million (3.7% of the group’s total lending), exposure to this product was 9.3% less than in 2009 and in 12% lower than in 2009 and 27% below 2008 using like-for- 2010 it dropped a further 20%. like criteria. This means a market share of around 10%, substantially lower than that of the group’s combined At the end of 2010, this portfolio of loans had a larger number businesses in Spain (15%). of customers, with a low degree of concentration and an appropriate level of guarantees and coverage. The reduction in risk was largely due to a strict policy in admitting new loans with the consequent amortisation of the The situation was as follows: credit operations of the portfolio outstanding and proactive • Developments completed and with the final certificate management of existing risks. of work: 72.5% of outstanding risk. The non-performing loan ratio of this portfolio at the end of • Developments more than 80% completed: 2010 was 17%, underscoring the deterioration in this sector. 12.8% of outstanding risk. This is higher than the rest of the segments of the portfolio in Spain and shows the group’s conservative policy of anticipation • Developments between 50% and 80% completed: in classifying bad loans. More than 75% of the EUR 9,568 3.1% of outstanding risk. million classified as doubtful and sub-standard loans was up-to- • Developments less than 50% completed: 11.5%. date with payments. coverage with specific provisions was 28%, in accordance with the regulations. Furthermore, close to 85% of this financing of real estate developments is totally completed or close to it, having overcome the risk of construction. FINANCING FOR CONSTRUCTION AND REAL ESTATE DEVELOPMENT: DOUBTFUL AND SUBSTANDARD LOANS Policies and strategies established for Million euros management of these risks Risk coverage The policies for managing this portfolio, periodically reviewed Amount Amount % and approved by the group’s senior management, are focused on reducing and securing the current exposure, without Doubtful 4,636 1,321 29 overlooking new business identified as viable. Substandard 4,932 569 12 generic coverage 768 in order to tend to the management of this credit exposure, grupo Santander has specialised teams that not only form part Total 9,568 2,658 28 of the risk areas, but also supplement its management and cover the whole life cycle of these operations: their commercial management, juridical treatment, the eventuality of recovery A large part of the exposure to the construction and real estate management, etc. activity sectors are loans with mortgage guarantee (EUR 21,210 million, 78% of the portfolio). Their distribution is shown below. Anticipative management of these risks has enabled the group to significantly reduce its exposure (by 27% between 2008 and 2010), with a granular portfolio, geographically diversified and CREDIT EXPOSURE TO THE CONSTRUCTION where financing of second homes accounts for a very small AND REAL ESTATE DEVELOPMENT SECTOR Million euros proportion of the portfolio. Mortgages for land that is not developed accounts for only 4.2% of the exposure to land; Finished buildings the rest is already classified as developed land or which can (12,709) 47% be developed. Total: 27,334 mill. in the case of property financing projects where the work is Land that can be already completed, the significant reduction in the exposure developed (-20% en 2010) is backed by various actions. As well the (2,023) 7% already existing specialised channels, campaigns were Developed land conducted supported by specific managers for this function 3,678) 13% who, in the case of the Santander Branch Network, were directly supervised by the business area of recoveries, where Without mortgage direct management of them with real estate promoters and Buildings under guarantee construction Other land (6,124) 22% buyers, applying criteria of reducing sale prices and adapting (2,548) 10% (252) 1% the financing conditions to buyers’ needs, enabled us to make subrogations of the already existing loans. These subrogations enable risk to be diversified in a business segment that has a much lower non-performing loan ratio. 172 ANNUAL REPORT 2010
  • 175.
    The admission processesare managed by specialised teams who d. Real estate acquired and foreclosed work in direct coordination with the commercial teams. The One of the mechanisms used in Spain to manage risk efficiently policies and criteria are clearly defined: is the purchase and foreclosure of real estate assets. The net balance of these assets at the end of 2010 was EUR 5,195 • Promoters with a comfortable solvency profile and with a million (gross amount of EUR 7,509 million), with coverage proven track record in the market. of 31% that was above the minimum required by the Bank of • Strict criteria of the parameters inherent in operations: Spain and in line with the group’s usual criteria of prudence. exclusive financing for the cost of construction, high percentages of accredited sales, first residence financing, etc. PROPERTIES ACQUIRED AND FORECLOSED • Support for officially protected homes with percentages of Billion euros accredited sales. coverage 7.5 • Financing of restricted land, tied to the re-establishment of the Net volume 6.5 adequate level of coverage of already existing financing or 2.3 increase in guarantees. 2.0 4.8 in addition to permanent control by the group’s risk monitoring 0.5 teams, there is a technical unit specialised in monitoring and 4.3 4.5 5.2 controlling this portfolio with regard to the progress in the work, compliance with planning and control of sales, as well as validation and control of the disbursement of certifications. Santander has specific tools created for this function. All the mortgage loan distributions, disposal of amounts for all concepts, changes to the grace period are authorised on a 2008 2009 2010 centralised basis. PROPERTIES ACQUIRED AND FORECLOSED: in the case of projects in the phase of construction that show COVERAGE RATIO 31% some kind of problem, the criterion followed is to guarantee 31% completion of the work in order to have finished buildings for sale in the market. in order to achieve this, each project is individually analysed so that for each case the most effective series of measures are adopted (structures of payment to suppliers that guarantee completion of the work, establishment 10% of specific calendars, etc). Those cases that require analysis of some type of restructuring of the exposure are carried out with the joint participation of the risk and recoveries areas, anticipating non-payment 2008 2009 2010 situations, with criteria centred on providing projects with a payments structure that enables the work to be completed. The group views acquisition as an efficient tool for resolving These operations are authorised on a centralised basis and by unpaid loans as opposed to initiating legal proceedings for expert teams who ensure that the strictest criteria are applied in the following reasons: accordance with the group’s prudent risk management. Possible • The immediate availability of these assets as against the losses are recognised when identified, classifying the positions greater duration of legal processes. without waiting for non-payment according to the regulation • cost savings. established by the Bank of Spain, and with the corresponding provision that covers the expected loss of these positions. • it facilitates the viability of companies as liquidity is injected into their activity. Real estate assets on the balance sheet are managed by • Reduction in the possible loss of value in the loans of companies specialised in selling property (Altamira Santander these clients. Real Estate and Promodomus) and complemented by the • Reduction in the exposure and of the expected loss. structure of the commercial network. Sales are conducted with price reduction levels in line with the market’s situation. The table below sets out the situation at the end of 2010 regarding acquired and foreclosed properties by the main businesses in Spain: SPAIN: PROPERTIES ACQUIRED AND FORECLOSED Million euros gross amount Allowance Net amount Finished buildings 3,098 25% 2,339 Buildings under construction 564 25% 425 Developed land 2,307 35% 1,506 Land that can be developed 1,308 40% 787 Other land 232 40% 138 Total 7,509 31% 5,195 ANNUAL REPORT 2010 173
  • 176.
    The stock ofthis portfolio was 44% lower in 2010 than in 2009, in addition to close monitoring of these portfolios by the due to the combination of lower gross entries of acquired group’s risk management teams, both the various supervisory properties (-20%) and a significant increase in sales (+31%). authorities to which the group is subject as well as internal The property assets are managed by companies specialised in auditing pay particular attention to controlling and adequately sales and aided by the structure of the commercial network assessing the refinanced portfolios. which enables the assets to be placed in the market with acceptable levels of losses. Refinancing does not mean the release of provisions, maintaining the classification of risk in bad loans, unless: SPAIN: PROPERTIES ACQUIRED AND FORECLOSED Billion euros • They meet the criteria in the regulations based on Bank of 2010 2009 Spain circulars (payment of ordinary interest pending and, gross entries 2.1 2.5 -20% in any case, contribution of new effective guarantees or a Sales 1.1 0.8 31% reasonable certainty of payment capacity). Difference 1.0 1.7 -44% • They fulfil the precautions which under prudent criteria are set out in the group’s corporate policy (sustained payment for Of the total amount, 41% are completed buildings available for between 3 and 12 months, on the basis of the operation’s sale and of the total land assets 95% is developed or can be features and the type of guarantees). developed, with an appropriate coverage level of 37%. in the case of Spain (Santander networks plus Banesto), The information mentioned in points b, c and d under the the balance at the end of 2010 of commercial refinancing of specific formats set out by the Bank of Spain in its note of positions previously recorded as doubtful loans was EUR 2,258 January 18, 2011 is reflected in note 54 of the audited report million, of which EUR 1,675 million were company operations and consolidated financial accounts that form part of Banco and EUR 583 million with individuals. Santander’s 2010 annual report. Of the total refinancing, EUR 1,313 million met the e. Refinancing reclassification requirements set by the Bank of Spain in Refinancing is one of the management tools to adjust maturity appendix ix of its circular 4/2004. structures of principal and interest payments to the new payment capacity of customers. At the end of 2010, a high percentage (84%) of refinancing was in a normal situation as regards compliance with obligations. At grupo Santander, these operations are restricted, on the basis of rigorous and selective criteria, to: Analysis of the UK’s mortgage portfolio As well as the risk portfolio in Spain, of note in standardised • viable operations, which in origin do not have very severe risks and because of its importance in grupo Santander's total deterioration; lending is the Uk mortgage portfolio. • where the customer intends to pay; This portfolio consists of first time buyer mortgages for • which improve the Bank’s position in terms of expected loss; properties in the Uk, as there are no operations that entail • and where the refinancing does not discourage the additional second or successive charges on mortgaged real estate. effort by the customer. Most of the credit exposure is concentrated in greater London, The group’s corporate policy of restructurings ensures where house prices have been more stable even during the homogeneous and rigorous application of these criteria in the period of economic downturn. various units: • The customer’s risk is assessed overall, irrespective of the Authorised valuers assess all properties before each operation is situation of each individual contract, and all the risks are approved, in accordance with the principles established by the provided with the highest possible level of guarantees. group for its risk management and in line with the methodology defined by the Royal institution of chartered Surveyors. • The risk with the customer is not increased. • All the alternatives to the refinancing and its effects are The portfolio performed favourably during 2010. its non- evaluated, ensuring that the results of it are better than what performing loan ratio at the end of the year was 1.41% might have been obtained if nothing was done. compared to 1.52% in 2009, the result of monitoring and constant control as well as strict lending policies which include, • Particular attention is paid to collateral and the possible future among other measures, maximum loan to value (LTv) criteria in evolution of its value. relation to properties in guarantee. On the basis of these • its use is restricted, giving precedence to the renewal of risks policies, no mortgages have been granted since 2009 with LTvs with additional efforts by the customer and avoiding situations of more than 100% and only 0.1% of those granted during this that only postpone the problem. period have an LTv of more than 90%. The average LTv is 51%. • Monitoring of these operations is done in a special way and is There is no risk appetite for subprime mortgages. The credit risk maintained until the debt is totally extinguished. policies in force explicitly prohibit this type of loan and establish • A very detailed analysis, case by case, is made of individually demanding requirements for credit quality, both regarding the managed customers, where the expert view enables the most operations and customers. Buy-to-let loans with a higher risk appropriate conditions to be adjusted. profile account for barely 1% of the total portfolio. 174 ANNUAL REPORT 2010
  • 177.
    The following chartsshow the structure in LTv terms for the E. CONTROL FUNCTION whole portfolio of residential mortgages and the distribution in The management process is also aided during the various terms of the income multiple: phases of the risk cycle by the function of control. This provides a global vision of the group’s portfolio of loans with the sufficient level of detail, enabling the current risk position and its LOAN TO VALUE 1 evolution to be assessed. average : 51% 63% LTv < 75% The objective of the control model is to assess the risk of 75% < LTv < 90% solvency assumed in order to detect focuses of attention and LTv > 90% 12% propose measures that tend to correct eventual deterioration. it is therefore vital that to the control activity in the proper sense of the word is added an analysis component that facilitates proactivity regarding early detection of problems and the subsequent recommendation of action plans. 25% The evolution of risk with regard to budgets, limits and standards of reference is constantly and systematically controlled and the impact assessed in the face of future situations, INCOME MULTIPLE both exogenous and arising from strategic decisions, in order average 3 times 39% to establish measures that put the profile and volume of the portfolio of risks within the parameters set by the group. < 3,0 3,0 - 3,99 The control function is conducted by assessing risks from various > 4,0 perspectives and establishing as the main elements control by countries, business areas, management models, products and processes. This facilitates the detection of focuses of specific 35% attention for decision-making. 26% One of the focuses in 2010 was to strengthen the vision of the (1) indexed. various units from a local control standpoint, deepening their (*) Loan to value: the relation between the loan and the appraised value of the context of business, legislation, strategy, local regulations and mortgaged property. evolution of their portfolios. The homogeneity of the control income multiple: affordability rate (relation between the customer’s uncommitted net income and the annual loan payments). The figures in the chart are only for loans model was consolidated, setting standards for the flow of made in 2010. information, analysis by portfolios and monitoring of the main management metrics, which enable the risk of each business UNITED KINGDOM: PORTFOLIO OF RESIDENTIAL MORTGAGES segment to be constantly assessed. Million euros December 2010 in 2006, under the corporate framework established in the group for complying with the Sarbanes-Oxley Act, a tool was Portfolio % of loans created in the group’s intranet to document and certify all sub Residential mortgages 192,590 78.6 processes, operational risks and controls that mitigate them. The First home buyer 34,666 14.2 Risks Division, as part of the group, evaluates every year the Mover 75,110 30.7 efficiency of internal control of its activities. Remortgage 82,814 33.8 Analysis of scenarios First Time Buyer: customers who buy a home for the first time. As part of its management of monitoring and continuous Mover: customers who change home with or without changing the bank that granted the mortgage. control, the group conducts simulations of its portfolio using Remortgage: customers who transfer their mortgage from another bank. adverse scenarios and stress tests in order to assess the group’s solvency in the face of certain situations in the future. These simulations cover all the group’s most relevant portfolios and An additional indicator of the portfolio’s good performance is are done systematically using a corporate methodology which: the low volume of properties that have been repossessed, which • Determines the sensitivity of risk factors (PD, LgD) to certain at the end of 2010 amounted to EUR 143 million (a mere macroeconomic variables. 0.07% of the total mortgage exposure). The efficient management of these cases and the existence of a dynamic • Defines reference scenarios (at the global level as well as for market for this type of property, which enables sales to take each of the group’s units). place in a short period, contribute to the good results obtained. • identifies rupture scenarios (levels as of which the sensitivity of risk factors to macroeconomic variables is more accentuated) and the distance of these scenarios from the current situation and the reference scenarios. • Estimates the expected loss of each scenario and the evolution of the risk profile of each portfolio to movements in certain macroeconomic variables. ANNUAL REPORT 2010 175
  • 178.
    The simulation modelsuse the data of a complete economic evolution compared to the end of 2009 (the starting point) in cycle to measure the performance of risk factors in the face two types of scenarios: benchmark and the other in adverse of changes in macroeconomic variables. circumstances including the impact of sovereign debt shocks. in the wholesale sphere, as they are low default portfolios, in the case of Santander, the stress tests showed the strength there is insufficient data on defaults to conduct this and validity of its business model. Even in the most adverse measurement and expert criteria are used. scenario, the group is able to generate profits, distribute dividends and continue to generate capital, keeping its Tier 1 The scenarios take into account the vision of each unit as well capital ratio intact at 10.0% (surplus of EUR 23,131 million over as the global vision. The macroeconomic variables include: the 6% benchmark ratio). • The unemployment rate These results compare very well with those of our competitors. • Property prices On the basis of the like-for-like information supplied by cEBS, Santander is the European bank that would generate the • gDP highest profits before tax, and its return on risk assets and on • interest rates Tier 1 capital would be the best of the 25 largest banks analysed. • inflation The analysis of scenarios enables senior management to better F. RECOVERY ACTIVITY understand the foreseeable evolution of the portfolio in the face Recovery management in 2010 continued to be a strategic of market conditions and changing situations, and it is a key element in the Bank’s risk management. tool for assessing the sufficiency of the provisions established for stress scenarios. in order to carry out this function, which is essentially a business activity, the Bank has a corporate model of management which The analysis of the baseline and acid scenarios for the whole sets the guidelines and general rules to be applied in the group and for each unit, with a time frame of five years, shows countries where it operates, with the necessary adjustments on the strength of the balance sheet in the face of different market the basis of local business models and the economic situation of and macroeconomic situations. the respective environments. EU Stress test exercises This corporate model basically establishes procedures and in order to increase the confidence in European banks and raise management circuits on the basis of customers’ features, the degree of transparency and standardisation in the financial making a distinction between massive level management with information supplied to the market, the committee of European the use of multiple channels and a more personalised Banking Supervisors (cEBS) published the results of the stress management with specific managers assigned. tests conducted during the first half of 2009 on 91 banking groups accounting for at least 50% of the domestic banking As a result of this segmentation in management, various system of 20 European countries. mechanisms were established to ensure recovery management of customers in non-payment situations from the earliest phases carried out in coordination with the European central Bank and to the writing off of the debt. The sphere of action of the the European commission, as designers of the scenarios, and recovery function begins the very first day of non-payment of countries’ banking authorities, as those responsible for the loan and ends when it has been paid or reclassified. conducting the analysis, the stress tests of cEBS analysed the Preventative management is conducted in some segments level of capital the banks would reach in 2011 and their before a non-payment situation arises. STRESS TEST RESULTS Million euros Benchmark Adverse scenario scenario Net operating income 2010-2011 49,196 43,599 Provisions at December 2009 20,779 20,779 Total 69,975 64,378 gross deterioration 2010-2011 (40,856) (50,288) Taxes (6,701) (3,114) Net surplus stress test 22,419 10,976 Dividends, generic provisions not used and others (14,555) (8,730) Change in Tier 1 capital 7,864 2,246 Risk assets 579,621 585,346 Tier 1 11,0% 10,0% Source: Bank of Spain 176 ANNUAL REPORT 2010
  • 179.
    Recovery activity, understoodas an integral business, is The distribution of the portfolio of companies by sectors is supported by constant reviewing of the management processes adequately diversified. The chart below shows the distribution and methodology. it is backed by all the group’s capacities and of the credit exposure in the group’s main units. with the participation and cooperation of other areas (commercial, resources, technology, human resources) as well as the development of technology solutions to improve DISTRIBUTION OF RISK BY SECTOR % effectiveness and efficiency. individuals 55% Santander also attaches great importance to the development Real estate activity of talent. We have a practical and hands on training plan which 8% deepens knowledge, facilitates the exchange of ideas and best commerce and repairs practices and professionally develops teams, while always 5% striving to integrate recovery activity into the group’s ordinary Transport and and commercial activity. communications 4% construction and public works 4% All these actions in 2010 to ensure an efficient recovery process enabled us to improve the ratios for the recovery of non- Elect. gas and water prod. and distr. 3% Other Rest 19% performing loans and contain the entry of new ones. There was business services a notable reduction in net entries, a trend observed on most of 2% the group’s business units. *Rest includes sectors with concentration below 2%. The results for the recovery of written-off assets were also good in 2010, as we took actions both at the level of customers in The group’s risks division works closely with the financial situations of non-payment, as well as actively managing division to actively manage credit portfolios. its activities include portfolios. All of this made possible a greater degree of recovery reducing the concentration of exposures through various in this line of activity. techniques such as using credit derivatives and securitisation to optimise the risk-return relation of the whole portfolio. 3.6 OTHER STANDPOINTS B. CREDIT RISK BY ACTIVITIES IN FINANCIAL MARKETS OF CREDIT RISK This section covers credit risk generated in treasury activities with clients, mainly credit institutions. This is developed through There are spheres and/or specific points in credit risk that financing products in the money market with different financial deserve specialised attention and which supplement global institutions, as well as derivatives to provide service to the management. group’s clients. A. RISK OF CONCENTRATION control of risk concentration is a vital part of management. Risk is controlled through an integrated system and in real time The group continuously tracks the degree of concentration of which enables us to know at any moment the exposure limit its credit risk portfolios using various criteria: geographic areas available with any counterparty, in any product and maturity and countries, economic sectors, products and groups of clients. and in all of the group’s units. The board’s risk committee establishes the policies and reviews Risk is measured by its prevailing market as well as potential the appropriate exposure limits for appropriate management of value (value of risk positions taking into account the future the degree of concentration of credit risk portfolios. variation of underlying market factors in contracts). The Equivalent credit Risk (EcR) is the Net Replacement value The group is subject to the Bank of Spain regulation on large plus the Maximum Potential value of these contracts in the risks. in accordance with circular 3/2008, no individual or future. The capital at risk or unexpected loss is also calculated economic group exposure, including all types of credit risks and (i.e. the loss which, once the expected loss is subtracted, equities, can exceed 25% of the group’s shareholders’ equity. constitutes the economic capital, net of guarantees The total of large risks (those that exceed 10% of eligible equity) and recovery). cannot be more than eight times higher than equity (excluded from this are exposures to OEcD governments and central banks). The total exposure to credit risk from activities in the financial markets was 63.2% with credit institutions. By product type, At December 31, 2010, there was only one economic group the exposure to derivatives was 52.3%, mainly products that exceeded 10% of shareholders’ funds: a Spanish without options, and 47.7% to liquidity products and traditional multinational with an internal rating equivalent to A- and which financing. represented 11.09%. After applying risk mitigation techniques and the rules for large risks, the percentage came down to Derivative operations are concentrated in high credit quality 9.28% of eligible equity. counterparties; 62.8% of risk with counterparties has a rating equal to or more than A-. The total exposure in 2010 in terms At December 31, 2010, the 20 largest economic and financial of equivalent credit risk amounted to EUR 46,893 million. groups, excluding AAA governments and sovereign securities denominated in local currency, represented 6.0% of the outstanding credit risk of the group’s clients (lending plus guarantees). ANNUAL REPORT 2010 177
  • 180.
    OTC DERIVATIVES DISTRIBUTIONBY NET REPLACEMENT VALUE AND EQUIVALENT CREDIT RISK Million euros at December 31, 2010 Total EcR Total net replacement value Trading Hedging Total Trading Hedging Total cDS protection acquired 663 134 798 178 210 388 cDS protection sold 55 2 57 -325 -33 -358 TRS total return swap 0 0 0 0 0 0 cDS options 0 0 0 0 0 0 Total credit derivatives 718 137 855 -147 177 30 Equity forwards 0 142 143 0 -286 -286 Equity options 522 1,013 1,535 -203 -362 -564 Equity swaps 0 513 513 0 165 165 Equity spot 0 0 0 0 0 0 Total equity derivatives 522 1,669 2,191 -203 -483 -685 Fixed-income forwards 56 38 94 30 1 31 Fixed-income options 0 1 1 0 0 0 Fixed-income spot 0 0 0 0 0 0 Total fixed income derivatives 56 39 95 30 1 31 Asset swaps 1,686 2,600 4,286 -1,688 389 -1,299 Exchange-rate options 304 140 443 -74 -303 -377 Exchange-rate swaps 4,353 12,045 16,398 603 1,805 2,408 Other exchange-rate derivatives 5 6 11 1 1 2 Total exchange rates 6,348 14,791 21,139 -1,159 1,893 734 Asset swaps 0 293 293 0 -52 -52 call money swaps 371 20 391 -86 -8 -94 iRS 14,935 10,439 25,375 1,008 3,170 4,178 Forward interest rates 1 4 4 0 -11 -11 Other interest-rate derivatives 916 1,423 2,339 643 -1,914 -1,271 interest rate structures 338 493 831 222 -256 -34 Total interest-rate derivatives 16,561 12,673 29,234 1,787 929 2,717 commodities 239 13 252 164 11 175 Total commodity derivatives 239 13 252 164 11 175 Total otc derivatives 24,444 29,322 53,766 473 2,529 3,002 Collateral 0 -6,873 -6,873 Total 24,444 22,449 46,893 178 ANNUAL REPORT 2010
  • 181.
    NOTIONAL OTC DERIVATIVEPRODUCTS BY MATURITY Million euros 1 year 1-5 years 5-10 years over 10 years Total REc T H Total T H Total T H Total T H Total T H Total cDS protection acquired 4 5 9 66 15 81 16 56 72 577 58 636 663 134 798 cDS protection sold 5 2 7 40 0 40 10 0 10 0 0 0 55 2 57 TRS total return swap 0 0 0 0 0 0 0 0 0 0 0 0 0 0 0 cDS options 0 0 0 0 0 0 0 0 0 0 0 0 0 0 0 Total credit derivatives 9 7 16 105 15 120 26 56 82 578 59 636 718 137 855 Equity forwards 0 142 143 0 0 0 0 0 0 0 0 0 0 142 143 Equity options 168 564 732 346 382 728 8 62 70 0 5 5 522 1,013 1,535 Equity swaps 0 163 163 0 301 301 0 3 3 0 47 47 0 513 513 Equity spot 0 0 0 0 0 0 0 0 0 0 0 0 0 0 0 Total equity derivatives 168 869 1,038 346 683 1,029 8 65 72 0 52 52 522 1,669 2,191 Fixed-income forwards 56 38 94 0 0 0 0 0 0 0 0 0 56 38 94 Fixed-income options 0 0 0 0 1 1 0 0 0 0 0 0 0 1 1 Fixed-income spot 0 0 0 0 0 0 0 0 0 0 0 0 0 0 0 Total fixed income derivatives 56 38 94 0 1 1 0 0 0 0 0 0 56 39 95 Asset swaps 1,121 2,234 3,356 491 284 775 26 79 105 48 2 50 1,686 2,600 4,286 Exchange-rate options 222 130 352 81 10 91 1 0 1 0 0 0 304 140 443 Exchange-rate swaps 1,539 2,142 3,681 1,649 5,649 7,297 1,163 1,925 3,088 2 2,329 2,331 4,353 12,045 16,398 Other exchange-rate derivatives 5 6 11 0 0 1 0 0 0 0 0 0 5 6 11 Total exchange rates 2,887 4,512 7,399 2,221 5,943 8,164 1,190 2,004 3,194 51 2,331 2,382 6,348 14,791 21,139 Asset swaps 0 1 1 0 27 27 0 48 48 0 217 217 0 293 293 call money swaps 138 18 157 223 2 225 5 0 5 5 0 5 371 20 391 iRS 374 729 1,104 3,135 3,418 6,552 3,986 2,714 6,699 7,440 3,579 11,019 14,935 10,439 25,375 Forward interest rates 1 4 4 0 0 0 0 0 0 0 0 0 1 4 4 Other interest-rate derivatives 2 197 199 41 451 492 107 384 491 766 391 1,157 916 1,423 2,339 interest rate structures 33 93 126 213 173 386 48 51 99 44 176 220 338 493 831 Total interest-rate derivatives 549 1,042 1,591 3,612 4,071 7,683 4,145 3,197 7,342 8,256 4,363 12,619 16,561 12,673 29,234 commodities 108 0 108 119 13 132 12 0 12 0 0 0 239 13 252 Total commodity derivatives 108 0 108 119 13 132 12 0 12 0 0 0 239 13 252 Total otc derivatives 3,777 6,469 10,246 6,403 10,726 17,129 5,380 5,322 10,703 8,884 6,805 15,689 24,444 29,322 53,766 Collateral 0 -6,873 -6,873 Total 24,444 22,449 46,893 H = Hedging T = Trading ANNUAL REPORT 2010 179
  • 182.
    DISTRIBUTION OF RISKIN OTC DERIVATIVES The distribution of risk in derivatives by type of counterparty is BY TYPE OF COUNTERPARTY 41% with Banks, 34% with large companies and 10% with SMEs. As regards the geographic distribution of risk, 18% is Rating % with Spanish counterparties, 20% with Uk ones (mainly AAA 11.6 operations by Santander Uk) and among the rest of areas AA 9.7 Eurooe (29%), the US (9%) and Latin America (16%). A 41.5 ACTIVITY IN CREDIT DERIVATIVES BBB 21.3 grupo Santander uses credit derivatives to cover loans, BB 13.3 customer business in financial markets and, to a lesser extent, within trading operations. The volume of this activity is small B 1.6 compared to that of our peers and, moreover, is subject to a Rest 0.9 solid environment of internal controls and minimising operational risk. The risk of these activities is controlled via a broad series of DISTRIBUTION OF RISK IN OTC DERIVATIVES BY TYPE OF COUNTERPARTY limits such as vaR, nominal by rating, sensitivity to the spread by rating and name, sensitivity to the rate of recovery and to Banks 41% correlation. Jump-to-default limits are also set by individual name. geographic area, sector and liquidity. At December 31, 2010, for the group’s trading activity, the Sovereign 12% sensitivity of lending to increases in spreads of one basis point Securitisation 1% was minus EUR 1.5 million, and the average vaR during the year Sov/pub. instit. was EUR 17.2 million. The latter was higher than in 2009 2% because of the greater volatility of credit spreads in the market. Large companies 10% in notional terms, the position in cDS incorporates EUR 89.127 corporate 34% million of acquired protection and EUR 79.764 million of sold protection. C. COUNTRY RISK DISTRIBUTION OF RISK IN OTC DERIVATIVES country risk is a credit risk component in all cross-border credit BY GEOGRAPHIC AREAS operations for circumstances different to the usual commercial risk. its main elements are sovereign risk, the risk of transfer and Rest of Europe 29% other risks which could affect international financial activity (wars, natural disasters, balance of payments crisis, etc). The exposure susceptible to country-risk provisions at the end Latin America Uk 20% of 2010 was EUR 435 million, of which EUR 37 million 16% corresponded to intragroup operations. At the end of 2009, the total country risk in need of provisions was EUR 444 million. Total provisions in 2010 stood at EUR 69 million compared with EUR 65 million in 2009. US 9% country risk management principles continued to follow very Others 8% Spain 18% prudent criteria. Risk is assumed very selectively in operations that are clearly profitable for the group and which strengthen the global customer relation. EVOLUTION OF COUNTRY-RISK SUBJECT TO PROVISIONS AND PROVISIONS ASSIGNED Million euros 5,422 1,437 977 971 916 810 710 444 435 DEC 02 DEC 03 DEC 04 DEC 05 DEC 06 DEC 07 DEC 08 DEC 09 DEC 10 180 ANNUAL REPORT 2010
  • 183.
    D. SOVEREIGN RISK E. ENVIRONMENTAL RISK As a general criterion, sovereign risk is that contracted in Analysis of the environmental risk of credit operations is one of transactions with a central bank (including the regulatory cash the main aspects of the strategic plan of corporate social reserve requirement), the issuer risk of the Treasury or the responsibility. it revolves around the following two large points: Republic (portfolio of state debt) and that arising from • Equator principles: this is an initiative of the World Bank’s operations with public institutions with the following features: international Financial corporation. it is an international their funds only come from institutions directly integrated into standard for analysing the social and environmental impact of the state sector; and their activities are of a non-commercial project finance operations. The assumption of these principles nature. represents a commitment to evaluating, on the basis of sequential methodology, the social and environmental risks of At December 31, 2010 Europe accounted for 56.1% of the projects financed. sovereign risk, Latin America 37.7%, the US 5.1% and others 1%. Of note in Europe were the Uk (27.2%) and Spain (21.2%) – For operations with an amount equal to or more than $10 and in Latin America Brazil (27.1%) and Mexico (6.0%). As for million, an initial questionnaire is filled out, of a generic those countries on the periphery of Europe, the percentages of nature, designed to establish the project’s risk in the socio- total risk are low: Portugal (2.4%), italy (0.3%), ireland (0.2%) environmental sphere (according to categories A, B and c, and greece (0.1%). of greater to lower risk, respectively) and the operation’s degree of compliance with the Equator Principles. Latin America’s exposure to sovereign risk mainly comes from – For those projects classified within the categories of greater the obligations to which subsidiary banks are subject for risk (categories A and B), a more detailed questionnaire has constituting certain deposits in the corresponding central banks to be filled out, adapted according to the sector of activity. as well as from fixed-income portfolios maintained as part of the structural interest rate risk management strategy. These – According to the category and location of the projects a exposures are in local currency and are financed by locally social and environmental audit is carried out (by captured customer deposits, also denominated in local currency. independent external auditors). Specific questionnaires have The exposures to sovereign risk of Latin American issuers been developed for those sectors where the Bank is most denominated in currencies other than the official one of the active. The Bank also gives training courses in social and country of issue amounted to EUR 1,812 million (2.7% of total environmental matters to risk teams as well as to those sovereign risk with Latin American issuers). responsible for business. • viDA tool: used since 2004, its main purpose is to assess the environmental risk of corporate clients, both current and potential, through a system that classifies in seven categories each of the companies on the basis of the environmental risk contracted. in 2010, 41,306 companies were assessed by this tool in Spain. ENVIRONMENTAL RISK CLASSIFICATION Billion euros 30 25 20 15 10 5 0 VL L- L+ M- M+ H- H+ Note: viDA companies assessed in the retail banking network in Spain vL: very low; L: low; M: medium and H: high. ANNUAL REPORT 2010 181
  • 184.
    4. MARkET RiSk 4.1ACTIVITIES SUBJECT and the group’s economic value by maintaining appropriate levels of liquidity and solvency. TO MARKET RISK Each of these activities is measured and analysed with different The perimeter for measuring, controlling and monitoring the tools in order to show in the most precise way their risk profile. area of Financial Risks covers those operations where equity risk is assumed. This risk comes from the change in interest rates, exchange rates, shares, the spread on loans, raw material prices and from the volatility of these elements, as well as the liquidity 4.2 METHODOLOGIES risk of the various products and markets in which the group operates. A. TRADING ACTIVITY The standard methodology that grupo Santander applied to trading activities during 2010 was Value at Risk (VaR), which On the basis of the finality of the risk, activities are segmented in measures the maximum expected loss with a certain confidence the following way: level and time frame. The standard for historic simulation is a a) Trading: this includes financial services for customers and the confidence level of 99% and a time frame of one day. Statistical buying and selling and positioning mainly in fixed-income, adjustments are applied enabling the most recent developments equity and currency products. that condition the levels of risk assumed to be efficiently and quickly incorporated. A time frame of two years or at least 520 b) Balance Sheet Management: interest rate and liquidity risk daily data from the reference date of the vaR calculation is used. comes from mismatches between maturities and repricing of Two figures are calculated every day, one applying an exponential assets and liabilities. it also includes active management of decline factor which accords less weight to the observations credit risk inherent in the group’s balance sheet. furthest away in time and another with the same weight for all c) Structural risks: observations. The reported vaR is the higher of the two. • Structural Exchange-Rate Risk/Hedging of Results: The vaR is not the only measure used. it is deployed because it Exchange rate risk, due to the currency in which the is easy to calculate and is a good reference for the group’s level investment is made, both in companies that consolidate of risk. There are also other measures that allow greater control and do not consolidate (structural exchange rate) and of risks in all the markets where the group operates. exchange rate risk arising from the hedging of future results generated in currencies other than the euro They include analysis of scenarios which define alternatives for (hedging of results). the performance of different financial variables and provide the • Structural equity: This covers equity stake investments in impact on results. These scenarios can replicate critical financial and non-financial companies that do not developments or circumstances that happened in the past (such consolidate, generating risk in equities. as a crisis) or determine plausible alternatives that are not concerned with past events. A minimum of three types of The treasury area is responsible for managing the taking of scenario are given: plausible, severe and extreme, and a vaR is trading activity positions. obtained as well as a much fuller picture of the risk profile. The financial management area is responsible for the centralised The market risk area, at the level of each unit and globally and management of these structural risks, applying standardised following the principle of independence of the business units, methodologies, adapted to each market where the group carries out daily monitoring of positions, through an exhaustive operates. in the area of convertible currencies (euro, sterling and control of the changes that take place in the portfolios in order the dollar), financial management directly manages the parent to detect possible new developments for immediate correction. bank’s risks and coordinates management of the rest of the units The daily preparation of the income statement is an excellent which operate in these currencies. The management decisions for indicator of risk levels, as it enables us to identify the impact of these risks are taken by each country’s ALcO committee and, in changes on financial variables in the portfolios. the last instance, by the markets committee of the parent bank. Lastly, in order to control derivative activities and credit The aim of financial management is to inject stability and management, because of its atypical nature, specific measures are recurrence into the net interest margin of commercial activity conducted daily. in the first case, sensitivity to the price 182 ANNUAL REPORT 2010
  • 185.
    movements of theunderlying asset (delta and gamma), volatility it measures the interest risk implicit in net worth (equity) on the (vega) and time (theta) is controlled. in the second case, measures basis of the impact of a change in interest rates on the current such as the spread sensitivity, jump-to-default, and concentration values of financial assets and liabilities. of positions by rating levels, etc, are systematically reviewed. d) Value at Risk (VaR) As regards the credit risk inherent in trading portfolios and in The value at Risk for balance sheet activity and investment line with the recommendations of the Basel committee on portfolios is calculated with the same standard as for trading: Banking Supervision and prevailing regulations, an additional maximum expected loss under historic simulation with a measurement began to be calculated (incremental default risk, confidence level of 99% and a time frame of one day. Statistical iDR), in order to cover the risk of default that is not adequately adjustments are made which incorporate effectively and quickly captured in the vaR, via changes in lending spreads. The the latest developments that condition the risk levels assumed. controlled products are basically fixed-rate bonds, both public and private sector, derivatives on bonds (forwards, options, etc) e) Analysis of scenarios and credit derivatives (credit default swaps, asset backed Two scenarios for the performance of interest rates are securities, etc). The method for calculating the iDR, in essence established: maximum volatility and severe crisis. These similar to that of the credit risk of positions outside trading, is scenarios are applied to the balance sheet, obtaining the impact based on direct measurements of the tails of the distribution of on net worth as well as the projections of net interest margin losses to the appropriate percentile (99.9%). The Monte carlo for the year. methodology is used, applying a million simulations. Liquidity risk B. BALANCE SHEET MANAGEMENT Liquidity risk is associated with the group’s capacity to finance Interest rate risk its commitments, at reasonable market prices, as well as carry The group analyzes the sensitivity of net interest margin and out its business plans with stable sources of funding. The group market value of equity to changes in interest rates. This permanently monitors maximum gap profiles. sensitivity arises from gaps in maturity dates and the review of interest rates in the different asset and liability items. The measures used for liquidity risk control in balance sheet management are the liquidity gap, liquidity ratios, stress On the basis of the positioning of balance sheet interest rates, as scenarios and contingency plans. well as the situation and outlook for the market, the financial measures are agreed to adjust the positioning to that desired by a) Liquidity gap the Bank. These measures range from taking positions in markets The liquidity gap provides information on contractual and to defining the interest rate features of commercial products. expected cash inflows and outflows for a certain period of time, for each of the currencies in which the group operates. The gap The measures used by the group to control interest rate risk in measures the net need or net excess of funds at a particular balance sheet management are the interest rate gap and the date, and reflects the level of liquidity maintained under normal sensitivity of net interest margin and net worth to changes in market conditions. interest rates, value at Risk (vaR) and analysis of scenarios. Two types of liquidity gap analysis are made, on the basis of the a) Interest rate gap of assets and liabilities balance sheet item: interest rate gap analysis focuses on lags or mismatches between changes in the value of asset, liability and off-balance 1. Contractual liquidity gap: All on-and off-balance sheet items sheet items. it provides a basic representation of the balance are analysed provided they contribute cash flows placed in sheet structure and allows for the detection of interest rate risk the point of contractual maturity. For those assets and by concentration of maturities. it is also a useful tool for liabilities without a contractual maturity, an internal analysis estimating the impact of eventual interest rate movements on model is used, based on statistical research of the historical net interest margin or equity. series of products, and which determines what we call the stability and instability impact on liquidity. All on- and off-balance sheet items must be disaggregated by their flows and looked at in terms of repricing/maturity. in the 2. Operational liquidity gap: This is a scenario in normal case of those items that do not have a contractual maturity, an conditions of liquidity profile, as the flows of the balance internal model of analysis is used and estimates made of the sheet items are placed in the point of probable liquidity and duration and sensitivity of them. not in the point of contractual maturity. in this analysis defining the behaviour scenario —renewal of liabilities, b) Net interest margin sensitivity (NIM) discounts in sales of portfolios, renewal of assets— is the The sensitivity of net interest margin measures the change in the fundamental point. short/medium term in the accruals expected over a particular period (12 months), in response to a shift in the yield curve. b) Liquidity ratios it is calculated by simulating the net interest margin, both for a The liquidity coefficient compares liquid assets available for sale scenario of a shift in the yield curve as well as for the current (after applying the relevant discounts and adjustments) with situation. The sensitivity is the difference between the two total liabilities to be settled, including contingencies. This margins calculated. coefficient shows, for currencies that cannot be consolidated, the level of immediate response to firm commitments. c) Market value of equity sensitivity (MVE) This is an additional measure to the sensitivity of the net interest Net accumulated illiquidity is defined as the 30-day accumulated margin. gap obtained from the modified liquidity gap. The modified ANNUAL REPORT 2010 183
  • 186.
    contractual liquidity gapis drawn up on the basis of the C. STRUCTURAL EXCHANGE-RATE RISK/ contractual liquidity gap and placing liquid assets in the point of HEDGING OF RESULTS/ STRUCTURAL EQUITY settlement or repos and not in their point of maturity. These activities are monitored by position measures, vaR and results. in addition, other ratios or metrics regarding the structural position of liquidity are followed: D. ADDITIONAL MEASURES • Loans/net assets. Back-testing Back-testing is an a posteriori comparative analysis between • customer deposits, insurance and medium and long-term value at Risk (vaR) estimates and the “clean” daily results financing/lending. actually generated (results of the portfolios at the end of the day • customer deposits, insurance and medium and long-term valued at the next day’s prices). The purpose of these tests is to financing, shareholders’ funds and other liabilities/the sum of verify and measure the precision of the models used to calculate credits and fixed assets. vaR. • Short-term financing/net liabilities. The back-testing analysis carried out by grupo Santander complies, as a minimum, with the BiS recommendations c) Analysis of scenarios/Contingency Plan regarding the verification of the internal systems used to The group’s liquidity management focuses on taking all the measure and manage market risks. in addition, back-testing necessary measures to prevent a crisis. Liquidity crises, and their includes the hypothesis test: tests of excess, normality, immediate causes, cannot always be predicted. consequently, Spearman rank correlation, measures of excess average, etc. the group’s contingency plans concentrate on creating models of potential crises by analyzing different scenarios, identifying The valuation models are fine-tuned and tested regularly by a crisis types, internal and external communications and individual specialized unit. responsibilities. Coordination with other areas The contingency plan covers the sphere of activity of a local unit Every day work is carried out jointly with other areas to offset and of central headquarters. it specifies clear lines of the operational risk. This entails the conciliation of positions, communication at the first sign of crisis and suggests a wide risks and results. range of responses to different levels of crisis. As a crisis can occur locally or globally, each local unit must prepare a contingency financing plan, indicating the amount it would potentially require as aid or financing from headquarters during a crisis. Each unit must inform the central unit of its plan at least every six months so that it can be reviewed and updated. These plans, however, must be updated more frequently if market circumstances make it advisable. Lastly, grupo Santander is actively participating in the process opened by the Basel committee to strengthen the liquidity of banks1, with a two-pronged approach: on the one hand, participating in the analysis of the impact of the regulatory changes raised —basically, the introduction of two new ratios: Liquidity coverage Ratio (LcR) and Net Stable Funding Ratio (NSFR)— and, on the other, being present in the different forums to discuss and make suggestions on the issue (European Banking Federation, etc), maintaining in both cases close co- operation with the Bank of Spain. 1. “Basel iii: international framework for liquidity risk measurement, standards and monitoring” (Basel committee on Banking Supervision, December 2010) 184 ANNUAL REPORT 2010
  • 187.
    4.3. CONTROL SYSTEM 4.4. RISKS AND RESULTS IN 2010 A. DEFINITION OF LIMITS A. TRADING ACTIVITY The process of setting limits takes place after the year-end Quantitative analysis of VaR in 2010 budgeting process, and is the means used by the group to The group’s risk performance with regard to trading activity in establish the level of equity that each activity has available. financial markets during 2010, as measured by vaR, was as The process of definition of limits is dynamic, and responds follows: to the level of risk appetite considered acceptable by senior management. EVOLUTION OF VAR DURING 2010 Million euros B. OBJECTIVES OF THE STRUCTURE OF LIMITS 40 The structure of limits require a process that takes into account the following aspects, among others: Max. (37.5) 36 • identify and define, efficiently and comprehensively, the main types of risk incurred so that they are consistent with the 32 management of business and with the strategy. • Quantify and inform the business areas of the risk levels 28 and profile that senior management believes can be assumed, in order to avoid undesired risks. 24 • give flexibility to the business areas to build risk positions efficiently and opportunely according to changes in the 20 Min. (21.2) market, and in the business strategies, and always within the 4 Jan. 10 23 Jan. 10 11 Feb. 10 02 Mar. 10 21 Mar. 10 09 Mar. 10 28 Apr. 10 17 May. 10 05 Jun. 10 24 Jun. 10 13 Jul. 10 01 Aug. 10 20 Aug. 10 08 Sep. 10 27 Sep. 10 16 Oct. 10 04 Nov. 10 23 Nov. 10 12 Dec. 10 31 Dec. 10 risk levels regarded as acceptable by the entity. • Allow the generators of business to take prudent risks but sufficient to attain the budgeted results. • Define the range of products and underlying assets with vaR during 2010 fluctuated more than 97% of the time in a which each treasury unit can operate, bearing in mind features range of between EUR 24 million and EUR 36 million. it such as the model and valuation systems, the liquidity of the exceeded EUR 36 million in three periods – at the end of April, tools used, etc. May and June. This was due to the increase in volatility due to the sovereign debt crisis in European markets, in the first two cases, and to the higher interest rate risk in Brazil and Mexico in the third case. The vaR reached a maximum of EUR 37.5 million at the end of June and then declined because of the reduction in the credit risk spread in Madrid and interest rate and exchange rate in Mexico, to a minimum of EUR 21.2 million in the middle of September. There was a “window effect” in the fourth quarter – exit from observations of the Lehman crisis (September-December 2008) from the time range with which vaR is calculated (2 years), which would have generated a reduction in vaR- which was offset by higher volatility in sovereign credit spreads. The average vaR of the group’s trading portfolio in 2010 (EUR 28.7 million) was slightly lower than in 2009 (EUR 30.2 million), even though 2010 was conditioned by the aforementioned periods of higher volatility over the European sovereign debt crisis. The changes in vaR in 2009 were mainly due to changes in the positions of portfolios in Brazil and Mexico. compared to other comparable financial groups, grupo Santander has a low trading risk profile. Dynamic management of it enables the group to adopt changes of strategy in order to exploit opportunities in an environment of uncertainty. ANNUAL REPORT 2010 185
  • 188.
    The histogram belowshows the distribution of average risk in in Latin America, the US and Asia the credit spread vaR and the terms of vaR during 2010. it was between EUR 24 million and commodities vaR factor are not shown separately because of EUR 32 million on 75.7% of days. Of note is the right tail of their scant or zero materiality. distribution (levels of more than EUR 38 million) mainly due to the increased volatility in markets because of the sovereign debt The average vaR was EUR 1.5 million lower than in 2009. crisis in Europe. The reduction was mainly in interest rate and forex, which dropped from EUR 20 million and EUR 15.5 million to EUR 16.4 million and EUR 11.4 million, respectively. The average level of VAR RISK HISTOGRAM vaR in equities increased a little to EUR 8 million. The main risk Number of days (%) Million euros increase was in the credit spread, which rose from EUR 11.9 million to EUR 20.9 million because of the episodes of volatility 26.3% over the sovereign debt crisis in the euro zone. 21.6% Histogram of VaR by risk factor The vaR performance during 2010 underlined the group’s 13.9% 13.9% 11.2% flexibility and agility in adapting its risk profile on the basis of changes in strategy caused by a different perception of 6.2% expectations in the markets. 3.9% 2.3% 0.8% <22 24 26 28 30 32 34 36 >38 Risk by factor The minimum, average, maximum and year-end 2010 values in vaR terms are shown below: VAR STATISTICS BY RISK FACTOR2 HISTOGRAM OF VAR BY RISK FACTOR Million euros Million euros Minimum Average Maximum year-end Fixed-income vaR Fx vaR credit spread vaR Total trading Total VaR 21.2 28.7 37.5 29.6 Equity vaR commodities vaR Diversification effect (15.7) (29.1) (45.4) (27.8) Fixed income vaR 9.4 16.4 25.4 19.0 30.0 Equity vaR 4.4 8.0 14.4 8.8 25.0 Fx vaR 4.6 11.4 23.6 13.9 20.0 credit spread vaR 13.9 20.9 27.1 14.7 commodities vaR 0.5 1.3 2.1 1.0 15.0 Latin America Total VaR 12.5 18.2 34.8 13.9 10.0 Diversification effect (1.3) (8.3) (21.5) (12.6) 5.0 Fixed income vaR 12.0 14.5 20.1 14.8 0.0 Equity vaR 1.7 5.8 15.0 5.3 4 Jan. 10 23 Jan. 10 11 Feb. 10 02 Mar. 10 21 Mar. 10 09 Mar. 10 28 Apr. 10 17 May. 10 05 Jun. 10 24 Jun. 10 13 Jul. 10 01 Aug. 10 20 Aug. 10 08 Sep. 10 27 Sep. 10 16 Oct. 10 04 Nov. 10 23 Nov. 10 12 Dec. 10 31 Dec. 10 Fx vaR 2.8 7.1 27.6 6.5 US and Asia Total VaR 0.7 1.3 5.9 0.9 Diversification effect (0.1) (0.7) (1.8) (0.3) Fixed income vaR 0.7 1.2 2.7 0.9 Equity vaR 0.0 0.2 1.4 0.0 Fx vaR 0.3 0.6 5.5 0.3 Europe Total VaR 9.2 14.8 31.3 25.1 Diversification effect (3.6) (18.9) (28.4) (14.6) Fixed income vaR 4.9 8.9 17.5 12.5 Equity vaR 4.0 6.7 14.5 6.5 Fx vaR 2.0 9.8 15.8 9.6 credit spread vaR 3.5 7.0 14.4 9.0 commodities vaR 0.5 1.3 2.1 2.1 2. Total vaR of trading includes operations that are not assigned to any particular country, such as Active credit Portfolio Management and Non-core Legacy Portfolio. 186 ANNUAL REPORT 2010
  • 189.
    a) Geographic distribution LatinAmerica contributed on average 40.8% of the group’s total vaR in trading activity and 30.2% in economic results from this activity. Europe, with 27.1% of global risk, contributed 66.7% of results, as most of its treasury activity focused on professional and institutional clients. Below is the geographic contribution (by percentage), both in risks, measured in vaR terms, as well as in results (economic terms). RISK STATISTICS 2010 % Average vaR Annual economic results 70 60 50 40 30 20 10 0 Latin America Europe US and Asia Global activities b) Monthly distribution of risks and results The next chart shows that the risk assumption profile, in terms of vaR, followed an upward path during the first half of the year and then remained stable, while results evolved more irregularly during the year. Of note were April, August and November The following histogram of frequencies shows the distribution when the European sovereign debt crisis was clear, with a P&L of daily economic results on the basis of their size. The daily lower than the yearly average, mainly in the Madrid unit and in yield3 was between -EUR 5 and +EUR 15 million on 69.5% of the books of global activities. days of the market. DISTRIBUTION OF RISK BY TIME AND RESULTS IN 2010 HISTOGRAM OF THE FREQUENCY OF DAILY RESULTS % of annual total Number of days (%) Average monthly vaR 25.9% Monthly economic result 17.4% 16.2% 15.8% 15 10.0% 10 5.0% 4.2% 5 3.5% 1.2% 0.8% 0 Jan 10 Feb 10 Mar 10 Apr 10 May 10 Jun 10 Jul 10 Aug 10 Sep 10 Oct 10 Nov 10 Dec 10 < -20 -20 - -15 -15 - -10 -10 - -5 -5 - 0 0-5 5 - 10 10 - 15 15 - 20 > 20 3. yields “clean” of commissions and results of intraday derivative operations. ANNUAL REPORT 2010 187
  • 190.
    Risk management ofstructured derivatives market The following table shows the average, maximum and minimum Structured derivatives activity is mainly focused on designing values for each of the units where this type of transactions were investment products and hedging risks for clients. carried out. These transactions include options on equities, fixed-income STRUCTURED DERIVATIVES RISK (VAR) and exchange rates. IN 2010 BY UNIT. Million euros The units where this activity mainly takes place are: Madrid Minimum Average Maximum year-end (parent bank treasury), Banesto, Santander Uk, Brazil and Mexico, and, to a lesser extent, chile and Portugal. Total VaR Vega 4.5 7.9 13.6 6.2 Madrid 1.3 4.3 11.2 2.4 The chart below shows the vaR vega4 performance of Portugal 0.0 0.0 0.1 0.0 structured derivatives business in 2010. Most of the time risk moved in a range between EUR 5 and EUR 12.5 million. Abbey 0.9 1.2 1.9 1.0 The main exception was a slight temporary increase in the Banesto 4.0 5.9 10.0 5.3 middle of the year, concentrated in equity volatility of treasury Brazil 0.3 0.9 2.2 0.5 in Madrid and mainly caused by the episodes of higher volatility Mexico 0.9 1.5 2.8 1.1 linked to tensions over the sovereign debt crisis in countries on the periphery of the euro zone. The average risk in 2010 (EUR 7.9 million) was higher than in 2009 (EUR 6.6 million), largely due to the general increase in the volatility of markets and the European sovereign debt crisis than EVOLUTION OF RISK (VAR) OF THE STRUCTURED to change in risk taking. DERIVATIVE BUSINESS Million euros Regarding vaR by risk factor, the exposure, on average, was concentrated in equities, followed by interest rates, exchange 15,0 rates and commodities. This is shown in the following table: 12,5 10,0 STRUCTURED DERIVATIVES RISK (VAR) IN 2010 BY FACTOR Million euros 7,5 Minimum Average Maximum year-end Total VaRD Vega 4.5 7.9 13.6 6.2 5,0 Diversification impact (2.5) (3.8) (8.0) 0.0 2,5 interest rate vaR 1.7 2.4 5.8 2.1 Equity vaR 3.9 7.1 12.9 5.6 4 Jan. 10 23 Jan. 10 11 Feb. 10 02 Mar. 10 21 Mar. 10 09 Mar. 10 28 Apr. 10 17 May. 10 05 Jun. 10 24 Jun. 10 13 Jul. 10 01 Aug. 10 20 Aug. 10 08 Sep. 10 27 Sep. 10 16 Oct. 10 04 Nov. 10 23 Nov. 10 12 Dec. 10 31 Dec. 10 Fx vaR 0.4 1.8 3.9 1.5 commodities vaR 0.2 0.5 1.0 0.2 Gauging and contrasting measures in accordance with the BiS recommendations on gauging and controlling the effectiveness of internal financial risk measurement and management systems, in 2010 the group regularly carried out analysis and contrasting measures which confirmed the reliability of the model. As in 2009, in 2010 there were no exceptions of vaR at 99% (days when the daily loss was higher than the vaR5). Of note, however, was the exit of vaE6 at 99% (days when the daily gain was more than the vaE) on May 10, mainly due to the sharp fall in credit spreads following the agreement reached by euro zone ministers in conjunction with the European central Bank (EcB) and the international Monetary Fund (iMF). This agreement included the launch of the European stabilisation mechanism and the announcement of public debt purchases by the EcB, in order to contain the lack of confidence in the euro and in sovereign debt. 4. vega, a greek term, means here the sensitivity of the value of a portfolio to changes in the price of market volatility. 5. Results in terms of “clean P&L”. Excluding intraday results and those from commissions. 6. vaE is value at Earnings and is the counterparty of vaR on the profits side. 188 ANNUAL REPORT 2010
  • 191.
    BACKTESTING OF BUSINESSPORTFOLIOS: DAILY RESULTS VERSUS PREVIOUS DAY’S VALUE AT RISK Million euros clean P&L vaE 99% vaR 99% vaE 95% vaR 95% 90 70 50 30 10 -10 -30 -50 04 Jan. 10 23 Jan. 10 11 Feb. 10 02 Mar. 10 21 Mar. 10 09 Apr. 10 28 Apr. 10 17 May. 10 05 Jun. 10 24 Jun. 10 13 Jul. 10 01 Aug. 10 20 Aug. 10 08 Sep. 10 27 Sep. 10 16 Oct. 10 04 Nov. 10 23 Nov. 10 12 Dec. 10 31 Dec. 10 Analysis of scenarios Maximum volatility scenario various scenarios were analyzed in 2010. The chart below The table below shows, at December 31, 2010, the results by shows the results at December 31, 2010 for a scenario of rick factor of (interest rates, equities, exchange rates, spreads on maximum volatility, applying six standard deviations in various loans, commodities and the volatility of each one of them), in a market factors for the trading portfolios. scenario in which a volatility equivalent to six standard deviations in a normal distribution is applied. This scenario is based on taking for each risk factor the movement that represents a greater potential loss in the global portfolio. For the year-end, this scenario involved rises in interest rate in Latin American markets and falls in core markets (“flight into quality”), declines in stock markets, the dollar’s slide against all currencies except the euro, greater volatility and credit spreads. MAXIMUM VOLATILITY STRESS TEST Million euros interest Exchange credit rates Equities rates spread commodities Total Total trading -61.2 -68.8 -76.1 -94.2 -1.6 -302.0 Europe -9.7 -16.4 -62.8 -54.6 -1.6 -145.1 Latin America -51.2 -52.4 -10.9 0.0 0.0 -114.5 US -0.3 0.0 -0.3 0.0 0.0 -0.6 global activities -0.2 0.0 -2.1 -39.6 0.0 -41.8 The stress test shows that the economic loss suffered by the group in its trading portfolios, in terms of the Mark to Market (MtM) result would be, if the stress movements defined in the scenario materialized, EUR 302 million, a loss that would be distributed between Europe (exchange rates and spreads on loans), Latin America (fixed income) and global activities (credit spreads). ANNUAL REPORT 2010 189
  • 192.
    7 At the end of 2010, the region’s risk consumption, measured by B. BALANCE SHEET MANAGEMENT the market value of equity sensitivity to 100 basis points, was B1. Interest rate risk EUR 763 million (EUR 704 million in 2009), while that of the net interest margin at one year, measured by its sensitivity to 100 a) Convertible currencies basis points, was EUR 45 million (EUR 64 million in 2009). At the end of 2010, the sensitivity of net interest margin at one year to parallel rises of 100 basis points was concentrated in the euro interest rate curve (EUR 284.1 million), with the parent LATIN AMERICAN RISK PROFILE EVOLUTION bank contributing the most, and in the sterling interest rate (Sensitivity of NiM and MvE to 100 b.p.) curve (£ 330.8 million). The sensitivity of the rest of convertible NiM currencies was not very significant. MvE 762.8 760.4 749.4 703.8 651.0 At the same date, the sensitivity of equity to parallel rises in the yield curve of 100 basis points in the euro interest rate curve was EUR 1,265.7 million, most of it in the parent bank. As regards the curve in sterling it was £ 406.2 million. in accordance with the current environment of low interest rates, the Bank maintains a positive sensitivity, both in net interest margin (NiM) and to interest rate rises. 64.0 64.2 b) Latin America 56.9 44.8 6.1 1. Quantitative analysis of risk The interest rate risk of Latin America’s balance sheet DEC 09 MAR 10 JUN 10 SEP 10 DEC 10 management portfolios, measured by the sensitivity of market value of the net interest margin (NiM) to a parallel movement of 100 basis points, remained during 2010 at low levels and within a narrow band, with a maximum of EUR 79 million8 in April as of when it declined to a low of EUR 6 million in September, mainly due to the increased hedging in Brazil and the portfolio sale in Mexico. it then rose until the end of the year, largely because of the increase in deposits and issues in Brazil. in terms of equity sensitivity, it fluctuated in a narrow range of between EUR 651 million and EUR 827 million, and increased in the fourth quarter, mainly because of the purchase of the credit portfolio in Brazil and chile. 7. includes all the balance sheet except the trading portfolios. 8. Sensitivity expressed as an absolute value. it is the aggregation of the sensitivity to many yield curves, grouped applying suppositions of correlation (betas) between them. MATURITY AND REPRICING GAPS AS OF DECEMBER 31, 2010 Structural gap parent bank-holding* Million euros Not sensitive Up to 1 year 1-3 years 3-5 years > 5 years Total Money and securities market 41,762 1,797 1,754 14,671 59,985 Loans 112 116,764 10,838 1,504 1,728 130,946 Permanent equity stakes 65,919 65,919 Other assets 17,346 51,705 51 53 91 69,247 Total assets 83,377 210,231 12,686 3,312 16,490 326,097 Money market — 43,125 108 1,800 — 45,033 customer deposits — 39,513 13,314 9,704 14,649 77,180 Debt issues and securitisations — 77,605 13,789 14,592 10,766 116,753 Shareholders’ equity and other liabilities 82,219 44,054 1,011 712 1,122 129,118 Total liabilities 82,219 204,298 28,223 26,807 26,537 368,085 Balance sheet Gap 1,158 5,933 (15,537) (23,495) (10,046) (41,988) Off-balance sheet structural gap — 24,104 13,067 10,630 (2,078) 45,723 Total structural Gap 1,158 30,037 (2,470) (12,865) (12,125) 3,735 Accumulated Gap — 30,037 27,567 14,702 2,577 — * gap of euro-denominated assets and liabilities, excluding other currencies. 190 ANNUAL REPORT 2010
  • 193.
    Interest rate riskprofile at the end of 2010 More than 90% of risk is concentrated in four countries: Brazil, The gap tables show the risk maturity structure in Latin America chile, Mexico and Puerto Rico. at the end of 2010. The balance sheet management risk in Latin America, measured 2. Geographic distribution in vaR terms at one day and at 99%, amounted to EUR 152 Financial margin sensitivity million at the end of 2010. The chart shows that most of it was For the whole of Latin America, the consumption at the end of concentrated in Brazil. 2010 was EUR 45 million (sensitivity of the financial margin at one year to rises of 100 b.p.). The geographic distribution is DISTRIBUTION OF BALANCE SHEET RISK MANAGEMENT (VAR) shown below. % More than 90% of the risk was concentrated in three countries: Otros 0,1% Brazil, chile and Mexico. Puerto Rico 0,5% Argentina 2,3% chile 5,3% Other countries* 7% NIM SENSITIVITY BY COUNTRIES % Other countries* 7% Puerto Rico 3,5% Mexico 15,3% Brazil 91,7% (*) Other countries: colombia, Mexico, Santander Overseas and Uruguay. chile 18,1% Brazil 56,1% B2. Structural management of credit risk The purpose of structural management of credit risk is to reduce the concentrations that can naturally occur as a result of (*) Other countries: Argentina, colombia, Panama, Santander Overseas, Peru and Uruguay business activity through the sale of assets. These operations are offset by acquiring other assets that diversify the credit portfolio. Market Value of equity sensitivity The financial management area analyses these strategies and For the whole of Latin America, the consumption at the end of makes proposals to the ALcO in order to optimise the exposure 2010 was EUR 763 million (sensitivity of MvE to rises of 100 b.p to credit risk and help create value. in interest rates). The geographic distribution is shown below: During 2010 and as part of the group’s liquidity management: MVE SENSITIVITY BY COUNTRIES • EUR 26,000 million of assets were securitised, of which EUR % 19,000 million were placed in the market and the rest chile 20,1% retained by the group’s various units. These retained securitisations increased the group’s liquidity position through its discounting capacity in central banks.   • Repurchases were made in the secondary market of Mexico 5,1% Brazil 67,2% securitisation bonds of the higher tranches of group issuers Puerto Rico 3,3% (around EUR 500 million). Other countries* 2,4% Argentina 1,9% (*) Other countries: colombia, Panama, Santander Overseas, Peru and Uruguay. STRUCTURAL GAP LATIN AMERICA Million euros Local currency Not sensitive 0-6 months 6-12 months 1-3 years > 3 years Total Assets 50,273 85,009 19,659 45,031 21,114 221,086 Liabilities 54,232 73,683 5,351 26,446 4,536 164,248 Off-balance sheet 2,637 9,829 -6,681 -5,747 -1,024 -986 gap -16,452 -1727 7,626 -1,109 15,554 3,891 Dollar Not sensitive 0-6 months 6-12 months 1-3 years > 3 years Total Assets 2,948 20,864 3,983 2,973 7,643 38,411 Liabilities 2,419 22,432 4,425 3,730 7,906 40,912 Off-balance sheet -2,546 315 -433 2,181 1,469 982 gap -2,341 -1,887 -875 5 1,206 -3,891 ANNUAL REPORT 2010 191
  • 194.
    B3. Management offunding ORGANISATION MODEL and liquidity risk Area of decision Management of financing and liquidity risk, fully consolidated before the onset of the financial turbulence, has been one of the main pillars behind the success of Banco Santander’s Markets’ committee business model during this critical period. This framework of liquidity management has not required changes to make it function correctly and has given Santander convertible currencies LatAm a significant competitive advantage. Specifically, it has enabled the group and its subsidiaries to successfully tackle the business liquidity needs during the worst moments of the crisis Local Local and take advantage of growth opportunities offered by ALcO 1 ALcO 1 the market. The great capacity to attract customer deposits, combined with Local Local strong issuance activity in institutional markets, has given the ALcO 2 ALcO 2 group the necessary liquidity to finance the acquisition of new units in the last few years. it has also helped to bolster the Bank’s capacity to create value, while at the same time further Local Local improve the diversification of financing sources. ALcO 3 ALcO 3 The group’s liquidity management framework and its situation at the end of 2010 is set out below. Management and control areas 1. Management framework Financial management Global market risk Liquidity management is based on three fundamental pillars: Responsible for executing Responsible for monitoring and monitoring their decisions and controlling risks and limits A) Organisational and governance model A solid model of governance that ensures the involvement of senior management and the board in taking decisions and facilitating their integration with the group’s global strategy. in this way, and in line with the best practices of governance, the group establishes a clear division between executing the B) Management financial management strategy (the responsibility of the financial Adapted to each business’s liquidity needs, in accordance management area) and monitoring and control (the with the decentralised organisational model. responsibility of market risks). c) Balance sheet analysis and liquidity risk management B. Management Profound analysis of the balance sheet and its evolution in Structural liquidity management aims to finance the group’s order to support decision-taking. recurring activity in optimum conditions of maturity and cost and avoid assuming undesired liquidity risks. A. Organisational and governance model Decision-taking regarding structural risks is done by local ALcO Liquidity and financing management is based on the following committees in coordination with the markets committee. The principles: latter is the highest decision-taking body and coordinates all • Wide and very stable base of customer deposits: more than global decisions that influence measurement, management and 85% are retail and are captured in the group’s core markets control of liquidity risk. by various units. The committee is headed by the chairman of the Bank and • Financing via medium and long-term issues of the balance comprises the second vice-chairman and cEO, the third vice- sheet’s stable liquidity needs (the gap between loans and chairman (who is the maximum executive responsible for the deposits), establishing a surplus of structural financing in group’s risks), the chief financial officer and the senior vice- order to be able to meet possible adverse situations. president of risks and those responsible for the business and analysis units. • Diversification of financing sources to reduce the risk in relation to: There are also ALcO committees for convertible currencies such – instruments/investors as Latin American currencies. – markets/currencies The financial management area manages structural risks – maturities including liquidity and the global risk area is responsible for control. Both areas support the ALcO committees and present • Strict control of short-term financing needs, within the analysis and management proposals and also ensure group’s policy of minimising the degree of recourse to short- compliance with the limits established. term funds. • Autonomy and responsibility of subsidiaries in managing the financing of liquidity, with no structural support from the parent bank. 192 ANNUAL REPORT 2010
  • 195.
    in practice, andapplying these principles, the group’s liquidity ANALYSIS OF THE BALANCE SHEET AND MEASUREMENT management consists of: OF LIQUIDITY RISK • Drawing up every year the liquidity plan based on the 1. group strategy 2. current situation of liquidity financing needs derived from the budgets of each business and the methodology stated in section B. On the basis of these needs and bearing in mind prudent limits on recourse to short-term markets, the year’s issuance and securitisation plan is established by financial management. Analysis • During the year the evolution of the balance sheet and financing 5. Financing of liquidity needs is regularly monitored, giving rise to changes to the plan. markets in 3. Projection of stress the balance • Maintain an active presence in a wide and diversified series of conditions sheet and need financing markets. The group has nine significant and for liquidity independent issuance units, which avoid dependence on a specific market and maintain available a wide capacity of 4. Balance sheet in stress issuance in various markets. conditions • And backed by all this, the group has an adequate structure of medium and long-term issues, well diversified by products (senior debt, subordinated, preferred shares, bonds, All of this enables the group to respond to a spectrum of securitisation) with an average conservative maturity (4.1 years potential, adverse circumstances, anticipating the corresponding at the end of 2010), to which are added the securitisations. contingency plans. • All of this results in moderate needs of recourse to short-term These actions are in line with the practices being fostered from wholesale financing at the group level, which, as reflected in the Basel committee in order to strengthen the liquidity of the accompanying balance of liquidity, only represented 3% of banks, whose objective is to define a framework of principles net funds in 2010, down from 5% in 2009. and metrics that is still being analysed and discussed. The subsidiaries have a large degree of autonomy to manage their liquidity within grupo Santander’s decentralised financing 2. Current state of liquidity model. Each one must budget their liquidity needs and assess The group has an excellent structural position, with the capacity their own capacity of recourse to the wholesale markets in order to meet the new conditions of stress in the markets. This is to establish the issuance and securitisation plan in coordination underscored by: with the parent bank. A) The robust balance sheet. Only in the case of Santander consumer Finance does the B) The dynamics of financing. parent bank (Banco Santander) provide the necessary liquidity and always at the market price taking into account the maturity A. Robust balance sheet of the finance and the rating of the relevant unit. The group, The balance sheet at the end of 2010 was solid, as befits the within the strategy of optimising the use of liquidity, has group’s retail nature. Lending, which accounted for 75% of net followed a policy in the last few years of strongly reducing the assets, was entirely financed by customer deposits and medium recourse of Santander consumer Finance to the parent bank, and long-term financing. Equally, the structural needs of which is scheduled to be maintained in the coming years. liquidity, represented by loans and fixed assets, were also totally financed by structural funds (deposits, medium and long-term C. Analysis of the balance sheet and measurement financing and capital). of liquidity risk Taking decisions on financing and liquidity is based on a deep As regards financing in wholesale markets, the group’s structure understanding of the group’s current situation (environment, is largely based on medium and long-term instruments (89% of strategy, balance sheet and state of liquidity), the future liquidity the total). needs of businesses (projection of liquidity), as well as access to and the situation of financing sources in the wholesale markets. Short-term financing is a marginal part of the structure (3% of total funds) and it amply covered by liquid assets. The objective is to ensure the group maintains optimum levels of liquidity to cover its short and long-term needs, optimising Lastly, the Bank has a large capacity of recourse to central banks the impact of its cost on the income statement. to obtain immediate liquidity. At the end of 2010, total eligible assets which could be discounted in the various central banks to This requires monitoring of the structure of balance sheets, which the group has access via its subsidiaries amounted to forecasting short and medium-term liquidity and establishing the close to EUR 100,000 million. basic metrics, in line with those reported in the next section. various stress tests are also conducted taking into account the additional needs that could arise from various extreme, although possible, events. These could affect the various items of the balance sheet and/or sources of financing differently (degree of renewal of wholesale financing, deposit outflows, deterioration in the value of liquid assets, etc), whether for global market reasons or specific ones of the group. ANNUAL REPORT 2010 193
  • 196.
    We now setout the framework of the balance of liquidity, B. Dynamics of financing consolidated as the main metrics for monitoring the structural The evolution of 2010 enabled Santander to continue to position of liquidity: improve its structural liquidity position, backed by two management drivers, which proved to be very effective in the GRUPO SANTANDER’S BALANCE SHEET OF LIQUIDITY current recession. AT THE END OF 2010 * % The first one was that the group was able to increase its customer deposit base very significantly: EUR 109,000 million during 2010. This growth was due to two effects. On the one hand, the effort made to attract deposits via the branch networks, which customer loans 75% 85% customer deposits benefited from the customers’ confidence in the group’s and medium and liquidity and solvency. All of this made Santander the bank long-term financing chosen by depositors in many markets: the so-called flight to quality effect. 8% This increase occurred in an environment of deleveraging in Fixed assets Shareholders’ funds and 12% which deposits were spurred by the higher rate of household 17% other liabilities Financial assets 3% Short-term financing and corporate savings, while lending slowed down, reflecting the lower rates of consumption and investment in various (*) Balance sheet for the purposes of liquidity management: total balance sheet net of trading derivatives and interbank balances. countries. The evolution of 2010 was a good example of this, with the group’s deposits growing 22% and lending rising 6%, both MONITORING METRICS excluding the perimeter effect. % Metrics 2010 2009 This capturing of stable funds coupled with the trend of Loans/net assets 75% 79% moderate credit growth enabled Santander to reduce the credit/deposit ratio to 117% from 135% in 2009 and 150% customer deposits, insurance in 2008. and medium and long-term funding/loans 115% 106% The second driver was the high capacity of access to wholesale customer deposits, insurance financing markets, which the group can access regularly via its and medium and long-term various units. This strategy enabled Santander to access different financing, shareholders’ funds and institutional investors in a wide variety of instruments and other liabilities/total loans and fixed assets 117% 110% diversity of maturities. Short-term financing/ net liabilities 3% 5% As a result, the group’s units captured during 2010 EUR 38,000 million in medium and long-term issue in wholesale markets of senior debt and covered bonds, a significantly higher volume As in the group, the balance sheets of the units of convertible than in 2009. This capacity is backed by the group’s excellent currencies and of Latin America maintain the same principles, credit quality (AA from Standard & Poor’s and Aa2 from within the philosophy of independence and responsibility in Moody’s). Moreover, in all cases the appetite for securities by their financing. investors is adjusted to placement prices that recognise the superior credit quality of the group and its subsidiaries. A good example is that in the group’s main units customer lending is totally financed by customer deposits plus medium in short, a big rise in deposits, good access to medium and and long-term wholesale financing. long-term wholesale markets and the generation of liquidity by businesses in scenarios such as today’s explain the improvement in the group’s structural liquidity in the last 12 months. We thus began 2011 with an excellent liquidity situation and with reduced issuance needs. We have no concentration of maturities in the coming years when annual maturities will be less than in 2010 and, moreover, the dynamics of business mean it will not be necessary to cover all of them. 194 ANNUAL REPORT 2010
  • 197.
    in any case,and while the current environment of uncertainty D) STRUCTURED FINANCE OPERATIONS persists, we will continue to implement a conservative policy Despite the complicated economic environment, Santander in issues, as we did in 2010, in order to bolster the already achieved growth of 12% in this activity in 2010 to a committed solid position. exposure of EUR 19,445 million at the end of the year, corresponding to 673 transactions, and increased both the GRUPO ISSUES AND MATURITIES OF MEDIUM diversification by sectors and the internationalisation of - AND LONG - TERM DEBT* business. Leadership in project finance was strengthened with Billion euros an exposure of EUR 13,258 million (490 transactions), followed by EUR 3,526 million in acquisition finance (37 transactions), Euro zone of which EUR 2,004 million related to 13 margin calls and Rest leveraged buy-outs (LBOs) and other forms amounted to gROUP iSSUES gROUP MATURiTiES EUR 2,661 million (146 transactions). 38 31 After analysing the impact on the solar energy portfolio in Spain 30 as a result of the entry into force of RDL 14 of December 23, 14 6 2010, no downward valuation adjustments in this type of 8 lending were considered necessary beyond EUR 104.5 million 22 of loan-loss provisions for the whole portfolio of structured 24 25 22 4 finance. Santander’s net exposure in project finance dropped by almost EUR 1,300 million to EUR 11,957 million at the 18 end of 2010, as a result of three partial transfer operations of the portfolio of projects to cLOs made in the two years prior to 2010. 2010 2011 2012 2013 As a result of integrating Alliance & Leicester into the group in 2008, a portfolio of structured operations is maintained. (*) Excludes securitisations it is a diversified portfolio of specialised financing operations. The exposure at the end of 2010 was 15.9% lower than in 2009 C ) STRUCTURAL EXCHANGE-RATE RISK/HEDGING at £ 4,936 million (EUR 5,735 million and 241 transactions). OF RESULTS Structural exchange rate risk arises from group operations in E) EXPOSURES RELATED TO currencies, mainly related to permanent financial investments, COMPLEX STRUCTURED ASSETS and the results and the dividends of these investments. grupo Santander continues to have a very limited exposure to instruments or complex structured vehicles, reflecting a This management is dynamic and seeks to limit the impact on management culture one of whose hallmarks is prudence in risk equity of currency depreciations and optimise the financial cost management. At the end of 2010, the group had: of hedging. • CDOs/CLOs: the position remained not very significant at EUR 486 million, 24% lower than in 2009. Most of this was As regards the exchange-rate risk of permanent investments, due to the integration of the portfolio of Alliance & Leicester the general policy is to finance them in the currency of the in 2008 (32% of the portfolio has an AAA rating and 77% investment provided the depth of the market allows it and the A or higher). cost is justified by the expected depreciation. One-off hedging is also done when a local currency could weaken against the euro • Non-agency CMOs and pass-through with underlying beyond what the market estimates. mortgage alt-A9: exposure of EUR 639 million at the end of 2010 from the integration of Sovereign Bank in January 2009. At the end of 2010, the largest exposures of a permanent The position was 17% lower than in 2009. nature (with potential impact on net worth) were concentrated • Hedge funds: the total exposure is not significant (EUR 540 in Brazilian reales, followed by sterling, Mexican pesos, US million at the end of 2010) and most of it is through financing dollars and chilean pesos. The group covers part of these these funds (EUR 295 million), as the rest is direct participation positions of a permanent nature with exchange-rate derivatives. in portfolio. This exposure has low levels of loan-to-value of around 35% (EUR 1,543 million of collateral). The risk with in addition, financial management at the consolidated level is this type of counterparty is analysed case by case, establishing responsible for exchange-rate management of the group’s the percentages of collateral on the basis of the features and expected results and dividends in those units whose currency is assets of each fund. The exposure was 2% lower than not the euro. in 2009. • Conduits: no exposure. The positions inherited from buying Alliance & Leicester were integrated, at market prices, into the group’s balance sheet in the third quarter of 2010. 9. Alternative A-paper: mortgages originated in the US market which for various reasons are considered as having an intermediate risk level between prime and subprime mortgages (not having all the necessary information, loan-to-value levels higher than usual, etc). ANNUAL REPORT 2010 195
  • 198.
    • Monolines: Santander’sexposure to bond insurance 4.5 INTERNAL MODEL companies was EUR 274 million10 at the end of 2010, EUR 244 million of it indirect exposure by virtue of the guarantee The Bank of Spain approved at the end of 2010 the use of our provided by this type of entity to various financing or internal market risk model for calculating regulatory capital in traditional securitisation operations. The exposure in this case the trading portfolios of units in Spain, chile and Portugal. The is double default, as the primary underlying assets are of high group’s objective is to gradually extend approval to the rest of credit quality (mainly AA). The small remaining amount is units. direct exposure (for example, via purchase of protection from the risk of non-payment by any of these insurance companies As a result of this approval, the regulatory capital of trading through a credit default swap). The exposure was 31% lower activity is now calculated via advanced methods. The vaR than in 2009. calculated for the Market Risks Area is the fundamental metric and incorporates an incremental default risk. The exposure to this type of instrument, the result of the group’s usual operations, declined in 2010 and this was mainly We closely co-operate with the Bank of Spain in order to due to integrating the positions of banks acquired by the group, advance in the perimeter susceptible of entering into the such as Alliance & Leicester and Sovereign (in 2008 and 2009, internal model (at the geographic and operational levels), as respectively). All these positions were known at the time of well as analysis of the impact of possible future changes, in line purchase, having been duly provisioned. Since integration in the with the documents published by the Basel committee in group, these positions have been reduced notably in order to December 2010 to strengthen the capital of banks.11 eventually eliminate them from the balance sheet. The exposure emanating from A&L in cDOs, cLOs, Alt-A and conduits was reduced by around 80% in 2010. Santander’s policy for approving new transactions related to these products remains very prudent and conservative; it is subject to strict supervision by the group’s senior management. Before approving a new transaction, product or underlying asset, the risks division verifies: • The existence of an appropriate valuation model to monitor the value of each exposure: Mark-to-Market, Mark-to-Model or Mark-to-Liquidity. • The availability in the market of the necessary inputs to be able to implement this valuation model. And provided these two points are always met: • The availability of appropriate systems, duly adapted to calculate and monitor every day the results, positions and risks of new operations. • The degree of liquidity of the product or underlying asset, in order to make possible their coverage when deemed opportune. 10. guarantees provided by monolines for bonds issued by US states (municipal bonds) are not considered as exposure. As a result of the acquisition of Sovereign Bank, the group integrated a 11. “Basel iii: A global regulatory framework for more resilient banks and banking systems” and EUR 1,328 million portfolio of these bonds. “Basel iii: international framework for liquidity risk measurement, standards and monitoring.” 196 ANNUAL REPORT 2010
  • 199.
    5. OPERATiONAL RiSk DEFINITIONAND OBJECTIVES grupo Santander defines operational risk (OR) as the risk of Management is based on the following elements: losses from defects or failures in its internal processes, employees or systems, or those arising from unforeseen circumstances. They are, in general, purely operational events, ement which makes them different from market or credit risks, asur Con Me essment Mit trol although they also include external risks, such as natural Ass iga tio isk n of r atio disasters. n s tific Info Iden The objective in control and management of operational risk is to rmation identify, measure/valuate, control/mitigate and monitor this risk. The group’s priority is to identify and eliminate risk focuses, Po l i c m e t regardless of whether they produce losses or not. Measurement and ies also helps to establish priorities in management of operational to ic a l ,p o ls g risk. o lo od ce d u r no h o lo re s Te c h p ort grupo Santander opted, from the beginning, to use the gie sup s standard method for calculating regulatory capital by operational risk, envisaged in the BiS ii rules. The group is weighing up the best moment to adopt the focus of advanced models (AMs), bearing in mind that a) the short-term priority in management of operational risk centres on its mitigation; and b) The different phases of the technological and operational risk most of the regulatory requirements established for being able management model entail: to adopt the AMs must be incorporated into the standard • identify the operational risk inherent in all activities, products, model (already achieved in the case of grupo Santander’s processes and banking systems. operational risk management model). • Measure and assess the operational risk objectively, MANAGEMENT MODEL continuously and in line with the regulatory standards (Basel ii, Bank of Spain) and the banking industry, establishing risk The organisational model for controlling and managing risks is tolerance levels. the result of adapting to the new BiS ii environment, which establishes three levels of control: • continuously monitor the exposure of operational risk in order to detect the levels of unassumed risk, implement control • First level: control functions conducted by the group’s units. procedures, improve internal knowledge and mitigate losses. • Second level: functions carried out by the corporate areas. • Establish mitigation measures that eliminate or minimise • Third level: integral control functions by the risks division- operational risk. integral control area and internal validation of risk. • Produce regular reports on the exposure to operational risk The technology and operations division is responsible for and the level of control for senior management and the management and control of operational risk. Within this group’s areas/units, as well as inform the market and division, the corporate area of technological and operational regulatory bodies. risk, established in 2008, defines policies as well as managing • Define and implement systems that enable operational risk and controlling these risks. The implementation, integration and exposures to be watched over and controlled and integrated local adjustment of the policies and guidelines established by into the group’s daily management, taking advantage of this area is the responsibility of local executives in each unit. existing technology and seeking the maximum computerisation of applications. This structure for operational risk management is based on the knowledge and experience of executives and professionals of • Define and document operational risk management policies, the group’s various units. Particular importance is attached to and introduce methodologies for managing this risk in the role of local executives. accordance with regulations and best practices. ANNUAL REPORT 2010 197
  • 200.
    grupo Santander’s operationalrisk management model • Processes are conducted to conciliate data bases with contributes the following advantages: accounting data. • integral and effective management of operational risk By consolidating the total information received, the group’s (identification, measurement/assessment, control/mitigation operational risk profile is reflected in the following chart: and information). • Better knowledge of existing and potential operational risks DISTRIBUTION OF AMOUNT AND FREQUENCY and assigning responsibility for them to the business and OF EVENTS BY CATEGORY (2010) support lines. % Amount of events • Operational risk information helps to improve the processes 43.3 Frequency of events and controls, reduce losses and the volatility of revenues. 36.3 33.3 30.5 29.3 IMPLEMENTING THE MODEL: GLOBAL INITIATIVES AND RESULTS The main functions, activities and global initiatives are: 15.4 • Define and implement the framework for corporate management of technological and operational risk 3.9 2.1 1.7 1.7 management. 0.0 0.9 0.0 1.4 • Designate coordinators and create operational risk I II III IV V VI VII departments. i. internal fraud ii. External fraud • Training and interchange of experiences: continuation of iii. Employment, health and security practices at work iv. Practices with clients, products and business best practices within the group. v. Damage in physical assets vi. interruption of business and failures in systems • Foster mitigation plans: ensure control of implementation vii. Execution, delivery and management of processes of corrective measures as well as ongoing projects. • Ensure effective management of operational and The group exercises supervision and control of technological technological risk. and operational risk via its governance organs. The various areas of local resources hold meetings of monitoring committees with • Supply adequate information on this type of risk. the corporate area every month and by country. in 2010, the The corporate function strengthens management of group’s management committee included treatment of relevant technological risk, strengthening the following aspects among aspects in the management and mitigation of operational risk others: on a regular basis. • The security of the information systems. This management also led to a reduction in the gross loss, • The contingency and business continuity plans. which was around 3% on a like-for-like basis. • Management of risk associated with the use of technologies in general, combined with the control of losses, all the group’s (development and maintenance of applications, design, units continued to improve aspects related to management of implementation and maintenance of technology platforms, operational risk as can be confirmed in the annual review carried output of computer processes, etc). out by internal auditing. Almost all the group’s units have been incorporated to the model with a high degree of uniformity. However, due to the The group, via approval in the risk committee, formalises every different pace of implementation, phases, schedules and the year the operational risk profiles and limits. A risk appetite is also historical depth of the respective data bases, the degree of established which must be in low and medium-low profiles on progress varies from country to country. the basis of the measurement of various ratios. Limits are set by country and for the group on the basis of the gross loss/gross On a general basis: income ratio. • Data bases of operational incidents that are classified are received every month. The capturing of events related to in addition, the group’s units conduct self-evaluation risk operational risk are not truncated (i.e. without exclusions for exercises in terms of frequency and severity. This enables limits reasons of amount and with both the accounting impact to be set for the following year on the basis of the distribution —including positive effects— as well as the non-accounting and modeling of expected loss/unexpected. impact). • Self-assessment questionnaires filled in by almost all the group’s units are received and analysed. • A corporate system of operational risk indicators is in place. it is in continuous evolution and coordination with the internal control area. • The main and most frequent events are identified and analysed, and mitigation measures taken which, in significant cases, are disseminated to the group’s other units as a best practices guide. 198 ANNUAL REPORT 2010
  • 201.
    ANALYSIS AND MONITORINGOF INSURANCE IN THE MANAGEMENT CONTROLS IN MARKET OPERATIONS OF OPERATIONAL RISK The complexity of financial instruments makes it necessary for grupo Santander regards insurance as a key element in the group to continuously strengthen operating control of this management of operational risk. The area responsible for activity, enhancing the very demanding and conservative risk operational risk has been closely cooperating with the group’s and operating principles that grupo Santander has been insurance area since 2004 in all those activities that entail regularly applying. improvements in both areas. For example: • cooperation in the exposure of the group’s operational risk Over and above regular tracking of all aspects regarding control and management model to insurance and reinsurance operating control, all of the group’s units paid more attention companies. to the following aspects, so that the review is validated every month by each unit’s management committee. Of note are the • Analysis and monitoring of recommendations and suggestions following: to improve operational risks made by insurance companies, via prior audits conducted by specialised companies, as well • Review of the valuation models and in general the valuation of as their subsequent implementation. portfolios. • Exchange of information generated in both areas in order to • capturing processes and independent validation of prices. strengthen the quality of the data bases of errors and the • Appropriate confirmation of operations with counterparties. perimeter of coverage of the insurance policies for the various operational risks. • Reviewing cancellations/modifications of operations. • close cooperation between local operational risk executives • Reviewing and monitoring the effectiveness of guarantees, and local coordinators of insurance to strengthen mitigation collateral and mitigation of risk. of operational risk. • Regular meetings on specific activities, states of situation and CORPORATE INFORMATION projects in both areas. The corporate area of control of technological and operational risk has a system for integral management of operational risk • Active participation of both areas in global sourcing of information, which every quarter consolidates the information insurance, the group’s maximum technical body for defining available from each country/unit in the operational risk sphere coverage strategies and contracting insurance. and gives a global vision with the following features: • Two levels of information: one corporate and the other individualised for each country/unit. • Dissemination of the best practices among countries/units of grupo Santander, obtained from the combined study of the results of qualitative and quantitative analysis of operational risk. information is also prepared on the following aspects: • grupo Santander’s management model for operational risk. • Human resources and perimeter of action • Analysis of the data base of errors and events • Operational risk cost and accounting conciliation • Self-assessment questionnaires • indicators • Mitigating measures/asset management • contingency plans • Regulatory framework: BiS ii • insurance This information acts as the basis for meeting the needs of reporting to the board’s risk committee, senior management, regulators, rating agencies, etc. ANNUAL REPORT 2010 199
  • 202.
    6. REPUTATiONAL RiSk grupoSantander defines reputational risk as that linked to the CORPORATE COMMITTEE OF PRODUCT AND perception of the Bank by its various stakeholders, both internal SERVICES MARKETING and external, of its activity, and which could have an adverse This committee is chaired by the group’s secretary general and impact on results, capital or business development expectations. integrated by representatives of the divisions of risk, financial This risk relates to juridical, economic-financial, ethical, social management, technology and operations, secretariat general, and environmental aspects, among others. general intervention and control, internal auditing, retail banking, Santander global Banking & Markets, private banking, asset various of the group’s governance structures are involved in management and insurance. it is the group’s maximum decision- reputational risk management, depending on where the risk making body for approving and monitoring products and services. comes from. The audit and compliance committee helps the board to supervise compliance with the group’s code of The committee pays particular attention to adjusting the conduct in the securities markets, the manuals and the product or service to the framework where it is going to be sold procedures to prevent money-laundering and, in general, and especially to ensuring that: the Bank’s rules of governance and compliance. it formulates the proposals needed for their improvement. • Each product or service is sold by someone who knows how to sell it. Management of reputational risk which might arise from an • The client knows what he or she is investing in and the risk of inadequate sale of products or an incorrect provision of services each product or service and this can be accredited with the by the group is mainly conducted by the following bodies and relevant documents. procedures: • The product or service fits the customer’s risk profile. THE RISK COMMITTEE • Each product or service is sold where it can be, not only for This committee is the responsibility of board, as part of its legal or tax reasons (i.e. it fits into the legal and tax regime of supervisory function. it defines the group’s risk policy. each country), but also on the basis of the prevailing financial culture. As the maximum body responsible for global management of • When a product or service is approved the maximum limits for risk and of all types of banking operations, the committee placement are set. assesses, with the support of the division of the secretary general, reputational risk in its sphere of activity and decisions. Marketing committees are created at the local level which channel to the corporate committee of marketing new product approval proposals, after issuing a favourable opinion, and approve products that are not new and marketing campaigns. in the respective approval processes, the marketing committees operate with a risk focus and from the double perspective of Bank/customer. The corporate marketing committee (cMc) held 21 meetings in 2010 and the local committee of marketing (LcM) of retail banking Spain met 10 times, analysing a total of 237 products/services (197 were new products/services submitted to the cMc and 40 were approved by the LcM as they were not new products/services that fitted into those previously authorised by the cMc). Of the 197 products/services submitted to the cMc, the number per country/unit and their share of the total was as follows: Spain 113 (57.4%); chile: 15 (7.6%); Portugal: 14 (7.1%); Mexico: 12 (6.1%); Uk: 11 (5.6%); Brazil: 11 (5.6%); US: 9 (4.6%); Argentina: 4 (2%); colombia: 2 (1%); Puerto Rico: 2 (1%); italy: 2 (1%); Peru: 1 (0.5%); and Uruguay: 1 (0.5%). 200 ANNUAL REPORT 2010
  • 203.
    GLOBAL CONSULTATIVE COMMITTEE MANUAL OF PROCEDURES FOR THE SALE OF The global consultative committee (gcc) is the advisory body FINANCIAL PRODUCTS for the corporate committee of marketing and comprises The manual, which has been used by Banco Santander since representatives of areas that contribute vision of regulatory and 2004 for the retail marketing of financial products in Spain, market risks. This committee meets every quarter and can covers investment services for financial products including recommend the review of products affected by regulatory securities and other fixed-income or equity instruments, money changes, in markets, deterioration of solvency (country, sectors market instruments, participations in collective investment and companies) or by changes in the group’s vision of markets institutions, savings and investment insurance, traded derivatives in the medium and long term. and OTc and atypical financial contracts. The corporate committee of marketing can also include other instruments in CORPORATE OFFICE OF REPUTATIONAL RISK the sphere of the manual of procedures, as has been the case MANAGEMENT with structured deposits, savings insurance or investment and integrated in the corporate area of compliance and reputational pension plans. risk, with the division of the general secretary, this office provides the corresponding organs of governance with the in 2010 90 products/services subject to the manual were necessary information to: submitted for approval. 1. adequately analyse the risk to be approved, with a two- pronged purpose: impact on the Bank and on the customer. 2. monitoring of products throughout their life cycle. During 2010, 52 products or services not considered to be new were presented to the corporate office for reputational risk management for its approval. The office also resolved 110 consultations from various areas and countries. The products approved by the office are successive issues of products previously approved by the corporate committee of marketing or the local committee of marketing of retail banking Spain, after having delegated them this faculty in the branch. ANNUAL REPORT 2010 201
  • 204.
    7. ADJUSTMENT TOTHE NEW REgULATORy FRAMEWORk grupo Santander participated during 2010 in impact studies in operational risk, the group believes that development of promoted by the Basel committee and cEBS, and coordinated the internal model should be largely based on the accumulated at the local level by the Bank of Spain to calibrate the new experience of the entity via the corporate guidelines and criteria regulations denominated Basel iii and whose implementation established after assuming their control and which are precisely involves establishing new standards for capital and liquidity, hallmarks of Santander. The group has made many acquisitions with stricter criteria and standardised at the international level. in the last few years that make necessary a longer period of maturity to develop the internal model based on the own Santander has very solid capital ratios, adjusted to the business management experience of the various entities. However, model and to its risk profile and which put it in a comfortable although for the time being grupo Santander has decided to position to amply meet Basel iii. The impact analysis shows no adhere to the standard approach for calculating regulatory significant affects on the group’s high solvency ratios, which capital, it envisages the possibility of adopting the advanced benefit from a considerable organic capital generation capacity. management approach (AMA) once it has gathered sufficient The new capital regulations will be gradually implemented information on the basis of its own management model in order between 2013 and 2019. to strengthen to the maximum the virtues that characterise the group. grupo Santander has proposed adopting, during the next few years, the advanced internal ratings based (AiRB) models of in Pillar ii grupo Santander uses an economic capital approach Basel ii for almost all its banks (up to covering more than 90% to quantify its global risk profile and its solvency position within of net exposure of the credit portfolio under these models). the process of self-evaluation conducted at the consolidated Meeting this objective in the short term will also be conditioned level (icAAP). This process, which is complemented by the by the acquisition of new entities as well as by the need of qualitative description of the risk management and internal coordination among supervisors of the validation processes of control systems, is revised by the internal audit and internal internal models. The group operates in countries where the validation teams, and is subject to a corporate governance legal framework between supervisors is the same as in Europe framework that culminates with its approval by the board. via the capital directive. However, in other areas, the same Furthermore, the board establishes every year the strategic process is subject to the collaboration framework between the elements regarding risk appetite and solvency objectives. The supervisor in the home country and that in the host country economic capital model considers features not included in Pillar with different legislations, which, in practice, means adapting to 1 (concentration, interest rate and business risks). The group’s different criteria and calendars in order to attain authorisation diversification compensates the additional capital required for for the use of advanced models on a consolidated basis. these risks. With this objective, Santander continued in 2010 to gradually grupo Santander, in accordance with the capital requirements install the necessary technology platforms and methodological set out in the European Directive and the regulations of the developments which will make it possible to progressively apply Bank of Spain, publishes every year the Report with Prudential advanced internal models for calculating regulatory capital in Relevance. This report, published for the first time with data at the rest of the group’s units. At the moment, grupo Santander December 31, 2008, clearly shows the transparency has the supervisory authorisation to use advanced focuses for requirements regarding Pillar iii. grupo Santander regards the calculating the regulatory capital requirements by credit risk for requirements providing the market with information as vital for the parent bank and the main subsidiaries in Spain, the Uk and complementing the minimum capital requirements demanded Portugal (close to two-thirds of its total exposure at the end of by Pillar 1, and the supervisory exam process conducted via Pillar 2010). The strategy of implementing Basel in the group is ii. it is incorporating to its Pillar iii report the recommendations focused on achieving use of advanced models in the main of the committee of European Banking Supervisors (cEBS) in institutions in the Americas and consumer banking in Europe. order to become an international benchmark in matters of transparency to the market as already happens in its annual As regards the rest of risks explicitly envisaged in Pillar 1 of report. Basel, in market risk we have authorisation to use its internal model for the trading activity of Madrid treasury and during As well as the process of implementing the advanced models in 2010 we obtained authorisation for the units in chile and various of the group’s units, Santander is carrying out an Portugal, thus continuing the gradual installation for the rest ambitious training process on Basel at all levels which is of the units presented to the Bank of Spain. reaching a large number of employees in all areas and divisions, 202 ANNUAL REPORT 2010
  • 205.
    with a particularimpact on those most affected by the changes resulting from adopting the new international standards in matters of capital. INTERNAL VALIDATION OF INTERNAL RISK MODELS internal validation is a prerequisite for supervisory validation. A specialised unit of Santander, with complete independence, obtains a technical opinion on whether the internal model is appropriate for the purposes used (internal and regulatory) and concludes on its usefulness and effectiveness. As well as the regulatory requirement, internal validation is also a fundamental support for the board’s committee of risks and local committees of risks in their responsibilities of authorising the use (management and regulatory) of models and their periodic review. Santander’s internal validation covers both credit risk and market risk models and those that set the prices of financial assets as well as the economic capital model. The scope of validation includes not only the most theoretical or methodological aspects but also the technology systems and the quality of data that make implementation effective and, in general, all relevant aspects for management of risk (controls, reporting, uses, involvement of senior management, etc). The function of internal validation is located, at the corporate level, within the area of integral control and internal validation of risk which reports directly to the group’s third vice-chairman and chairman of the board’s risk committee. The function is global and corporate in order to ensure homogeneous application. This is done via four regional centres in Madrid, London, Sao Paulo and New york. These centres report to the corporate centre, which ensures uniformity in the development of their activities. This facilitates application of a common methodology supported by a series of tools developed internally in Santander which provide a robust corporate framework for use in all the group’s units and which automate certain verifications in order to ensure the reviews are conducted efficiently. Moreover, grupo Santander’s corporate framework of internal validation is fully aligned with the criteria for internal validation of advanced models issued by the Bank of Spain. The criterion of separation of functions is maintained between the units of internal validation and internal auditing which, as the last element of control in the group, is responsible for reviewing the methodology, tools and work done by internal validation and giving its opinion on its degree of effective independence. ANNUAL REPORT 2010 203
  • 206.
    8. EcONOMic cAPiTAL Theconcept of economic capital has traditionally been GLOBAL RISK ANALYSIS PROFILE contrasted with that of regulatory capital, as this is the one The group’s risk profile at December 31, 2010, measured in required for the regulation of solvency. The new Basel capital terms of economic capital, is distributed by types of risk and the framework clearly brings both concepts closer together. main business units, is reflected below: While Pillar 1 determines the minimum regulatory capital requirements, Pillar ii quantifies, via economic capital, the group’s global solvency position. DISTRIBUTION OF ECONOMIC CAPITAL By types of risk The group’s model of economic capital quantifies the credit 62% consolidated risk profile taking into account all the significant risks of activity, as well as the consubstantial diversification effect on a multinational and multi-business group like Santander. This economic capital model serves as the group’s base for preparing its self-assessment of capital report in accordance with Bank of Spain regulations under the Basel ii Pillar 2 framework. Material assets 2% The concept of diversification is fundamental for appropriately Equity measuring the risk profile of a global activity group. Although it Business 6% non trading 5% is an intuitive concept and one present in risk management Fx structural 6% since banking began, we can also explain diversification as the Operational 10% Trading 1% ALM 8% fact that the correlation between various risks is imperfect and so the largest events of losses do not happen simultaneously in all portfolios or by types of risk. The sum of the economic DISTRIBUTION OF ECONOMIC CAPITAL capital of the different portfolios and types of risk, considered in By business units isolation, is more than the group’s total economic capital. in continental Europe 38% other words, the group’s overall risk is less than the sum of its parts considered separately. in addition, within the framework of the model for measurement and aggregation of economic capital, the risk of concentration for wholesale portfolios (large companies, banks Uk 11% Financial and sovereigns) is also considered both in its dimension of management and exposure as well as concentration by sectors and countries. equity stakes 13% The existence of concentration in a country or a product in retail portfolios is captured by applying an appropriate model of Sovereign 6% correlations. Rest of Brazil 20% Latin America 12% 204 ANNUAL REPORT 2010
  • 207.
    The distribution ofeconomic capital among the main business RETURN ON RISK ADJUSTED CAPITAL (RORAC) units reflects the diversification of the group’s activity and risk. AND CREATION OF VALUE The group’s diversification is going to increase even more with grupo Santander has been using RORAc methodology in its the acquisitions announced in the last few months in Poland, credit risk management since 1993 in order to: germany, the Uk, Mexico and the US, among others. • calculate the consumption of economic capital and the return on it of the group’s business units, as well as segments, continental Europe accounts for almost 40% of the group’s portfolios and customers, in order to facilitate optimum capital, Latin America including Brazil (20%) almost one-third, assigning of economic capital. the Uk for 11%, and Sovereign 6%, while the corporate area of financial management and equity stakes, which assumes the risk • Budget the capital consumption and RORAc of the group’s from the structural exchange-rate position (derived from stakes business units, including them in their remuneration plans. in subsidiaries abroad denominated in non-euro currencies) and • Analyze and set prices during the decision-taking process for most of the equity stakes accounts for 13%. operations (admission) and clients (monitoring). The economic capital at December 31, 2010 was EUR 46,526 RORAc methodology enables one to compare, on a like-for-like million, including minority interests. basis, the return on operations, customers, portfolios and businesses, identifying those that obtain a risk adjusted return The benefit of diversification envisaged in the economic capital higher than the cost of the group’s capital, aligning model, including both the intra-risks (assimilated to geographic) management of risk and business with the intention to as well as inter-risks, amounted to around 22% at the end maximise the creation of value, the ultimate aim of the group’s of 2010. senior management. The group also conducts capital planning with the main The group regularly assesses the level and evolution of value objective of obtaining future projections of economic and creation (vc) and the risk adjusted return (RORAc) of its main regulatory capital and so be able to assess situations of capital business units. The vc is the profit generated above the cost of sufficiency in various scenarios. Each scenario incorporates the the economic capital (Ec) employed, and is calculated as forecasts of results in a coherent way, both with their strategic follows: objectives (organic growth, M&A, pay-out ratio, etc) as well as with the evolution of the economic situation and in the face of Value creation =profit – (average EC x cost of capital) stress situations. Possible capital management strategies are identified that enable the Bank’s solvency situation to be The economic profit is obtained by making the necessary optimised as well as the return on capital. adjustments to attributable profit so as to extract just the recurrent profit that each unit generates in the year of its activity. The minimum return on capital that an operation must attain is determined by the cost of capital, which is the minimum required by shareholders. it is calculated objectively by adding to the free return of risk the premium that shareholders demand to invest in our group. This premium depends essentially on the degree of volatility in the price of our shares in relation to the market’s performance. The cost of capital in 2010 applied to the group’s various units was 13.606%. ANNUAL REPORT 2010 205
  • 208.
    A positive returnfrom an operation or portfolio means it is contributing to the group’s profits, but it is not really creating shareholder value unless that return exceeds the cost of capital. All the main business units obtained in 2010 a RORAc higher than the cost of capital. The creation of value and the RORAc for the group’s main business areas are shown below: MAIN SEGMENTS Million euros Main segments RORAc creation of value continental Europe 21.2% 1,444 Uk 38.5% 1,284 Latin America 36.5% 3,549 Sovereign 14.0% 13 Subtotal of operating areas 28.3% 6,290 Financial management and equity stakes -44.3% -3,879 Group total 18.5% 2,411 The group’s RORAc comfortably exceeded the cost of capital estimated for 2010 and stood at 18.5%. The creation of value (i.e. the economic profit less the average cost of capital used to achieve it) amounted to EUR 2,411 million. 206 ANNUAL REPORT 2010
  • 209.
    9. RiSk TRAiNiNg AcTiviviES Santander has a corporate school of risks. its purpose is to help HOURS OF TRAINING to consolidate the risk management culture in Santander and ensure that all employees in the risks area are trained and 26,665 developed with the same criteria. The school, which gave a total of 26,665 hours of training 21,479 to 2,849 employees in 2010 in 116 sessions, is the base for strengthening Santander’s leadership in this sphere and continuously enhancing the skills of its staff. it also trains staff from other business segments, particularly in the retail banking area, and aligns the requirements of risk management with business goals. 2009 2010 ANNUAL REPORT 2010 207
  • 210.
  • 211.
    210 THE COMPLIANCE FUNCTION 214 HISTORICAL DATA 216 GENERAL INFORMATION
  • 212.
    Appendices THE COMPLIANCE FUNCTION COMPLIANCE AND REPUTATIONAL RISK The compliance area is part of the General Secretariat division and Reputational risk is that arising from the perception of the Bank by is responsible for global management of the Group’s reputational its various stakeholders, both internal and external, of its activity, risks, compliance and anti-money laundering. The objectives of and which could have an adverse impact on results, capital or compliance are to minimise the probability of irregularities and to business development expectations. This risk relates to juridical, identify, report and quickly resolve those that might occur. economic-financial, ethical, social and environmental aspects, among others. Compliance: Compliance risk is the risk of receiving sanctions, economic or (i) provides advice to senior management on the regulations and otherwise, or other forms of disciplinary measures from supervisory standards of conduct applicable and their evolution; bodies for failing to comply with laws, regulations, rules, self- regulation standards and codes of conduct applied to its activities. (ii) co-operates with senior management in creating a culture of compliance within the Group and establishes written policies Money laundering is participating in any operation whose purpose and procedures; is to hide or mask the nature or origin or funds from criminal activities. Financing of terrorism is understood as providing or (iii) identifies and measures the risks of compliance associated with collecting funds, by any direct or indirect means, in order to use the Group’s activity and assesses regularly whether the policies them or in the knowledge that they will be wholly or partly used to and procedures for managing them are adequate; commit an act of terrorism. (iv)conducts the tests that are needed to verify that the activities are undertaken in accordance with the policies and procedures; and (v) informs senior management of the conclusions. The compliance function focuses on the operational spheres where the Group’s exposure to reputational and compliance risks is the greatest: • Conduct in the securities markets. • Marketing of products and services. • Prevention of money laundering and financing of terrorism. • Relations with regulators and supervisors. • Preparing and disseminating the Group’s institutional information. 210 ANNUAL REPORT 2010
  • 213.
    GOVERNANCE OF THE COMPLIANCEFUNCTION The board, the audit and compliance committee and other CODES OF CONDUCT organs of the Group, with varying levels of responsibility and The functions of compliance management with regard to the different tasks, supervise the compliance function in Grupo Code of Conduct in the Securities Markets (CCSM) are as Santander. The board approves the corporate policy and receives follows: information on how it is applied, while the audit and compliance committee supervises compliance with the Code of 1. Register and control sensitive information known and/or Conduct in the Securities Markets and with the manuals and generated by the Group; procedures for preventing money laundering, and also reviews the compliance of actions and measures resulting from the 2. Maintain the lists of securities affected and related reports or activities of supervisors. personnel, and watch the transactions conducted with these securities; Compliance management reports on an ongoing basis to the board via the audit and compliance committee. The chief 3. Monitor transactions with restricted securities according to compliance officer took part in 10 of the 11 meetings held by the type of activity, portfolios or collectives to whom the this committee in 2010. restriction is applicable; The compliance committee, which is the organ responsible for 4. Receive and deal with communications and requests to carry all matters related to the compliance function that are not out own account transactions; specific ones of marketing products and services or the prevention of money laundering and the financing of terrorism, 5. Control own account transactions of the personnel subject met five times. to the CCSM; The corporate committee of marketing, which is responsible for 6. Manage failures to comply; establishing processes within the Group relating to the approval and monitoring of products and services offered to customers, 7. Resolve doubts on the CCSM; held twenty-one meetings. The analysis and resolution committee, the most senior body specializing in anti-money 8. Resolve and register, in the sphere of its responsibilities, laundering and terrorism financing prevention related matters, conflicts of interest and situations that could give rise to met four times. them; 9. Assess and manage conflicts arising from the analysis activity; 10. Keep the necessary records to control compliance with the obligations envisaged in the CCSM; 11. Develop ordinary contact with regulators; 12. Organise the training and, in general, conduct the actions needed to apply the code; and 13. Analyse activities suspicious of constituting abuse of the market and, where appropriate, report them to the supervisory authorities. INFORME ANUAL 2010 211
  • 214.
    Appendices At the meetingof the audit and compliance committee on 15 OTHER COMPLIANCE ACTIVITIES December, 2010, the chief compliance officer reported on the Compliance management continued to carry out other activities entry into force on 23 December of the Organic Law 5 of 22 in 2010 inherent to its sphere, such as reviewing the Bank’s June, 2010, on the reform of the penal code, considering it internal rules (circulars and various notes) before their necessary to have in the Group a compliance programme that publication, ensuring treasury stock operations are in line with establishes regulations and procedures that try to prevent the internal and external rules, maintaining the section on risk of non-compliance in the Group and which strengthen the regulatory information on the corporate website, reviewing the corporate culture of compliance that Santander has been vote recommendation reports for shareholders’ meetings drawn enforcing intensely for years. up by the leading proxy agencies in this area and sending periodic regulatory information to the supervisory bodies The committee was also informed of the need to modify the (treasury stock, significant equity stakes, opening and closing of General Code of Conduct as it is the core element of the branches, etc). compliance programme and in order to give room to activities which could give rise to penal responsibilities for the Bank and ANTI-MONEY LAUNDERING which until now were not explicitly contemplated in the code. It is a strategic objective of Grupo Santander, a socially responsible organisation, to have an advanced and effective The audit and compliance committee, at its meeting on 15 system to prevent money laundering and the financing of December, 2010, favourably informed on the compliance terrorism, permanently adapted to the latest international programme and on the changes to the General Code regulations and with the capacity to meet the appearance of of Conduct, which were approved by the board on new techniques by criminal organisations. 20 December, 2010. At 31 December 2010, no unit of Grupo Santander in the world MARKETING OF PRODUCTS was subject to corrective measures of sanctions issued by The section on reputational risk in the risk management report supervision or regulatory authorities, as a result of non- (pages 200 to 201 of this annual report) describes the compliance or weaknesses in the sphere of preventing money composition, functions and activities carried out in 2010 by the laundering or the financing of terrorism. corporate committee of marketing. The corporate office for management of reputational risk and the global consultative The organisation to prevent money laundering and the financing committee are also dealt with. of terrorism has three pillars: the anti-money laundering central department (AMLCD), executives in charge of prevention and RELATIONS WITH THE SUPERVISORY AUTHORITIES the analysis and resolution committee. AND DISSEMINATION OF INFORMATION INTO MARKETS In 2010, 499 Group employees were involved in fighting Compliance management is responsible for answering the money-laundering and the financing of terrorism, three-quarters information requirements of the regulatory and supervisory of them full time. There were 209 units in 37 countries. bodies in Spain and in those countries where the Group operates, monitoring the implementation of measures The Group’s policies are set out in corporate manuals (universal, emanating from the reports or inspection activities of these private and correspondent banking). These internal regulations bodies and supervising the way in which the Group disseminates are applied in all the Group’s units, with the necessary local institutional information into markets, ensuring it is done adjustments. The subsidiaries and business areas have their own transparently and in accordance with the requirements of procedure manuals. regulators. During 2010 the AMLCD guided and approved the changes, At each meeting, the audit and compliance committee is adjustments and updating of the internal rules of more than half informed of the main matters. of the Group’s units, in a constant and systematic process of updating. As a result, the Group’s internal rules are line with the OFF-SHORE CENTRES most demanding international standards. In accordance with the recommendations of the Bank of Spain contained in the 2003 Report of Banking Supervision in Spain Grupo Santander’s model is based on customer acceptance regarding subsidiaries and branches in tax havens, compliance policies, which establish rigorous filters, such as a ban on management, in coordination with internal audit, legal affairs, dealing with certain people or risk sectors and, in other cases, a tax advisory, and financial accounting and control, prepared a strict regime of authorisation. report on the Group’s off-shore centres which was reviewed by the audit and compliance committee at its 15 March 2010 During 2010 the AMLCD carried out actions to fully adapt the meeting. units to the rules that transpose the third directive of the European Union, mainly regarding the requirement for customer The 2010 report of the audit and compliance committee risk segmentation in the process of contracting, and the contains more information on this issue. establishment of due diligence differentiated on the basis of the risk (reinforced, standard or simplified). 212 ANNUAL REPORT 2010
  • 215.
    During 2010 theAMLCD took action to fully adapt the units to for the prevention of money laundering and of the rest of the the regulations transposing the third European Union directive, units in Spain. This review also took into account aspects of mainly with respect to the required segmentation of customers coordination and global supervision of the rest of the Group’s by risk in the signing-up process and the establishment of units in the world. The report issued in April 2010 revealed no separate due diligence processes in terms of risk (enhanced, weakness in the system and limited itself to formulating an standard or simplified). eventual recommendation of the rectification suggested. The units in Europe and in most of Latin America are Banco Santander is a founder member of the Wolfsberg Group participating in this work. The technological developments are along with 10 other large international banks. The Wolfsberg important and the impact on the contracting model is high. At Group’s purpose is to establish international standards that the same time, we are tackling, with time frames set by various increase the effectiveness of programmes to combat money- legislations, complex and costly processes of updating the data laundering and the financing of terrorism in the financial of the global portfolio of customers. community. Various initiatives have been developed on anti- money laundering in private and correspondent banking, the Grupo Santander has established in all its units and business financing of terrorism, among others. Regulatory authorities and areas corporate systems based on decentralised IT applications. experts in this area believe that the principles and guidelines set These enable operations and customers who because of their by the Wolfsberg Group represent an important step in the fight risk need to be analysed to be presented to the branches of the against money-laundering, corruption, terrorism and other account and/or customer relation managers. The tools are serious crimes. complemented by others centralised by teams of analysis from prevention units who, in accordance with certain risk profiles During 2010, the Wolfsberg Group maintained the working and changes in certain patterns of customer behaviour, enable groups to propose the best practices regarding controls for the operations susceptible of being linked to money laundering prevention of money laundering and the financing of terrorism and/or the financing of terrorism to be analysed, identified early in activities such as trade finance and in prepaid cards, as well as on and monitored. for the effective application of controls and filters on applicable lists in matters of international sanctions. The Group analysed a total of 34.6 million operations in 2010 (both by the commercial networks as well as money laundering prevention teams), of which more than one million were by the MAIN INDICATORS OF ACTIVITY 2010 units in Spain. Procedures have been established in all units that enable Number of subsidiaries reviewed 171 suspicious transactions to be communicated to the authorities, Number of cases investigated 70,102 guaranteeing throughout the circuit the strictest confidentiality. Number of reports sent to authorities 16,830 The rating accorded by the authorities to the Group’s communications in all countries is good. Number of employees trained 84,820 One of the Group’s priorities in this sphere is to take the necessary steps so that all employees know the requirements resulting from the prevailing regulations. The aim of the training actions is to enable employees to detect these operations and instruct them in what to do. In 2010, 84,820 employees received training on prevention of money laundering (a total of 126,863 hours). The internal audit function is necessary in order to guarantee continuous compliance with these policies and it is responsible for ensuring the system is efficient. In addition, many units are submitted to periodic reviews by external auditors, Deloitte carried out an integral review of the parent bank’s global system ANNUAL REPORT 2010 213
  • 216.
    HISTORICAL DATA(1) 2000 -2010 2010 2009 2008 2007 2006 Mill. US$ Mill. euros Mill. euros Mill. euros Mill. euros Mill. euros BALANCE SHEET Total assets 1,626,824 1,217,501 1,110,529 1,049,632 912,915 833,873 Net customer loans 967,614 724,154 682,551 626,888 571,099 523,346 Customer deposits 823,601 616,376 506,976 420,229 355,407 331,223 Customer funds under management 1,316,517 985,269 900,057 826,567 784,872 739,223 Shareholders' equity 100,580 75,273 70,006 63,768 51,945 40,062 Total managed funds 1,820,291 1,362,289 1,245,420 1,168,355 1,063,892 1,000,996 INCOME STATEMENT Net interest income 38,658 29,224 26,299 20,945 14,443 12,480 Gross income 55,623 42,049 39,381 33,489 26,441 22,333 Net operating income 31,554 23,853 22,960 18,540 14,417 11,218 Profit before taxes 15,942 12,052 10,588 10,849 10,970 8,995 Attributable profit to the Group 10,822 8,181 8,943 8,876 9,060 7,596 2010 2009 2008 2007 2006 US$ Euros Euros Euros Euros Euros PER SHARE DATA(2) Attributable profit to the Group 1.2458 0.9418 1.0454 1.2207 1.3320 1.1334 Dividend 0.8017 0.6000 0.6000 0.6325 0.6068 0.4854 Share price 10.593 7.928 11.550 6.750 13.790 13.183 Market capitalisation (million) 88,234 66,033 95,043 53,960 92,501 88,436 Euro / US$ = 1.3362 (balance sheet) and 1.3228 (income statement) (1).- Figures from 2004 on according to IFRS. (2).- Figures adjusted to capital increases. (3).- Compound Annual Growth Rate. TOTAL MANAGED FUNDS NET CUSTOMER LOANS Billion euros Billion euros 1,362 724 1,245 1,168 683 627 1,064 571 1,001 523 962 436 793 369 461 453 438 418 173 174 169 163 2000 2001 2002 2003 2004 2005 2006 2007 2008 2009 2010 2000 2001 2002 2003 2004 2005 2006 2007 2008 2009 2010 with IFRS with IFRS 214 ANNUAL REPORT 2010
  • 217.
    2005 2004 2003 2002 2001 2000 CAGR(3) Mill. euros Mill. euros Mill. euros Mill. euros Mill. euros Mill. euros (%) 809,107 664,486 351,791 324,208 358,138 348,928 13.3 435,829 369,350 172,504 162,973 173,822 169,384 15.6 305,765 283,212 159,336 167,816 181,527 169,555 13.8 651,360 595,380 323,901 304,893 331,379 303,098 12.5 35,841 32,111 18,364 17,594 19,128 17,798 15.5 961,953 793,001 460,693 417,546 453,384 437,576 12.0 10,659 7,562 7,958 9,359 10,257 8,290 13.4 19,076 13,999 13,128 14,004 15,564 13,005 12.5 8,765 6,431 5,721 5,566 5,944 4,689 17.7 7,661 4,387 4,101 3,509 4,237 3,774 12.3 6,220 3,606 2,611 2,247 2,486 2,258 13.7 2005 2004 2003 2002 2001 2000 CAGR(3) Euros Euros Euros Euros Euros Euros (%) 0.9293 0.6791 0.5105 0.4431 0.5079 0.5006 6.5 0.3883 0.3107 0.2824 0.2690 0.2690 0.2550 8.9 10.396 8.512 8.755 6.098 8.773 10.629 (2.9) 69,735 57,102 44,775 31,185 43,845 51,987 2.4 ATTRIBUTABLE PROFIT TO THE GROUP* DIVIDEND PER SHARE* Million euros Euros 0.6325 9,060 8,943 8,876 0.6068 0.6000 0.6000 8,181 7,596 0.4854 6,220 0.3883 0.3107 0.2824 0.2690 0.2690 0.2550 3,606 2,611 2,486 2,258 2,247 2000 2001 2002 2003 2004 2005 2006 2007 2008 2009 2010 2000 2001 2002 2003 2004 2005 2006 2007 2008 2009 2010 with IFRS (*).- Includes extraordinary capital gains and allowances (EUR 1,008 million in 2005, EUR 1,014 million (*).- Figures adjusted to capital increases and stock splits. in 2006 and EUR 950 million in 2007). ANNUAL REPORT 2010 214
  • 218.
    GENERAL INFORMATION Banco Santander, S.A. Relations with Santander Shareholders The parent bank of Grupo Santander was Santander Group City established on March 21, 1857 and incorporated Edificio Marisma, Planta Baja, in its present form by a public deed executed in Avda. De Cantabria s/n Santander, Spain, on January 14, 1875, recorded 28660 Boadilla del Monte in the Mercantile Registry (Finance Section) of Madrid the Government of the Province of Santander, Spain on folio 157 and following, entry number 859. Telephones: 902 11 17 11 and +34 91 276 92 90 The Bank’s By-laws were amended to conform with current legislation regarding limited liability companies. The amendment was registered on Relations with investors and analysts June 8, 1992, and entered in the Mercantile Santander Group City Registry of Santander (volume 448, general Edificio Pereda, Planta Primera, section, folio 1, page 1,960, first inscription of Avda. De Cantabria s/n adaptation). 28660 Boadilla del Monte Madrid The Bank is also recorded in the Special registry Spain of Banks and Bankers 0049, and its fiscal Telephone: +34 91 259 65 14 identification number is A-390000013. It is a member of the Bank Deposit Guarantee Fund. Customer Attention Department Santander Group City Registered Office Avda. De Cantabria s/n The corporate by-laws and additional public 28660 Boadilla del Monte information regarding the company may be Madrid inspected at its registered office at Paseo de Spain la Pereda, numbers 9 to 12, Santander. Telephone: 91 257 30 80 Fax: 91 254 10 38 atenclie@gruposantander.com Operational Headquarters Santander Group City Avda. De Cantabria s/n Ombudsman 28660 Boadilla del Monte Mr José Luis Gómez-Dégano, Madrid PO Box 14019 Spain 28080 Madrid Spain General Information Telephone: 902 11 2211 Telephone: 91 289 00 00 www.santander.com This report was printed on ecology-friendly paper and has been produced using environmentally friendly processes. © April 2011, Grupo Santander Design: Addison Photographs: Íñigo Plaza Cano, Ángel Baltanás, Pisco del Gaiso, Javier Marlán. Printing: Litofinter, S.A. Legal deposit: