Financial Analysis - Veolia environnement operates utility and public tran…
•
1 like•420 views

Veolia Environnement operates utility and public transportation businesses around the world. It provides water, waste management, and energy services. The company generates most of its revenue in France, but also has significant operations in other European countries and the United States. Institutional investors own about 43% of Veolia shares, with most of the remaining shares held by retail investors. Caisse des Dépots et Consignations is the largest shareholder, owning over 9% of outstanding shares. Analyst recommendations and price targets for Veolia shares are mixed.

Recommended
Recommended
More Related Content
What's hot
What's hot (17)
Similar to Financial Analysis - Veolia environnement operates utility and public tran…
Similar to Financial Analysis - Veolia environnement operates utility and public tran… (20)
More from BCV
More from BCV (20)
Financial Analysis - Veolia environnement operates utility and public tran…
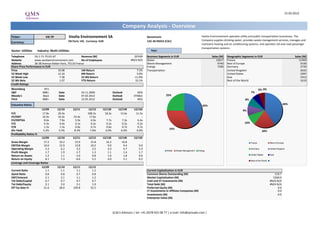
- 1. 15.03.2013 Company Analysis - Overview Ticker: VIE FP Veolia Environnement SA Benchmark: Veolia Environnement operates utility and public transportation businesses. The EN Paris: VIE, Currency: EUR CAC 40 INDEX (CAC) Company supplies drinking water, provides waste management services, manages and Currency: maintains heating and air conditioning systems, and operates rail and road passenger transportation systems. Sector: Utilities Industry: Multi-Utilities Year: Telephone 33-1-71-75-01-67 Revenue (M) 29'439 Business Segments in EUR Sales (M) Geographic Segments in EUR Sales (M) Website www.veoliaenvironnement.com No of Employees #N/A N/A Water 12617 France 11459 Address 36-38 Avenue Kleber Paris, 75116 France Waste Management 9740 Rest of Europe 5536 Share Price Performance in EUR Energy 7290 Germany 2739 Price 10.08 1M Return 7.5% Transportation United Kingdom 2632 52 Week High 12.16 6M Return 5.6% United States 2287 52 Week Low 7.38 52 Wk Return -11.0% Asia 1912 52 Wk Beta 1.07 YTD Return 10.1% Rest of the World 1610 Credit Ratings Bloomberg HY1 6% 0% S&P BBB+ Date 24.11.2000 Outlook NEG 7% Moody's Baa1 Date 07.02.2012 Outlook STABLE 25% Fitch BBB+ Date 22.05.2012 Outlook NEG 8% Valuation Ratios 40% 42% 12/09 12/10 12/11 12/12 12/13E 12/14E 12/15E 9% P/E 17.8x 20.4x - 508.3x 18.3x 13.6x 11.5x EV/EBIT 16.4x 16.3x 23.4x 17.6x - - - EV/EBITDA 8.6x 7.9x 5.9x 6.0x 7.7x 7.2x 6.4x P/S 0.3x 0.4x 0.1x 0.2x 0.2x 0.2x 0.2x 10% P/B 1.5x 1.3x 0.6x 0.7x 0.6x 0.7x 0.7x 33% Div Yield 5.2% 5.5% 8.3% 7.6% 6.6% 6.6% 6.6% 20% Profitability Ratios % 12/09 12/10 12/11 12/12 12/13E 12/14E 12/15E Gross Margin 17.2 19.2 15.9 15.8 16.2 16.8 - France Rest of Europe EBITDA Margin 10.0 12.9 12.8 10.2 9.0 9.4 9.9 Operating Margin 5.3 6.2 3.2 3.5 4.3 4.7 5.3 Germany United Kingdom Water Waste Management Energy Profit Margin 1.7 1.9 -1.7 1.3 1.1 1.4 1.7 United States Asia Return on Assets 1.2 1.1 -1.0 0.8 1.6 1.8 0.9 Return on Equity 8.1 7.3 -6.6 5.5 4.0 5.1 6.2 Rest of the World Leverage and Coverage Ratios 12/09 12/10 12/11 12/12 Current Ratio 1.1 1.1 1.1 1.2 Current Capitalization in EUR Quick Ratio 0.8 0.8 0.7 0.8 Common Shares Outstanding (M) 519.7 EBIT/Interest 2.1 2.1 1.1 1.2 Market Capitalization (M) 5260.0 Tot Debt/Capital 0.7 0.7 0.7 0.7 Cash and ST Investments (M) #N/A N/A Tot Debt/Equity 2.1 2.0 2.1 1.9 Total Debt (M) #N/A N/A Eff Tax Rate % 21.6 28.0 239.8 52.5 Preferred Equity (M) 0.0 LT Investments in Affiliate Companies (M) 0.0 Investments (M) 0.0 Enterprise Value (M) Q.M.S Advisors | tel: +41 (0)78 922 08 77 | e-mail: info@qmsadv.com |
- 2. Company Analysis - Analysts Ratings Veolia Environnement SA Target price in EUR Broker Recommendation Buy and Sell Recommendations vs Price and Target Price Price Brokers' Target Price 18 16 100% 18% 18% 21% 19% 19% 22% 23% 16 14 25% 26% 24% 25% 24% 80% 14 12 22% 18% 12 10 36% 31% 21% 24% 39% 25% 34% 38% 60% 30% 33% 8 10 8 6 40% 6 4 57% 59% 50% 50% 54% 52% 46% 45% 43% 4 2 20% 43% 42% 43% 2 0 Day by Day Brean Murray Bryan Garnier & Morgan Stanley Barclays Raymond S&P Capital IQ Natixis Securities(ESN) Kepler Capital Partners SA Credit Suisse Exane BNP JPMorgan Macquarie BPI Generale HSBC Nomura DZ Bank AG Dimensions AlphaValue Berenberg Bank Goldman Sachs Deutsche Bank Carret & Co Societe James Hammer Paribas Markets CM - CIC 0% 0 EVA Cie mars.12 avr.12 mai.12 juin.12 juil.12 août.12 sept.12 oct.12 nov.12 déc.12 janv.13 févr.13 Buy Hold Sell Price Target Price Date Buy Hold Sell Date Price Target Price Broker Analyst Recommendation Target Date 28-Feb-13 52% 24% 24% 15-Mar-13 10.08 9.82 Credit Suisse MICHEL DEBS underperform 9.00 13-Mar-13 31-Jan-13 54% 21% 25% 14-Mar-13 10.27 9.82 EVA Dimensions AUSTIN BURKETT hold 12-Mar-13 31-Dec-12 59% 18% 23% 13-Mar-13 10.21 9.82 Goldman Sachs DARIO CARRADORI neutral/neutral 11.30 11-Mar-13 30-Nov-12 57% 22% 22% 12-Mar-13 10.30 9.83 S&P Capital IQ STEWART SCHARF hold 11.00 8-Mar-13 31-Oct-12 43% 33% 24% 11-Mar-13 10.35 9.83 AlphaValue FABRICE FARIGOULE buy 12.30 7-Mar-13 28-Sep-12 43% 30% 26% 8-Mar-13 10.63 9.83 Bryan Garnier & Cie JULIEN DESMARETZ buy 13.00 6-Mar-13 31-Aug-12 42% 38% 19% 7-Mar-13 10.54 9.87 Day by Day VALERIE GASTALDY buy 11.90 5-Mar-13 31-Jul-12 50% 31% 19% 6-Mar-13 10.52 9.87 Societe Generale VINCENT AYRAL buy 9.80 1-Mar-13 29-Jun-12 45% 34% 21% 5-Mar-13 10.42 9.87 Morgan Stanley EMMANUEL TURPIN Equalwt/In-Line 10.00 1-Mar-13 31-May-12 46% 36% 18% 4-Mar-13 10.22 9.84 Raymond James EMMANUEL RETIF outperform 11.10 1-Mar-13 30-Apr-12 50% 25% 25% 1-Mar-13 9.64 9.84 CM - CIC Securities(ESN) OLIVIER BAILS hold 9.50 1-Mar-13 30-Mar-12 43% 39% 18% 28-Feb-13 9.64 9.58 Natixis PHILIPPE OURPATIAN buy 13.50 1-Mar-13 27-Feb-13 9.51 9.58 Exane BNP Paribas OLIVIER VAN DOOSSELAERE underperform 9.00 1-Mar-13 26-Feb-13 9.04 9.58 JPMorgan NATHALIE F CASALI underweight 7.00 22-Feb-13 25-Feb-13 9.25 9.58 Macquarie ATALLAH ESTEPHAN underperform 7.50 22-Feb-13 22-Feb-13 9.15 9.58 BPI LOUIS BOUJARD buy 11.30 11-Feb-13 21-Feb-13 9.03 9.74 Berenberg Bank ANDREW FISHER buy 10.80 5-Feb-13 20-Feb-13 9.37 9.74 Barclays JULIE ARAV overweight 11.00 25-Jan-13 19-Feb-13 9.56 9.74 HSBC VERITY MITCHELL overweight 10.50 18-Jan-13 18-Feb-13 9.47 9.74 Deutsche Bank JAMES BRAND hold 8.00 7-Jan-13 15-Feb-13 9.38 9.74 Nomura MARTIN YOUNG buy 9.90 12-Dec-12 14-Feb-13 9.28 9.74 Hammer Partners SA CHRIS MOORE sell 7.00 24-Apr-12 13-Feb-13 9.72 9.74 DZ Bank AG HASIM SENGUEL buy 13.00 29-Feb-12 12-Feb-13 9.71 9.74 Kepler Capital Markets TEAM COVERAGE not rated 31-Oct-11 11-Feb-13 9.56 9.74 Brean Murray Carret & Co MICHAEL E GAUGLER hold 6-Sep-11 8-Feb-13 9.70 9.64 7-Feb-13 9.61 9.69 6-Feb-13 9.51 9.69 5-Feb-13 9.44 9.69 4-Feb-13 9.31 9.61 Q.M.S Advisors | tel: +41 (0)78 922 08 77 | e-mail: info@qmsadv.com |
- 3. 15.03.2013 Veolia Environnement SA Company Analysis - Ownership Ownership Type Ownership Statistics Geographic Ownership Distribution Geographic Ownership 0% Shares Outstanding (M) 519.7 France 69.26% 1% 1% 4% Float 73.1% Norway 9.11% 3% Short Interest (M) United States 7.24% 6% Short Interest as % of Float Luxembourg 5.72% 43% Days to Cover Shorts Switzerland 3.02% 7% Institutional Ownership 42.83% Ireland 1.07% Retail Ownership 57.12% 57% Britain 0.97% Insider Ownership 0.05% Others 3.61% 9% 69% Institutional Ownership Distribution Investment Advisor 34.83% Government 25.26% Corporation 17.39% Institutional Ownership Retail Ownership Insider Ownership Mutual Fund Manager 13.29% France Norway United States Luxembourg Pricing data is in EUR Others 9.23% Switzerland Ireland Britain Others Top 20 Owners: TOP 20 ALL Institutional Ownership Holder Name Position Position Change Market Value % of Ownership Report Date Source Country CAISSE DES DEPOTS ET 47'873'873 0 482'329'270 9.17% 31.12.2011 Co File FRANCE 9% GROUPE INDUSTRIEL MA 32'888'732 0 331'353'975 6.30% 31.12.2011 Co File FRANCE GROUPAMA ASSET MANAG 29'366'758 0 295'870'087 5.62% 31.12.2011 Co File FRANCE 36% VELO INVEST 24'681'519 0 248'666'304 4.73% 31.12.2011 Co File NORWAY 13% ELECTRICITE DE FRANC 20'577'271 0 207'316'005 3.94% 31.12.2011 Co File FRANCE VEOLIA ENVIRONNEMENT 14'237'927 0 143'447'115 2.73% 31.12.2011 Co File FRANCE AMUNDI 13'947'585 -16'312'801 140'521'919 2.67% 31.12.2011 13G FRANCE VANGUARD GROUP INC 6'531'940 158'722 65'809'296 1.25% 31.12.2012 MF-AGG UNITED STATES PICTET & CIE 6'461'052 304 65'095'099 1.24% 30.11.2012 MF-AGG SWITZERLAND 17% 25% NATIXIS ASSET MANAGE 6'190'509 -64'740 62'369'378 1.19% 31.01.2013 MF-AGG FRANCE PICTET ASSET MANAGEM 5'783'427 -224'399 58'268'027 1.11% 30.11.2012 MF-AGG BRITAIN MANDARINE GESTION 5'636'031 -643'999 56'783'012 1.08% 28.02.2013 MF-AGG FRANCE BLACKROCK 5'122'492 120'729 51'609'107 0.98% 13.03.2013 ULT-AGG UNITED STATES ALLIANZ ASSET MANAGE 4'776'617 155'025 48'124'416 0.91% 28.02.2013 ULT-AGG GERMANY Investment Advisor Government Corporation Mutual Fund Manager Others AQR CAPITAL MANAGEME -3'701'595 -965'860 -37'293'570 -0.71% 25.10.2012 Short UNITED STATES ING INTERNATIONAL AD 3'159'183 -1'040'593 31'828'769 0.61% 31.12.2012 MF-AGG LUXEMBOURG JULIUS BAER MULTIPAR 3'065'847 92'713 30'888'409 0.59% 29.02.2012 MF-AGG LUXEMBOURG AVIVA PLC 2'974'900 0 29'972'118 0.57% 28.02.2013 MF-AGG BRITAIN B & G FUND PLC -2'401'599 678'713 -24'196'110 -0.46% 04.03.2013 Short MARSHALL WACE LLP -2'140'556 678'713 -21'566'102 -0.41% 04.03.2013 Short BRITAIN Top 5 Insiders: Holder Name Position Position Change Market Value % of Ownership Report Date Source PROGLIO HENRI 248'077 2'499'376 0.05% 31.12.2011 Co File FREROT ANTOINE 10'793 108'739 0.00% 31.12.2011 Co File SCHWEITZER LOUIS 5'828 58'717 0.00% 31.12.2011 Co File MICHEL SERGE 3'094 31'172 0.00% 31.12.2011 Co File BOUTON DANIEL 3'065 30'880 0.00% 31.12.2011 Co File Q.M.S Advisors | tel: +41 (0)78 922 08 77 | e-mail: info@qmsadv.com |
- 4. Company Analysis - Financials I/IV Veolia Environnement SA Financial information is in EUR (M) Equivalent Estimates Periodicity: Fiscal Year 12/02 12/03 12/04 12/05 12/06 12/07 12/08 12/09 12/10 12/11 12/12 12/13E 12/14E 12/15E Income Statement Revenue 30'079 28'603 22'500 25'245 28'620 32'628 35'765 33'952 28'764 29'647 29'439 27'066 27'747 29'586 - Cost of Goods Sold 24'638 23'726 18'346 20'561 23'427 26'930 30'013 28'116 23'255 24'919 24'795 Gross Income 5'441 4'877 4'154 4'684 5'193 5'699 5'751 5'836 5'509 4'728 4'643 4'385 4'661 - Selling, General & Admin Expenses 3'720 3'336 2'673 2'791 3'126 3'308 3'840 4'050 3'714 3'771 3'610 (Research & Dev Costs) 93 95 63 63 66 85 92 90 87 112 Operating Income 1'721 1'541 1'481 1'893 2'067 2'390 1'911 1'786 1'795 957 1'033 1'176 1'315 1'580 - Interest Expense 694 638 829 782 784 970 1'111 864 852 862 839 - Foreign Exchange Losses (Gains) -44 8 14 -14 14 3 43 10 0 8 - Net Non-Operating Losses (Gains) 152 2'431 -181 -99 -135 -280 -275 -196 -196 -138 -109 Pretax Income 919 -1'535 819 1'225 1'404 1'698 1'032 1'108 1'139 225 303 581 744 987 - Income Tax Expense 437 274 184 423 410 420 462 239 319 539 159 Income Before XO Items 481 -1'809 635 802 994 1'278 570 869 820 -314 144 - Extraordinary Loss Net of Tax 106 -1 23 -139 27 -29 2 -386 - Minority Interests 142 246 138 179 236 327 304 258 291 173 136 Diluted EPS Before XO Items 1.24 1.56 1.88 2.18 0.57 1.30 1.10 (0.99) 0.02 Net Income Adjusted* 339 -2'055 231 623 758 933 405 584 605 272 72 294 394 495 EPS Adjusted 0.90 (4.99) 0.30 1.57 1.89 2.17 0.89 1.24 1.26 0.55 0.14 0.55 0.74 0.87 Dividends Per Share 0.81 0.81 0.67 0.84 1.03 1.21 1.21 1.21 1.21 0.70 0.70 0.66 0.67 0.67 Payout Ratio % 65.7 53.4 53.5 55.0 58.1 215.0 97.8 110.9 1.20 0.90 0.76 Total Shares Outstanding 403 403 397 399 404 457 458 479 485 505 520 Diluted Shares Outstanding 412 403 399 404 435 460 471 482 496 507 EBITDA 3'682 3'481 3'484 3'325 3'262 3'710 3'384 3'392 3'698 3'805 3'014 2'441 2'600 2'940 *Net income excludes extraordinary gains and losses and one-time charges. Q.M.S Advisors | tel: +41 (0)78 922 08 77 | e-mail: info@qmsadv.com |
- 5. Company Analysis - Financials II/IV Periodicity: 12/02 12/03 12/04 12/05 12/06 12/07 12/08 12/09 12/10 12/11 12/12 12/13E 12/14E 12/15E Balance Sheet Total Current Assets 15358.7002 15609.9004 15169.3 13541.6 15023.7 17214 19084.3 20221.7 20371.9 21948.5 22038.4 + Cash & Near Cash Items 2'382 2'538 4'660 2'336 2'658 3'116 3'850 5'614 5'407 5'724 5'548 + Short Term Investments 169 1'113 189 61 66 0 0 + Accounts & Notes Receivable 11'146 10'433 7'292 8'239 9'779 9'304 9'702 9'081 9'252 8'493 10'306 + Inventories 1'175 1'068 589 676 732 839 1'022 997 1'131 1'021 1'018 + Other Current Assets 488 458 2'439 2'229 1'789 3'955 4'511 4'529 4'582 6'711 5'166 Total Long-Term Assets 26'568 23'221 20'657 22'768 25'100 29'093 30'042 29'595 31'055 28'457 22'574 + Long Term Investments 1'522 1'368 2'914 3'053 5'953 5'529 6'319 6'204 6'159 5'931 3'317 Gross Fixed Assets 24'143 24'722 21'314 24'092 16'912 18'886 19'492 19'990 21'116 18'673 Accumulated Depreciation 9'602 10'303 10'356 11'741 8'993 9'683 10'064 10'608 11'413 10'185 + Net Fixed Assets 14'541 14'419 10'958 12'352 7'919 9'203 9'427 9'382 9'703 8'488 6'838 + Other Long Term Assets 10'506 7'433 6'784 7'363 11'229 14'361 14'296 14'009 15'193 14'038 12'419 Total Current Liabilities 15'404 15'291 16'150 13'793 15'514 18'069 18'274 17'657 18'116 19'680 18'682 + Accounts Payable 6'308 6'242 9'576 10'374 5'734 12'945 13'592 13'076 13'774 12'599 11'599 + Short Term Borrowings 3'796 3'827 5'846 2'645 3'360 4'264 3'685 3'438 3'214 4'383 3'918 + Other Short Term Liabilities 5'300 5'222 728 774 6'420 860 997 1'143 1'128 2'699 3'166 Total Long Term Liabilities 17'700 17'375 14'728 16'823 18'056 18'047 21'320 22'029 22'507 20'890 16'804 + Long Term Borrowings 12'913 12'586 12'157 13'723 14'002 13'948 17'064 17'647 17'896 16'707 13'084 + Other Long Term Borrowings 4'787 4'788 2'571 3'100 4'055 4'099 4'256 4'382 4'610 4'184 3'720 Total Liabilities 33'104 32'666 30'878 30'616 33'570 36'116 39'594 39'686 40'623 40'571 35'486 + Long Preferred Equity 0 0 0 0 0 0 0 0 + Minority Interest 2'585 2'680 1'726 1'891 2'193 2'578 2'531 2'670 2'929 2'765 1'974 + Share Capital & APIC 8'287 8'287 8'500 8'539 8'704 11'538 11'373 11'714 11'823 12'207 11'077 + Retained Earnings & Other Equity -2'049 -4'802 -5'277 -4'736 -4'344 -3'925 -4'372 -4'253 -3'947 -5'137 -3'925 Total Shareholders Equity 8'823 6'165 4'948 5'694 6'553 10'191 9'532 10'131 10'804 9'835 9'126 Total Liabilities & Equity 41'927 38'831 35'826 36'309 40'124 46'307 49'126 49'817 51'427 50'406 44'612 Book Value Per Share 15.49 8.66 8.12 9.54 10.79 16.67 15.30 15.58 16.25 13.99 13.76 15.63 14.97 14.98 Tangible Book Value Per Share -5.59 -5.60 -12.54 -8.75 -10.70 -8.83 -9.56 -9.17 -6.36 Q.M.S Advisors | tel: +41 (0)78 922 08 77 | e-mail: info@qmsadv.com |
- 6. Company Analysis - Financials III/IV Periodicity: 12/02 12/03 12/04 12/05 12/06 12/07 12/08 12/09 12/10 12/11 12/12 12/13E 12/14E 12/15E Cash Flows Net Income 339 -2'055 392 623 759 928 405 584 559 -490 394 281 371 473 + Depreciation & Amortization 1'961 1'940 2'003 1'432 1'195 1'319 1'473 1'606 1'903 2'848 1'981 + Other Non-Cash Adjustments 480 2'816 828 1'294 951 838 1'106 249 81 -115 -471 + Changes in Non-Cash Capital -463 398 294 -52 -112 -167 -81 432 106 -41 103 Cash From Operating Activities 2'317 3'098 3'517 3'296 2'793 2'919 2'902 2'872 2'648 2'203 2'007 + Disposal of Fixed Assets 198 226 316 174 141 213 330 259 205 169 174 + Capital Expenditures -2'603 -2'456 -1'964 -2'082 -2'018 -2'519 -2'781 -2'105 -2'084 -2'258 -2'302 -1'724 -2'199 -2'222 + Increase in Investments -1'131 -474 -511 -1'213 -1'652 -2'240 -1'308 -661 -915 -736 -580 + Decrease in Investments 1'573 494 2'314 338 645 542 719 978 923 1'728 3'182 + Other Investing Activities -146 -903 19 244 -20 -16 -296 178 41 -53 -46 Cash From Investing Activities -2'109 -3'112 175 -2'540 -2'904 -4'018 -3'335 -1'352 -1'830 -1'150 428 + Dividends Paid -300 -309 -390 -374 -479 -564 -754 -434 -736 -547 -547 + Change in Short Term Borrowings -2'032 399 1'789 -2'936 -239 -1'535 -1'437 -1'324 -938 -535 -1'269 + Increase in Long Term Borrowings 4'194 4'133 931 3'134 1'997 2'060 3'590 3'301 538 745 1'326 + Decrease in Long Term Borrowings -3'870 -3'791 -3'469 -2'319 -1'001 -1'363 -185 -1'515 -149 -315 -1'660 + Increase in Capital Stocks 1'554 10 167 81 247 3'058 3 162 137 5 3 + Decrease in Capital Stocks 0 0 -183 0 0 0 -80 + Other Financing Activities -208 -210 -617 -753 -41 -103 23 66 191 -142 -314 Cash From Financing Activities -662 231 -1'772 -3'167 484 1'554 1'160 256 -957 -789 -2'459 Net Changes in Cash -454 217 1'920 -2'411 373 454 728 1'776 -140 264 -25 Free Cash Flow (CFO-CAPEX) -287 643 1'553 1'214 776 400 122 767 564 -56 -295 187 -170 -31 Free Cash Flow To Firm 77 2'196 1'726 1'331 1'130 736 1'444 1'177 -1'260 103 Free Cash Flow To Equity -1'797 1'609 -224 2'420 1'488 220 9 Free Cash Flow per Share -0.76 1.56 3.85 3.06 1.94 0.93 0.26 1.63 1.17 -0.11 -0.58 Q.M.S Advisors | tel: +41 (0)78 922 08 77 | e-mail: info@qmsadv.com |
- 7. Company Analysis - Financials IV/IV Periodicity: 12/02 12/03 12/04 12/05 12/06 12/07 12/08 12/09 12/10 12/11 12/12 12/13E 12/14E 12/15E Ratio Analysis Valuation Ratios Price Earnings 24.3x 21.2x 23.9x 30.3x 28.2x 38.4x 17.8x 20.4x 508.3x 18.3x 13.6x 11.5x EV to EBIT 14.8x 15.5x 17.1x 16.3x 19.4x 19.3x 15.5x 16.4x 16.3x 23.4x 17.6x EV to EBITDA 6.9x 6.9x 7.3x 9.3x 12.3x 12.5x 8.7x 8.6x 7.9x 5.9x 6.0x 7.7x 7.2x 6.4x Price to Sales 0.3x 0.3x 0.5x 0.6x 0.8x 0.8x 0.3x 0.3x 0.4x 0.1x 0.2x 0.2x 0.2x 0.2x Price to Book 1.4x 2.4x 3.2x 3.9x 5.3x 3.7x 1.5x 1.5x 1.3x 0.6x 0.7x 0.6x 0.7x 0.7x Dividend Yield 3.7% 3.9% 2.6% 2.2% 1.8% 1.9% 5.5% 5.2% 5.5% 8.3% 7.6% 6.6% 6.6% 6.6% Profitability Ratios Gross Margin 18.1% 17.1% 18.5% 18.6% 18.1% 17.5% 16.1% 17.2% 19.2% 15.9% 15.8% 16.2% 16.8% EBITDA Margin 12.2% 12.2% 15.5% 13.2% 11.4% 11.4% 9.5% 10.0% 12.9% 12.8% 10.2% 9.0% 9.4% 9.9% Operating Margin 5.7% 5.4% 6.6% 7.5% 7.2% 7.3% 5.3% 5.3% 6.2% 3.2% 3.5% 4.3% 4.7% 5.3% Profit Margin 1.1% -7.2% 1.7% 2.5% 2.7% 2.8% 1.1% 1.7% 1.9% -1.7% 1.3% 1.1% 1.4% 1.7% Return on Assets 0.8% -5.1% 1.0% 1.7% 2.0% 2.1% 0.8% 1.2% 1.1% -1.0% 0.8% 1.6% 1.8% 0.9% Return on Equity 5.7% -42.3% 11.7% 17.7% 18.6% 15.5% 5.5% 8.1% 7.3% -6.6% 5.5% 4.0% 5.1% 6.2% Leverage & Coverage Ratios Current Ratio 1.00 1.02 0.94 0.98 0.97 0.95 1.04 1.15 1.12 1.12 1.18 Quick Ratio 0.89 0.92 0.75 0.77 0.81 0.69 0.74 0.83 0.81 0.72 0.85 Interest Coverage Ratio (EBIT/I) 2.48 2.42 1.79 2.42 2.64 2.47 1.72 2.07 2.11 1.11 1.23 Tot Debt/Capital 0.65 0.73 0.78 0.74 0.73 0.64 0.69 0.68 0.66 0.68 0.65 Tot Debt/Equity 1.89 2.66 3.64 2.87 2.65 1.79 2.18 2.08 1.95 2.14 1.86 Others Asset Turnover 0.70 0.71 0.60 0.70 0.75 0.76 0.75 0.69 0.57 0.58 0.62 Accounts Receivable Turnover 2.59 2.65 2.54 3.25 3.18 3.42 3.76 3.62 3.14 3.34 3.13 Accounts Payable Turnover 3.81 3.76 2.26 2.07 2.92 2.89 2.28 2.11 1.74 1.88 2.05 Inventory Turnover 18.13 21.16 22.15 32.51 33.28 34.28 32.25 27.85 21.86 23.17 24.32 Effective Tax Rate 47.6% 22.5% 34.5% 29.2% 24.7% 44.8% 21.6% 28.0% 239.8% 52.5% Q.M.S Advisors | tel: +41 (0)78 922 08 77 | e-mail: info@qmsadv.com |
- 8. Company Analysis - Peers Comparision VEOLIA SUEZ AMER STATES EDF GDF SUEZ RWE AG PENNON GRP PLC UNITED UTILITIES SEVERN TRENT FORTUM OYJ ENEL SPA E.ON SE ELEC DE STRASBRG SABESP GAS NATURAL SDG ENVIRONNE ENVIRONNEME WATE Latest Fiscal Year: 12/2012 12/2012 12/2012 12/2012 12/2012 03/2012 03/2012 03/2012 12/2012 12/2012 12/2012 12/2012 12/2012 12/2011 12/2012 52-Week High 13.06 12.23 18.99 20.35 37.12 797.00 816.00 1'836.00 18.90 3.30 19.80 56.14 108.00 97.20 15.85 52-Week High Date 16.03.2012 16.03.2012 19.03.2012 21.08.2012 20.03.2012 19.07.2012 14.08.2012 14.08.2012 15.03.2012 14.01.2013 14.09.2012 05.03.2013 03.04.2012 28.02.2013 08.03.2013 52-Week Low 7.38 7.81 13.39 14.05 26.36 589.00 590.00 1'442.71 12.81 2.02 12.42 34.90 88.00 66.57 8.36 52-Week Low Date 16.11.2012 19.11.2012 29.11.2012 01.03.2013 08.02.2013 19.11.2012 12.04.2012 05.04.2012 23.07.2012 24.07.2012 08.02.2013 10.04.2012 04.12.2012 19.03.2012 23.07.2012 Daily Volume 1'268'525 231'213 477'625 1'654'346 1'282'796 820'874 2'282'284 383'751 598'767 42'407'694 3'798'839 164'954 193 271'800 992'050 Current Price (3/dd/yy) 10.08 10.01 14.67 14.52 28.64 629.00 693.50 1'636.00 15.15 2.60 13.04 55.26 96.00 92.70 15.56 52-Week High % Change -22.8% -18.1% -22.8% -28.6% -22.9% -21.1% -15.0% -10.9% -19.8% -21.3% -34.1% -1.6% -11.1% -4.6% -1.9% 52-Week Low % Change 36.6% 28.1% 9.5% 3.3% 8.7% 6.8% 17.5% 13.4% 18.3% 28.5% 5.0% 58.3% 9.1% 39.3% 86.1% Total Common Shares (M) 519.7 506.9 1'846.7 2'357.3 614.7 360.6 681.8 237.6 888.4 9'403.4 1'906.8 18.8 7.2 227.8 1'000.7 Market Capitalization 5'260.0 5'107.4 27'113.6 35'034.2 17'559.8 2'293.7 4'728.9 3'899.6 13'458.8 24'411.1 26'093.0 1'064.5 688.3 21'120.5 15'565.7 Total Debt 17'001.6 10'070.8 64'501.0 57'552.0 19'946.0 2'529.9 5'855.2 4'398.8 8'777.0 66'539.0 25'944.0 342.7 7.1 8'596.3 20'432.0 Preferred Stock - - - - - - - - - - - - - - - Minority Interest 1'973.6 1'871.1 4'854.0 11'462.0 1'613.0 - - 7.9 616.0 16'387.0 3'862.0 - 0.8 - 1'618.0 Cash and Equivalents 5'547.8 2'508.2 22'307.0 11'383.0 5'276.0 425.3 321.2 295.1 963.0 9'891.0 6'097.0 1.3 232.2 2'150.0 5'693.0 Enterprise Value 18'687.4 15'042.8 74'161.6 92'665.2 33'842.8 4'466.7 10'555.7 8'072.0 21'888.8 97'446.1 49'802.0 1'365.8 575.2 27'928.9 31'922.7 Valuation Total Revenue LFY 29'438.5 15'102.0 72'729.0 97'038.0 50'771.0 1'233.1 1'564.9 1'770.6 6'159.0 82'699.0 132'093.0 466.9 707.3 9'941.6 24'904.0 LTM 29'438.5 15'102.0 72'729.0 97'038.0 50'771.0 1'224.2 1'595.1 1'802.3 6'159.0 82'699.0 132'093.0 466.0 707.3 10'488.9 24'904.0 CY+1 27'066.4 15'331.7 72'654.4 80'580.1 53'031.9 1'225.5 1'643.6 1'832.8 6'262.5 79'507.9 110'567.7 473.0 - 10'677.0 24'059.1 CY+2 27'746.7 15'911.4 75'121.5 80'720.6 53'783.0 1'286.8 1'700.5 1'877.5 6'483.4 80'500.8 112'480.4 484.3 - 10'778.3 24'929.1 EV/Total Revenue LFY 0.8x 0.9x 1.0x 1.0x 0.7x 3.9x 6.8x 4.6x 3.4x 1.2x 0.4x 2.5x 0.8x 2.6x 1.2x LTM 0.8x 1.0x 1.0x 1.0x 0.7x 3.9x 6.7x 4.5x 3.4x 1.2x 0.4x 2.6x 0.9x 2.5x 1.2x CY+1 0.7x 1.0x 1.0x 1.0x 0.6x 3.8x 6.2x 4.5x 3.5x 1.0x 0.4x - - 2.7x 1.3x CY+2 0.6x 0.9x 1.0x 1.0x 0.6x 3.8x 6.2x 4.4x 3.4x 1.0x 0.4x - - 2.7x 1.2x EBITDA LFY 3'014.4 2'077.9 14'342.0 18'401.0 9'055.0 413.0 900.0 786.7 2'360.0 16'150.0 8'443.0 133.3 129.2 3'123.2 4'865.0 LTM 3'604.0 1'980.7 14'342.0 18'401.0 9'201.0 407.0 905.1 777.5 2'403.0 16'150.0 8'443.0 146.1 130.7 3'395.5 4'885.0 CY+1 2'441.3 2'513.8 15'963.9 14'006.2 8'775.6 410.8 964.3 828.6 2'433.7 16'076.7 9'478.0 151.0 - 3'576.0 4'896.8 CY+2 2'600.1 2'682.1 16'809.5 14'153.5 8'605.6 433.1 1'008.4 852.5 2'434.3 16'301.5 9'661.2 156.5 - 4'276.3 5'041.2 EV/EBITDA LFY 7.6x 6.9x 5.1x 5.1x 3.9x 11.6x 11.9x 10.4x 8.9x 6.3x 6.0x 8.7x 4.4x 8.2x 6.2x LTM 6.4x 7.2x 5.1x 5.1x 3.9x 11.8x 11.8x 10.5x 8.7x 6.3x 6.0x 7.9x 4.3x 7.6x 6.1x CY+1 7.2x 5.9x 4.6x 5.8x 3.9x 11.3x 10.6x 9.9x 9.0x 5.1x 5.1x - - 8.0x 6.5x CY+2 6.8x 5.5x 4.5x 5.6x 4.0x 11.3x 10.4x 9.7x 9.0x 4.9x 5.0x - - 6.7x 6.0x EPS LFY 0.02 0.68 2.06 1.33 1.95 0.47 0.47 0.88 - 0.09 1.81 2.82 8.14 5.37 1.45 LTM 0.78 0.49 1.80 0.71 2.13 0.48 0.48 0.94 1.59 0.09 1.14 2.82 8.14 7.20 1.45 CY+1 0.55 0.65 1.76 1.36 3.88 0.42 0.40 0.92 1.28 0.34 1.30 2.75 - 7.05 1.35 CY+2 0.74 0.76 1.91 1.41 3.55 0.44 0.43 0.96 1.26 0.36 1.39 2.76 - 8.67 1.46 P/E LFY 12.9x 20.3x 8.1x 20.4x 13.4x 13.1x 14.6x 17.5x 9.6x 28.8x 11.4x 19.6x 11.8x 12.9x 10.7x LTM 12.9x 26.4x 8.1x 10.9x 13.4x 13.3x 14.2x 15.9x - - 7.2x 19.6x 11.8x 12.9x - CY+1 18.3x 15.4x 8.3x 10.7x 7.4x 14.9x 17.4x 17.7x 11.8x 7.7x 10.0x 20.1x - 13.1x 11.5x CY+2 13.6x 13.2x 7.7x 10.3x 8.1x 14.4x 16.0x 17.0x 12.1x 7.2x 9.4x 20.1x - 10.7x 10.6x Revenue Growth 1 Year (0.7%) 1.8% 11.4% 7.0% 3.3% 6.4% 3.4% 3.5% (0.0%) 6.6% 16.9% 11.4% 25.8% 7.7% 18.2% 5 Year (2.9%) - 6.1% 7.2% 4.1% 7.9% (5.1%) 3.5% 7.7% 9.1% 16.4% 9.2% 9.6% 13.6% 19.2% EBITDA Growth 1 Year (20.8%) - 1.7% 14.5% 9.3% 3.2% 0.0% (0.7%) (1.5%) (6.1%) 97.8% - - (3.1%) 3.6% 5 Year (4.1%) 3.6% (1.7%) 20.7% 3.1% 5.7% 0.9% 2.7% 3.4% 10.7% (5.3%) 8.3% 5.0% 4.2% 17.0% EBITDA Margin LTM 12.0% 13.4% 19.7% 19.0% 18.1% 33.2% 56.7% 43.1% 39.0% 19.5% 6.4% 32.5% 21.5% 32.4% 19.6% CY+1 9.0% 16.4% 22.0% 17.4% 16.5% 33.5% 58.7% 45.2% 38.9% 20.2% 8.6% 31.9% - 33.5% 20.4% CY+2 9.4% 16.9% 22.4% 17.5% 16.0% 33.7% 59.3% 45.4% 37.5% 20.3% 8.6% 32.3% - 39.7% 20.2% Leverage/Coverage Ratios Total Debt / Equity % 237.7% 203.6% 249.4% 96.3% 134.6% 307.7% 331.8% 451.9% 86.0% 181.0% 74.2% 83.9% 2.6% 81.5% 154.1% Total Debt / Capital % 65.1% 59.6% 67.7% 44.7% 54.8% 75.5% 76.8% 81.8% 44.8% 55.6% 40.1% 45.6% 2.5% 44.9% 57.9% Total Debt / EBITDA 5.500x 5.131x 4.497x 3.128x 2.168x 6.466x 6.606x 5.673x 3.653x 4.120x 3.073x 2.357x 0.077x 2.529x 4.183x Net Debt / EBITDA 4.238x 4.038x 2.942x 2.509x 1.594x 5.339x 6.438x 5.355x 3.252x 3.508x 2.351x 2.063x -0.871x 2.005x 3.017x EBITDA / Int. Expense 3.593x 4.988x 5.871x 7.468x 7.250x 2.156x 2.853x 2.337x 7.867x 6.247x 2.900x 5.630x 1218.642x 7.174x 5.266x Credit Ratings S&P LT Credit Rating BBB+ - A+ A *- BBB+ - - BBB- A- BBB+ A- A+ - BB+ BBB S&P LT Credit Rating Date 24.11.2000 - 17.01.2012 29.01.2013 27.07.2012 - - 28.01.2010 27.11.2012 08.03.2012 27.07.2012 30.07.2010 - 01.12.2011 17.12.2010 Moody's LT Credit Rating Baa1 A3 Aa3 A1 A3 - - Baa1 A2 Baa2 A3 A2 - - WR Moody's LT Credit Rating Date 07.02.2012 20.05.2009 14.01.2009 03.07.2012 19.07.2011 - - 08.09.2009 15.07.2005 05.11.2012 05.10.2011 12.08.1993 - - 27.10.1999 Q.M.S Advisors | tel: +41 (0)78 922 08 77 | e-mail: info@qmsadv.com |