Financial analysis goldcorp, inc. is engaged in the acquisition, exploration, development and operation of precious metal properties in canada, the unites states, mexico and central and south america
•
1 like•494 views


Recommended
More Related Content
What's hot
What's hot (20)
Viewers also liked
Viewers also liked (14)
Similar to Financial analysis goldcorp, inc. is engaged in the acquisition, exploration, development and operation of precious metal properties in canada, the unites states, mexico and central and south america
Similar to Financial analysis goldcorp, inc. is engaged in the acquisition, exploration, development and operation of precious metal properties in canada, the unites states, mexico and central and south america (16)
More from BCV
More from BCV (20)
Financial analysis goldcorp, inc. is engaged in the acquisition, exploration, development and operation of precious metal properties in canada, the unites states, mexico and central and south america
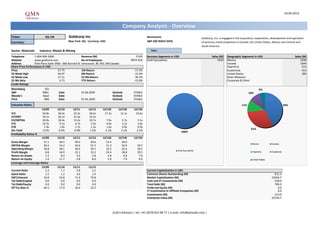
- 1. 24.04.2013 Company Analysis - Overview Ticker: GG UN Goldcorp Inc Benchmark: Goldcorp, Inc. is engaged in the acquisition, exploration, development and operation Currency: New York: GG, Currency: USD S&P 500 INDEX (SPX) of precious metal properties in Canada, the Unites States, Mexico and Central and South America. Sector: Materials Industry: Metals & Mining Year: Telephone 1-604-696-3000 Revenue (M) 5'435 Business Segments in USD Sales (M) Geographic Segments in USD Sales (M) Website www.goldcorp.com No of Employees #N/A N/A Gold Equivalents 5435 Mexico 2290 Address Park Place Suite 3400 - 666 Burrard St. Vancouver, BC V6C 2X8 Canada Canada 1694 Share Price Performance in USD Argentina 615 Price 27.75 1M Return -17.2% Guatemala 551 52 Week High 46.97 6M Return -31.9% United States 285 52 Week Low 27.11 52 Wk Return -30.3% Silver Wheaton 52 Wk Beta 0.73 YTD Return -23.9% Corporate & Other Credit Ratings Bloomberg IG5 5% S&P BBB+ Date 01.06.2009 Outlook STABLE 10% Moody's Baa2 Date - Outlook STABLE Fitch BBB Date 01.06.2009 Outlook STABLE Valuation Ratios 11% 43% 12/09 12/10 12/11 12/12 12/13E 12/14E 12/15E P/E 50.8x 30.4x 22.2x 18.5x 17.2x 12.1x 10.6x EV/EBIT 34.1x 26.1x 21.6x 14.1x - - - EV/EBITDA 20.9x 18.4x 15.2x 10.7x 7.9x 5.7x 5.1x P/S 10.5x 9.1x 6.7x 5.5x 4.0x 3.2x 3.0x P/B 1.9x 1.9x 1.7x 1.3x 1.0x 0.9x 0.9x Div Yield 0.5% 0.5% 0.9% 1.5% 2.1% 2.1% 2.1% 31% 100% Profitability Ratios % 12/09 12/10 12/11 12/12 12/13E 12/14E 12/15E Gross Margin 37.1 60.5 49.0 44.6 53.4 58.0 - Mexico Canada EBITDA Margin 50.2 54.2 43.6 51.5 51.3 56.9 59.7 Operating Margin 30.8 38.1 30.6 39.1 32.5 42.6 39.5 Gold Equivalents Profit Margin 8.8 54.9 22.1 32.2 24.4 28.8 29.5 Argentina Guatemala Return on Assets 1.2 8.4 4.2 5.8 4.8 6.8 7.6 Return on Equity 1.6 11.7 5.8 8.0 5.9 7.9 8.5 United States Leverage and Coverage Ratios 12/09 12/10 12/11 12/12 Current Ratio 2.2 1.7 3.8 2.2 Current Capitalization in USD Quick Ratio 1.5 1.2 2.6 1.4 Common Shares Outstanding (M) 811.5 EBIT/Interest 10.8 54.8 71.4 70.8 Market Capitalization (M) 22656.7 Tot Debt/Capital 0.0 0.0 0.0 0.0 Cash and ST Investments (M) 918.0 Tot Debt/Equity 0.0 0.0 0.0 0.0 Total Debt (M) 783.0 Eff Tax Rate % 46.5 17.9 36.6 22.3 Preferred Equity (M) 0.0 LT Investments in Affiliate Companies (M) 0.0 Investments (M) 213.0 Enterprise Value (M) 22734.7 Q.M.S Advisors | tel: +41 (0)78 922 08 77 | e-mail: info@qmsadv.com |
- 2. Company Analysis - Analysts Ratings Goldcorp Inc Target price in USD Broker Recommendation Buy and Sell Recommendations vs Price and Target Price Price Brokers' Target Price 80 70 100% 4% 4% 8% 8% 8% 8% 8% 7% 7% 8% 8% 8% 60 70 19% 15% 15% 15% 15% 15% 50 19% 19% 27% 80% 23% 23% 23% 60 40 30 50 60% 20 40 10 0 40% 77% 77% 77% 77% 77% 77% 30 Morgan Stanley BMO Capital Markets Barclays Canaccord Genuity Corp RBC Capital Markets Cormark Securities Inc. Raymond James Davenport & Co GMP Mackie Research Capital Corp. Veritas Investment Research Scotia Capital Cowen Securities LLC Credit Suisse JPMorgan Salman Partners Macquarie Stifel HSBC TD Securities EVA Dimensions Deutsche Bank Jefferies CIBC World Markets 74% 74% 69% 69% 69% 69% 20 20% 10 Co 0% 0 avr.12 mai.12 juin.12 juil.12 août.12 sept.12 oct.12 nov.12 déc.12 janv.13 févr.13 mars.13 Buy Hold Sell Price Target Price Date Buy Hold Sell Date Price Target Price Broker Analyst Recommendation Target Date 29-Mar-13 69% 27% 4% 24-Apr-13 27.75 42.02 Scotia Capital TANYA M JAKUSCONEK sector outperform 40.50 23-Apr-13 28-Feb-13 69% 23% 8% 23-Apr-13 27.75 42.02 Barclays FAROOQ HAMED overweight 40.00 23-Apr-13 31-Jan-13 69% 23% 8% 22-Apr-13 28.56 42.61 Deutsche Bank JORGE M BERISTAIN hold 28.00 22-Apr-13 31-Dec-12 69% 23% 8% 19-Apr-13 27.86 43.96 Credit Suisse ANITA SONI neutral 37.00 22-Apr-13 30-Nov-12 74% 19% 7% 18-Apr-13 27.84 44.58 Stifel GEORGE J TOPPING buy 36.00 22-Apr-13 31-Oct-12 74% 19% 7% 17-Apr-13 27.21 44.58 Davenport & Co LLOYD T O'CARROLL buy 35.00 22-Apr-13 28-Sep-12 77% 15% 8% 16-Apr-13 27.78 44.58 Cormark Securities Inc. RICHARD GRAY buy 41.88 22-Apr-13 31-Aug-12 77% 15% 8% 15-Apr-13 27.64 45.20 RBC Capital Markets STEPHEN D WALKER outperform 36.00 19-Apr-13 31-Jul-12 77% 15% 8% 12-Apr-13 29.63 46.13 JPMorgan JOHN BRIDGES overweight 50.00 19-Apr-13 29-Jun-12 77% 15% 8% 11-Apr-13 31.15 46.13 TD Securities GREG BARNES buy 45.00 16-Apr-13 31-May-12 77% 15% 8% 10-Apr-13 31.50 46.73 BMO Capital Markets DAVID HAUGHTON outperform 48.50 15-Apr-13 30-Apr-12 77% 19% 4% 9-Apr-13 32.35 46.32 Canaccord Genuity Corp STEVEN BUTLER buy 46.00 15-Apr-13 8-Apr-13 31.34 46.21 CIBC World Markets ALEC KODATSKY sector outperform 46.00 11-Apr-13 5-Apr-13 31.73 46.49 Cowen Securities LLC ADAM P GRAF hold 9-Apr-13 4-Apr-13 31.51 46.85 HSBC PATRICK CHIDLEY overweight 45.50 3-Apr-13 3-Apr-13 31.16 46.94 GMP GEORGE V ALBINO buy 60.13 2-Apr-13 2-Apr-13 32.33 47.05 Salman Partners DAVID WEST top pick 59.03 1-Apr-13 1-Apr-13 33.38 47.02 Jefferies PETER D WARD hold 35.00 21-Mar-13 29-Mar-13 33.57 47.01 EVA Dimensions CRAIG STERLING hold 15-Mar-13 28-Mar-13 33.57 47.01 Mackie Research Capital Corp. BARRY D ALLAN buy 47.75 12-Mar-13 27-Mar-13 33.66 47.01 Macquarie TONY LESIAK outperform 48.62 9-Mar-13 26-Mar-13 32.84 47.01 Veritas Investment Research Co PAWEL RAJSZEL sell 33.00 19-Feb-13 25-Mar-13 32.96 47.01 Morgan Stanley PARETOSH MISRA Equalwt/In-Line 8-Jan-13 22-Mar-13 33.50 47.01 Raymond James BRAD HUMPHREY Under Review 19-Nov-08 21-Mar-13 33.39 47.01 20-Mar-13 32.66 47.01 19-Mar-13 32.52 47.01 18-Mar-13 32.46 47.05 15-Mar-13 32.38 47.05 14-Mar-13 32.37 47.05 Q.M.S Advisors | tel: +41 (0)78 922 08 77 | e-mail: info@qmsadv.com |
- 3. 24.04.2013 Goldcorp Inc Company Analysis - Ownership Ownership Type Ownership Statistics Geographic Ownership Distribution Geographic Ownership 0% Shares Outstanding (M) 811.5 United States 57.15% 22% 1% 1% 4% Float 99.7% Canada 30.09% 1% 2% Short Interest (M) 4.1 France 3.94% 4% Short Interest as % of Float 0.51% Britain 1.85% Days to Cover Shorts 0.81 Luxembourg 1.33% Institutional Ownership 77.38% Norway 0.93% 57% Retail Ownership 22.27% Japan 0.83% Insider Ownership 0.35% Others 3.90% 30% 78% Institutional Ownership Distribution Investment Advisor 88.92% Hedge Fund Manager 4.78% Pension Fund (Erisa) 1.70% Institutional Ownership Retail Ownership Insider Ownership Insurance Company 1.57% United States Canada France Britain Pricing data is in USD Others 3.03% Luxembourg Norway Japan Others Top 20 Owners: TOP 20 ALL Institutional Ownership Holder Name Position Position Change Market Value % of Ownership Report Date Source Country BLACKROCK 95'391'332 0 2'647'109'463 11.75% 31.03.2013 ULT-AGG UNITED STATES 2% 3% FMR LLC 32'937'156 -9'098'135 914'006'079 4.06% 28.02.2013 ULT-AGG UNITED STATES 2% VAN ECK ASSOCIATES C 31'593'509 -836'637 876'719'875 3.89% 23.04.2013 ULT-AGG UNITED STATES 5% ROYAL BANK OF CANADA 22'991'630 1'883'662 638'017'733 2.83% 31.12.2012 ULT-AGG CANADA BMO FINANCIAL CORP 19'122'015 -574'672 530'635'916 2.36% 31.03.2013 13F UNITED STATES CARMIGNAC GESTION 17'580'357 17'580'357 487'854'907 2.17% 31.12.2012 13F FRANCE TD ASSET MANAGEMENT 15'632'925 5'971'920 433'813'669 1.93% 31.12.2012 13F CANADA CI INVESTMENTS INC 12'996'285 -440'597 360'646'909 1.60% 31.12.2012 MF-AGG CANADA CIBC WORLD MARKETS I 11'806'864 70'556 327'640'476 1.45% 31.12.2012 13F CANADA TORONTO DOMINION BAN 11'409'803 1'401'951 316'622'033 1.41% 31.12.2012 13F CANADA 88% FIRST EAGLE INVESTME 11'152'441 95'200 309'480'238 1.37% 31.12.2012 13F UNITED STATES FRANKLIN RESOURCES 10'114'617 -651'961 280'680'622 1.25% 28.02.2013 ULT-AGG UNITED STATES IA CLARINGTON INVEST 8'426'680 -27'800 233'840'370 1.04% 31.12.2012 MF-AGG CANADA Investment Advisor Hedge Fund Manager Pension Fund (Erisa) CIBC GLOBAL ASSET MA 7'362'990 699'268 204'322'973 0.91% 31.12.2012 13F CANADA Insurance Company Others CAISSE DE DEPOT ET P 7'239'262 -4'220'800 200'889'521 0.89% 31.12.2012 13F CANADA GREYSTONE MANAGED IN 7'106'968 -2'294'891 197'218'362 0.88% 31.12.2012 13F CANADA FIERA CAPITAL CORPOR 6'835'256 1'053'271 189'678'354 0.84% 31.03.2013 13F CANADA MACKENZIE FINANCIAL 6'271'509 -3'832'372 174'034'375 0.77% 31.12.2012 13F CANADA SUN LIFE FINANCIAL I 6'162'583 -935'880 171'011'678 0.76% 28.02.2013 ULT-AGG CANADA NORGES BANK 5'776'522 1'267'153 160'298'486 0.71% 31.12.2012 13F NORWAY Top 5 Insiders: Holder Name Position Position Change Market Value % of Ownership Report Date Source REIFEL P RANDY 1'444'107 3'500 40'073'969 0.18% 01.05.2012 SEDI JEANNES CHARLES A 416'561 18'333 11'559'568 0.05% 11.03.2013 SEDI HALL LINDSAY A 117'023 8'667 3'247'388 0.01% 11.03.2013 SEDI SEDESTROM CHERYL A 93'303 5'333 2'589'158 0.01% 11.03.2013 SEDI RONKOS CHARLES JOSEPH 91'937 5'333 2'551'252 0.01% 11.03.2013 SEDI Q.M.S Advisors | tel: +41 (0)78 922 08 77 | e-mail: info@qmsadv.com |
- 4. Company Analysis - Financials I/IV Goldcorp Inc Financial information is in USD (M) Equivalent Estimates Periodicity: Fiscal Year 12/02 12/03 12/04 12/05 12/06 12/07 12/08 12/09 12/10 12/11 12/12 12/13E 12/14E 12/15E Income Statement Revenue 185 263 191 896 1'649 2'207 2'420 2'724 3'738 5'362 5'435 5'612 6'972 7'467 - Cost of Goods Sold 83 113 89 439 917 1'419 1'663 1'714 1'476 2'736 3'012 Gross Income 103 150 102 457 732 788 756 1'010 2'262 2'626 2'423 2'997 4'044 - Selling, General & Admin Expenses 13 15 21 52 111 176 203 170 838 984 300 (Research & Dev Costs) 4 3 7 Operating Income 90 135 81 405 621 612 553 840 1'424 1'642 2'123 1'823 2'972 2'947 - Interest Expense 0 0 0 0 45 45 7 78 26 23 30 - Foreign Exchange Losses (Gains) 1 1 -0 -0 0 0 -1'059 367 0 0 0 - Net Non-Operating Losses (Gains) -19 -19 -0 -35 -13 -14 -174 -50 -321 -254 -159 Pretax Income 107 153 81 440 590 582 1'779 445 1'719 1'873 2'252 1'892 2'868 3'109 - Income Tax Expense 39 54 30 142 153 160 295 207 307 686 503 Income Before XO Items 68 99 51 298 436 422 1'483 238 1'412 1'187 1'749 - Extraordinary Loss Net of Tax 0 0 0 0 -8 -85 0 0 -631 0 0 - Minority Interests 0 0 0 12 36 46 8 -2 -8 0 0 Diluted EPS Before XO Items 0.37 0.53 0.27 0.83 0.91 0.53 2.06 0.33 1.87 2.18 1.95 Net Income Adjusted* 59 93 57 259 444 440 397 243 1'000 1'833 1'600 1'367 2'010 2'205 EPS Adjusted 0.32 0.49 0.29 0.75 1.00 0.62 0.56 0.33 1.37 2.22 2.03 1.62 2.29 2.62 Dividends Per Share 0.14 0.27 0.28 0.68 0.18 0.18 0.18 0.18 0.21 0.41 0.54 0.59 0.58 0.58 Payout Ratio % 28.8 50.8 61.0 52.9 19.6 33.8 8.7 54.8 10.8 27.8 25.0 0.37 0.25 0.22 Total Shares Outstanding 182 189 190 340 704 708 730 734 798 810 812 Diluted Shares Outstanding 184 188 194 345 441 709 715 735 756 826 831 EBITDA 107 159 101 541 926 1'077 1'052 1'366 2'026 2'336 2'798 2'881 3'968 4'456 *Net income excludes extraordinary gains and losses and one-time charges. Q.M.S Advisors | tel: +41 (0)78 922 08 77 | e-mail: info@qmsadv.com |
- 5. Company Analysis - Financials II/IV Periodicity: 12/02 12/03 12/04 12/05 12/06 12/07 12/08 12/09 12/10 12/11 12/12 12/13E 12/14E 12/15E Balance Sheet Total Current Assets 326.504431 423.290009 426.673004 772.351 883.4 951.8 760.8 1601.5 1578 2950 2528 + Cash & Near Cash Items 260 379 333 562 555 511 262 875 556 1'502 918 + Short Term Investments 6 12 23 11 15 26 9 25 0 0 0 + Accounts & Notes Receivable 3 9 7 75 67 155 179 233 508 513 718 + Inventories 56 21 49 77 147 191 226 349 397 574 722 + Other Current Assets 1 2 14 47 100 69 85 120 117 361 170 Total Long-Term Assets 130 215 275 3'294 17'083 18'000 18'241 19'347 26'061 26'424 28'684 + Long Term Investments 0 0 0 34 134 228 73 390 971 249 199 Gross Fixed Assets 312 424 511 3'328 15'786 17'355 18'314 19'734 25'445 27'131 Accumulated Depreciation 187 217 246 347 657 902 1'258 1'733 2'220 2'922 + Net Fixed Assets 124 207 265 2'981 15'129 16'453 17'055 18'001 23'225 24'209 26'367 + Other Long Term Assets 6 8 10 279 1'820 1'320 1'112 956 1'865 1'966 2'118 Total Current Liabilities 53 61 27 191 466 321 486 735 916 771 1'175 + Accounts Payable 5 6 7 98 229 277 305 416 567 619 886 + Short Term Borrowings 0 0 0 0 135 29 0 17 0 0 0 + Other Short Term Liabilities 48 55 20 93 102 16 182 302 349 152 289 Total Long Term Liabilities 56 70 97 793 4'671 5'203 3'505 4'669 6'957 7'118 7'108 + Long Term Borrowings 0 0 0 0 790 1'036 5 719 695 737 783 + Other Long Term Borrowings 56 70 97 793 3'881 4'166 3'500 3'950 6'262 6'381 6'325 Total Liabilities 109 131 124 984 5'136 5'524 3'991 5'404 7'873 7'889 8'283 + Long Preferred Equity 0 0 0 0 0 0 0 0 0 0 0 + Minority Interest 0 0 0 109 355 450 51 51 213 213 213 + Share Capital & APIC 348 378 387 2'609 11'706 11'815 12'625 12'909 16'407 16'992 17'117 + Retained Earnings & Other Equity 0 130 191 364 769 1'164 2'334 2'584 3'146 4'280 5'599 Total Shareholders Equity 348 508 578 3'082 12'830 13'428 15'010 15'544 19'766 21'485 22'929 Total Liabilities & Equity 457 639 702 4'066 17'966 18'952 19'002 20'949 27'639 29'374 31'212 Book Value Per Share 1.91 2.68 3.04 8.76 17.73 18.32 20.50 21.12 24.49 26.26 27.99 28.62 30.14 32.05 Tangible Book Value Per Share 1.91 2.68 3.04 8.34 15.83 17.17 19.46 20.08 22.32 24.12 25.85 Q.M.S Advisors | tel: +41 (0)78 922 08 77 | e-mail: info@qmsadv.com |
- 6. Company Analysis - Financials III/IV Periodicity: 12/02 12/03 12/04 12/05 12/06 12/07 12/08 12/09 12/10 12/11 12/12 12/13E 12/14E 12/15E Cash Flows Net Income 68 99 51 286 408 460 1'476 240 2'051 1'881 1'749 1'406 2'173 2'403 + Depreciation & Amortization 18 24 20 135 304 465 499 526 602 694 675 + Other Non-Cash Adjustments -14 -5 30 -2 -8 13 -1'042 414 -944 117 -16 + Changes in Non-Cash Capital 32 -22 -49 47 57 -214 -67 90 71 -326 -311 Cash From Operating Activities 104 95 53 466 761 724 866 1'270 1'780 2'366 2'097 + Disposal of Fixed Assets 0 0 0 0 189 217 0 0 267 0 43 + Capital Expenditures -7 -75 -56 -278 -472 -871 -1'372 -1'356 -1'213 -1'778 -2'608 -2'806 -1'753 -1'286 + Increase in Investments 0 0 0 -34 -99 -50 0 0 0 0 0 + Decrease in Investments 0 0 0 0 0 0 0 0 0 0 0 + Other Investing Activities -38 41 -17 90 -1'893 -159 930 -102 -1'142 212 279 Cash From Investing Activities -45 -33 -73 -221 -2'276 -863 -442 -1'459 -2'088 -1'566 -2'286 + Dividends Paid -20 -28 -53 -151 -79 -127 -129 -132 -154 -330 -438 + Change in Short Term Borrowings 0 0 0 0 0 0 0 0 0 0 0 + Increase in Long Term Borrowings 0 0 0 0 1'465 1'406 206 1'332 1'120 0 0 + Decrease in Long Term Borrowings 0 0 0 0 -620 -1'266 -845 -460 -1'120 0 0 + Increase in Capital Stocks 141 27 4 44 528 70 108 82 96 477 44 + Decrease in Capital Stocks 0 0 0 0 0 0 0 0 0 0 0 + Other Financing Activities 3 57 24 91 185 40 -13 -21 47 -1 -1 Cash From Financing Activities 124 56 -26 -16 1'479 123 -673 801 -11 146 -395 Net Changes in Cash 183 118 -46 229 -36 -16 -249 612 -319 946 -584 Free Cash Flow (CFO-CAPEX) 97 21 -3 188 289 -148 -506 -86 567 588 -511 -612 1'199 2'247 Free Cash Flow To Firm 97 21 -3 188 322 -115 -500 -44 588 603 -488 Free Cash Flow To Equity 97 21 -3 188 1'323 209 -1'145 786 834 588 -468 Free Cash Flow per Share 0.55 0.11 -0.02 0.60 0.66 -0.21 -0.71 -0.12 0.77 0.73 -0.63 Q.M.S Advisors | tel: +41 (0)78 922 08 77 | e-mail: info@qmsadv.com |
- 7. Company Analysis - Financials IV/IV Periodicity: 12/02 12/03 12/04 12/05 12/06 12/07 12/08 12/09 12/10 12/11 12/12 12/13E 12/14E 12/15E Ratio Analysis Valuation Ratios Price Earnings 38.7x 32.3x 51.3x 28.6x 31.2x 68.2x 57.3x 50.8x 30.4x 22.2x 18.5x 17.2x 12.1x 10.6x EV to EBIT 23.0x 19.4x 30.9x 17.5x 33.3x 41.1x 41.2x 34.1x 26.1x 21.6x 14.1x EV to EBITDA 19.2x 16.5x 24.8x 13.1x 22.4x 23.3x 21.7x 20.9x 18.4x 15.2x 10.7x 7.9x 5.7x 5.1x Price to Sales 12.2x 11.1x 14.9x 7.8x 7.5x 10.9x 9.3x 10.5x 9.1x 6.7x 5.5x 4.0x 3.2x 3.0x Price to Book 6.7x 5.9x 4.9x 2.5x 1.6x 1.9x 1.5x 1.9x 1.9x 1.7x 1.3x 1.0x 0.9x 0.9x Dividend Yield 1.1% 1.7% 1.9% 3.1% 0.6% 0.5% 0.6% 0.5% 0.5% 0.9% 1.5% 2.1% 2.1% 2.1% Profitability Ratios Gross Margin 55.4% 57.1% 53.2% 51.0% 44.4% 35.7% 31.3% 37.1% 60.5% 49.0% 44.6% 53.4% 58.0% EBITDA Margin 58.0% 60.5% 52.8% 60.3% 56.1% 48.8% 43.5% 50.2% 54.2% 43.6% 51.5% 51.3% 56.9% 59.7% Operating Margin 48.4% 51.4% 42.3% 45.2% 37.7% 27.7% 22.9% 30.8% 38.1% 30.6% 39.1% 32.5% 42.6% 39.5% Profit Margin 36.8% 37.6% 26.9% 31.9% 24.8% 20.8% 61.0% 8.8% 54.9% 22.1% 32.2% 24.4% 28.8% 29.5% Return on Assets 19.8% 18.0% 7.7% 12.0% 3.7% 2.5% 7.8% 1.2% 8.4% 4.2% 5.8% 4.8% 6.8% 7.6% Return on Equity 26.8% 23.1% 9.5% 16.1% 5.3% 3.6% 10.6% 1.6% 11.7% 5.8% 8.0% 5.9% 7.9% 8.5% Leverage & Coverage Ratios Current Ratio 6.17 6.93 16.01 4.05 1.90 2.96 1.56 2.18 1.72 3.83 2.15 Quick Ratio 5.09 6.55 13.63 3.40 1.37 2.15 0.92 1.54 1.16 2.61 1.39 Interest Coverage Ratio (EBIT/I) 13.87 13.70 76.82 10.76 54.77 71.39 70.77 Tot Debt/Capital 0.00 0.00 0.00 0.00 0.07 0.07 0.00 0.05 0.03 0.03 0.03 Tot Debt/Equity 0.00 0.00 0.00 0.00 0.07 0.08 0.00 0.05 0.04 0.03 0.03 Others Asset Turnover 0.54 0.48 0.29 0.38 0.15 0.12 0.13 0.14 0.15 0.19 0.18 Accounts Receivable Turnover 60.59 43.90 23.77 21.77 23.20 19.93 14.53 13.25 10.09 10.50 8.83 Accounts Payable Turnover 13.48 14.26 18.85 8.96 6.05 5.78 5.83 5.09 3.10 4.91 4.20 Inventory Turnover 2.30 2.91 2.53 6.95 8.20 8.40 7.97 5.95 3.95 5.64 4.65 Effective Tax Rate 36.5% 35.4% 36.9% 32.3% 26.0% 27.6% 16.6% 46.5% 17.9% 36.6% 22.3% Q.M.S Advisors | tel: +41 (0)78 922 08 77 | e-mail: info@qmsadv.com |
- 8. Company Analysis - Peers Comparision BARRICK GOLD NEWMONT FREEPORT- ANGLOGOLD AGNICO-EAGLE YAMANA GOLD HARMONY GOLD GOLDCORP INC KINROSS GOLD BHP BILLITON LTD DRDGOLD LTD RIO TINTO LTD SILVER WHEATON ELDORADO GOLD IAMGOLD CORP CRP MINING MCMORAN ASHANT MIN INC MNG Latest Fiscal Year: 12/2011 12/2012 12/2012 12/2012 12/2012 12/2012 12/2012 06/2012 12/2012 06/2012 06/2012 12/2012 12/2012 12/2012 12/2012 52-Week High 47.41 44.75 10.98 57.93 43.65 31'979.00 57.00 39.34 20.61 755.00 8'951.00 72.30 41.18 15.78 16.45 52-Week High Date 21.09.2012 06.06.2012 04.10.2012 21.09.2012 14.09.2012 04.06.2012 31.10.2012 20.02.2013 09.11.2012 12.02.2013 06.06.2012 14.02.2013 01.11.2012 19.09.2012 05.10.2012 52-Week Low 27.11 17.97 5.11 31.77 27.24 16'133.00 31.55 30.09 11.32 449.00 4'201.00 48.37 22.37 6.77 4.72 52-Week Low Date 17.04.2013 17.04.2013 17.04.2013 23.04.2013 18.04.2013 18.04.2013 18.04.2013 12.07.2012 17.04.2013 31.08.2012 18.04.2013 30.08.2012 18.04.2013 17.04.2013 18.04.2013 Daily Volume 1'406'618 6'272'923 8'162'503 10'160'819 19'287'262 1'494'238 1'115'004 16'783'219 5'371'563 220'282 994'151 6'203'716 2'271'009 4'722'150 5'331'897 Current Price (4/dd/yy) 27.75 18.01 5.55 32.43 28.52 16'769.00 32.83 31.70 11.85 611.00 4'296.00 54.68 23.23 7.29 5.09 52-Week High % Change -41.5% -59.8% -49.5% -44.0% -34.7% -47.6% -42.4% -19.4% -42.5% -19.1% -52.0% -24.4% -43.6% -53.8% -69.1% 52-Week Low % Change 2.4% 0.2% 8.6% 2.1% 4.7% 3.9% 4.1% 5.4% 4.7% 36.1% 2.3% 13.0% 3.8% 7.7% 7.8% Total Common Shares (M) 811.5 1'001.1 1'140.1 496.7 949.0 384.9 172.1 5'297.6 752.2 385.4 431.6 1'847.0 354.4 714.3 376.5 Market Capitalization 22'657 18'030 6'335 16'155 27'081 64'610 5'663 158'638 8'915 2'355 18'699 86'882 8'233 5'209 1'917 Total Debt 783.0 13'943.0 2'632.6 6'298.0 3'527.0 30'376.0 843.0 28'330.0 765.9 30.7 1'844.0 26'819.0 50.1 593.3 641.4 Preferred Stock - - - - - - - - - - - - - - - Minority Interest 213.0 2'663.0 75.5 3'175.0 3'768.0 186.5 - 1'215.0 46.8 136.7 - 11'156.0 - 284.1 76.7 Cash and Equivalents 918.0 2'093.0 1'982.7 1'647.0 3'705.0 7'562.2 351.3 4'781.0 349.6 298.5 1'773.0 7'320.0 778.2 818.8 813.5 Enterprise Value 22'735 32'093 6'901 23'981 31'487 87'610 6'013 194'666 9'155 2'397 18'561 119'939 7'299 5'137 1'773 Valuation Total Revenue LFY 5'435.0 14'547.0 4'311.4 9'868.0 18'010.0 52'160.3 1'917.7 72'226.0 2'336.8 1'764.2 15'169.0 50'967.0 849.6 1'147.5 1'670.0 LTM 5'435.0 14'340.0 4'311.4 9'868.0 17'988.0 52'152.1 1'917.7 66'950.0 2'336.8 1'959.2 16'047.0 50'967.0 849.6 1'147.5 1'670.0 CY+1 5'611.5 14'142.9 4'181.4 9'805.7 21'856.1 63'271.7 1'819.7 67'569.0 2'722.4 2'178.3 17'078.8 55'585.9 1'026.4 1'347.0 1'649.1 CY+2 6'971.6 15'194.3 4'446.4 11'369.3 23'601.6 73'396.4 2'105.1 73'914.3 3'247.1 2'479.2 20'966.1 61'445.4 1'144.2 1'562.8 1'820.9 EV/Total Revenue LFY 5.5x 3.4x 2.7x 3.1x 2.0x 2.4x 5.0x 3.3x 5.7x 1.5x 2.1x 3.1x 14.2x 8.1x 2.5x LTM 5.5x 3.4x 2.7x 3.1x 2.0x 2.3x 5.0x 3.5x 5.7x 1.3x 2.0x 3.1x 14.2x 8.1x 2.5x CY+1 4.2x 2.3x 1.7x 2.5x 1.8x 1.4x 3.4x 2.9x 3.4x 1.0x 1.1x 2.2x 8.2x 4.0x 1.3x CY+2 3.3x 2.1x 1.7x 2.1x 1.6x 1.1x 2.9x 2.6x 2.7x 0.7x 0.9x 1.9x 7.3x 3.7x 1.4x EBITDA LFY 2'798.0 7'358.0 1'962.2 4'169.0 6'934.0 19'105.5 787.4 33'421.0 1'269.4 370.8 4'222.0 15'486.0 701.5 584.4 710.1 LTM 2'798.0 7'358.0 1'962.2 4'169.0 6'617.0 19'105.5 791.4 27'133.0 1'502.0 399.7 3'562.0 15'486.0 701.5 584.4 710.1 CY+1 2'881.3 7'080.5 1'822.8 4'001.6 9'267.7 25'535.3 753.2 28'726.6 1'533.6 547.3 4'778.0 21'006.8 844.3 715.2 670.4 CY+2 3'967.6 7'838.1 2'151.9 4'996.2 10'831.8 31'172.8 954.9 33'552.1 1'929.8 762.7 6'956.0 23'251.3 951.2 866.5 780.4 EV/EBITDA LFY 10.7x 6.7x 6.0x 7.4x 5.2x 6.5x 12.1x 7.1x 10.6x 7.0x 7.6x 10.2x 17.2x 15.8x 5.9x LTM 10.7x 6.7x 6.0x 7.4x 5.4x 6.3x 12.0x 8.7x 8.9x 6.5x 9.0x 10.2x 17.2x 15.8x 5.9x CY+1 8.3x 4.7x 4.0x 6.1x 4.2x 3.4x 8.2x 6.7x 6.0x 3.8x 3.8x 5.7x 9.9x 7.6x 3.3x CY+2 5.9x 4.1x 3.4x 4.8x 3.5x 2.6x 6.5x 5.7x 4.5x 2.4x 2.7x 5.0x 8.8x 6.7x 3.3x EPS LFY 1.99 3.74 0.77 3.78 3.27 21.85 1.89 3.61 0.93 0.49 4.62 4.06 1.65 0.47 0.89 LTM 1.89 3.30 0.77 3.77 2.95 24.22 2.08 1.83 0.63 0.79 4.95 -1.63 1.65 0.47 0.93 CY+1 1.62 3.40 0.49 3.17 3.70 24.30 1.34 2.53 0.88 0.82 4.77 5.72 1.66 0.48 0.56 CY+2 2.29 3.68 0.64 3.98 4.22 29.46 1.83 3.05 1.22 0.93 7.08 6.62 1.80 0.60 0.69 P/E LFY 14.7x 5.3x 7.0x 8.6x 9.7x 6.9x 15.4x 17.9x 18.3x 7.7x 8.7x - 13.7x 15.1x 5.3x LTM 14.7x 5.3x 7.0x 8.6x 9.7x 6.8x 15.4x 11.7x 18.3x 8.0x 10.8x - 13.7x 15.1x 5.3x CY+1 17.2x 5.2x 11.0x 10.2x 7.7x 6.9x 23.8x 12.9x 13.2x 7.5x 9.0x 9.8x 13.6x 14.9x 8.9x CY+2 12.1x 4.8x 8.5x 8.1x 6.8x 5.7x 17.5x 10.7x 9.5x 6.5x 6.1x 8.5x 12.6x 11.8x 7.2x Revenue Growth 1 Year 1.4% 2.2% 12.2% (4.7%) (13.7%) (4.1%) 5.3% 0.7% 7.5% 27.9% 30.8% (15.8%) 16.4% 4.0% (0.2%) 5 Year 19.3% 13.6% 34.9% 16.7% 4.9% 24.6% 54.5% 6.8% 203.5% 7.9% 19.2% 11.2% 63.1% 78.1% 21.9% EBITDA Growth 1 Year 19.8% (11.6%) 1.9% (19.2%) (31.8%) (17.8%) 4.6% (12.1%) 0.5% 64.2% 79.4% (41.1%) 13.4% (9.2%) (9.5%) 5 Year 21.0% 24.5% 40.7% 19.4% (2.4%) 86.6% 31.6% 8.0% 26.8% 12.9% 16.7% 8.1% 43.7% 54.0% 30.2% EBITDA Margin LTM 51.5% 50.6% 45.5% 42.2% 36.8% 36.6% 41.3% 40.5% 64.3% 20.4% 22.2% 30.4% 82.6% 50.9% 42.5% CY+1 51.3% 50.1% 43.6% 40.8% 42.4% 40.4% 41.4% 42.5% 56.3% 25.1% 28.0% 37.8% 82.3% 53.1% 40.7% CY+2 56.9% 51.6% 48.4% 43.9% 45.9% 42.5% 45.4% 45.4% 59.4% 30.8% 33.2% 37.8% 83.1% 55.4% 42.9% Leverage/Coverage Ratios Total Debt / Equity % 3.4% 63.8% 26.7% 45.7% 20.1% 65.8% 24.7% 43.0% 9.8% 2.0% 5.4% 57.2% 1.6% 10.0% 17.2% Total Debt / Capital % 3.3% 36.3% 21.0% 27.1% 14.2% 39.6% 19.8% 29.7% 8.9% 1.8% 5.1% 31.6% 1.6% 8.7% 14.4% Total Debt / EBITDA 0.280x 1.895x 1.342x 1.511x 1.525x 1.540x 1.065x 1.308x 0.510x 0.421x 0.666x 1.732x 0.071x 1.015x 0.903x Net Debt / EBITDA -0.048x 1.610x 0.331x 1.116x 0.075x 1.156x 0.621x 1.120x 0.277x -0.575x -0.039x 1.259x -1.038x -0.386x -0.242x EBITDA / Int. Expense 93.267x 9.890x 13.838x 11.711x 25.970x 10.074x 13.603x 44.266x 22.032x 23.648x 14.264x 14.848x - 83.689x 38.384x Credit Ratings S&P LT Credit Rating BBB+ BBB+ BBB- BBB+ BBB BBB- NR A+ - - - A- - BB BB- S&P LT Credit Rating Date 01.06.2009 30.07.2012 15.08.2011 11.08.2008 29.07.2011 10.12.2012 12.03.2003 15.11.2010 - - - 18.04.2011 - 13.11.2012 10.09.2012 Moody's LT Credit Rating Baa2 Baa1 *- Baa3 Baa1 Baa3 - WR (P)A1 - - - - - Ba3 - Moody's LT Credit Rating Date 13.03.2013 17.04.2013 15.08.2011 26.07.2010 13.10.2010 - 05.03.2002 15.11.2010 - - - - - 12.11.2012 - Q.M.S Advisors | tel: +41 (0)78 922 08 77 | e-mail: info@qmsadv.com |