Financial Analysis - Kubota corporation manufactures industrial machinery,…
•
1 like•307 views

Kubota Corp is a Japanese machinery manufacturer headquartered in Osaka, Japan. It produces industrial and farm machinery, including tractors, combine harvesters, excavators, and piping systems. In the fiscal year ending March 2013, Kubota generated over 1 trillion JPY in revenue, with its machinery segment accounting for over 70% of sales. The company has over 29,000 employees and sells its products worldwide, with nearly 50% of revenue coming from sales in Japan and over 20% from North America. Kubota is currently trading on the Tokyo Stock Exchange at around 1314 JPY per share and has a market capitalization of nearly 1.7 trillion JPY.

Recommended
More Related Content
What's hot
What's hot (15)
Similar to Financial Analysis - Kubota corporation manufactures industrial machinery,…
Similar to Financial Analysis - Kubota corporation manufactures industrial machinery,… (20)
More from BCV
More from BCV (20)
Financial Analysis - Kubota corporation manufactures industrial machinery,…
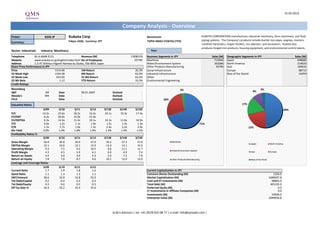
- 1. 15.03.2013 Company Analysis - Overview Ticker: 6326 JP Kubota Corp Benchmark: KUBOTA CORPORATION manufactures industrial machinery, farm machinery, and fluid Tokyo: 6326, Currency: JPY TOPIX INDEX (TOKYO) (TPX) piping systems. The Company's products include ductile iron pipes, engines, tractors, Currency: combine harvesters, reaper binders, rice planters, and excavators. Kubota also produces forged iron products, housing equipment, and environmental control plants. Sector: Industrials Industry: Machinery Year: Telephone 81-6-6648-2111 Revenue (M) 1'008'019 Business Segments in JPY Sales (M) Geographic Segments in JPY Sales (M) Website www.kubota.co.jp/english/index.html No of Employees 29'185 Machines 713943 Japan 498684 Address 1-2-47 Shikitsu-Higashi Naniwa-ku Osaka, 556-8601 Japan Water/Environment System 263286 North America 219929 Share Price Performance in JPY Other Products Manufacturing 30790 Asia 169632 Price 1314.00 1M Return 26.3% Social Infrastructure Europe 88715 52 Week High 1324.00 6M Return 62.9% Industrial Infrastructure Rest of the World 31059 52 Week Low 623.69 52 Wk Return 64.2% Other 52 Wk Beta 1.12 YTD Return 33.3% Environmental Engineering Credit Ratings Bloomberg - 3% 3% S&P NR Date 09.01.2007 Outlook - 9% Moody's WR Date - Outlook - Fitch - Date - Outlook - 26% Valuation Ratios 17% 3/09 3/10 3/11 3/12 3/13E 3/14E 3/15E 49% P/E 14.2x 25.6x 18.2x 16.3x 24.1x 19.3x 17.4x EV/EBIT 8.2x 20.4x 15.0x 12.4x - - - EV/EBITDA 6.3x 14.4x 11.4x 10.1x 14.3x 11.8x 10.9x P/S 0.6x 1.2x 1.1x 1.0x 1.5x 1.4x 1.3x 71% P/B 1.2x 1.7x 1.6x 1.5x 2.4x 2.2x 2.0x 22% Div Yield 2.6% 1.4% 1.8% 1.9% 1.3% 1.4% 1.5% Profitability Ratios % 3/09 3/10 3/11 3/12 3/13E 3/14E 3/15E Gross Margin 26.8 26.8 26.9 27.0 26.2 27.3 27.6 Machines Japan North America EBITDA Margin 12.1 10.6 12.1 12.9 12.4 14.1 14.5 Operating Margin 9.3 7.5 9.2 10.5 9.6 11.1 11.7 Water/Environment System Profit Margin 4.3 4.5 5.9 6.1 6.0 6.9 7.4 Asia Europe Return on Assets 3.4 3.0 4.0 4.3 5.9 7.2 7.6 Return on Equity 7.8 7.0 8.7 9.6 10.1 12.0 12.0 Other Products Manufacturing Rest of the World Leverage and Coverage Ratios 3/09 3/10 3/11 3/12 Current Ratio 1.7 1.9 1.8 1.6 Current Capitalization in JPY Quick Ratio 1.1 1.3 1.3 1.1 Common Shares Outstanding (M) 1256.0 EBIT/Interest 38.6 32.8 52.8 55.9 Market Capitalization (M) 1689697.8 Tot Debt/Capital 0.2 0.4 0.3 0.3 Cash and ST Investments (M) 98865.0 Tot Debt/Equity 0.3 0.6 0.5 0.5 Total Debt (M) 405192.0 Eff Tax Rate % 34.4 35.2 33.4 35.6 Preferred Equity (M) 0.0 LT Investments in Affiliate Companies (M) 0.0 Investments (M) 53926.0 Enterprise Value (M) 2049950.8 Q.M.S Advisors | tel: +41 (0)78 922 08 77 | e-mail: info@qmsadv.com |
- 2. Company Analysis - Analysts Ratings Kubota Corp Target price in JPY Broker Recommendation Buy and Sell Recommendations vs Price and Target Price Price Brokers' Target Price 1'400 1600 100% 13% 14% 13% 13% 12% 11% 11% 11% 11% 11% 11% 1400 21% 1'200 1200 80% 1000 37% 37% 32% 1'000 800 39% 42% 47% 47% 600 50% 60% 56% 57% 53% 800 400 50% 200 600 0 40% Mitsubishi UFJ Morgan Stanley Morgan Stanley Mizuho Securities Iwai Cosmo Securities Co. Ltd BNP Paribas Equity Research Daiwa Securities Co. Ltd. Barclays Mito Securities SMBC Nikko Securities Inc Marusan Securities Macquarie Credit Suisse Nomura EVA Dimensions Goldman Sachs Tachibana Securities TIW 58% 400 50% 53% 53% 47% 20% 38% 41% 42% 31% 33% 200 Securitie 29% 29% 0% 0 mars.12 avr.12 mai.12 juin.12 juil.12 août.12 sept.12 oct.12 nov.12 déc.12 janv.13 févr.13 Buy Hold Sell Price Target Price Date Buy Hold Sell Date Price Target Price Broker Analyst Recommendation Target Date 28-Feb-13 42% 47% 11% 15-Mar-13 1314.00 1178.46 SMBC Nikko Securities Inc TAKU OUCHI outperform 1350.00 14-Mar-13 31-Jan-13 47% 42% 11% 14-Mar-13 1258.00 1178.46 Marusan Securities KOSUKE SAHARA outperform 8-Mar-13 31-Dec-12 58% 32% 11% 13-Mar-13 1225.00 1178.46 Credit Suisse SHINJI KURODA neutral 1100.00 8-Mar-13 30-Nov-12 53% 37% 11% 12-Mar-13 1240.00 1178.46 Morgan Stanley YOSHINAO IBARA Equalwt/Attractive 1200.00 7-Mar-13 31-Oct-12 53% 37% 11% 11-Mar-13 1247.00 1178.46 Iwai Cosmo Securities Co. Ltd HITOSHI OHNISHI Neutral Plus 1300.00 28-Feb-13 28-Sep-12 50% 39% 11% 8-Mar-13 1229.00 1178.46 Mitsubishi UFJ Morgan Stanley Securitie TAKESHI ISHIZUKA neutral 950.00 27-Feb-13 31-Aug-12 41% 47% 12% 7-Mar-13 1172.00 1166.92 Mizuho Securities JUNJI SAKURADA buy 1300.00 22-Feb-13 31-Jul-12 38% 50% 13% 6-Mar-13 1168.00 1166.92 Nomura RYO TAZAKI buy 1250.00 21-Feb-13 29-Jun-12 33% 53% 13% 5-Mar-13 1164.00 1160.00 Macquarie KENJIN HOTTA neutral 1100.00 12-Feb-13 31-May-12 29% 50% 21% 4-Mar-13 1149.00 1133.57 Goldman Sachs YUICHIRO ISAYAMA neutral/attractive 1150.00 6-Feb-13 30-Apr-12 29% 57% 14% 1-Mar-13 1143.00 1133.57 BNP Paribas Equity Research CHRISTOPHER CINTAVEY hold 1070.00 6-Feb-13 30-Mar-12 31% 56% 13% 28-Feb-13 1119.00 1133.57 TIW MASAKAZU ITOI Neutral Plus 16-Jan-13 27-Feb-13 1125.00 1134.67 EVA Dimensions CRAIG STERLING underweight 15-Jan-13 26-Feb-13 1102.00 1134.67 Barclays KUNIO SAKAIDA overweight 1070.00 5-Dec-12 25-Feb-13 1105.00 1092.67 Tachibana Securities YOSHIKAZU SHIMADA Strong Outperform 13-Nov-12 22-Feb-13 1073.00 1092.67 Daiwa Securities Co. Ltd. HIROSUKE TAI neutral 800.00 5-Nov-12 21-Feb-13 1057.00 1072.67 Mito Securities YOICHIRO WATANABE Neutral Plus 17-Nov-10 20-Feb-13 1083.00 1055.33 19-Feb-13 1079.00 1055.33 18-Feb-13 1065.00 1055.33 15-Feb-13 1040.00 1055.33 14-Feb-13 1043.00 1055.33 13-Feb-13 1046.00 1055.33 12-Feb-13 1035.00 1055.33 11-Feb-13 1026.00 1044.00 8-Feb-13 1026.00 1044.00 7-Feb-13 1071.00 1044.00 6-Feb-13 1113.00 1044.00 5-Feb-13 1049.00 1013.85 4-Feb-13 1054.00 1013.85 Q.M.S Advisors | tel: +41 (0)78 922 08 77 | e-mail: info@qmsadv.com |
- 3. 15.03.2013 Kubota Corp Company Analysis - Ownership Ownership Type Ownership Statistics Geographic Ownership Distribution Geographic Ownership 0% Shares Outstanding (M) 1256.0 Japan 76.77% 1% 0% Float 94.5% United States 15.68% 1% 1% 1% 3% Short Interest (M) 36% Australia 3.16% Short Interest as % of Float Luxembourg 1.32% Days to Cover Shorts Britain 1.16% 16% Institutional Ownership 64.01% Switzerland 0.50% Retail Ownership 35.96% Ireland 0.36% Insider Ownership 0.02% 64% Others 1.05% 77% Institutional Ownership Distribution Bank 35.68% Investment Advisor 33.95% Insurance Company 16.07% Institutional Ownership Retail Ownership Insider Ownership Corporation 7.42% Japan United States Australia Luxembourg Pricing data is in JPY Others 6.88% Britain Switzerland Ireland Others Top 20 Owners: TOP 20 ALL Institutional Ownership Holder Name Position Position Change Market Value % of Ownership Report Date Source Country MASTER TRUST BANK OF 119'924'000 12'606'000 157'580'136'000 9.33% 30.09.2012 Co File JAPAN 7% MITSUBISHI UFJ FINAN 106'709'439 937'986 140'216'202'846 8.30% 31.12.2011 ULT-AGG JAPAN 7% NIPPON LIFE INSURANC 81'633'000 -4'464'265 107'265'762'000 6.35% 30.09.2012 ULT-AGG JAPAN 36% JAPAN TRUSTEE SERVIC 66'382'000 6'733'000 87'225'948'000 5.16% 30.09.2012 Co File JAPAN MEIJI YASUDA LIFE IN 59'929'000 0 78'746'706'000 4.66% 30.09.2012 Co File JAPAN SUMITOMO MITSUI FINA 45'006'000 0 59'137'884'000 3.50% 30.09.2012 ULT-AGG JAPAN 16% MIZUHO FINANCIAL GRO 42'043'000 -128'000 55'244'502'000 3.27% 29.10.2012 ULT-AGG JAPAN MOXLEY & CO 30'503'000 -1'255'000 40'080'942'000 2.37% 30.09.2012 Co File UNITED STATES KUBOTA CORP 29'565'000 12'000 38'848'410'000 2.30% 30.09.2012 Co File JAPAN STATE STREET CUSTODI 28'101'000 948'000 36'924'714'000 2.19% 30.09.2012 ULT-AGG 34% SUMITOMO MITSUI TRUS 26'125'000 -37'544'000 34'328'250'000 2.03% 30.09.2012 ULT-AGG JAPAN BLACKROCK 25'263'786 -583'609 33'196'614'804 1.96% 13.03.2013 ULT-AGG UNITED STATES CAPITAL GROUP COMPAN 23'203'000 -375'000 30'488'742'000 1.80% 31.12.2012 ULT-AGG UNITED STATES JP MORGAN CHASE BANK 22'742'000 -22'642'000 29'882'988'000 1.77% 30.09.2012 Co File UNITED STATES Bank Investment Advisor Insurance Company Corporation Others FMR LLC 20'595'816 -2'647'213 27'062'902'224 1.60% 31.01.2013 ULT-AGG UNITED STATES VANGUARD GROUP INC 17'987'177 246'995 23'635'150'578 1.40% 31.12.2012 MF-AGG UNITED STATES NIKKO ASSET MANAGEME 14'893'000 -1'257'000 19'569'402'000 1.16% 13.04.2012 ULT-AGG NOMURA 12'453'000 938'000 16'363'242'000 0.97% 28.02.2013 ULT-AGG TOKIO MARINE & NICHI 6'899'902 0 9'066'471'228 0.54% 31.03.2012 Co File JAPAN SARASIN 4'919'000 -639'300 6'463'566'000 0.38% 31.01.2013 ULT-AGG Top 5 Insiders: Holder Name Position Position Change Market Value % of Ownership Report Date Source MASUMOTO YASUO 58'000 9'000 76'212'000 0.01% 22.06.2012 Co File KIMATA MASATOSHI 45'000 59'130'000 0.00% 22.06.2012 Co File NARA HIROKAZU 34'000 4'000 44'676'000 0.00% 22.06.2012 Co File TOMITA TETSUJI 34'000 7'000 44'676'000 0.00% 22.06.2012 Co File SAKAMOTO SATORU 29'000 6'000 38'106'000 0.00% 22.06.2012 Co File Q.M.S Advisors | tel: +41 (0)78 922 08 77 | e-mail: info@qmsadv.com |
- 4. Company Analysis - Financials I/IV Kubota Corp Financial information is in JPY (M) Equivalent Estimates Periodicity: Fiscal Year 3/02 3/03 3/04 3/05 3/06 3/07 3/08 3/09 3/10 3/11 3/12 3/13E 3/14E 3/15E Income Statement Revenue 965'791 926'145 930'237 983'226 1'065'736 1'127'456 1'154'574 1'107'482 930'644 933'685 1'008'019 1'153'334 1'238'408 1'293'888 - Cost of Goods Sold 729'863 695'571 701'718 713'312 753'952 794'687 824'093 810'226 681'374 682'167 735'836 Gross Income 235'928 230'574 228'519 269'914 311'784 332'769 330'481 297'256 249'270 251'518 272'183 302'462 337'776 356'466 - Selling, General & Admin Expenses 201'504 200'961 205'548 183'141 190'726 202'422 193'606 194'441 179'568 165'407 166'503 (Research & Dev Costs) 30'186 26'400 23'261 21'963 22'700 22'900 24'800 26'300 25'200 25'042 27'900 Operating Income 34'424 29'613 22'610 86'773 121'058 130'347 136'875 102'815 69'702 86'111 105'680 110'573 137'639 152'027 - Interest Expense 6'697 4'818 4'252 4'699 1'156 1'219 986 2'664 2'127 1'632 1'892 - Foreign Exchange Losses (Gains) -561 2'482 1'534 -3'597 1'952 442 9'043 11'525 -2'894 1'640 7'609 - Net Non-Operating Losses (Gains) -216 15'924 -11'848 -72'688 -24'204 -4'232 4'175 5'145 -3'416 -8'953 -6'388 Pretax Income 28'504 6'389 28'672 158'359 142'154 132'918 122'671 83'481 73'885 91'792 102'567 111'878 139'608 154'575 - Income Tax Expense 17'314 12'296 13'701 48'116 56'067 48'961 48'044 28'746 25'977 30'684 36'548 Income Before XO Items 11'190 -5'907 14'971 110'243 86'087 83'957 74'627 54'735 47'908 61'108 66'019 - Extraordinary Loss Net of Tax 0 0 795 -11'100 115 1'286 -189 0 0 0 0 - Minority Interests 1'660 2'097 2'476 3'442 4'938 6'214 6'790 6'671 5'582 6'286 4'467 Diluted EPS Before XO Items 78.67 61.76 60.00 52.65 37.68 33.28 43.11 48.75 Net Income Adjusted* 9'530 0 11'700 117'901 81'034 76'457 68'026 48'064 42'326 54'822 61'552 68'839 85'956 95'190 EPS Adjusted 6.78 (5.84) 8.72 89.11 62.14 59.01 52.80 37.68 33.28 43.11 48.75 54.56 68.25 75.32 Dividends Per Share 6.00 6.00 6.00 6.00 10.00 12.00 14.00 14.00 12.00 14.00 15.00 16.72 18.72 19.83 Payout Ratio % 88.2 64.4 9.8 16.0 19.9 26.4 37.1 36.1 32.5 30.6 0.31 0.27 0.26 Total Shares Outstanding 1'390 1'345 1'340 1'300 1'299 1'291 1'281 1'272 1'272 1'272 1'256 Diluted Shares Outstanding 1'494 1'370 1'411 1'360 1'315 1'296 1'288 1'276 1'272 1'272 1'263 EBITDA 74'959 68'417 50'365 112'581 146'879 157'444 167'440 134'057 98'873 113'104 129'588 143'334 174'407 188'036 *Net income excludes extraordinary gains and losses and one-time charges. Q.M.S Advisors | tel: +41 (0)78 922 08 77 | e-mail: info@qmsadv.com |
- 5. Company Analysis - Financials II/IV Periodicity: 3/02 3/03 3/04 3/05 3/06 3/07 3/08 3/09 3/10 3/11 3/12 3/13E 3/14E 3/15E Balance Sheet Total Current Assets 723764 692350 614427 675371 758224 817100 822638 816346 820828 777204 866012 + Cash & Near Cash Items 60'983 67'362 81'221 74'563 91'858 82'601 88'784 69'505 111'428 105'293 100'559 + Short Term Investments 1'394 10 3'001 0 0 0 0 0 0 + Accounts & Notes Receivable 460'537 420'374 325'323 369'519 387'837 411'026 387'485 468'517 459'110 452'642 498'920 + Inventories 155'354 151'245 142'973 155'146 175'660 205'658 206'220 207'401 172'323 174'217 202'070 + Other Current Assets 45'496 53'359 61'909 76'143 102'869 117'815 140'149 70'923 77'967 45'052 64'463 Total Long-Term Assets 476'353 446'661 509'798 517'685 647'178 685'432 641'632 569'478 588'205 579'648 621'657 + Long Term Investments 115'694 92'078 161'464 227'704 361'138 385'161 362'469 291'666 331'697 326'882 336'511 Gross Fixed Assets 742'327 727'456 649'091 647'362 660'349 669'893 682'428 667'673 667'653 668'868 685'639 Accumulated Depreciation 466'116 474'901 426'345 427'612 433'977 432'247 444'355 442'052 446'760 451'510 460'572 + Net Fixed Assets 276'211 252'555 222'746 219'750 226'372 237'646 238'073 225'621 220'893 217'358 225'067 + Other Long Term Assets 84'448 102'028 125'588 70'231 59'668 62'625 41'090 52'191 35'615 35'408 60'079 Total Current Liabilities 514'554 479'364 414'680 504'045 516'438 576'683 519'461 494'375 440'238 435'128 535'983 + Accounts Payable 225'584 205'784 193'706 217'042 220'461 258'190 212'274 179'627 157'949 164'803 215'977 + Short Term Borrowings 165'053 171'398 121'857 186'679 182'229 199'794 179'063 185'978 159'765 162'198 170'833 + Other Short Term Liabilities 108'171 102'182 99'117 100'324 113'748 118'699 128'124 128'770 122'524 108'127 149'173 Total Long Term Liabilities 290'593 330'955 302'817 186'417 253'582 230'143 253'482 275'206 297'176 240'363 244'472 + Long Term Borrowings 167'850 155'966 144'845 117'488 152'024 150'105 183'945 6'500 243'333 191'760 184'402 + Other Long Term Borrowings 122'743 174'989 157'972 68'929 101'558 80'038 69'537 268'706 53'843 48'603 60'070 Total Liabilities 805'147 810'319 717'497 690'462 770'020 806'826 772'943 769'581 737'414 675'491 780'455 + Long Preferred Equity 0 0 0 0 0 0 0 0 0 0 0 + Minority Interest 13'249 15'646 21'575 28'898 36'069 43'230 37'959 45'222 46'476 53'931 + Share Capital & APIC 165'419 165'419 165'419 165'419 177'220 177'220 177'220 177'220 173'311 173'210 172'904 + Retained Earnings & Other Equity 229'551 150'024 225'663 315'600 429'264 482'417 470'877 401'064 453'086 461'675 480'379 Total Shareholders Equity 394'970 328'692 406'728 502'594 635'382 695'706 691'327 616'243 671'619 681'361 707'214 Total Liabilities & Equity 1'200'117 1'139'011 1'124'225 1'193'056 1'405'402 1'502'532 1'464'270 1'385'824 1'409'033 1'356'852 1'487'669 Book Value Per Share 284.07 234.45 291.81 369.90 466.85 510.91 506.09 454.60 492.51 499.24 520.14 552.09 598.30 648.79 Tangible Book Value Per Share 498.72 Q.M.S Advisors | tel: +41 (0)78 922 08 77 | e-mail: info@qmsadv.com |
- 6. Company Analysis - Financials III/IV Periodicity: 3/02 3/03 3/04 3/05 3/06 3/07 3/08 3/09 3/10 3/11 3/12 3/13E 3/14E 3/15E Cash Flows Net Income 9'530 -8'004 11'700 117'901 81'034 76'457 68'026 48'064 42'326 54'822 61'552 68'839 85'956 95'190 + Depreciation & Amortization 40'535 38'804 27'755 25'808 25'821 27'097 30'565 31'242 29'171 26'993 23'908 + Other Non-Cash Adjustments 6'517 30'973 35'649 -56'165 -7'983 -6'958 24'109 21'635 1'392 16'404 5'759 + Changes in Non-Cash Capital 21'244 2'480 565 -20'636 -11'015 234 -32'590 -123'518 46'183 -10'026 -6'856 Cash From Operating Activities 77'826 64'253 75'669 66'908 87'857 96'830 90'110 -22'577 119'072 88'193 84'363 + Disposal of Fixed Assets 2'002 1'803 3'129 2'769 5'568 3'709 115 2'961 1'182 870 13'028 + Capital Expenditures -32'473 -33'838 -26'493 -20'818 -25'680 -34'286 -35'735 -32'959 -26'621 -27'358 -26'962 -49'475 -43'125 -38'143 + Increase in Investments -2'333 -2'056 -2'991 -120'373 0 -61'967 0 -44'468 -22'239 -27'655 0 + Decrease in Investments 9'018 6'537 17'439 64'765 8'941 2'391 3'827 261 9'101 6'300 187 + Other Investing Activities -10'672 -39 2'445 -4'571 -50'121 146 741 184 -4'822 4'262 -56'182 Cash From Investing Activities -34'458 -27'593 -6'471 -78'228 -61'292 -90'007 -31'052 -74'021 -43'399 -43'581 -69'929 + Dividends Paid -8'459 -8'289 -8'061 -7'989 -11'769 -14'274 -16'777 -19'193 -17'814 -15'267 -17'700 + Change in Short Term Borrowings -3'077 -26'548 -7'489 34'453 335 -5'937 -15'840 54'619 -43'729 7'238 9 + Increase in Long Term Borrowings 28'202 65'627 37'128 39'582 88'829 86'434 113'962 129'967 121'966 62'489 104'816 + Decrease in Long Term Borrowings -71'034 -45'447 -74'171 -39'081 -71'719 -73'654 -84'895 -74'386 -90'067 -93'895 -89'203 + Increase in Capital Stocks 0 0 0 0 0 0 0 0 0 0 0 + Decrease in Capital Stocks -6'926 -15'011 -2'223 -21'451 -14'898 -8'515 -7'997 -5'338 -191 -50 -10'016 + Other Financing Activities 276 -613 -523 -852 -48 -134 -36 -8'350 -3'915 -4'976 -2'607 Cash From Financing Activities -61'018 -30'281 -55'339 4'662 -9'270 -16'080 -11'583 77'319 -33'750 -44'461 -14'701 Net Changes in Cash -17'650 6'379 13'859 -6'658 17'295 -9'257 47'475 -19'279 41'923 151 -267 Free Cash Flow (CFO-CAPEX) 45'353 30'415 49'176 46'090 62'177 62'544 54'375 -55'536 92'451 60'835 57'401 35'024 73'655 89'469 Free Cash Flow To Firm 47'982 25'960 51'396 49'361 62'877 63'314 54'975 -53'789 93'830 61'921 58'619 Free Cash Flow To Equity 1'446 25'850 7'773 83'813 85'190 73'096 67'717 57'625 81'803 37'537 86'051 Free Cash Flow per Share 32.27 22.19 36.63 34.84 47.68 48.27 42.21 -43.54 72.69 47.84 45.46 Q.M.S Advisors | tel: +41 (0)78 922 08 77 | e-mail: info@qmsadv.com |
- 7. Company Analysis - Financials IV/IV Periodicity: 3/02 3/03 3/04 3/05 3/06 3/07 3/08 3/09 3/10 3/11 3/12 3/13E 3/14E 3/15E Ratio Analysis Valuation Ratios Price Earnings 58.4x 53.3x 7.1x 20.4x 17.2x 11.8x 14.2x 25.6x 18.2x 16.3x 24.1x 19.3x 17.4x EV to EBIT 23.9x 22.8x 38.2x 11.5x 15.9x 12.6x 8.1x 8.2x 20.4x 15.0x 12.4x EV to EBITDA 11.0x 9.9x 17.1x 8.8x 13.1x 10.4x 6.6x 6.3x 14.4x 11.4x 10.1x 14.3x 11.8x 10.9x Price to Sales 0.6x 0.4x 0.7x 0.8x 1.6x 1.2x 0.7x 0.6x 1.2x 1.1x 1.0x 1.5x 1.4x 1.3x Price to Book 1.4x 1.3x 1.7x 1.5x 2.7x 2.0x 1.2x 1.2x 1.7x 1.6x 1.5x 2.4x 2.2x 2.0x Dividend Yield 1.5% 2.0% 1.2% 1.0% 0.8% 1.2% 2.3% 2.6% 1.4% 1.8% 1.9% 1.3% 1.4% 1.5% Profitability Ratios Gross Margin 24.4% 24.9% 24.6% 27.5% 29.3% 29.5% 28.6% 26.8% 26.8% 26.9% 27.0% 26.2% 27.3% 27.6% EBITDA Margin 7.8% 7.4% 5.4% 11.5% 13.8% 14.0% 14.5% 12.1% 10.6% 12.1% 12.9% 12.4% 14.1% 14.5% Operating Margin 3.6% 3.2% 2.4% 8.8% 11.4% 11.6% 11.9% 9.3% 7.5% 9.2% 10.5% 9.6% 11.1% 11.7% Profit Margin 1.0% -0.9% 1.3% 12.0% 7.6% 6.8% 5.9% 4.3% 4.5% 5.9% 6.1% 6.0% 6.9% 7.4% Return on Assets 0.8% -0.7% 1.0% 10.2% 6.2% 5.3% 4.6% 3.4% 3.0% 4.0% 4.3% 5.9% 7.2% 7.6% Return on Equity 2.3% -2.3% 3.3% 27.0% 14.9% 12.1% 10.4% 7.8% 7.0% 8.7% 9.6% 10.1% 12.0% 12.0% Leverage & Coverage Ratios Current Ratio 1.41 1.44 1.48 1.34 1.47 1.42 1.58 1.65 1.86 1.79 1.62 Quick Ratio 1.02 1.02 0.99 0.88 0.93 0.86 0.92 1.09 1.30 1.28 1.12 Interest Coverage Ratio (EBIT/I) 5.14 6.15 5.32 18.47 104.72 106.93 138.82 38.59 32.77 52.76 55.86 Tot Debt/Capital 0.46 0.50 0.40 0.38 0.34 0.33 0.34 0.24 0.38 0.34 0.33 Tot Debt/Equity 0.84 1.00 0.66 0.61 0.53 0.50 0.53 0.31 0.60 0.52 0.50 Others Asset Turnover 0.78 0.79 0.82 0.85 0.82 0.78 0.78 0.78 0.67 0.68 0.71 Accounts Receivable Turnover 2.09 2.10 2.49 2.83 2.81 2.82 2.89 2.59 2.01 2.05 2.12 Accounts Payable Turnover 2.99 3.21 3.47 3.53 3.54 3.45 3.51 4.14 3.83 4.24 4.01 Inventory Turnover 4.35 4.54 4.77 4.79 4.56 4.17 4.00 3.92 3.59 3.94 3.91 Effective Tax Rate 60.7% 192.5% 47.8% 30.4% 39.4% 36.8% 39.2% 34.4% 35.2% 33.4% 35.6% Q.M.S Advisors | tel: +41 (0)78 922 08 77 | e-mail: info@qmsadv.com |
- 8. Company Analysis - Peers Comparision HITACHI CONST JAPAN STEEL MITSUBISHI KURITA WATER KUBOTA CORP KOMATSU LTD IHI CORP DAIKIN INDS CATERPILLAR INC DEERE & CO NTN CORP THK CO LTD FANUC CORP NSK LTD MAKITA CORP MA WORK HEAVY IND Latest Fiscal Year: 03/2012 03/2012 03/2012 03/2012 03/2012 03/2012 12/2012 10/2012 03/2012 03/2012 03/2012 03/2012 03/2012 03/2012 03/2012 52-Week High 1'324.00 2'512.00 2'250.00 613.00 304.00 4'140.00 114.25 95.60 379.00 560.00 2'129.00 1'823.00 17'130.00 744.00 4'550.00 52-Week High Date 15.03.2013 19.03.2012 04.02.2013 15.03.2012 11.03.2013 15.03.2013 16.03.2012 30.01.2013 19.03.2012 06.02.2013 11.03.2013 15.03.2013 04.01.2013 11.03.2013 12.03.2013 52-Week Low 630.00 1'439.00 1'203.00 374.00 150.00 1'836.00 78.25 69.51 131.00 263.00 1'596.00 1'137.00 11'240.00 414.00 2'468.00 52-Week Low Date 04.06.2012 10.10.2012 10.10.2012 04.06.2012 04.06.2012 04.06.2012 12.07.2012 04.06.2012 14.11.2012 24.08.2012 06.09.2012 04.10.2012 03.08.2012 14.11.2012 04.06.2012 Daily Volume 18'550'000 7'879'300 1'794'900 3'209'000 15'486'000 3'689'500 7'329'016 2'619'424 6'404'000 17'859'000 933'000 1'390'600 1'263'300 1'890'000 616'000 Current Price (3/dd/yy) 1'314.00 2'213.00 2'002.00 518.00 295.00 4'100.00 88.70 92.20 262.00 534.00 2'076.00 1'814.00 14'410.00 740.00 4'455.00 52-Week High % Change -0.8% -11.9% -11.0% -15.5% -3.0% -1.0% -22.4% -3.6% -30.9% -4.6% -2.5% -0.5% -15.9% -0.5% -2.1% 52-Week Low % Change 108.6% 53.8% 66.4% 38.5% 96.7% 123.3% 13.4% 32.6% 100.0% 103.0% 30.1% 59.5% 28.2% 78.7% 80.5% Total Common Shares (M) 1'256.0 952.3 211.8 370.8 1'464.2 291.1 655.0 387.8 531.9 3'355.1 126.7 128.6 195.7 540.6 135.8 Market Capitalization 1'689'698 2'175'667 430'660 192'418 432'782 1'201'767 58'103 35'917 139'505 1'801'528 275'693 242'816 3'451'315 407'938 623'739 Total Debt 355'235.0 647'800.0 401'502.0 63'607.0 345'243.0 389'888.0 10'486.0 5'869.7 273'107.0 1'167'541.0 8'423.0 60'804.0 - 298'151.0 2'391.0 Preferred Stock - - - - - - - - - - - - - - - Minority Interest 53'931.0 47'761.0 45'441.0 940.0 7'874.0 12'110.0 50.0 19.9 15'222.0 49'409.0 1'110.0 1'652.0 3'999.0 18'212.0 2'525.0 Cash and Equivalents 100'559.0 83'986.0 72'803.0 48'179.0 66'506.0 135'339.0 3'306.0 5'009.4 49'360.0 262'288.0 69'402.0 110'788.0 637'076.0 138'793.0 83'441.0 Enterprise Value 2'049'951 2'836'189 809'602 195'365 756'458 1'749'996 65'333 38'333 415'955 2'765'940 215'824 196'658 2'781'465 599'845 521'239 Valuation Total Revenue LFY 1'008'019.0 1'981'763.0 817'143.0 221'368.0 1'221'869.0 1'218'700.0 65'875.0 35'656.6 543'468.0 2'820'932.0 193'792.0 196'866.0 538'492.0 733'192.0 295'711.0 LTM 1'072'779.0 1'926'745.0 829'108.0 217'316.0 1'260'958.0 1'246'941.0 65'875.0 36'352.5 544'001.0 2'852'710.0 194'513.0 181'090.0 535'685.0 750'716.0 293'907.0 CY+1 1'153'334.4 1'909'756.0 765'201.7 224'760.0 1'254'233.3 1'262'742.1 63'441.6 36'025.9 528'000.0 2'994'423.5 190'800.0 167'971.6 484'752.2 722'422.7 303'342.2 CY+2 1'238'407.7 2'006'823.6 792'789.3 219'216.7 1'202'846.2 1'505'854.7 69'086.6 37'121.4 554'420.0 3'245'264.7 194'275.0 184'280.3 472'779.7 761'918.2 324'648.6 EV/Total Revenue LFY 1.3x 1.0x 0.8x 0.7x 0.4x 0.7x 1.0x 1.1x 0.6x 0.7x - 0.5x 3.3x 0.6x 1.1x LTM 1.2x 1.1x 0.7x 0.7x 0.4x 0.7x 1.0x 1.1x 0.6x 0.7x - 0.6x 3.4x 0.6x 1.1x CY+1 1.7x 1.4x 1.0x 0.9x 0.6x 1.3x 1.4x 1.4x 0.8x 0.9x 1.1x 1.1x 5.7x 0.8x 1.7x CY+2 1.6x 1.3x 1.0x 0.8x 0.6x 1.1x 1.1x 1.3x 0.7x 0.8x 1.1x 1.0x 5.7x 0.7x 1.6x EBITDA LFY 129'588.0 346'449.0 94'408.0 43'163.0 89'546.0 131'717.0 11'966.0 5'424.5 54'898.0 235'925.0 45'416.0 30'296.0 237'300.0 80'989.0 55'753.0 LTM 135'848.0 323'627.0 93'446.0 35'662.0 86'546.0 134'825.0 11'966.0 5'787.0 46'117.0 206'597.0 42'997.0 24'883.0 224'687.0 75'687.0 52'905.0 CY+1 143'333.8 323'962.8 88'173.3 33'100.0 83'309.4 129'069.2 10'709.7 5'794.8 42'087.5 275'671.4 39'100.0 21'229.5 199'430.5 64'869.3 54'173.2 CY+2 174'407.3 382'483.8 104'780.1 30'075.0 99'342.9 170'603.2 12'312.7 6'017.7 53'812.5 302'877.8 39'083.3 28'539.0 197'668.8 78'130.0 62'334.6 EV/EBITDA LFY 10.2x 5.9x 6.5x 3.8x 5.7x 6.3x 5.5x 7.2x 6.1x 8.4x - 3.3x 7.6x 5.2x 5.9x LTM 9.7x 6.3x 6.6x 4.5x 5.9x 6.2x 5.5x 6.7x 7.3x 9.6x - 4.1x 8.0x 5.6x 6.2x CY+1 13.9x 8.4x 8.8x 6.1x 8.9x 13.2x 8.2x 8.6x 9.6x 9.6x 5.3x 8.9x 13.9x 8.8x 9.7x CY+2 11.4x 6.8x 7.2x 5.6x 7.2x 10.0x 6.4x 8.2x 7.3x 8.6x 5.2x 6.5x 13.6x 7.2x 8.3x EPS LFY 48.70 173.32 109.94 35.19 10.42 140.13 8.62 7.63 10.99 9.66 131.14 98.85 707.21 52.75 240.12 LTM 52.42 144.96 158.97 20.50 20.93 75.89 8.63 7.99 1.01 1.14 106.84 79.94 672.15 48.07 229.48 CY+1 54.56 146.91 141.73 25.37 16.68 98.21 8.04 8.57 (12.29) 21.40 103.84 57.88 606.30 31.13 233.05 CY+2 68.25 183.37 149.93 25.43 17.48 218.39 9.42 9.01 16.05 25.27 122.85 91.13 595.57 46.77 271.97 P/E LFY 25.1x 15.3x 12.6x 25.3x 14.1x 54.0x 10.3x 11.5x 259.4x 469.7x 19.4x 22.7x 21.4x 15.4x 19.4x LTM 25.1x - - - - - 10.3x 11.5x - - - - - - 19.3x CY+1 24.1x 15.1x 14.1x 20.4x 17.7x 41.7x 11.0x 10.8x - 25.0x 20.0x 31.3x 23.8x 23.8x 19.1x CY+2 19.3x 12.1x 13.4x 20.4x 16.9x 18.8x 9.4x 10.2x 16.3x 21.1x 16.9x 19.9x 24.2x 15.8x 16.4x Revenue Growth 1 Year 8.0% 7.5% 5.6% 4.0% 2.9% 5.0% 9.5% 13.0% 2.5% (2.9%) 6.9% 3.3% 20.7% 3.2% 8.5% 5 Year 0.3% 1.5% 1.0% (0.3%) 1.0% 0.9% 11.5% 8.3% 3.1% (1.3%) (0.6%) 8.3% 20.4% 2.5% (0.6%) EBITDA Growth 1 Year 14.6% 10.9% 9.6% (11.0%) (15.7%) 3.6% 23.6% 12.8% (9.3%) 1.1% 5.1% (1.5%) 16.9% 2.2% 12.7% 5 Year (3.8%) 1.8% (1.6%) 7.7% 26.8% 2.7% 12.2% 11.2% (7.1%) 1.8% 8.1% (4.9%) 6.5% (3.8%) (0.4%) EBITDA Margin LTM 12.7% 16.8% 11.3% 16.4% 6.9% 10.8% 18.2% 15.9% 8.5% 7.2% 22.1% 13.7% 41.9% 10.1% 18.0% CY+1 12.4% 17.0% 11.5% 14.7% 6.6% 10.2% 16.9% 16.1% 8.0% 9.2% 20.5% 12.6% 41.1% 9.0% 17.9% CY+2 14.1% 19.1% 13.2% 13.7% 8.3% 11.3% 17.8% 16.2% 9.7% 9.3% 20.1% 15.5% 41.8% 10.3% 19.2% Leverage/Coverage Ratios Total Debt / Equity % 54.4% 64.2% 124.2% 49.8% 137.8% 77.4% 229.0% 473.8% 138.7% 92.9% 4.0% 35.0% 0.0% 106.2% 0.7% Total Debt / Capital % 33.4% 38.0% 52.1% 33.1% 57.2% 43.0% 69.5% 82.5% 56.3% 47.2% 3.9% 25.7% 0.0% 49.9% 0.7% Total Debt / EBITDA 2.832x 1.916x 3.759x 1.432x 3.625x 3.030x 0.876x 1.139x 6.857x 5.841x - 2.415x 0.000x 3.919x 0.034x Net Debt / EBITDA 2.037x 1.668x 3.244x -0.008x 2.800x 1.730x 0.600x 0.417x 5.176x 3.880x - -2.084x -2.977x 2.100x -1.613x EBITDA / Int. Expense 68.493x 44.508x 8.148x 65.005x 17.030x 21.466x 25.623x 28.048x 16.295x 11.496x 516.091x 46.538x - 16.508x 230.384x Credit Ratings S&P LT Credit Rating NR A - - NR NR A A NR BBB+ NR NR NR NR NR S&P LT Credit Rating Date 09.01.2007 26.10.2007 - - 10.04.2009 09.01.2007 24.06.2003 14.12.2006 09.01.2007 12.10.2010 09.01.2007 09.01.2007 09.01.2007 10.04.2009 31.03.2008 Moody's LT Credit Rating WR A2 - - WR A3 A2 A2 WR WR - - - WR WR Moody's LT Credit Rating Date 30.09.2005 01.10.2004 - - 25.05.2007 02.11.2012 15.06.1995 08.02.2007 03.04.2009 09.09.2008 - - - 03.04.2009 31.03.2005 Q.M.S Advisors | tel: +41 (0)78 922 08 77 | e-mail: info@qmsadv.com |