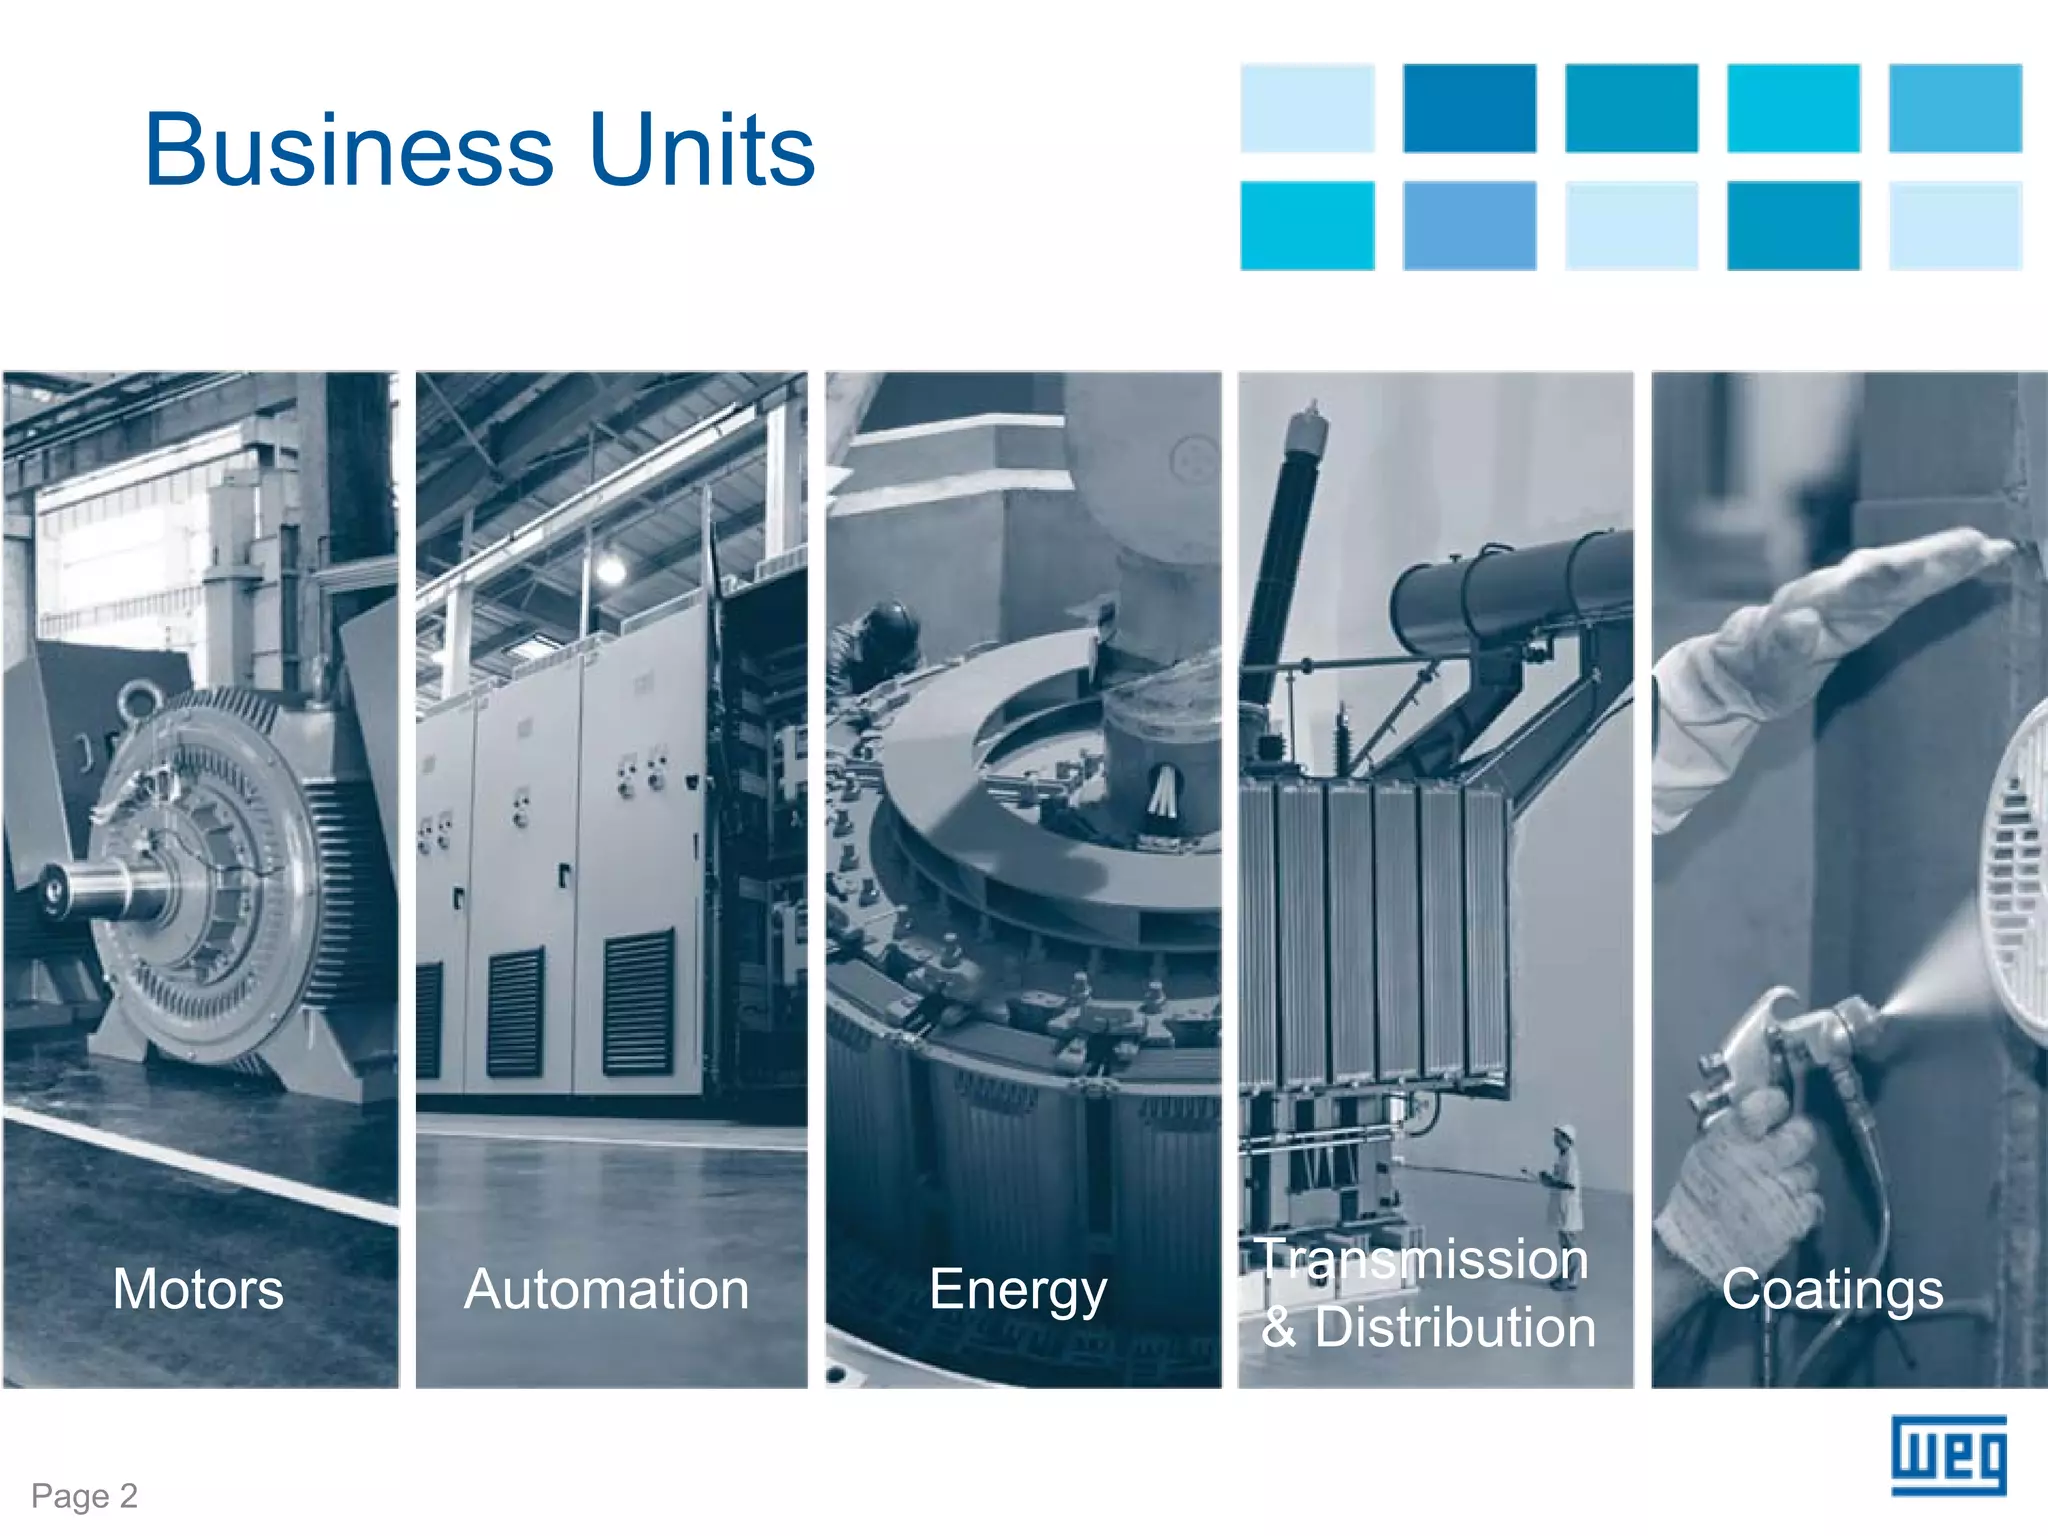
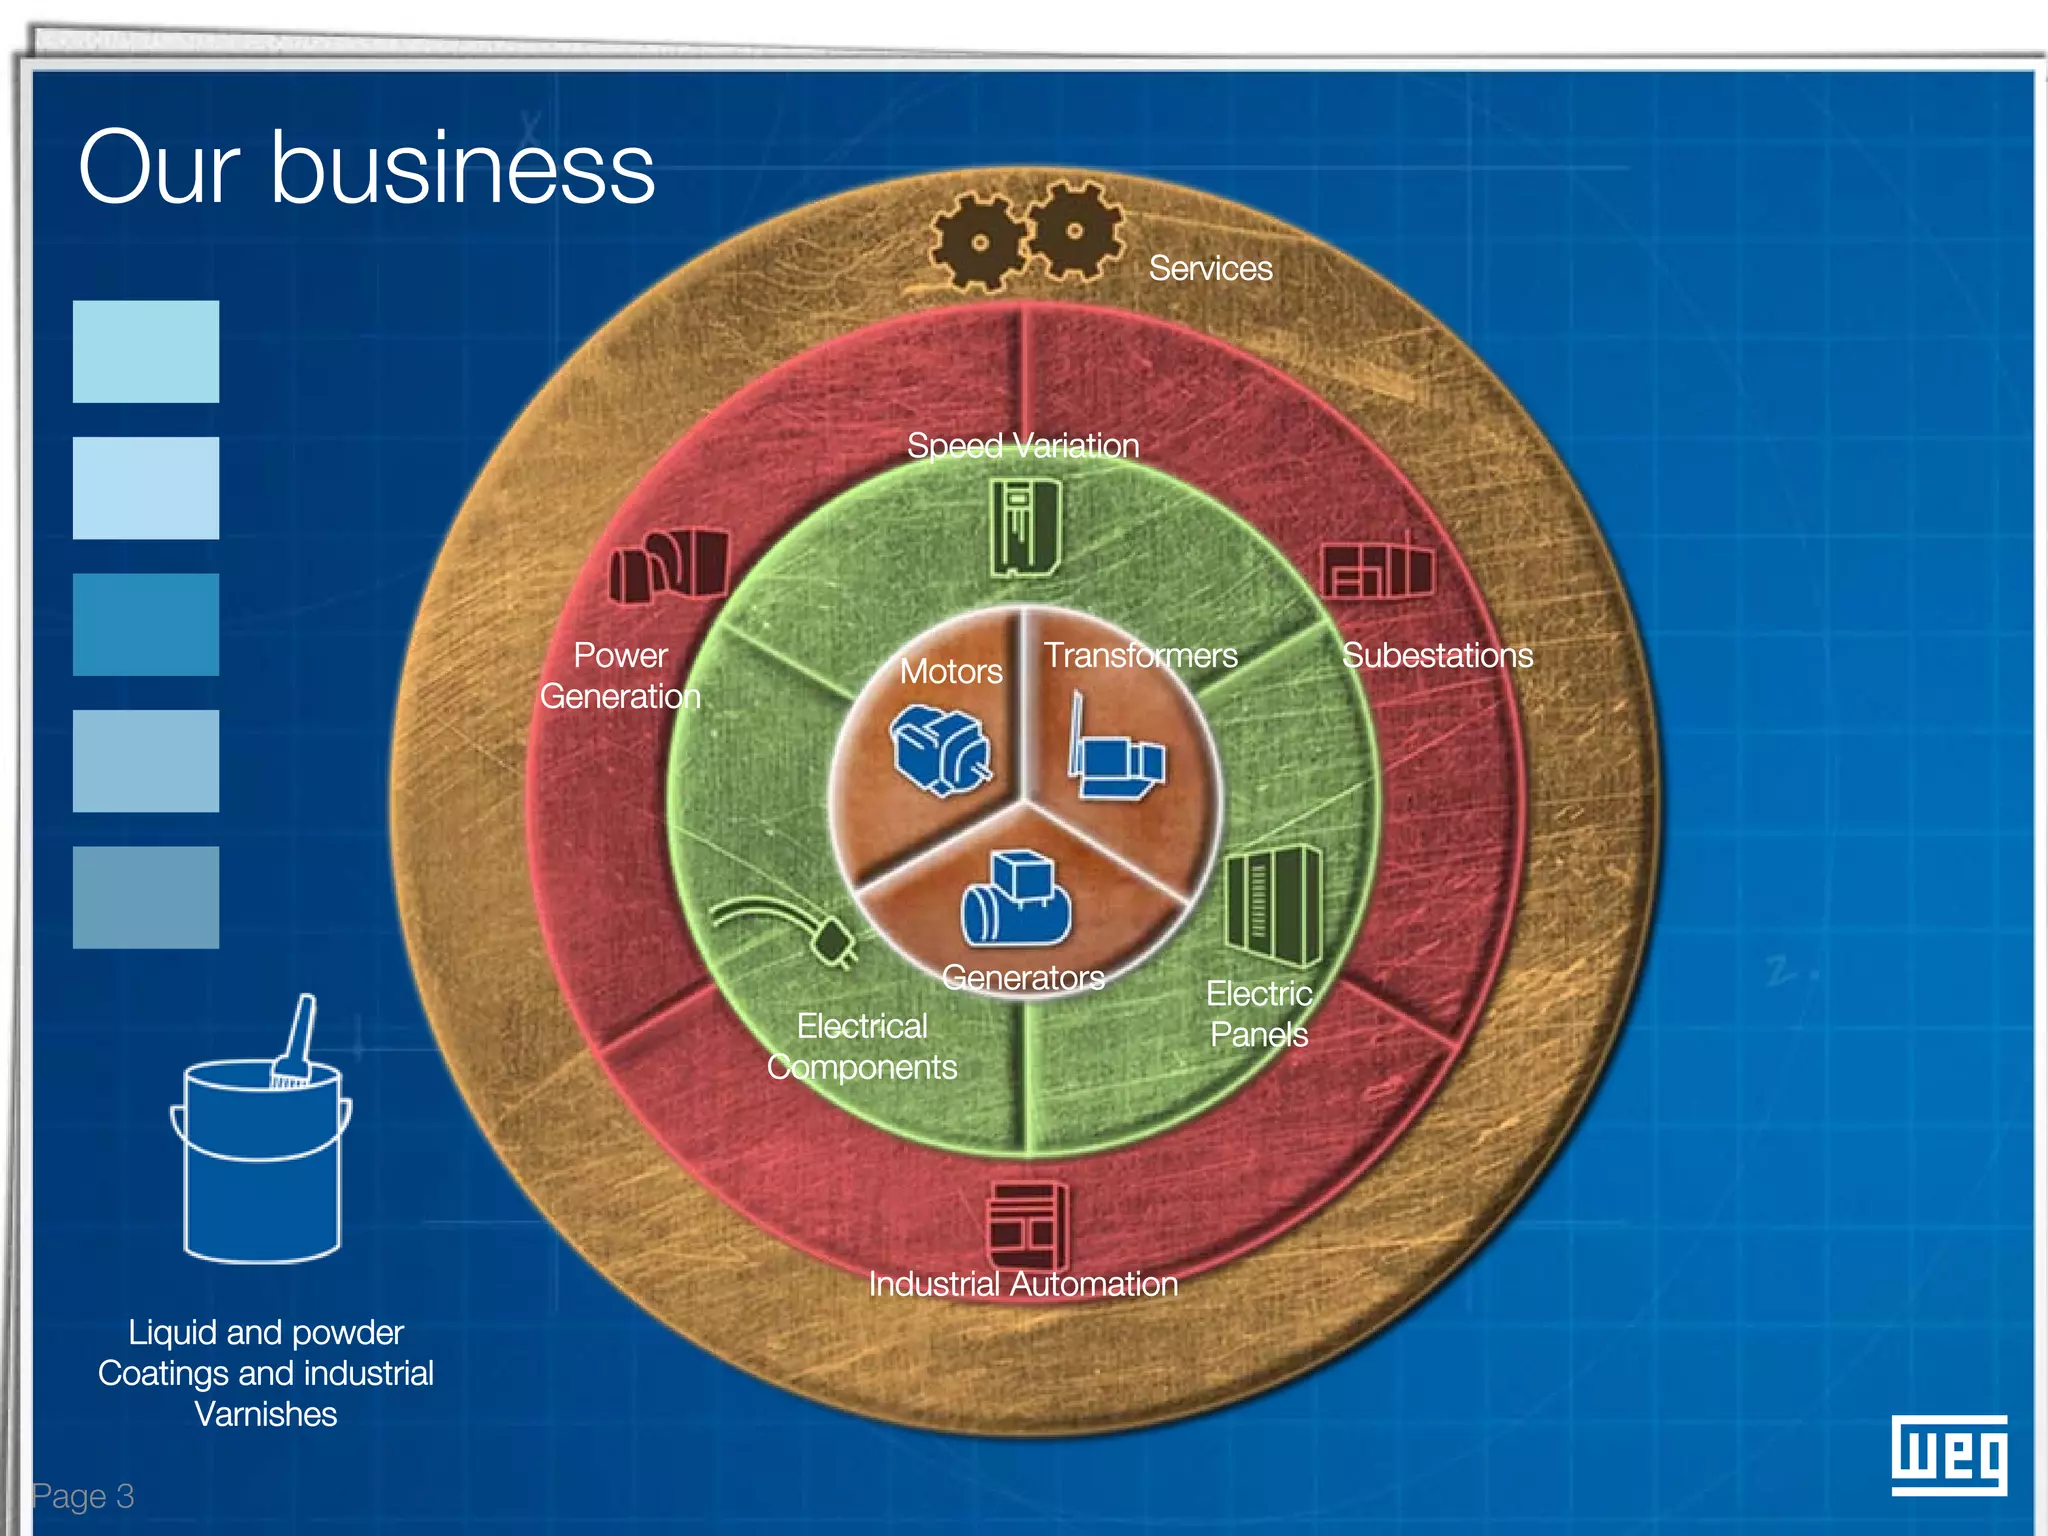
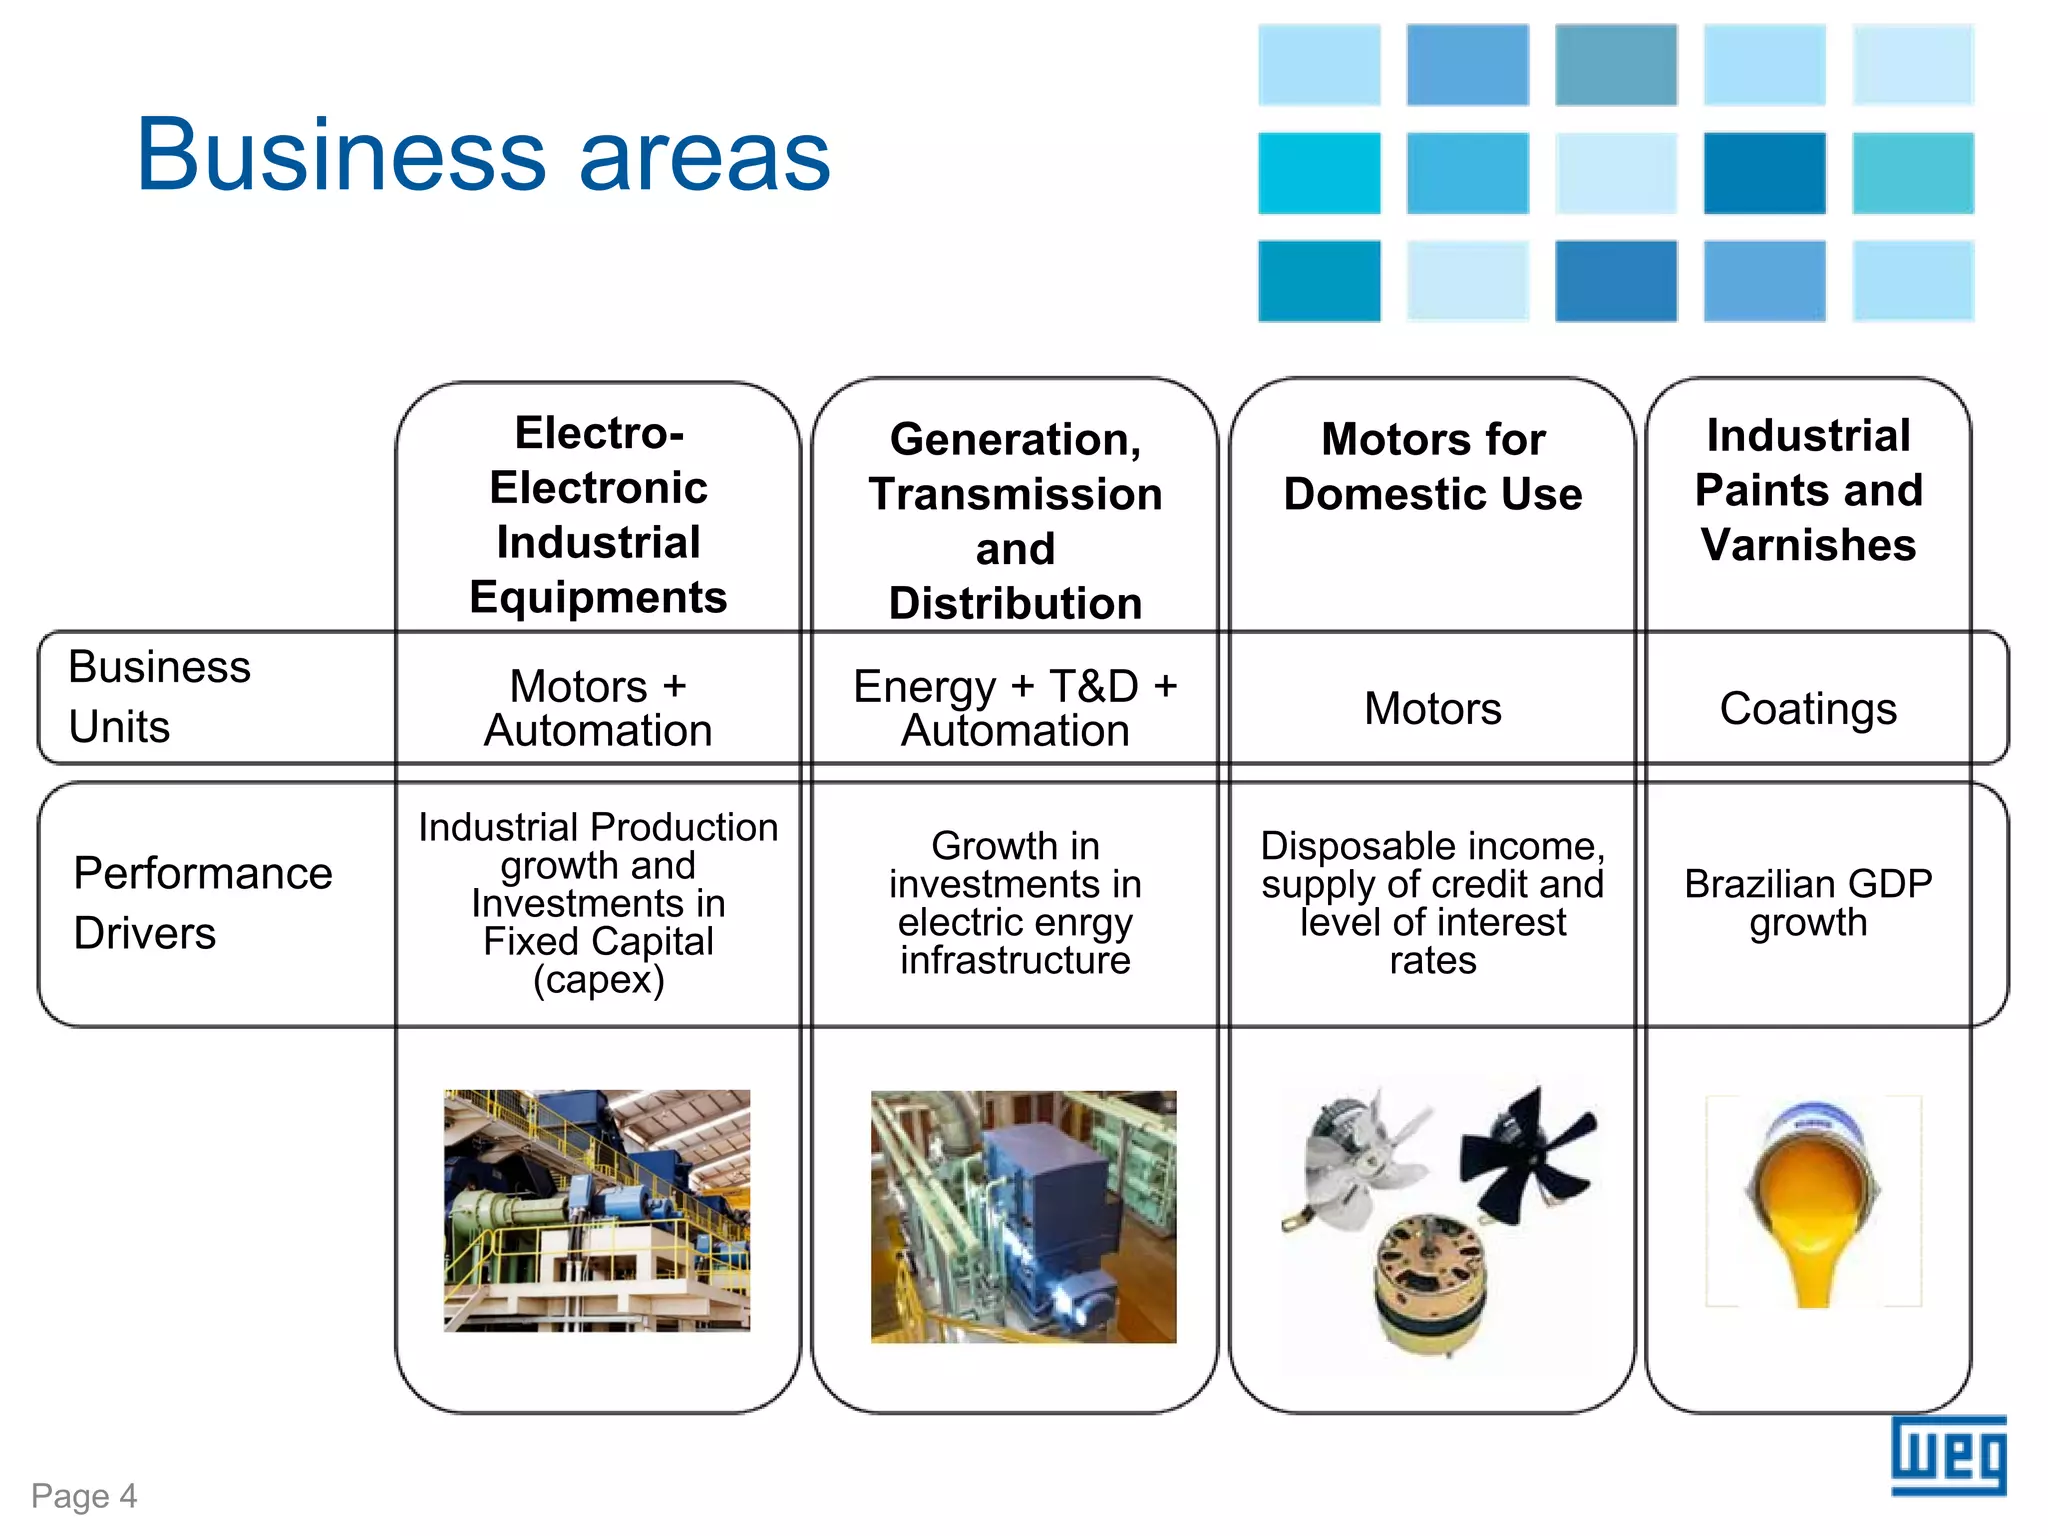
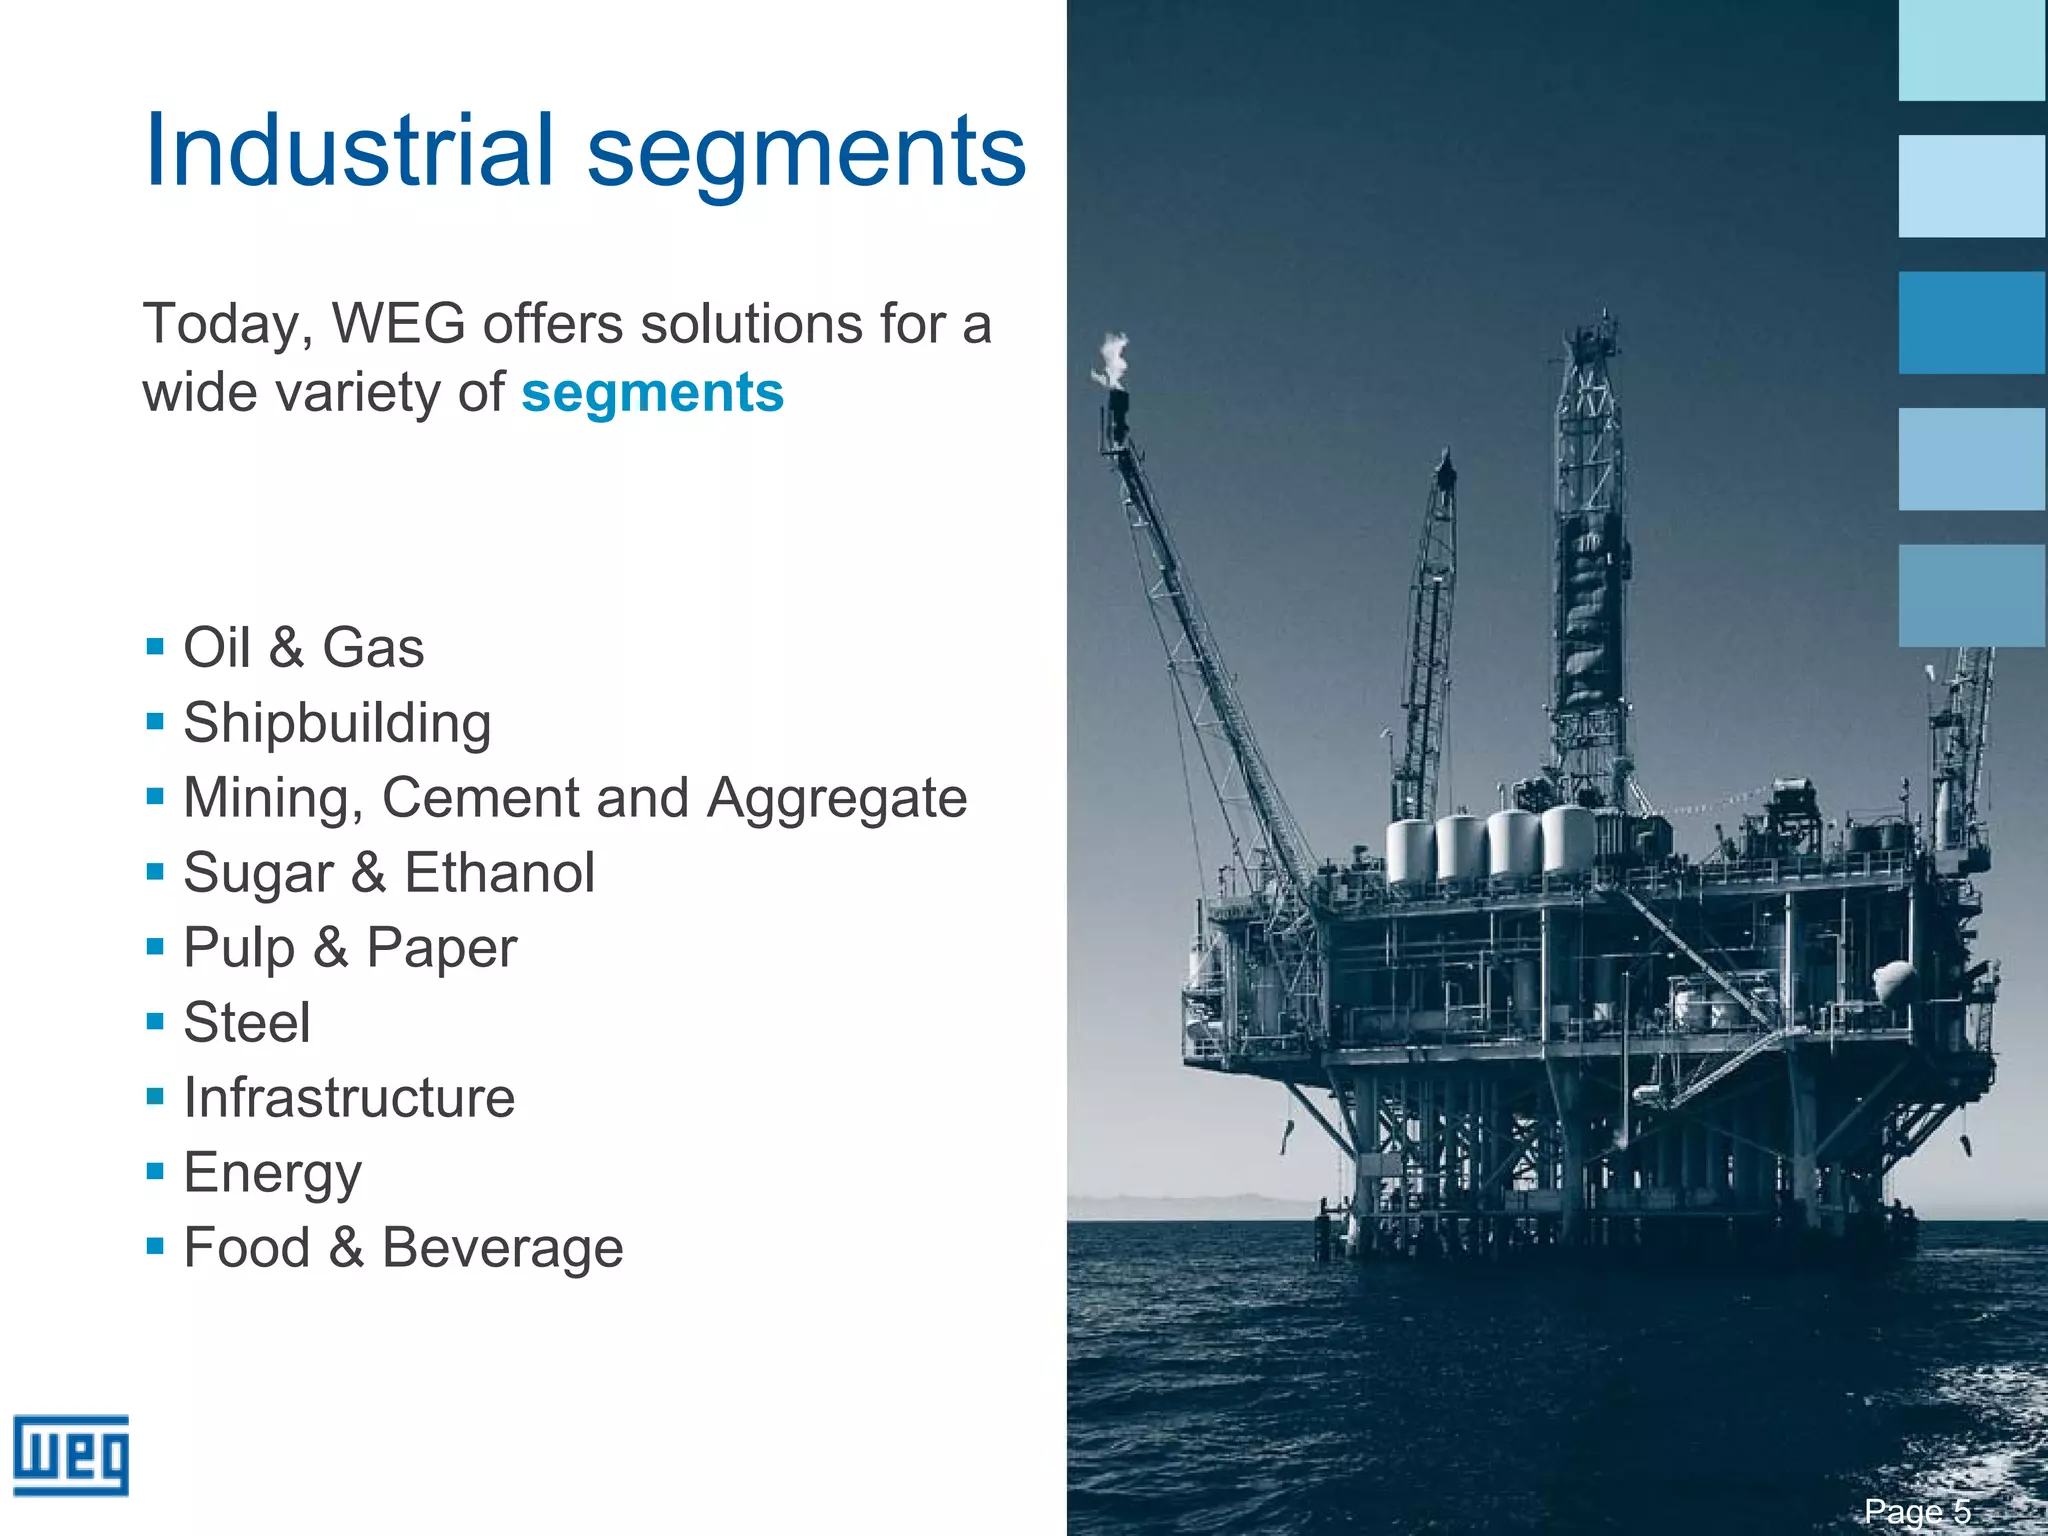
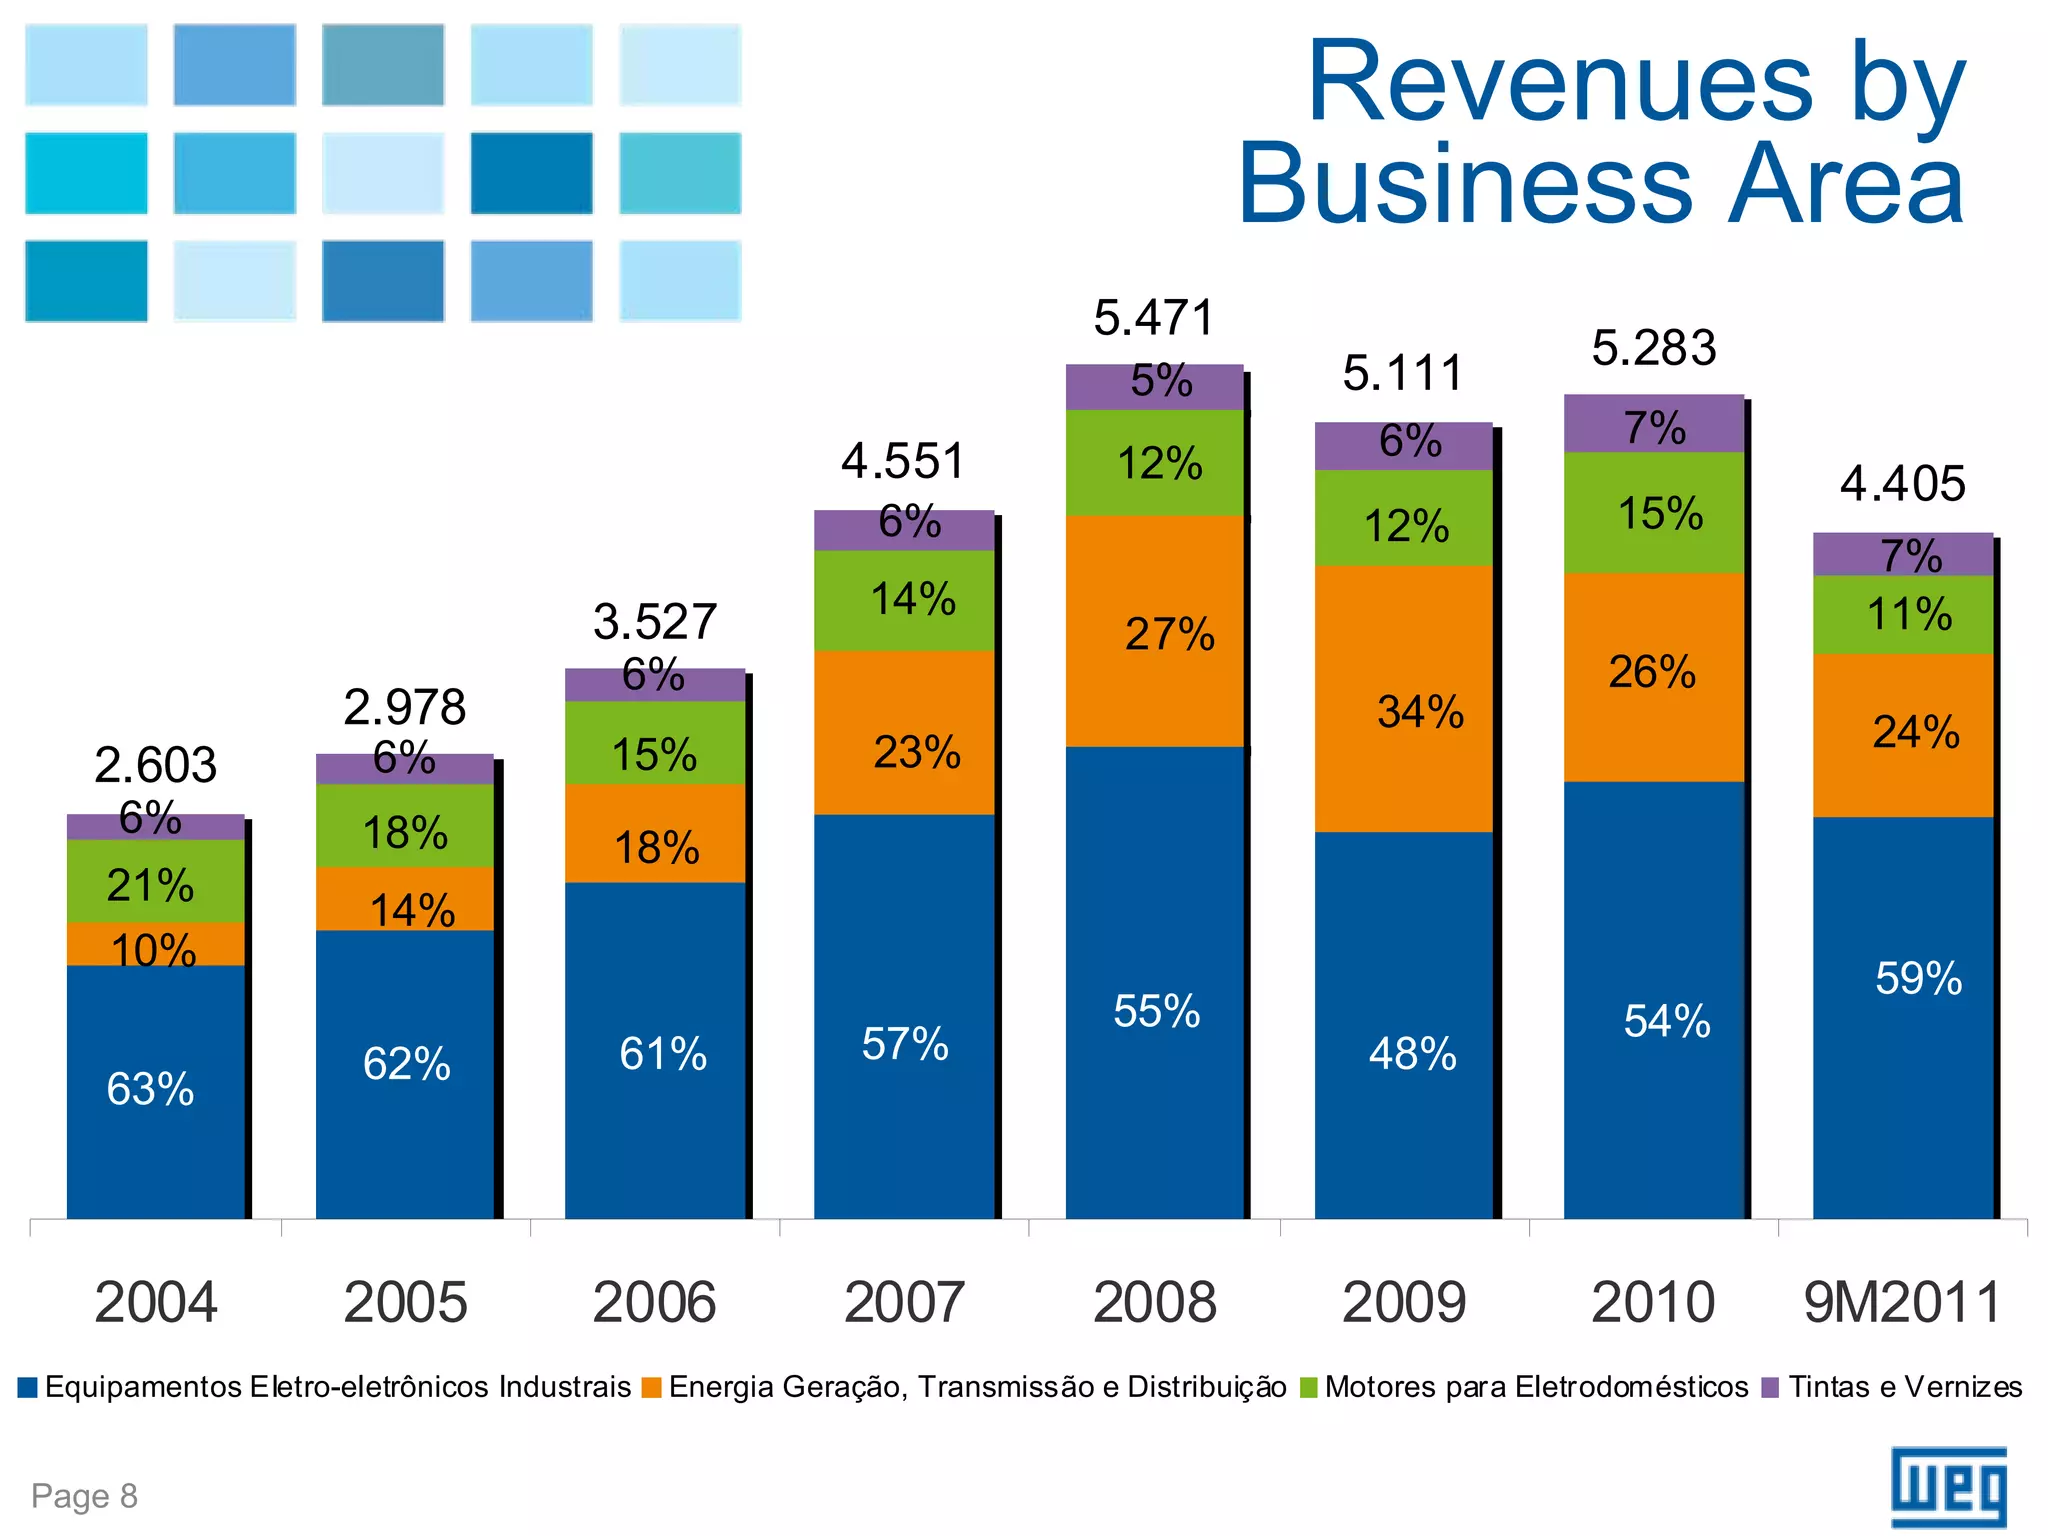
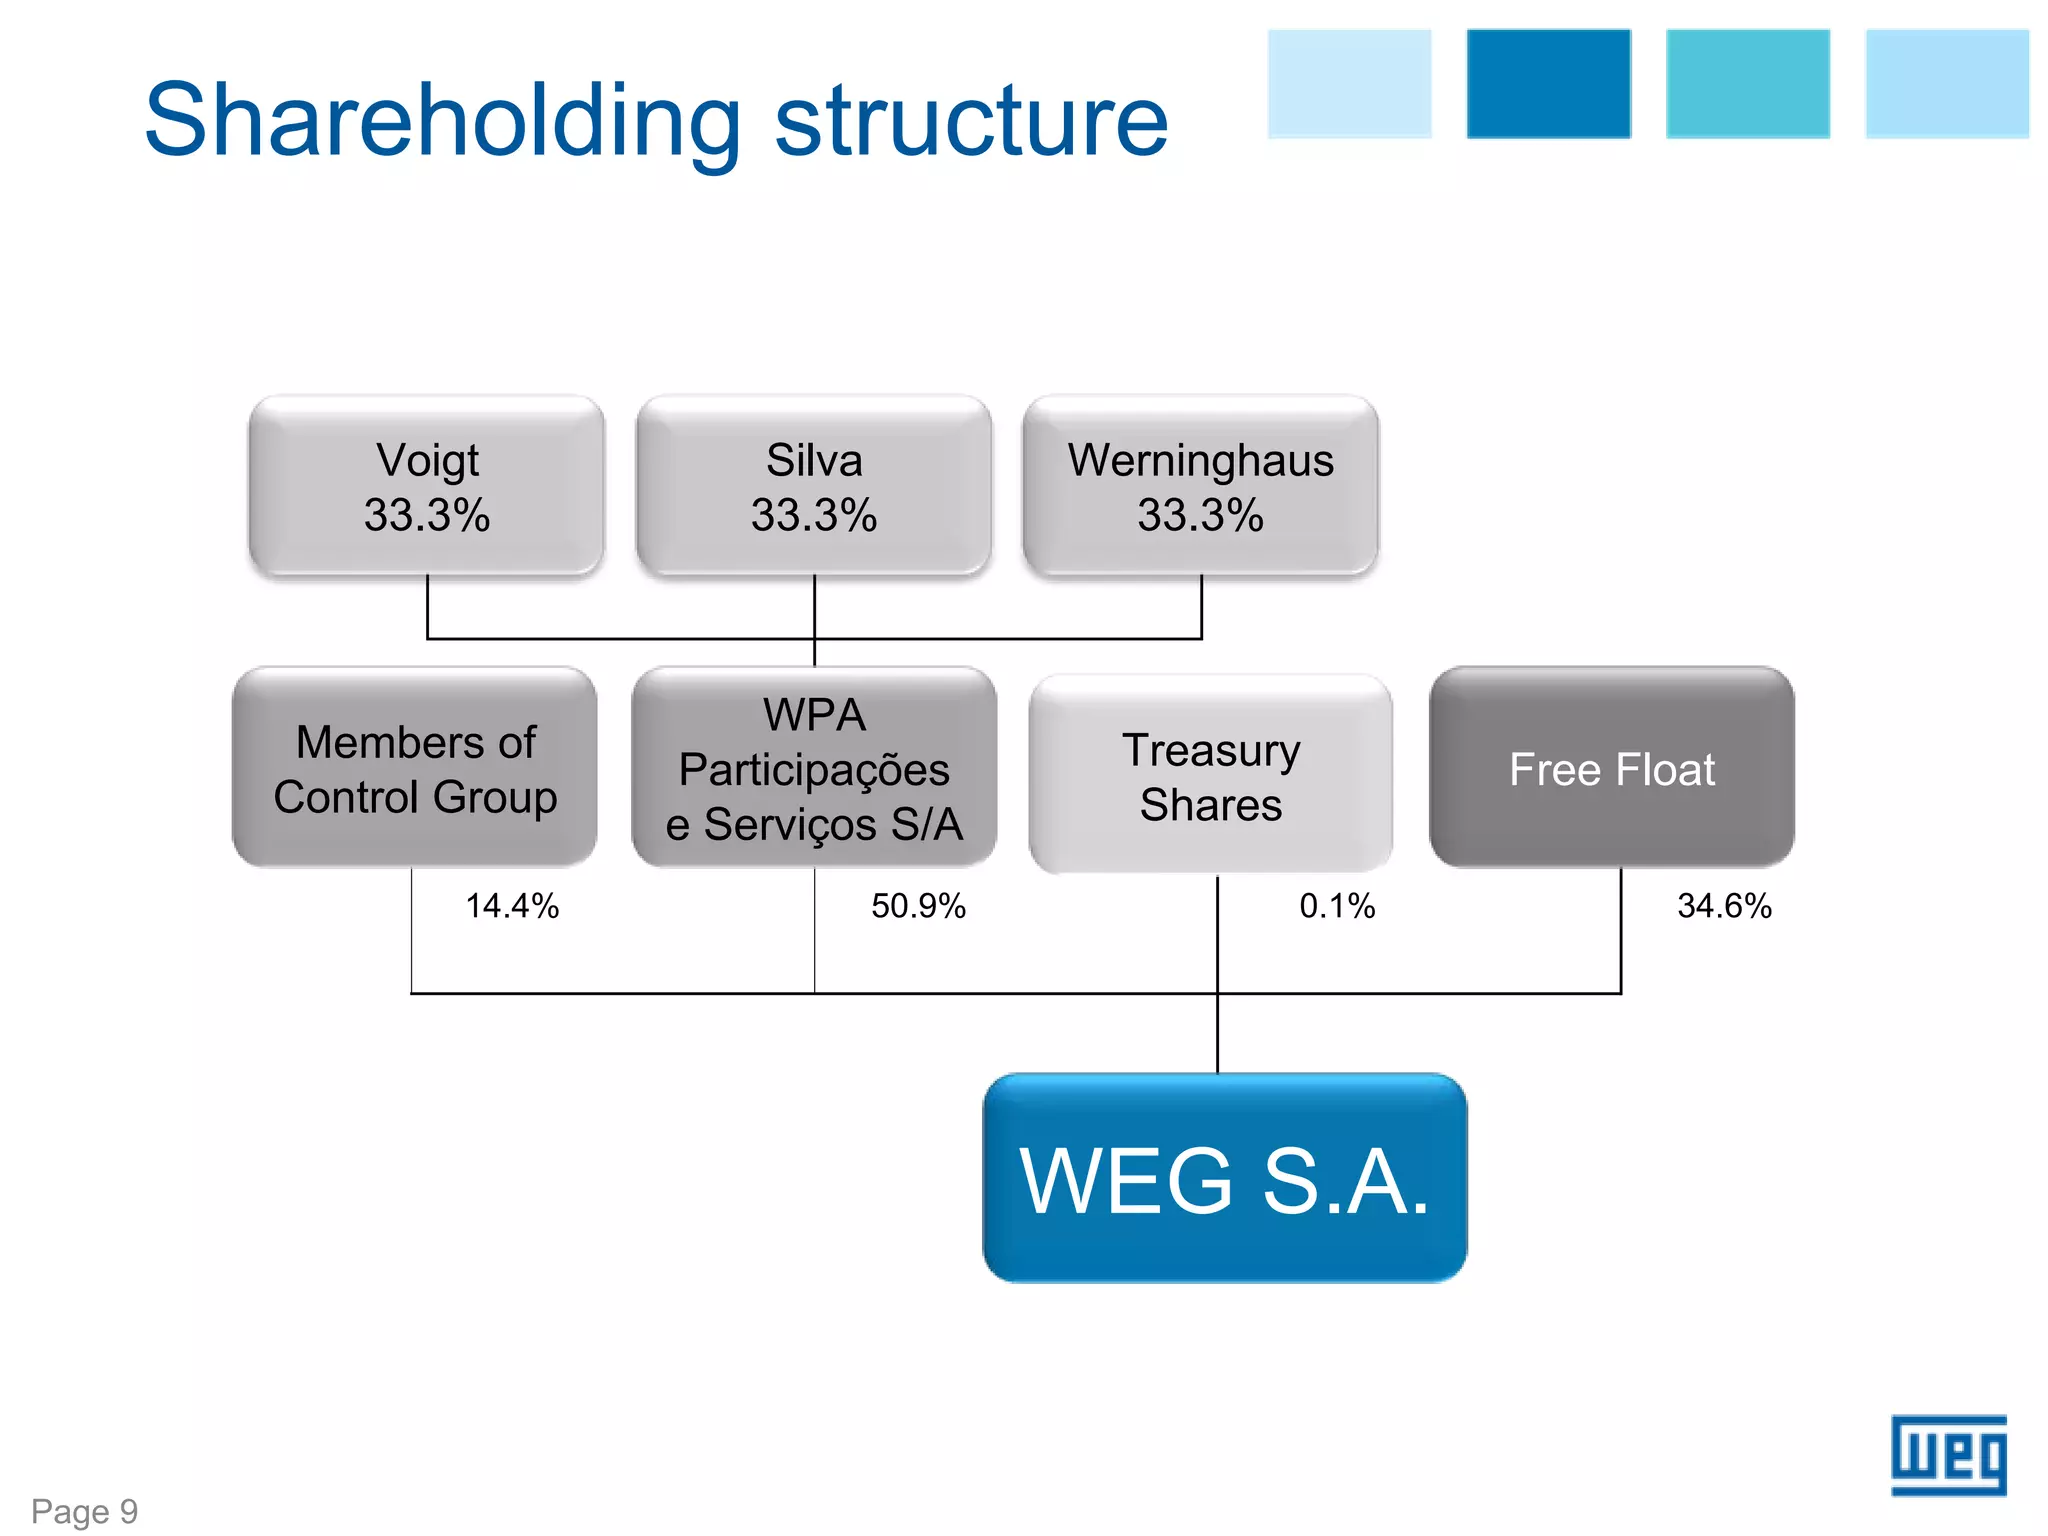
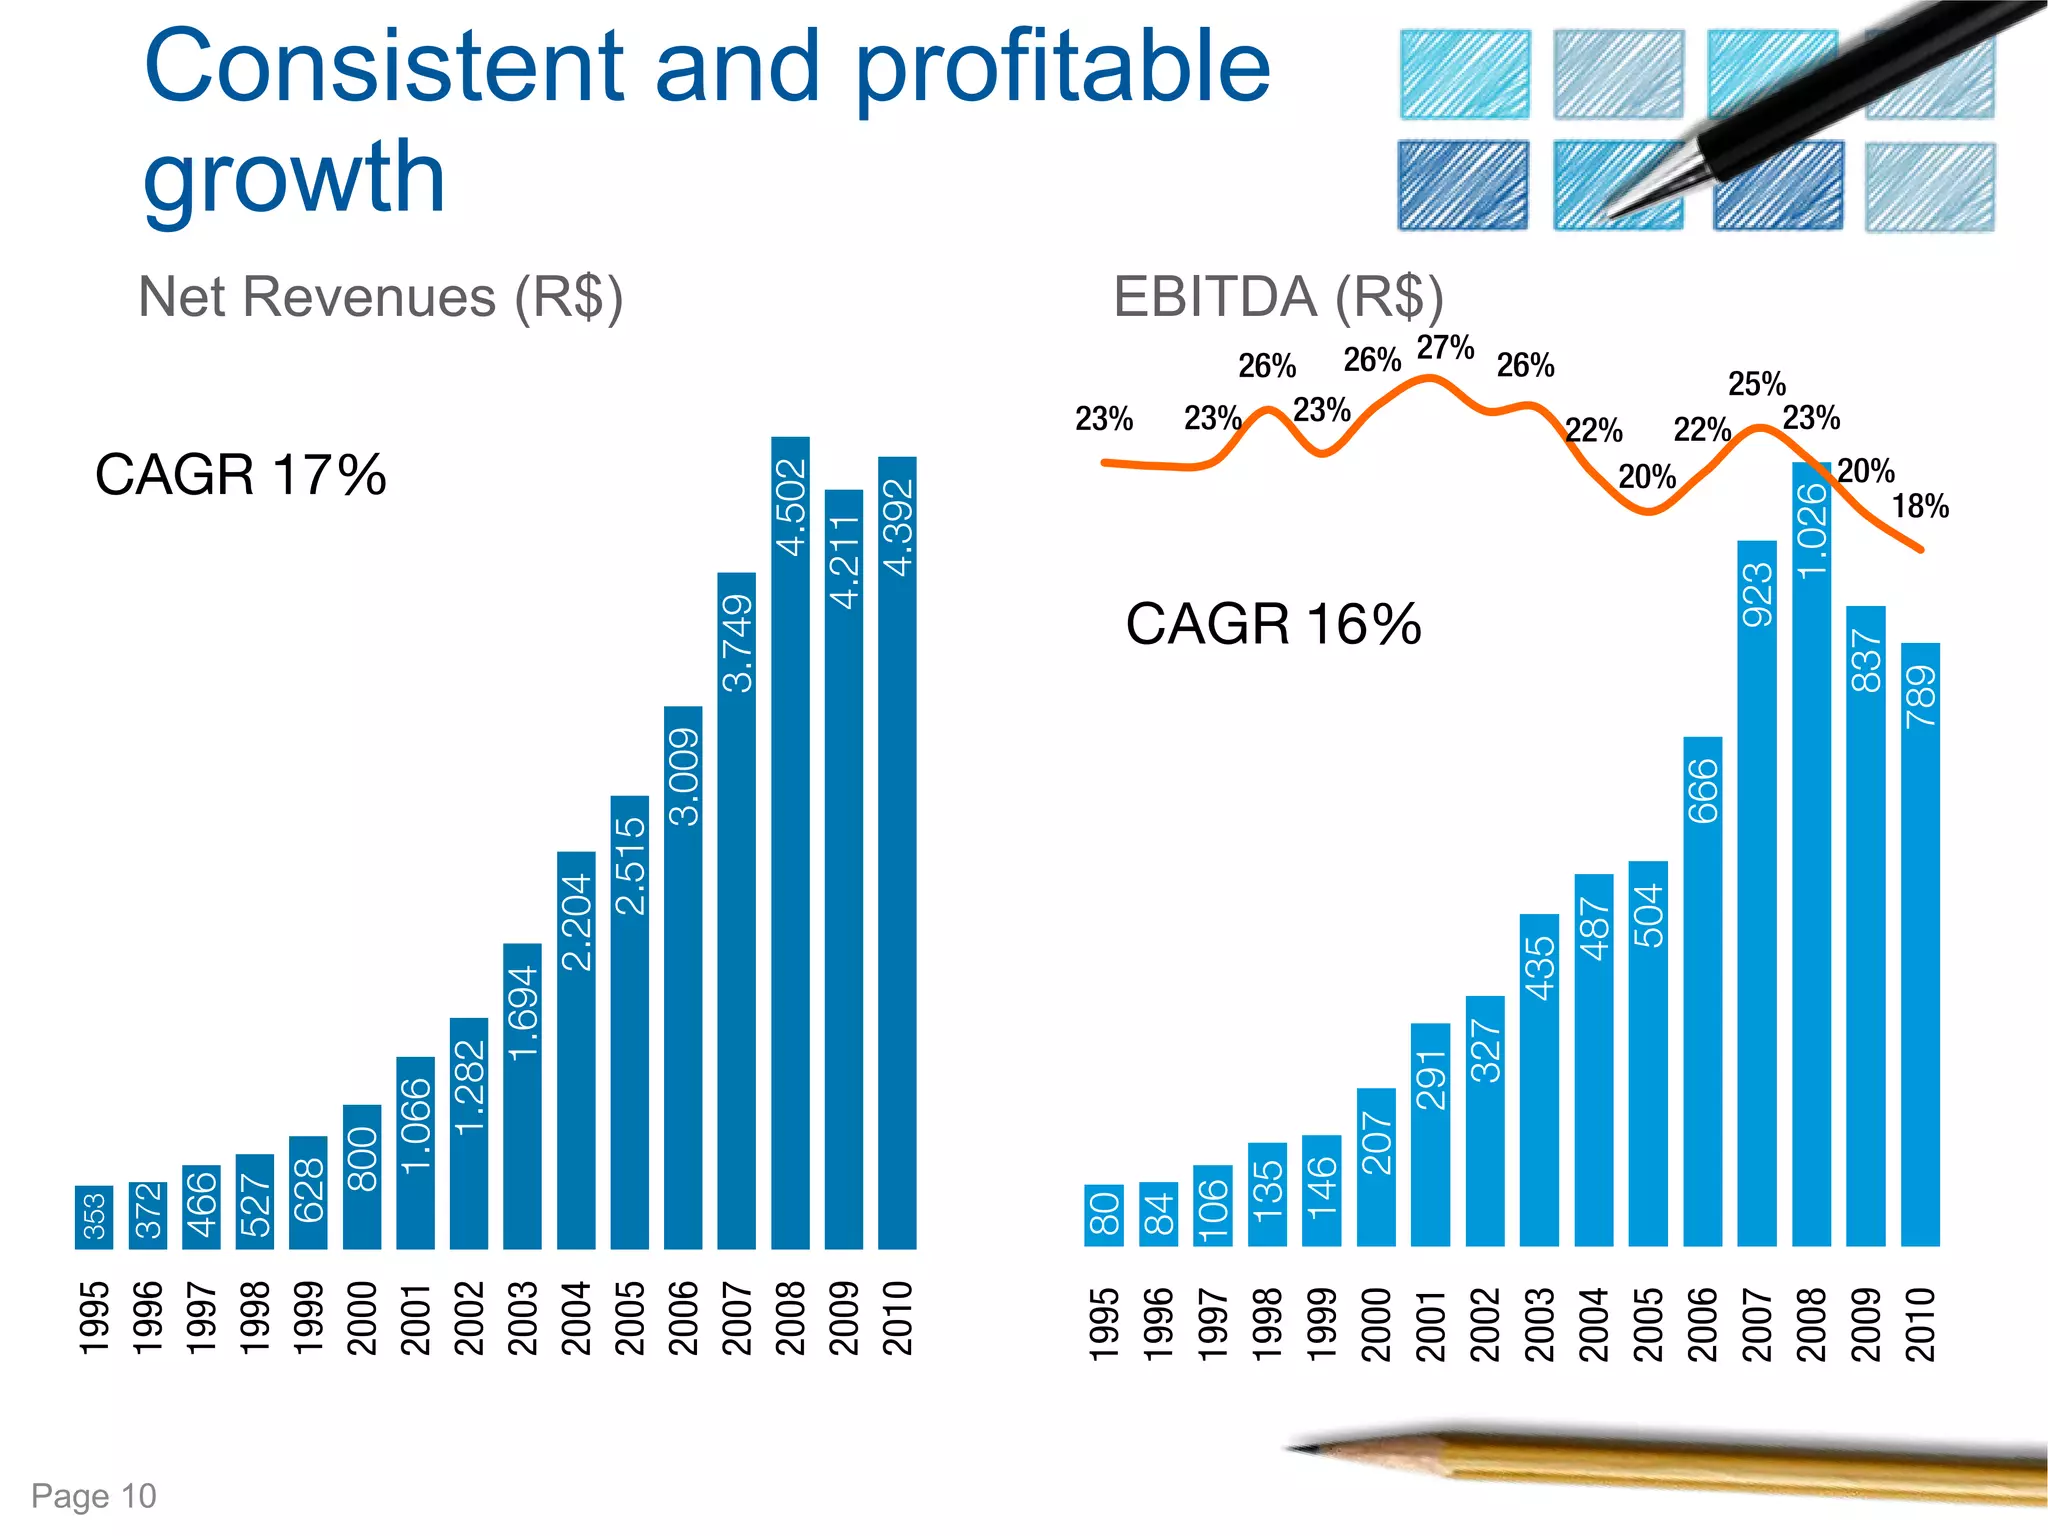
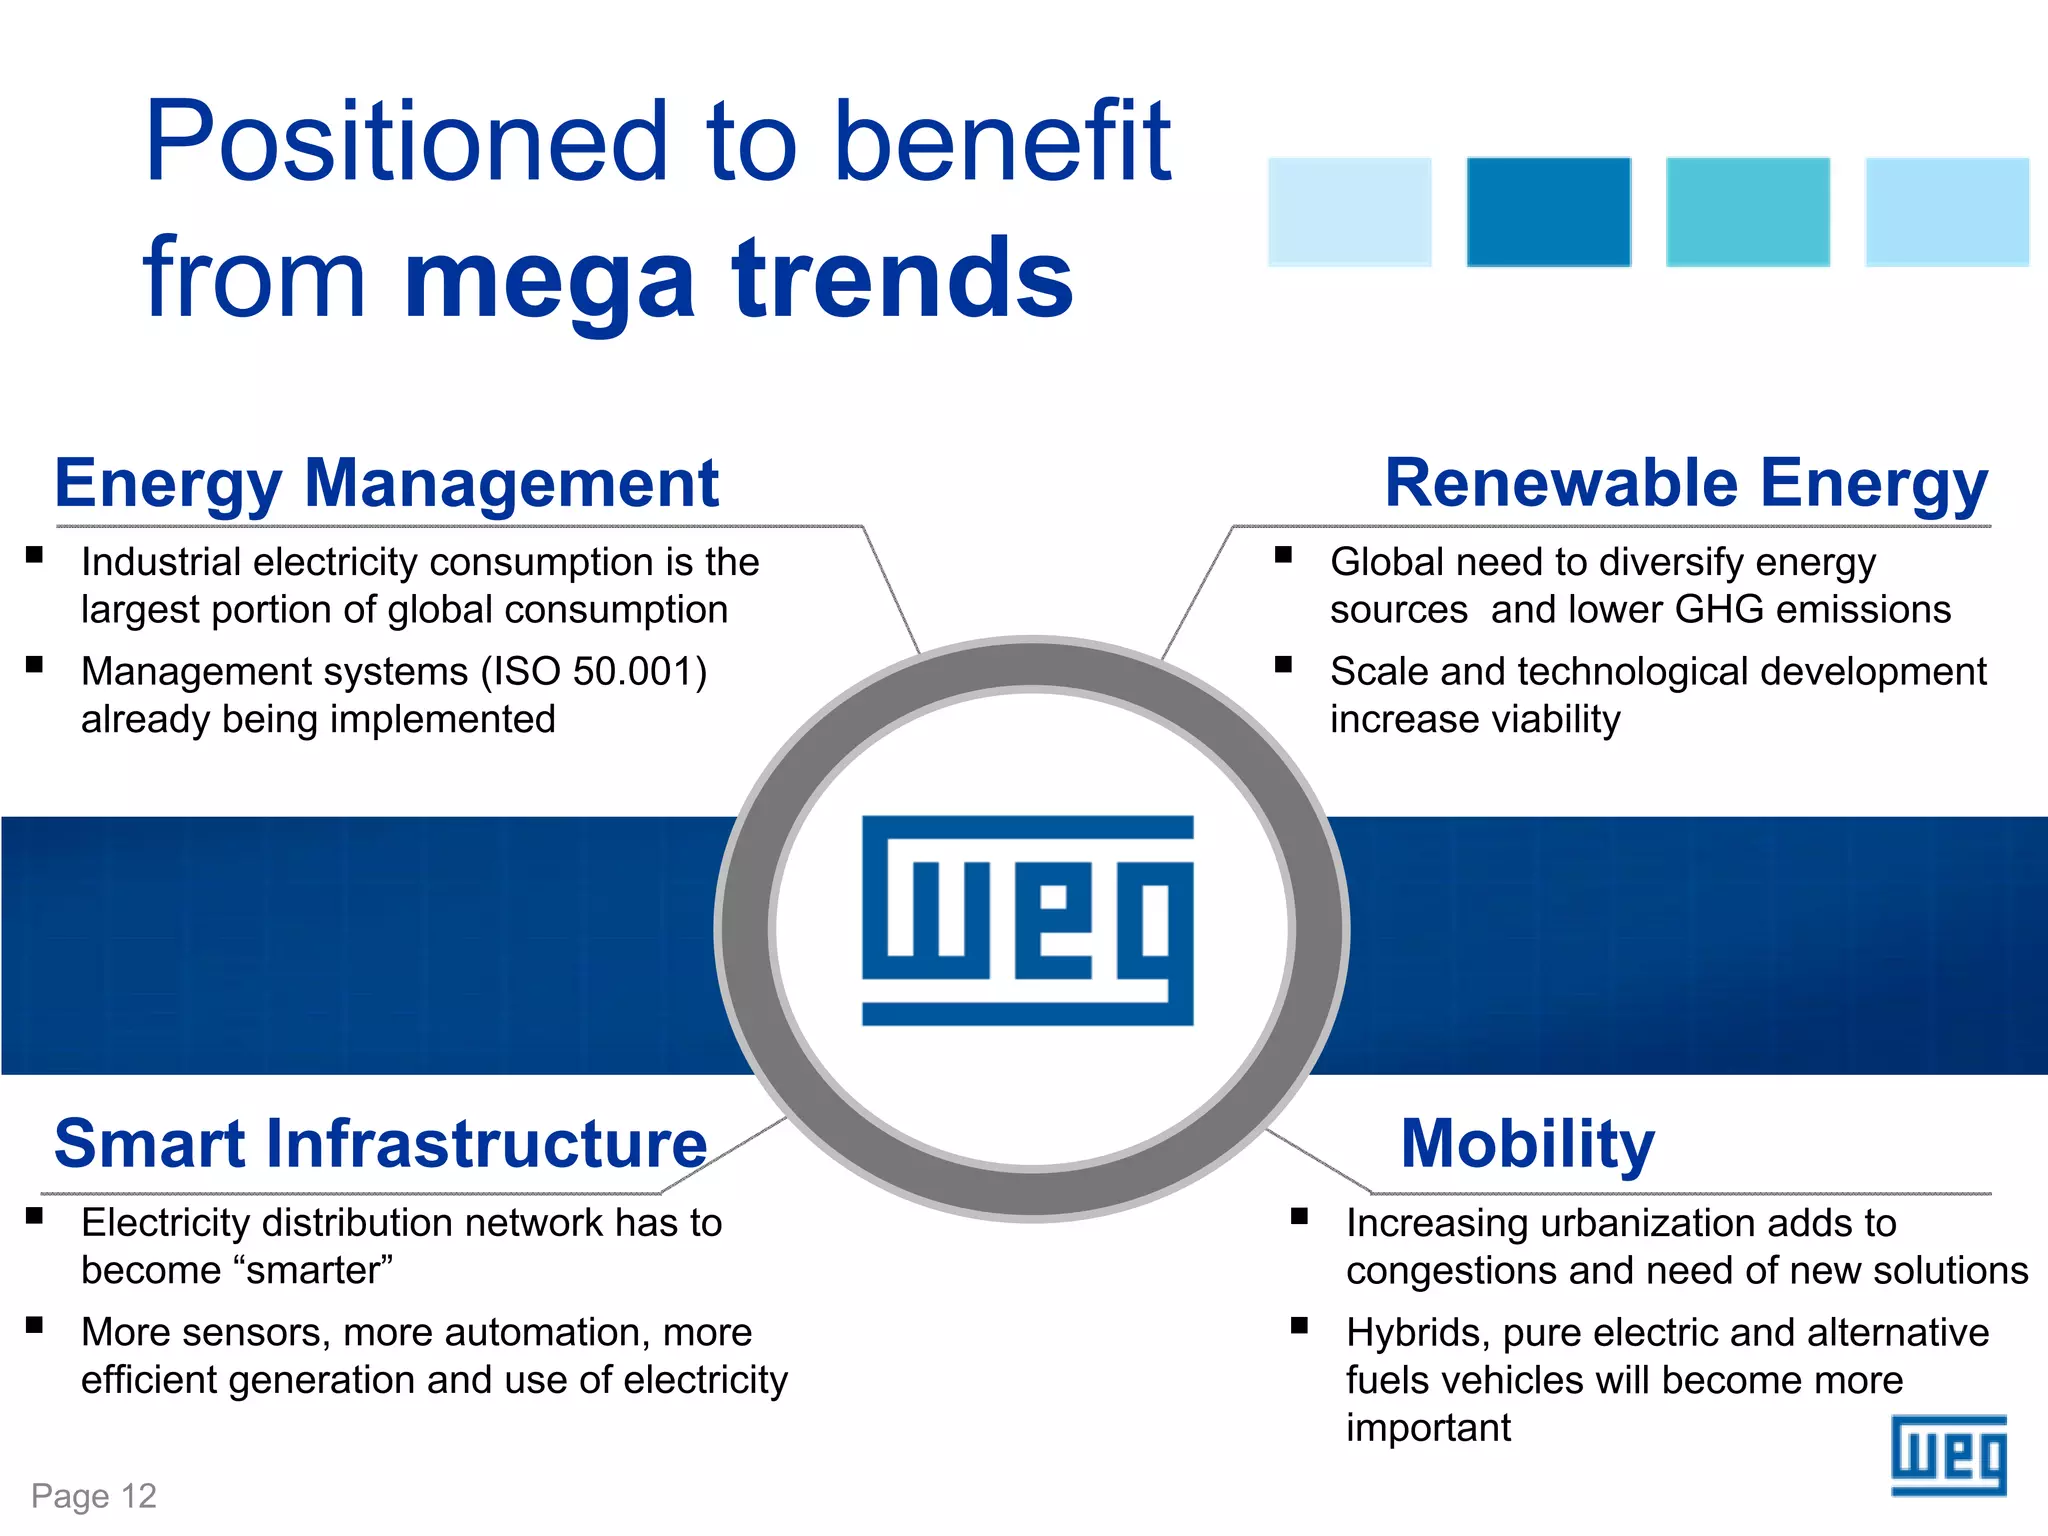
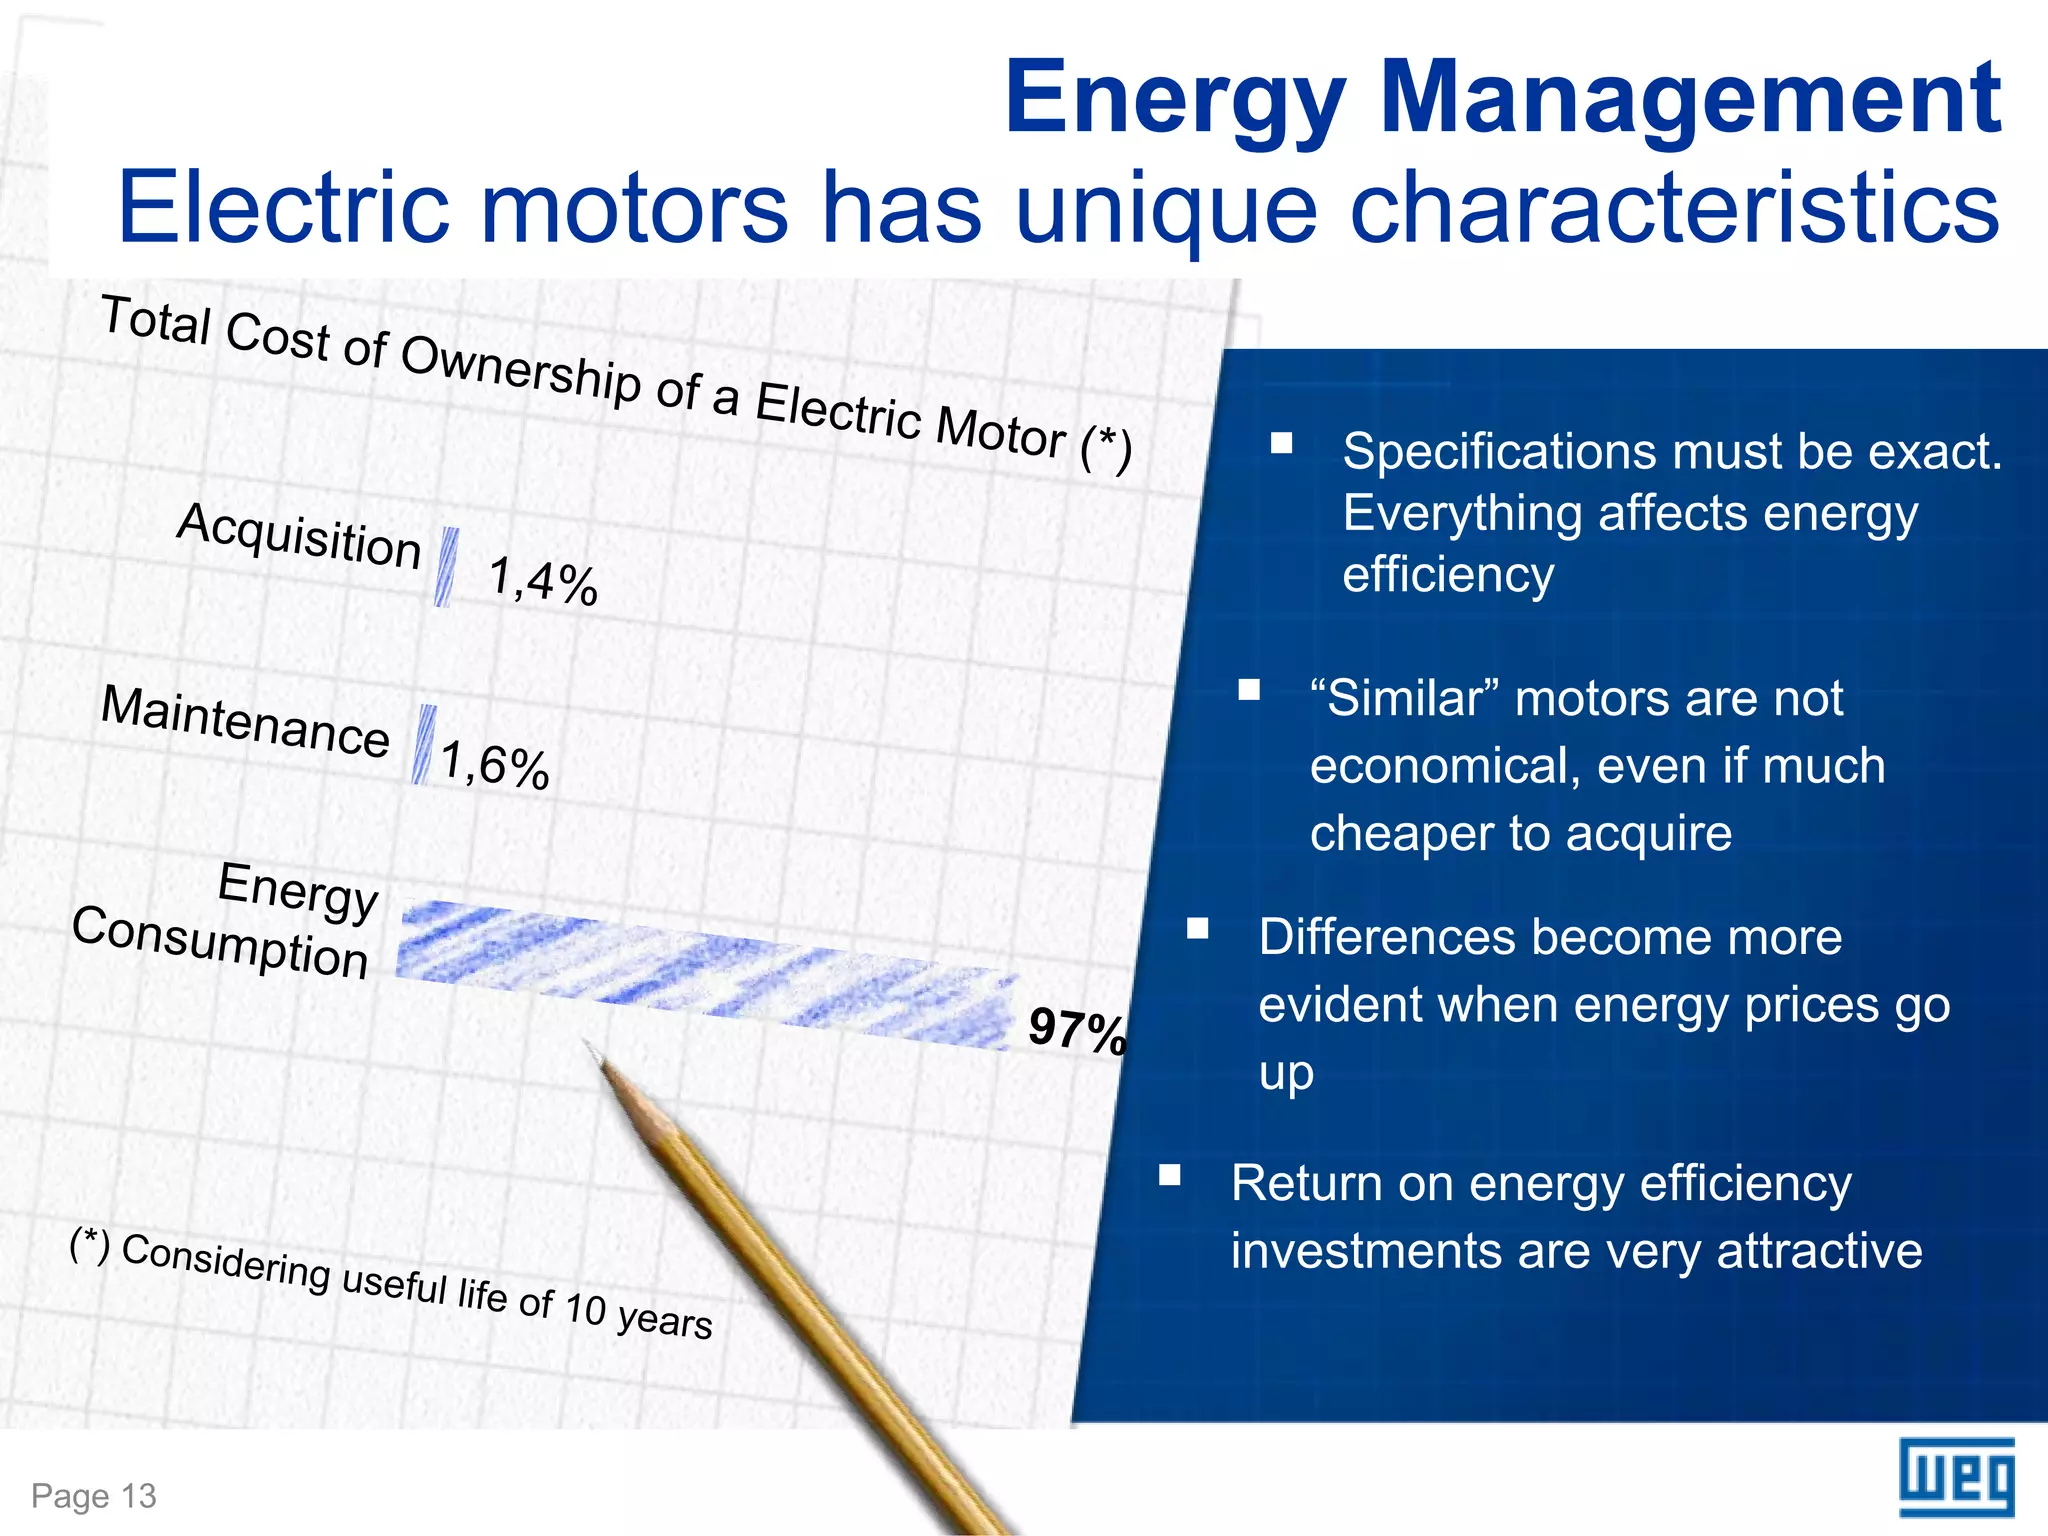
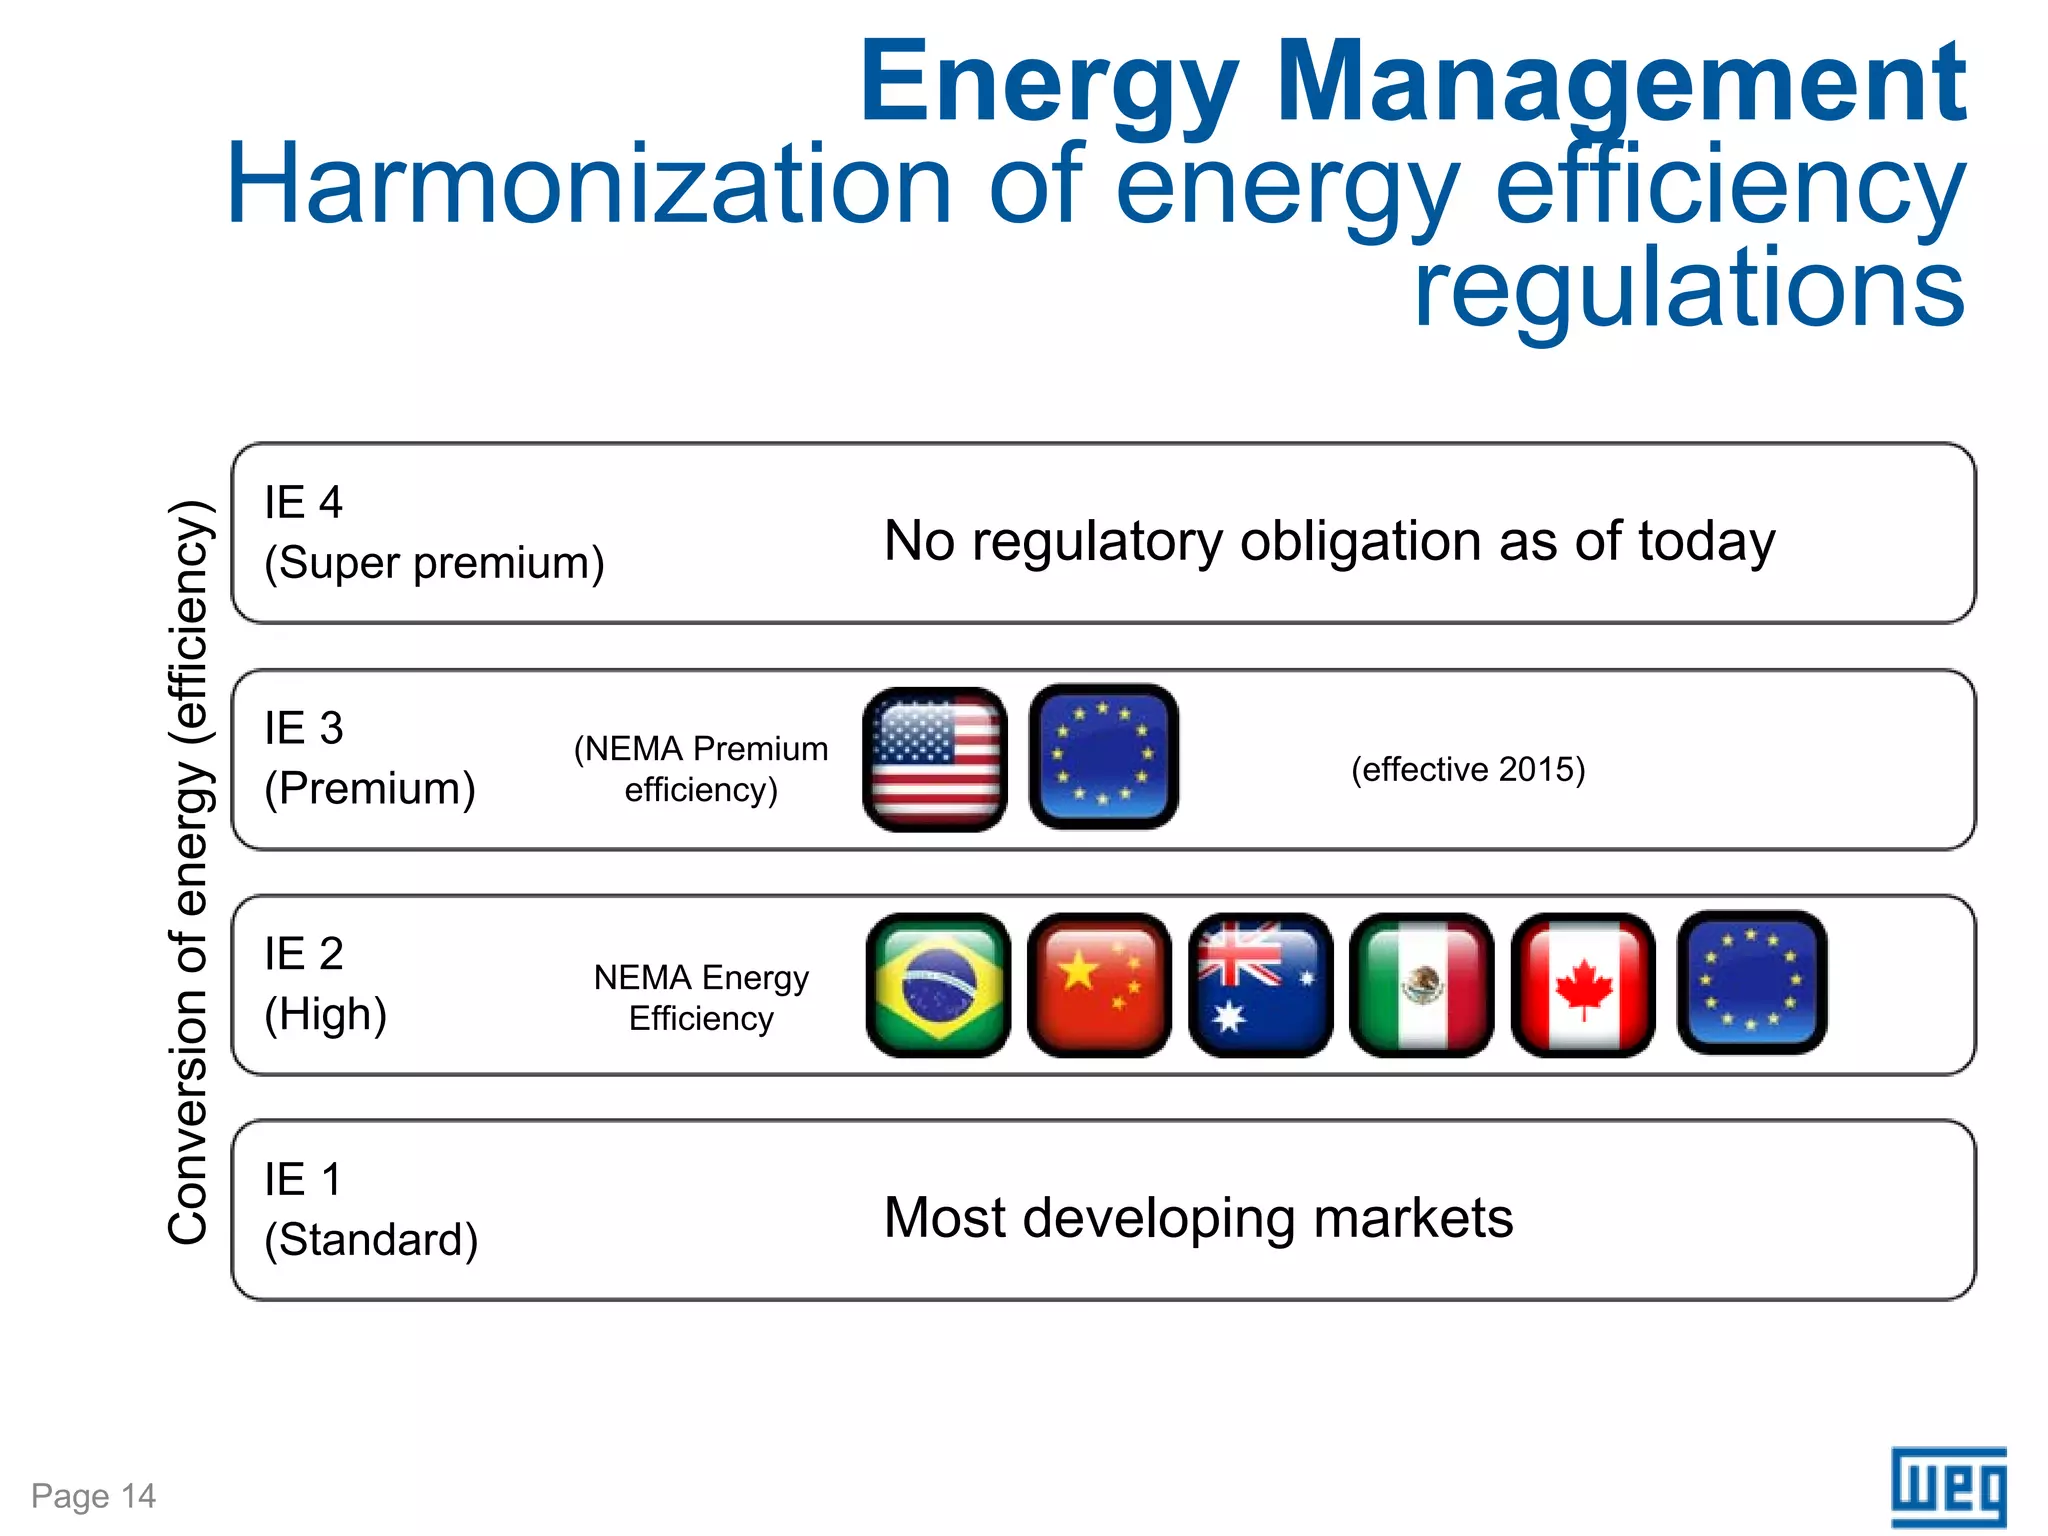
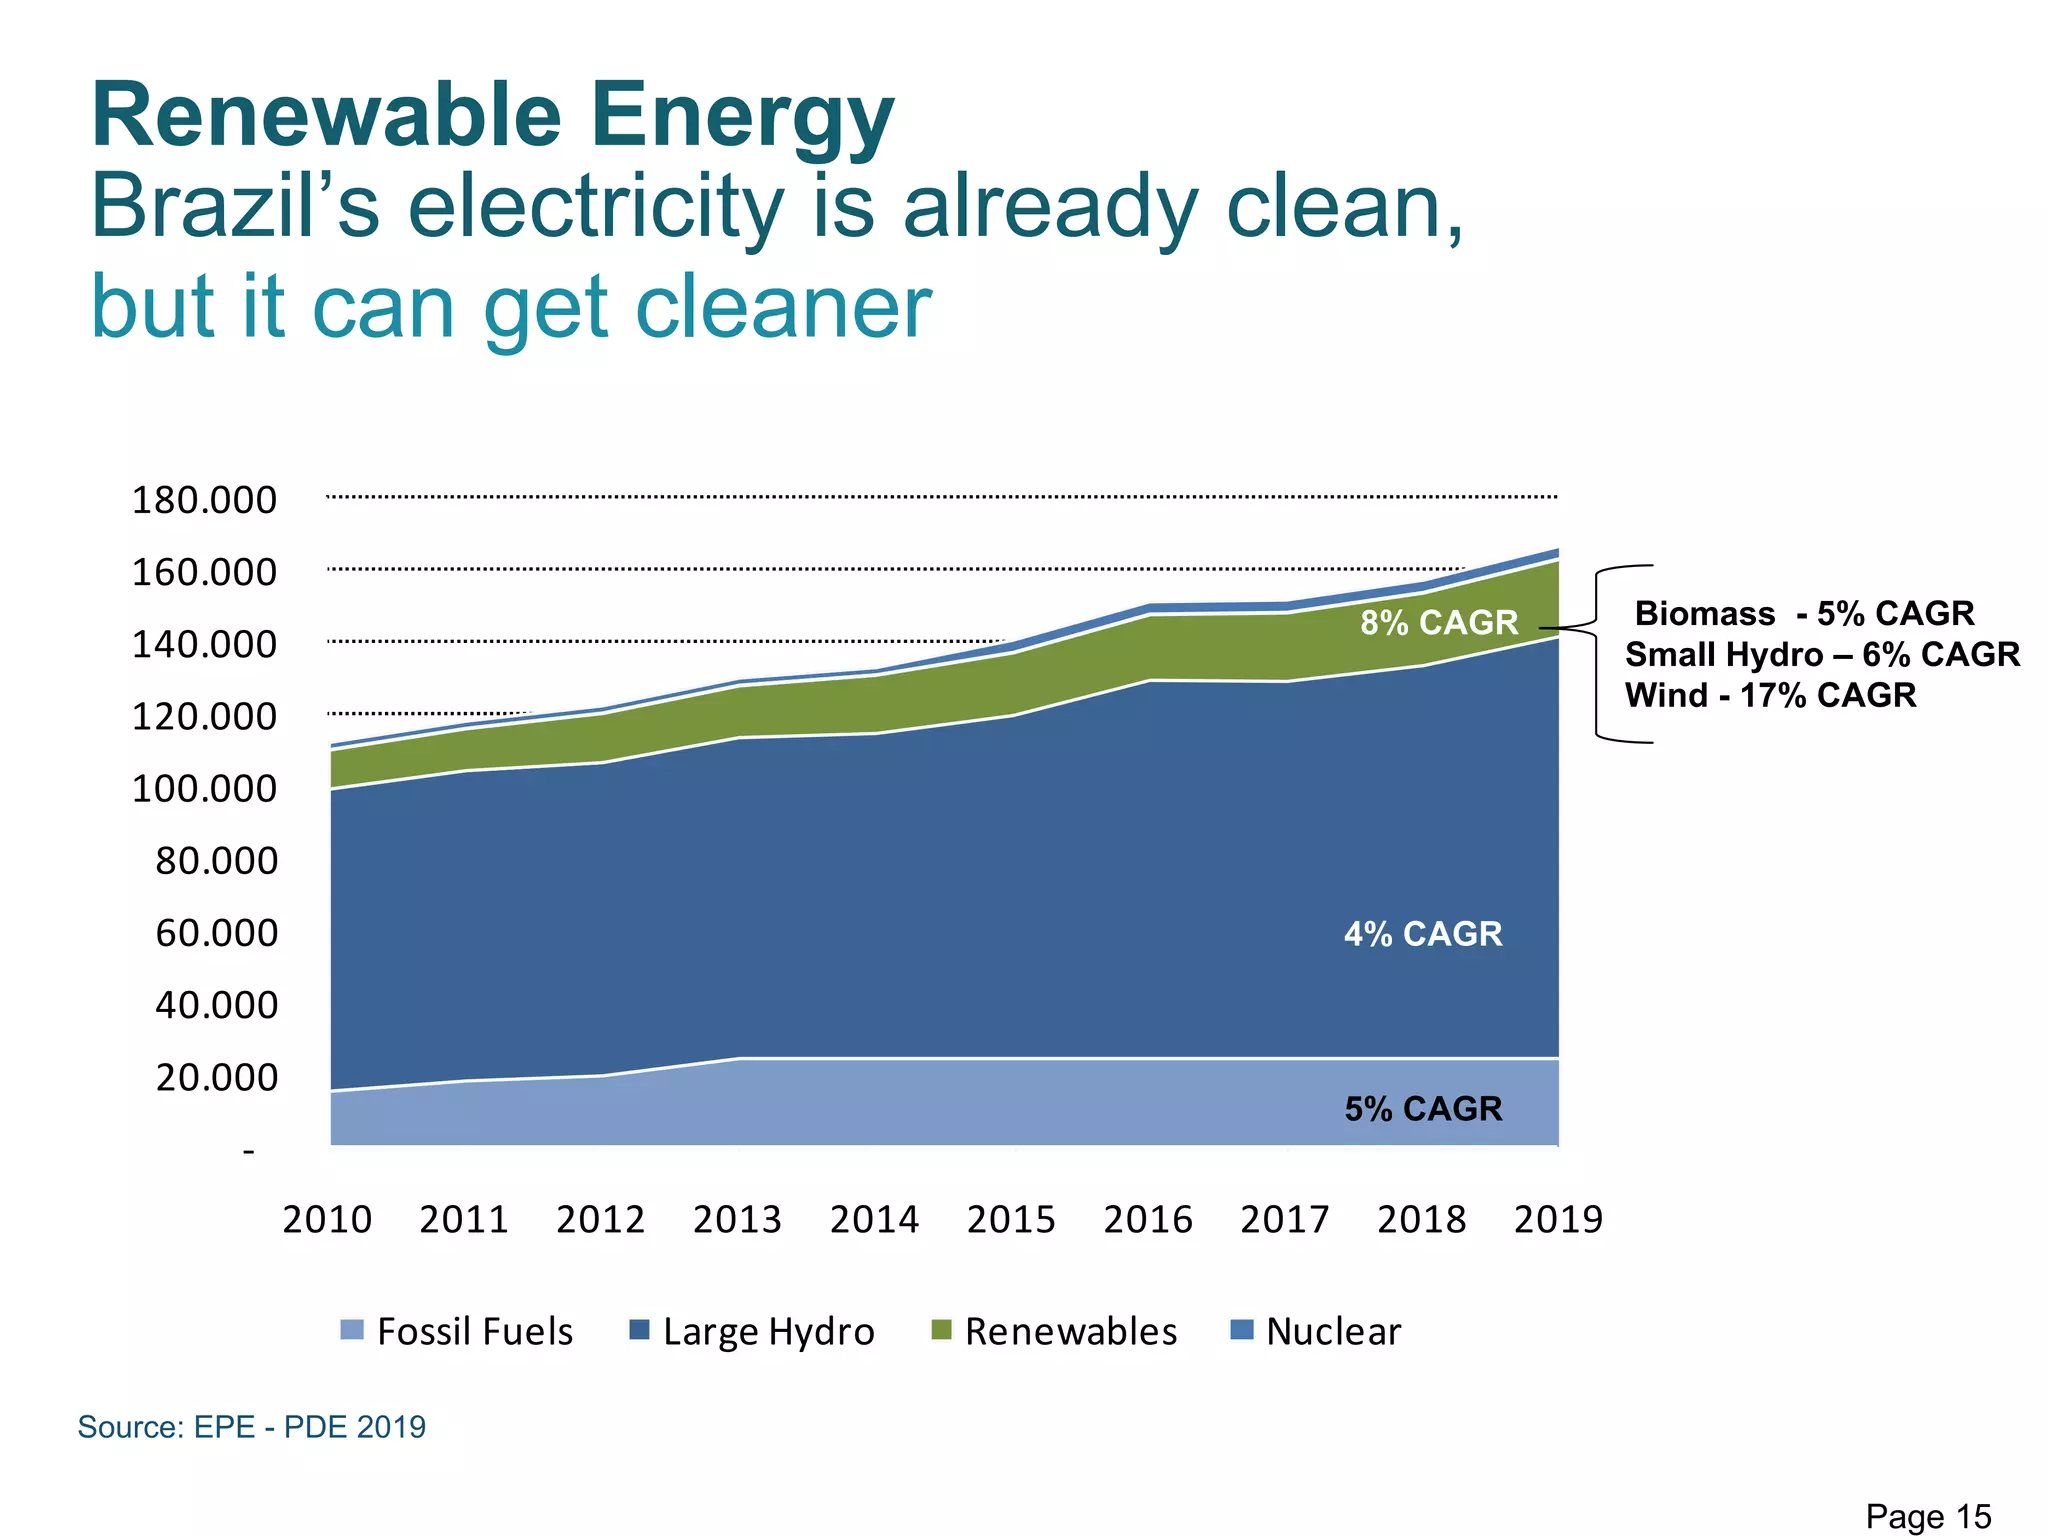
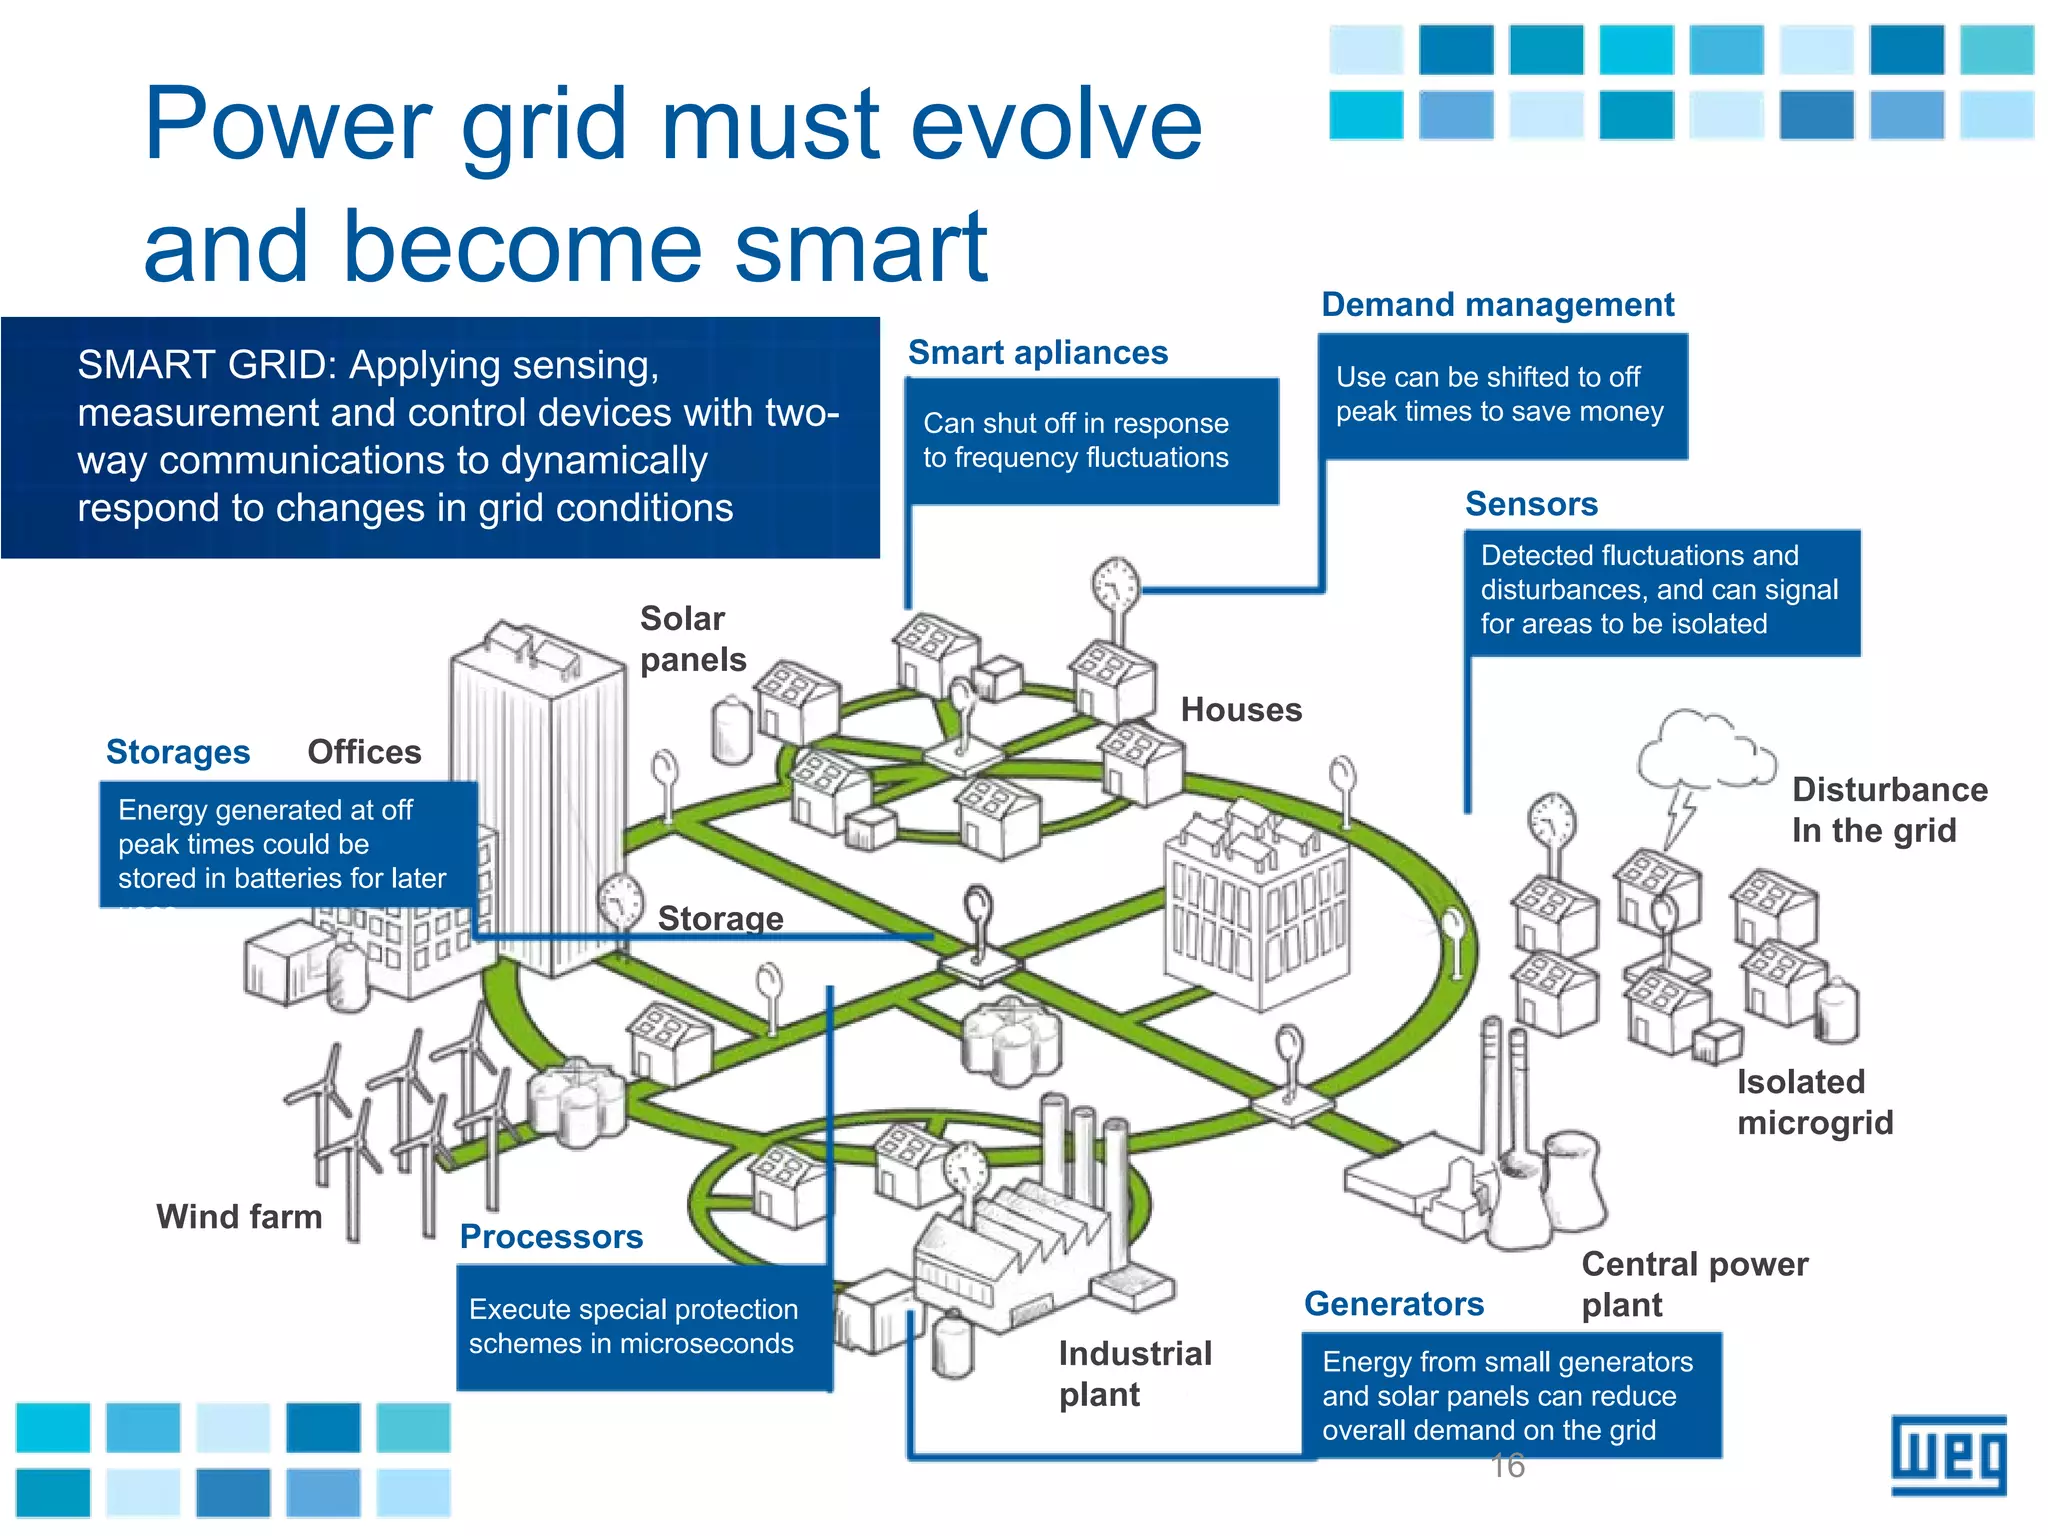
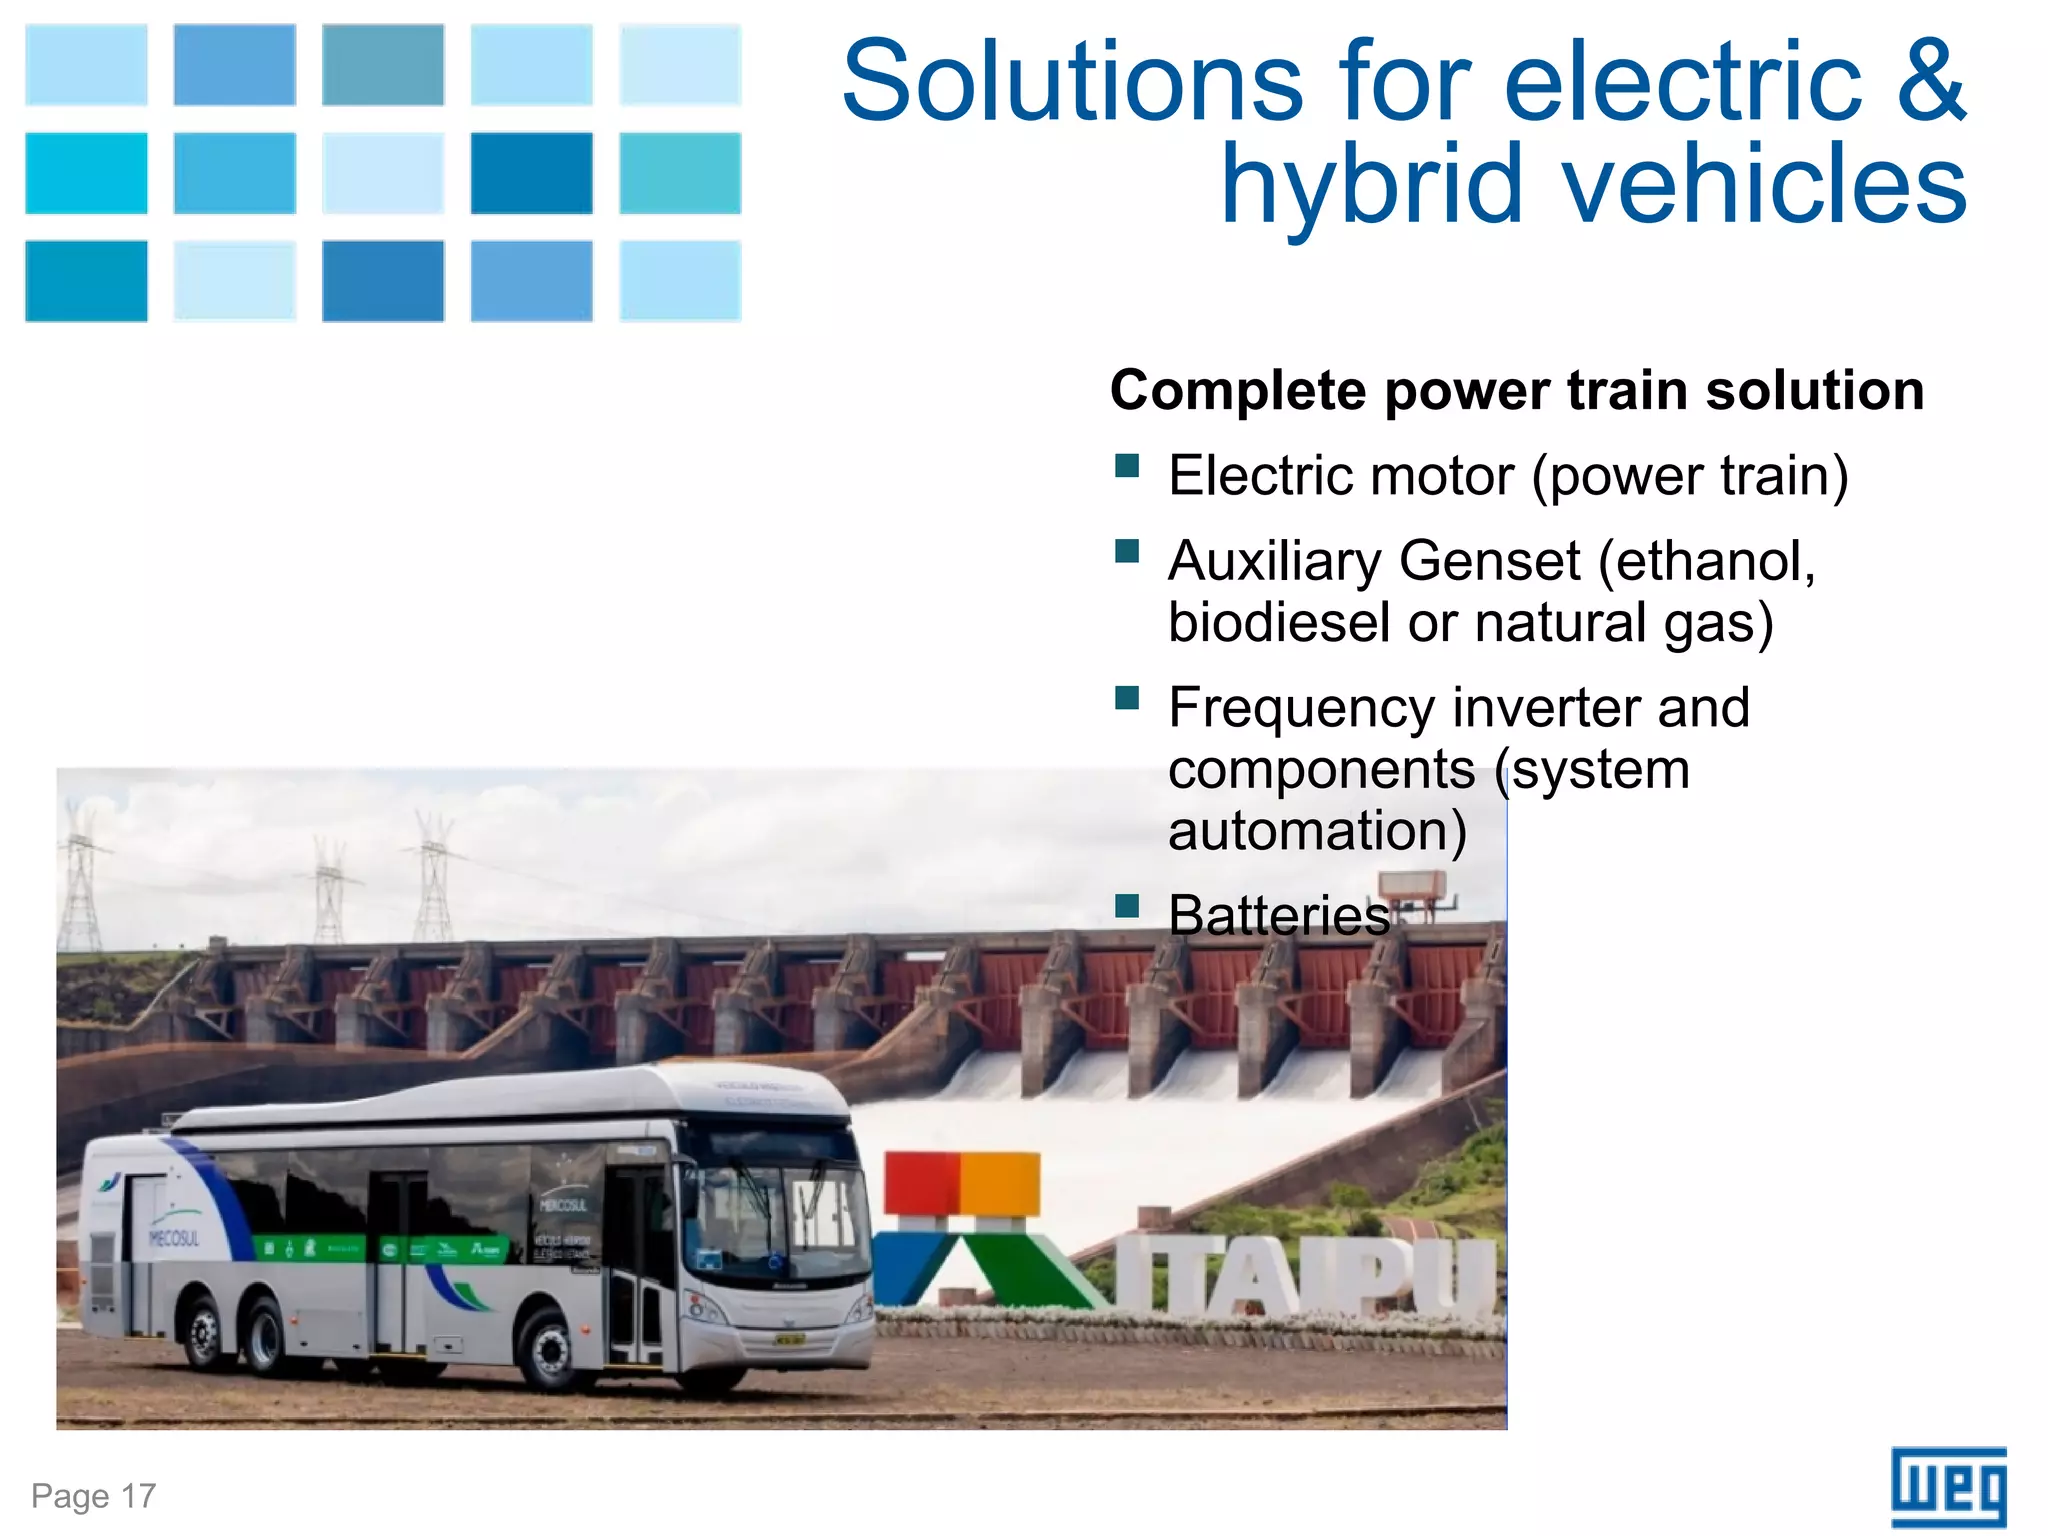
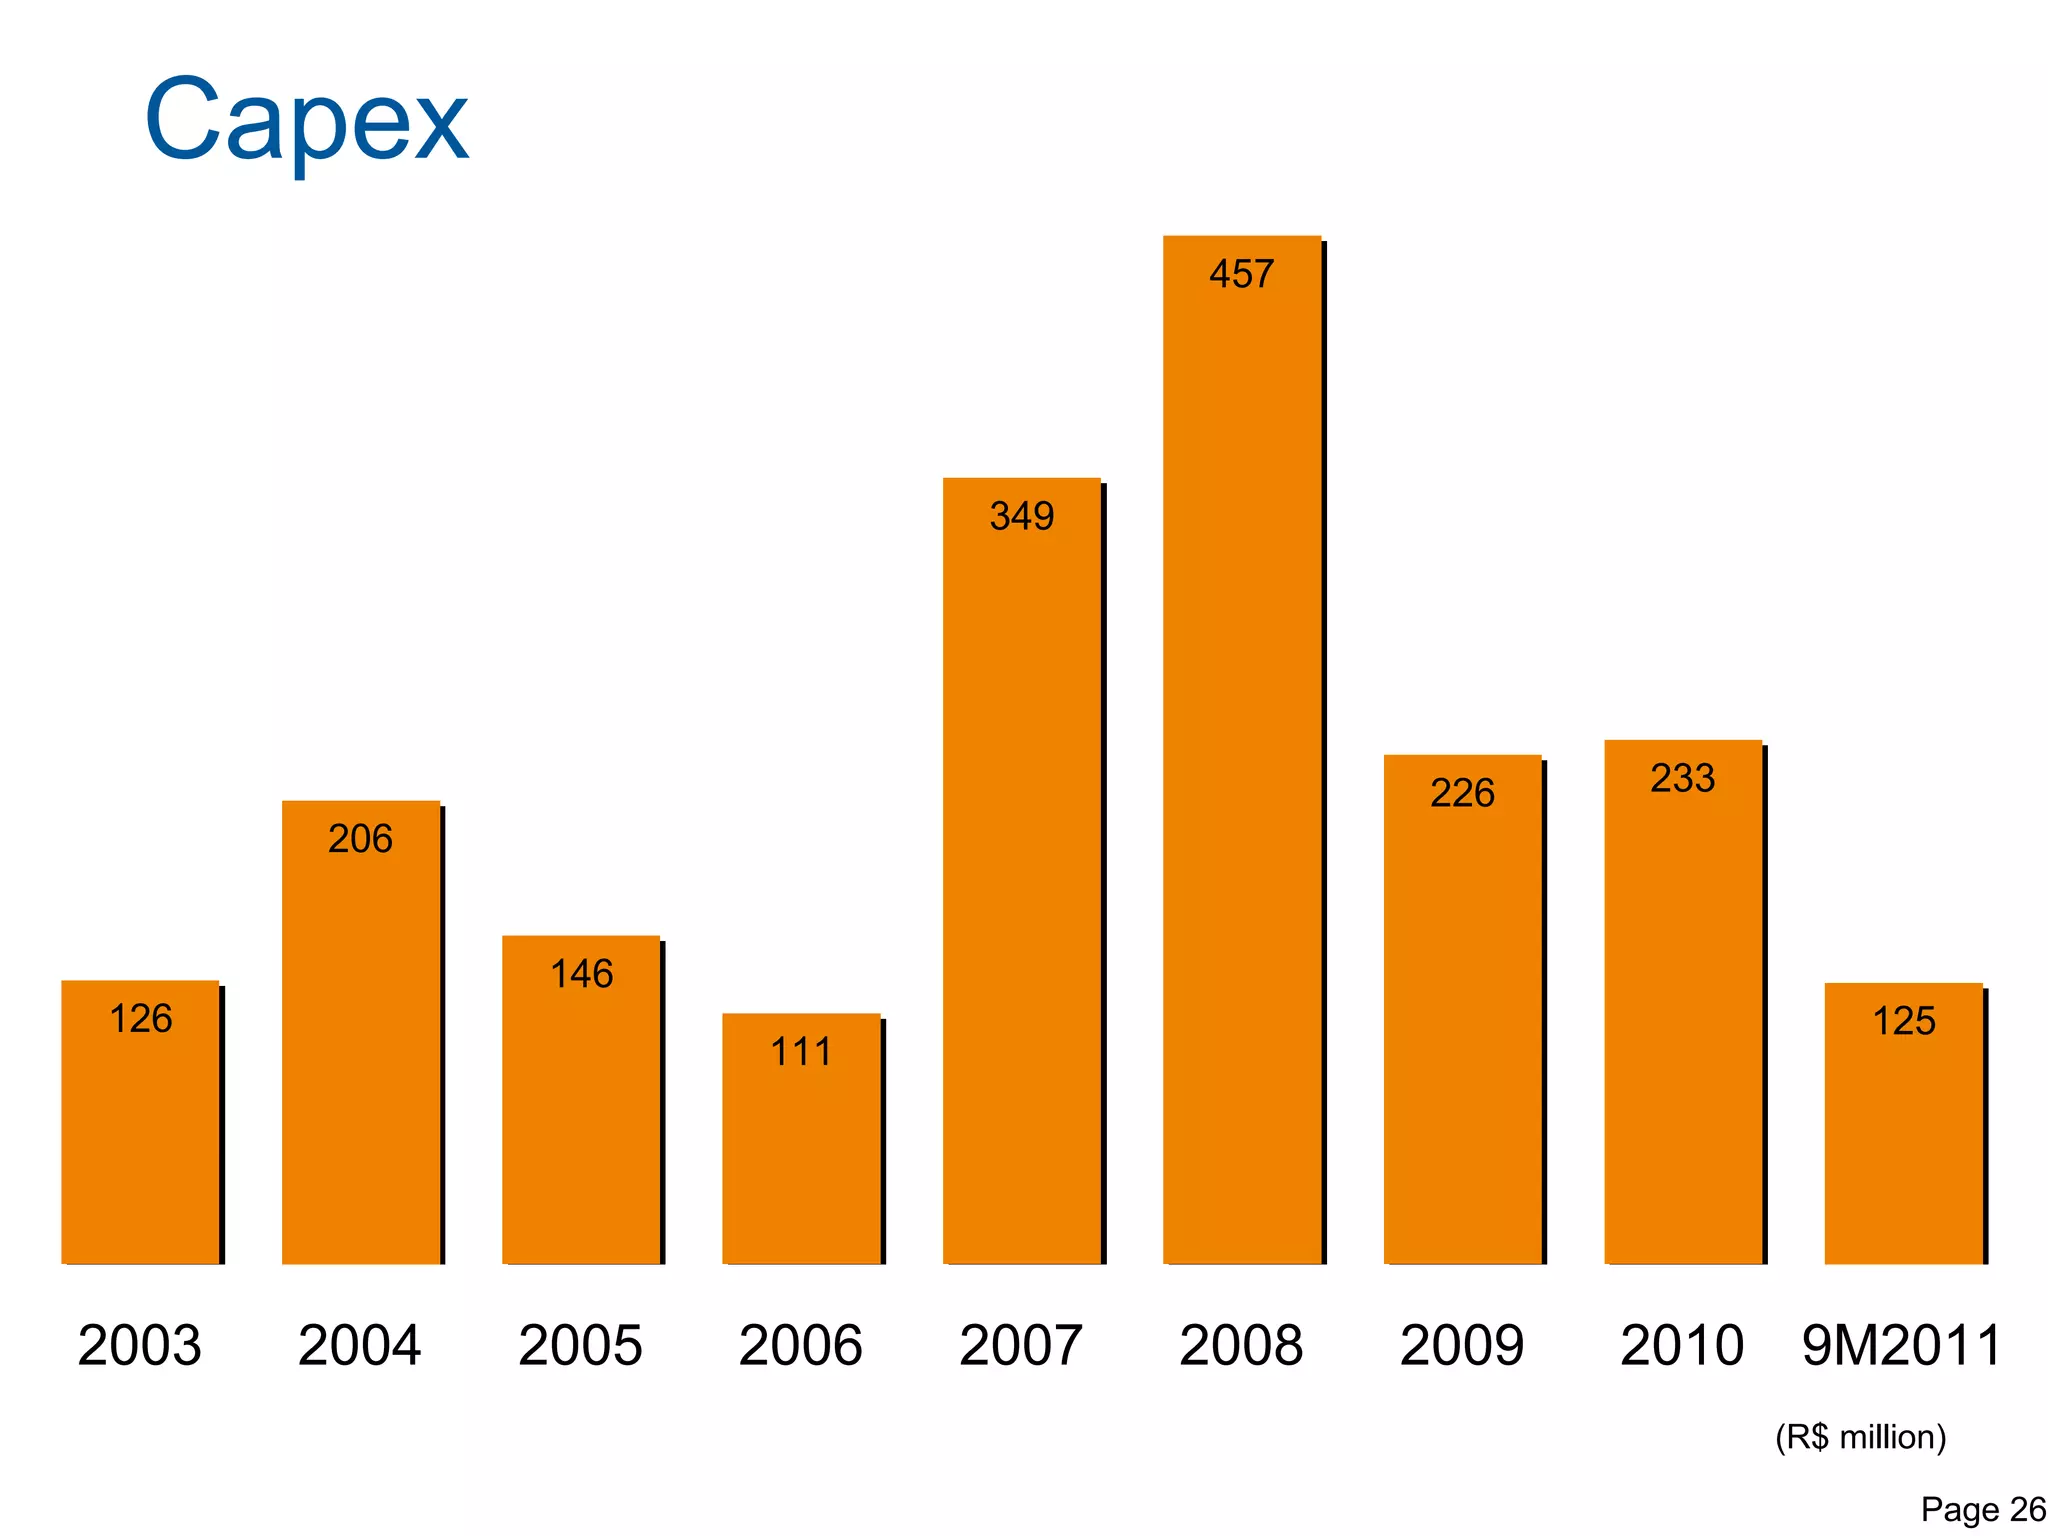
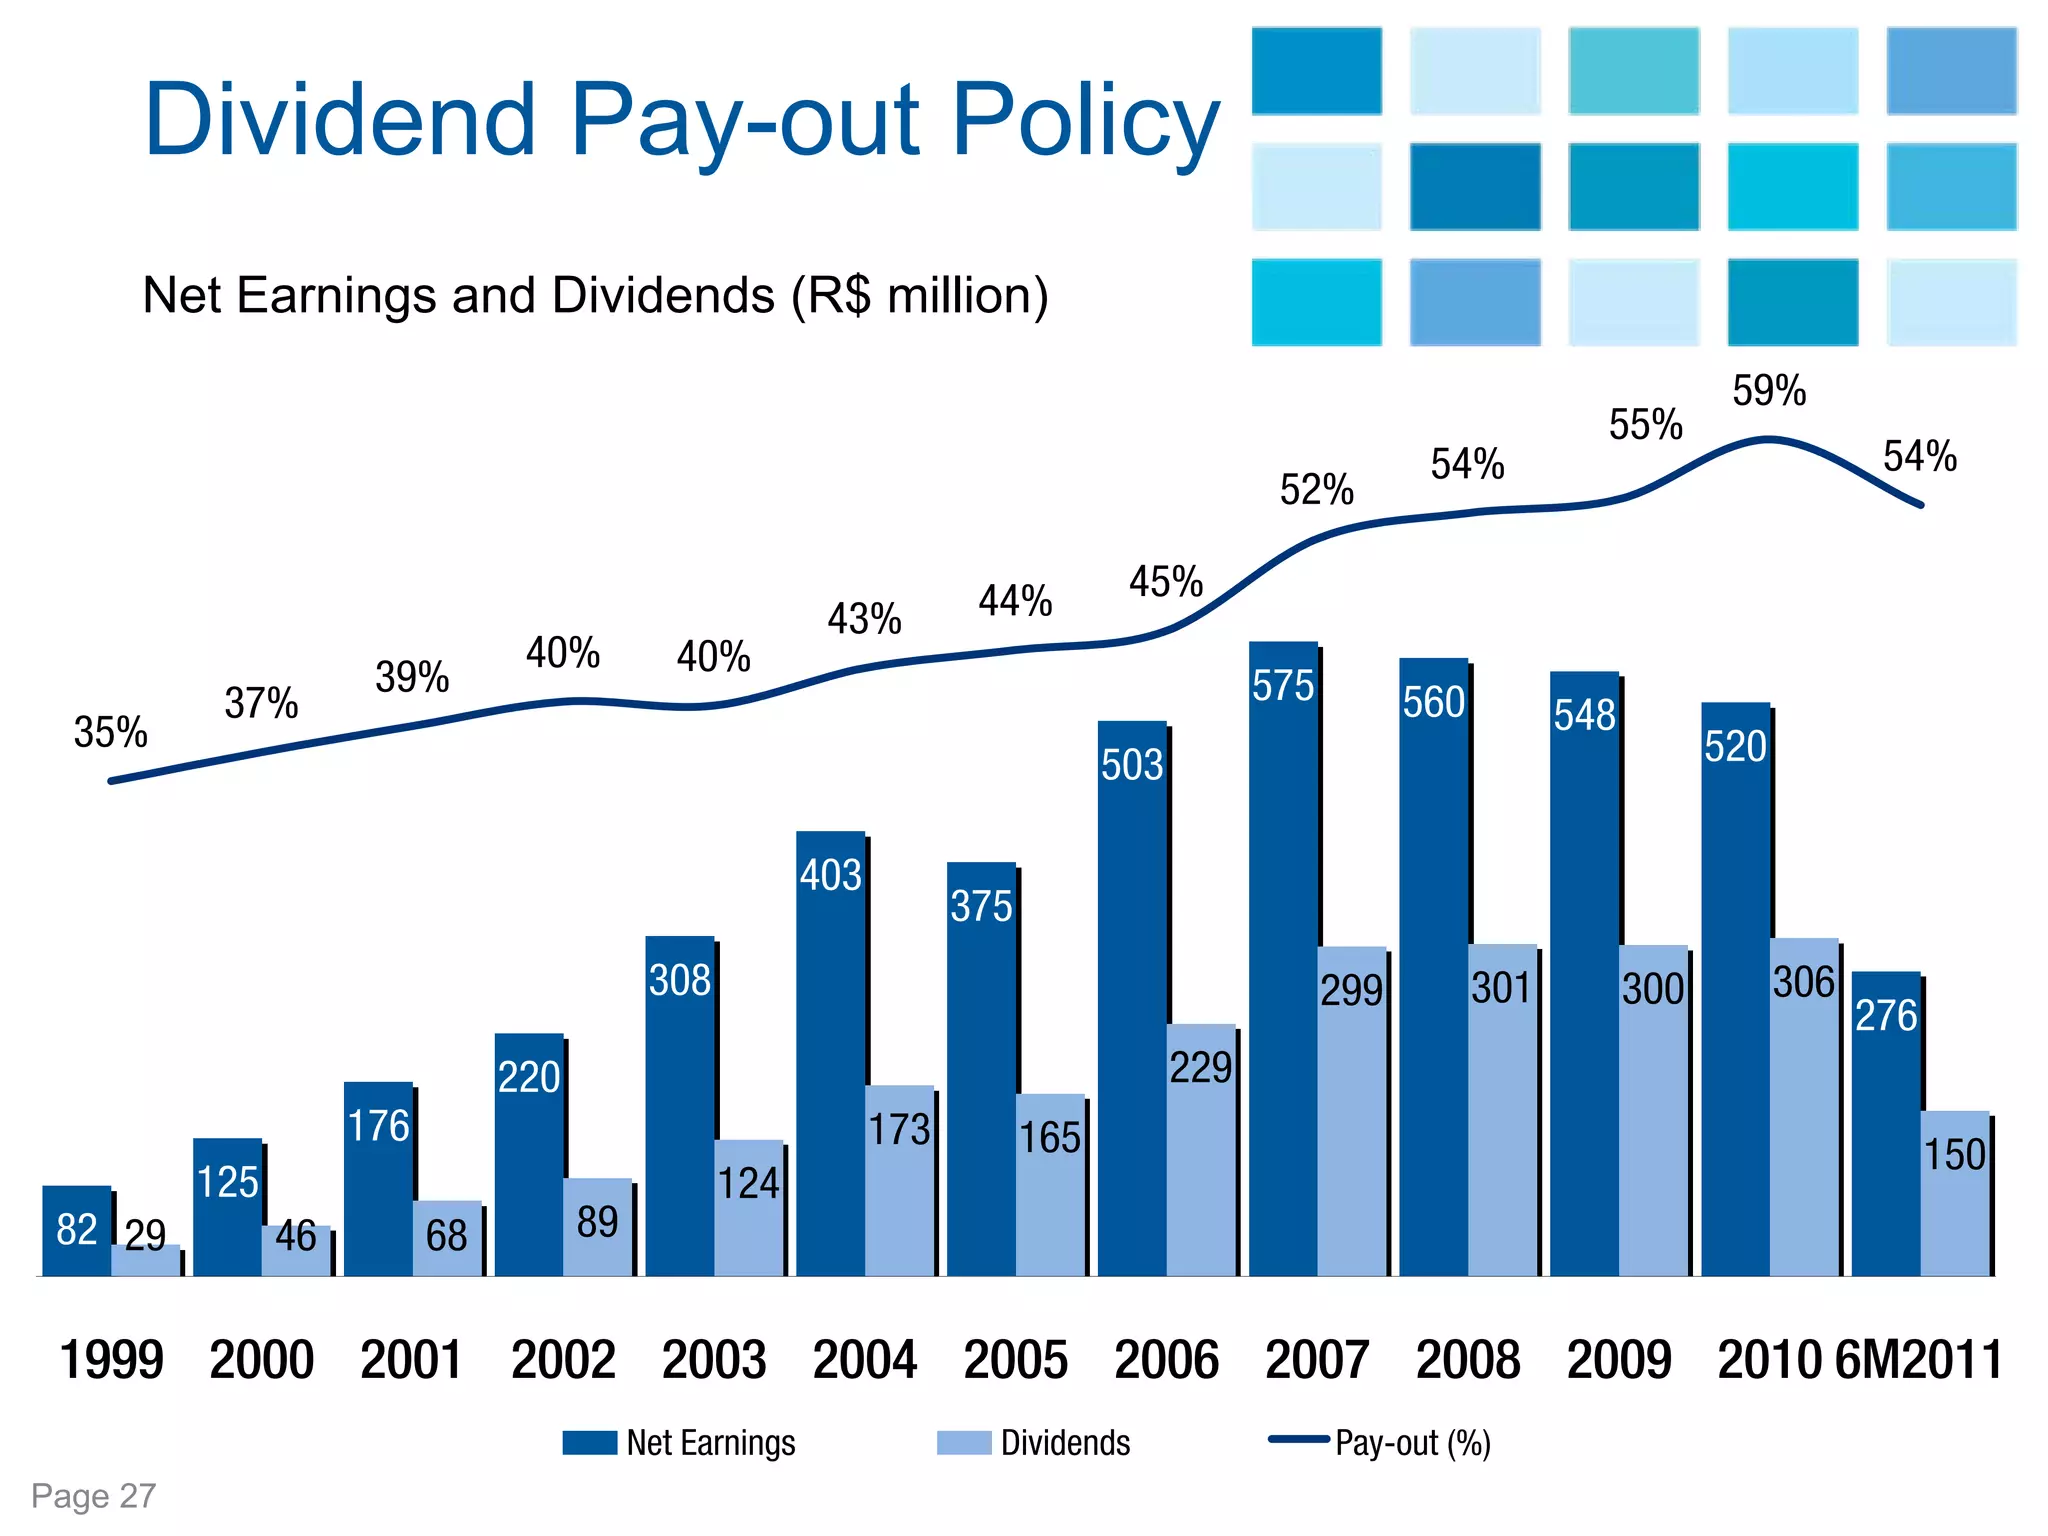
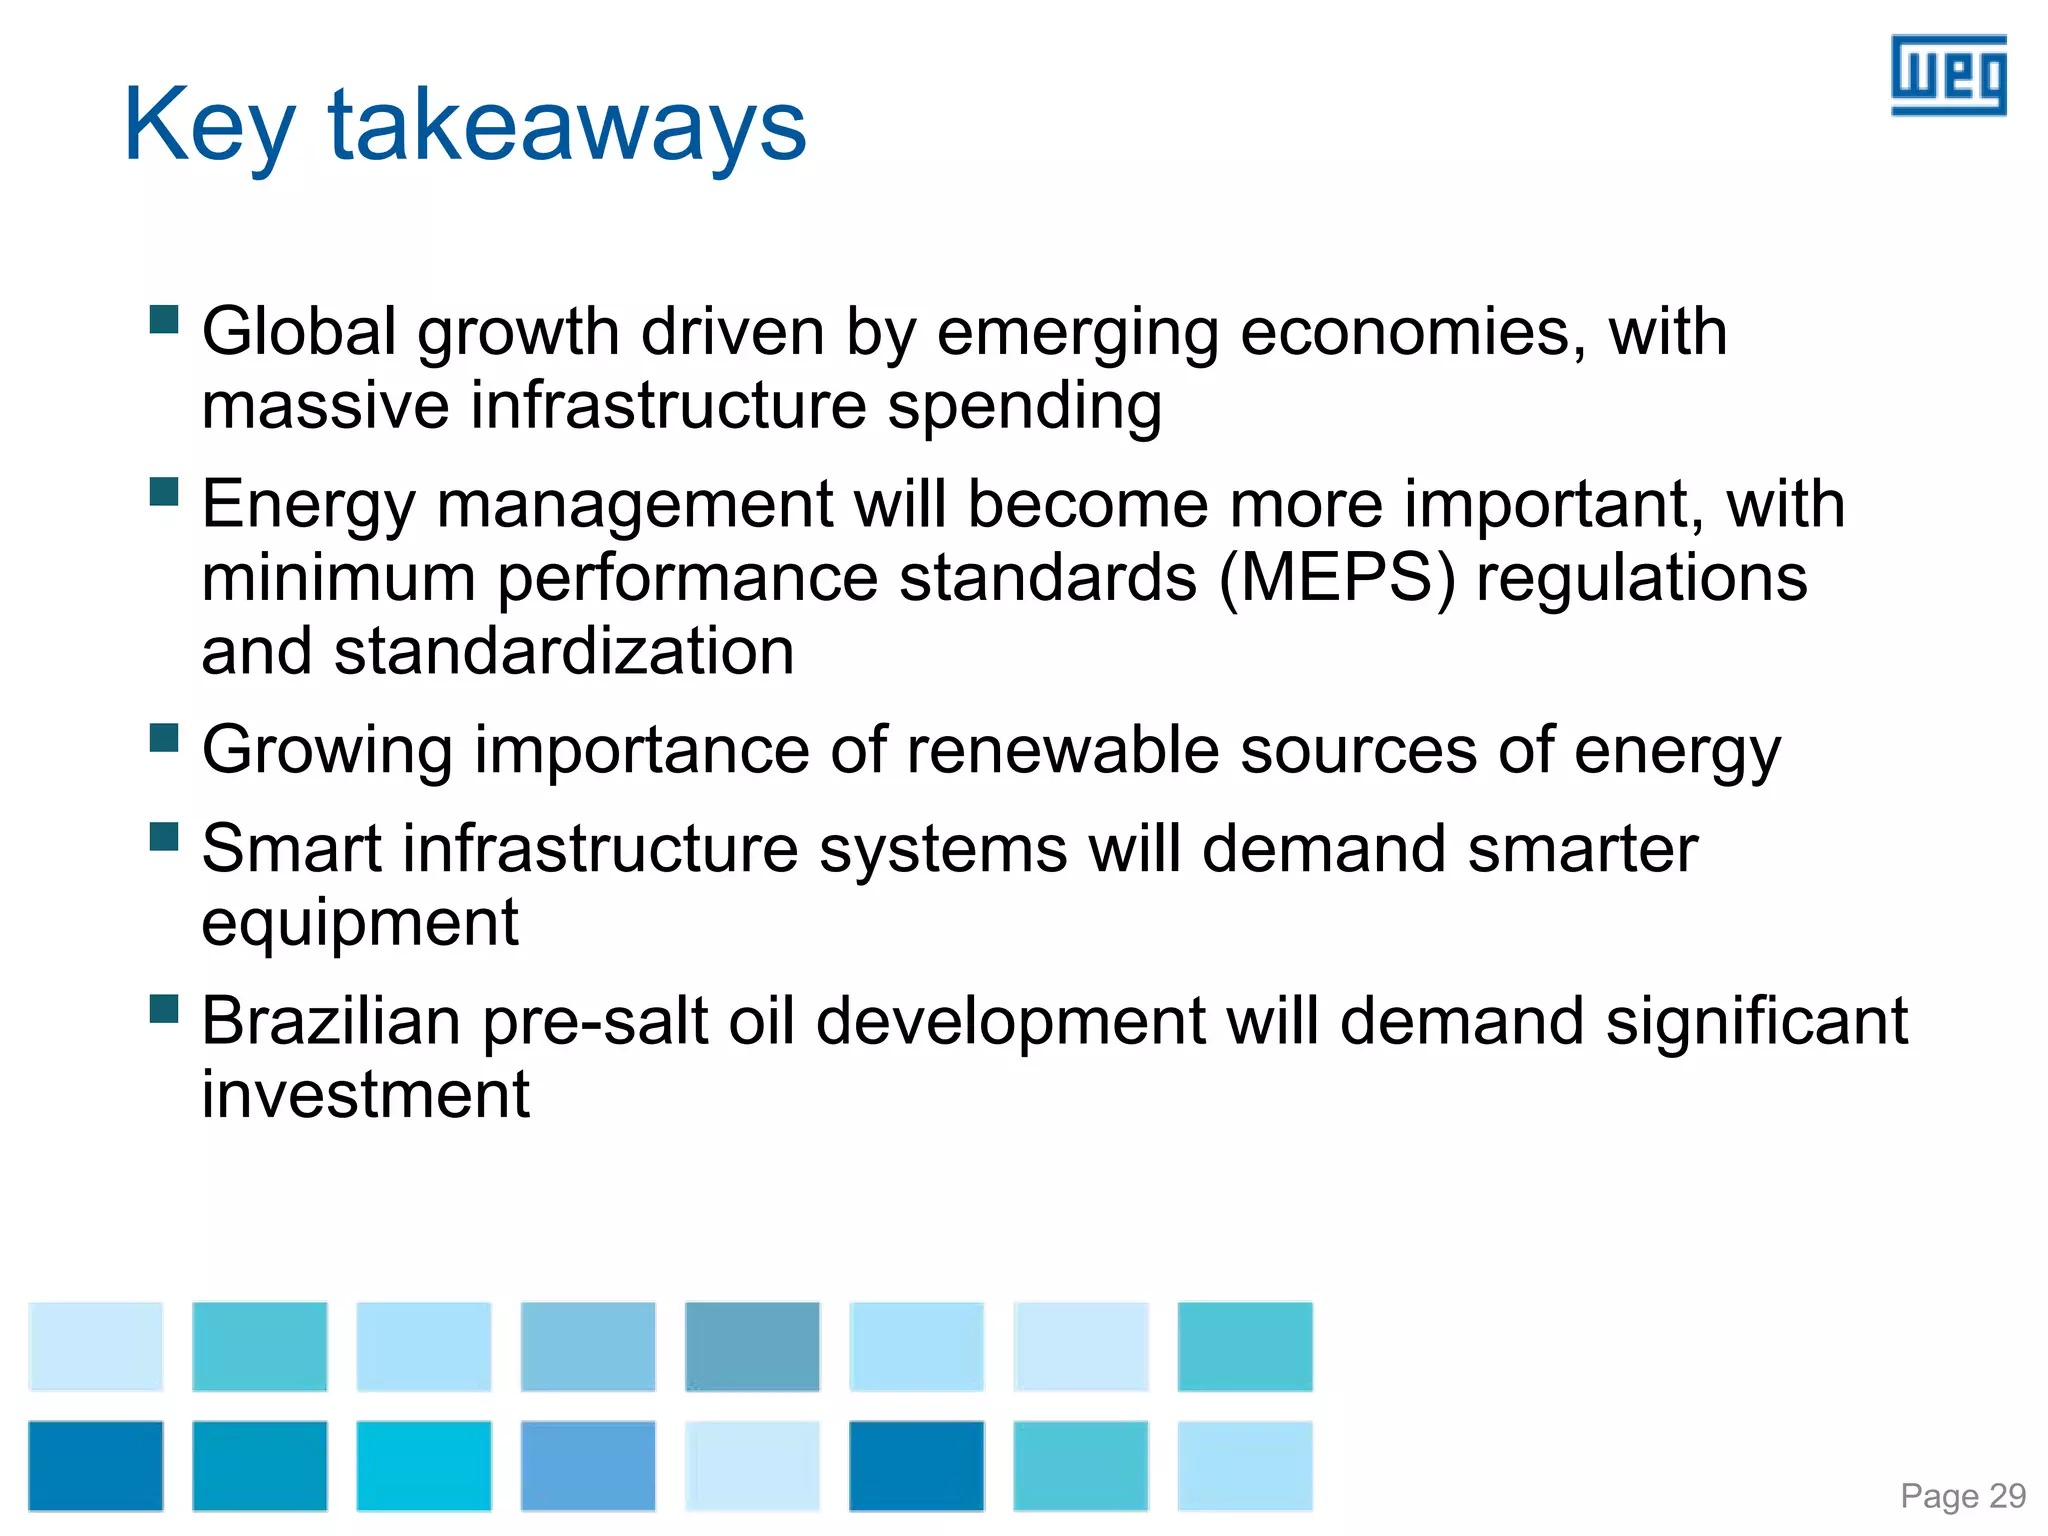
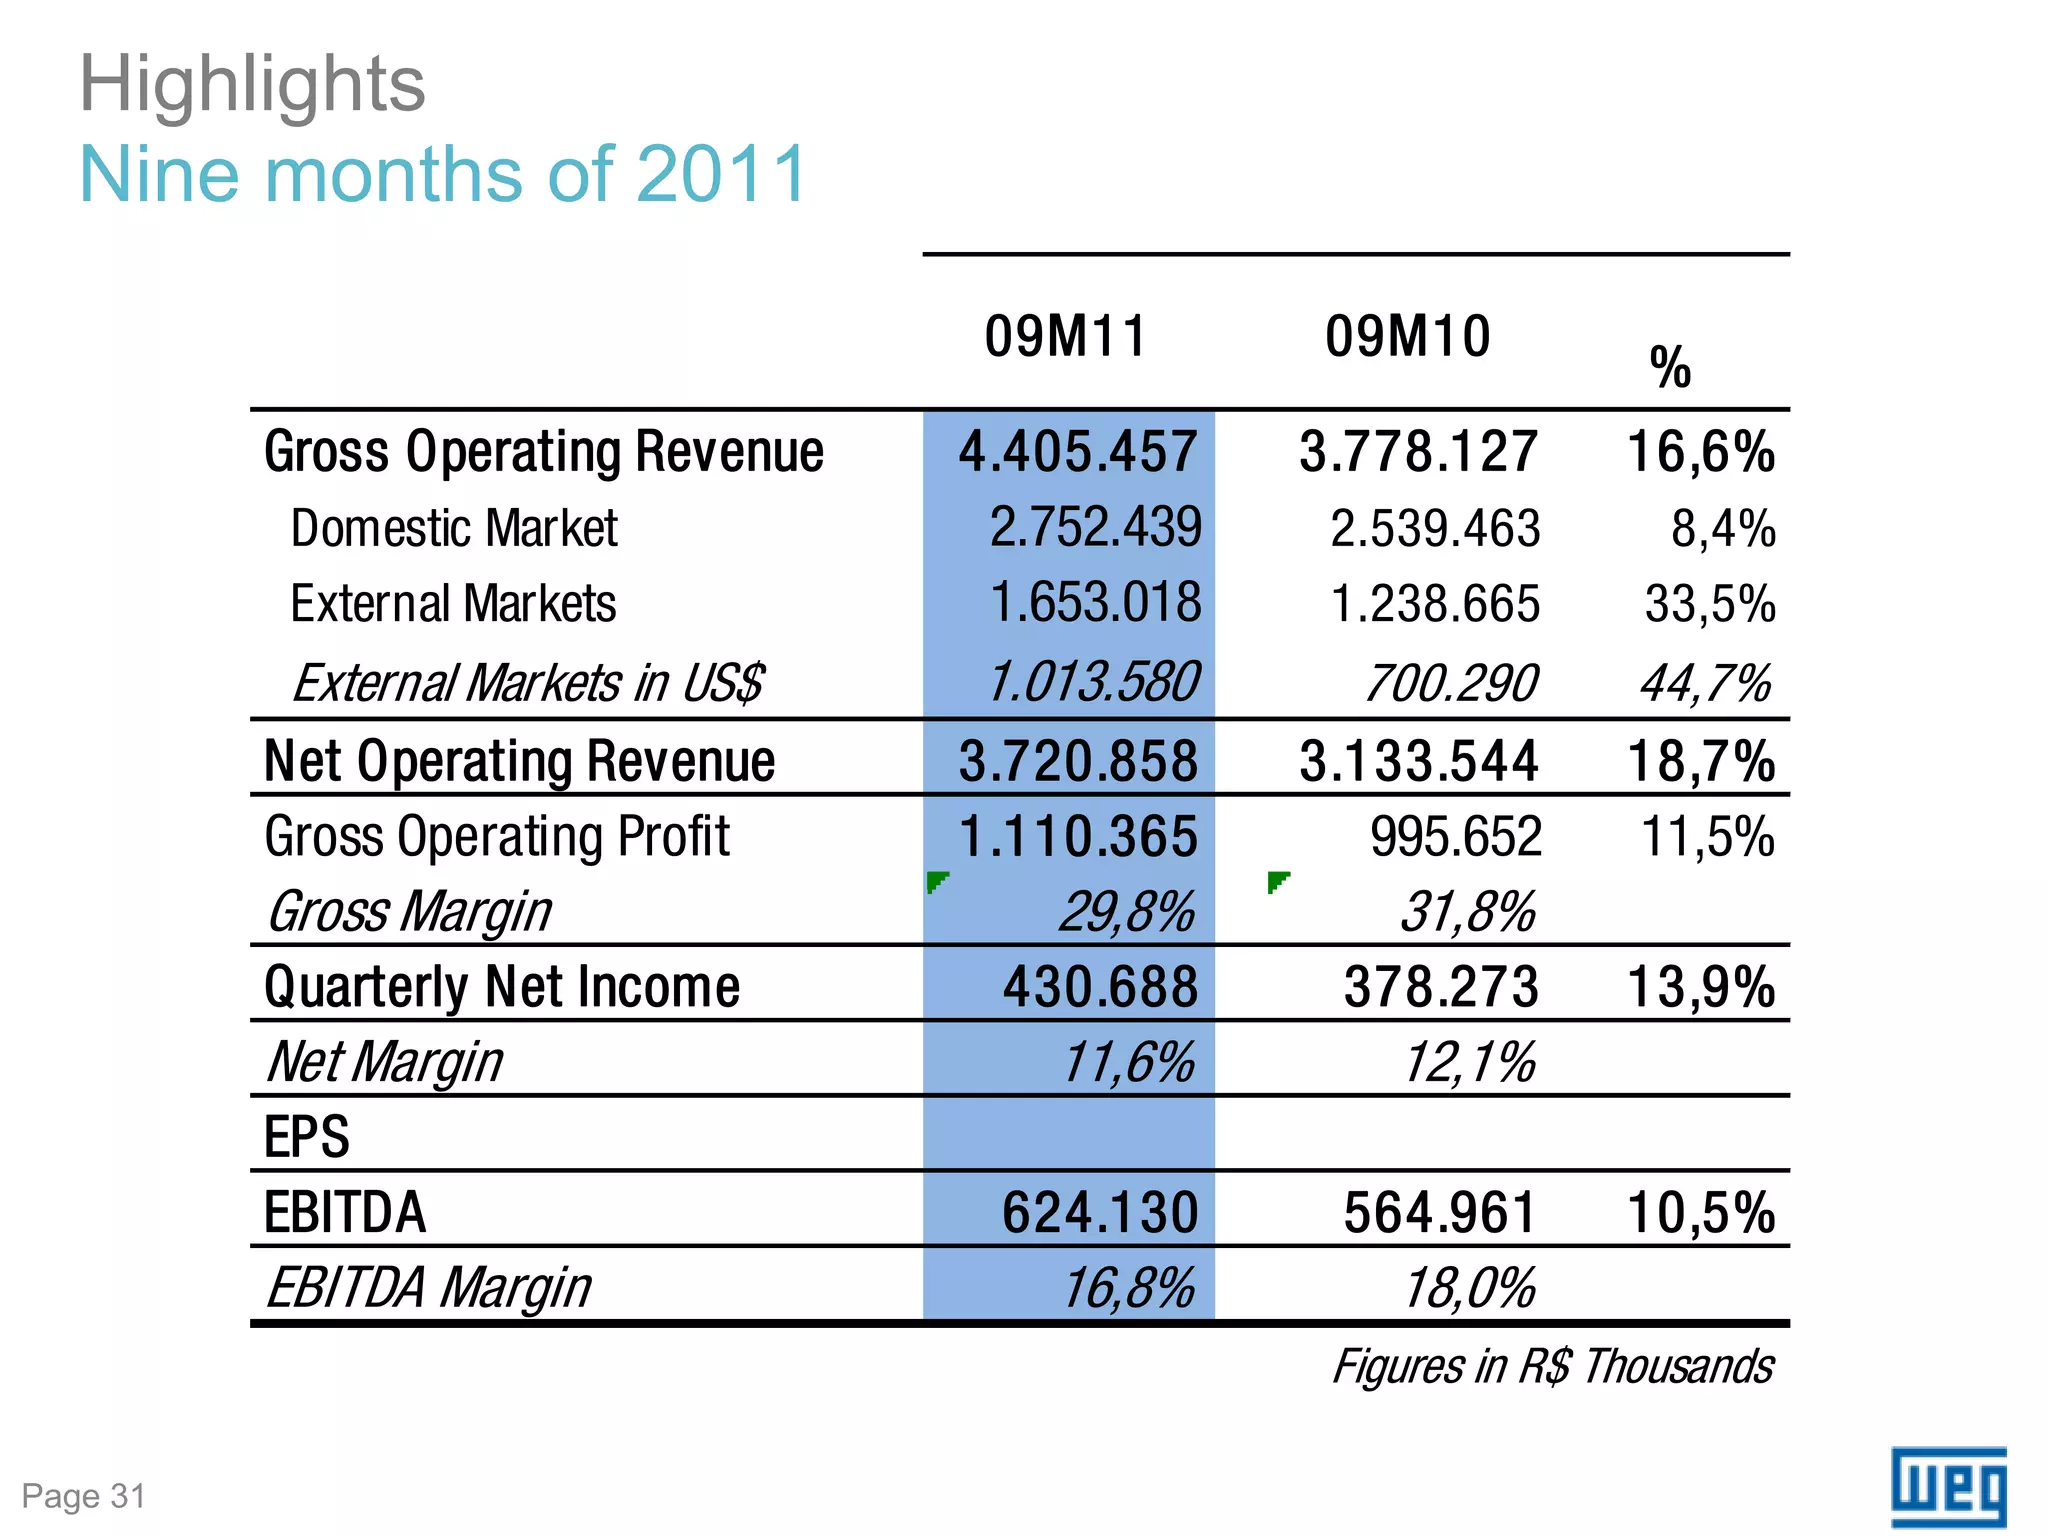
SlideShare a Scribd company logo
1 of 36
Download to read offline
Motors | Automation | Energy | T&D | Paints


Credit Suisse Equity Ideas
Conference 2012
January, 2012

WEGE3 / WEGZY
Disclaimer

The information contained herein has been prepared by WEG S.A. (“WEG” or the “Company”) solely for meetings held
with investors and/or potential investors. This material does not constitute offering material in whole or part, and you must
obtain further information before making an investment decision in respect of the common shares of the Company.

This material has been prepared solely for informational purposes and is not to be construed as a solicitation or an offer to
buy or sell any securities and should not be treated as giving investment advice. It is not targeted to the specific
investment objectives, financial situation or particular needs of any recipient. No representation or warranty, either express
or implied, is made as to the accuracy, completeness or reliability of the information contained herein. It should not be
regarded by recipients as a substitute for the exercise of their own judgment. Any opinions expressed in this material are
subject to change without notice and WEG is not under obligation to update or keep current the information contained
herein. In addition, WEG has been informed that their affiliates, agents, directors, partners and employees may make
purchases and/or sales as principals or may act as market makers or provide investment banking or other services to the
Company. The Company and their respective affiliates, agents, directors, partners and employees accept no liability
whatsoever for any loss or damage of any kind arising out of the use of all or any part of this material.

You should consult your own legal, regulatory, tax, business, investment, financial and accounting advisers to the extent
that you deem necessary, and you must make your own investment, hedging or trading decision based upon your own
judgment and advice from such advisers as you deem necessary and not upon any view expressed in this material.

This material includes forward-looking statements subject to risks and uncertainties, which are based on current
expectations and projections about future events and trends that may affect the Company’s business. These statements
include projections of economic growth and energy demand and supply, as well as information about competitive position,
the regulatory environment, potential opportunities for growth and other matters. Several factors may adversely affect the
estimates and assumptions on which these statements are based, many of which are beyond our control.


                                                                                                                                 1
Business Units


                                     Transmission
    Motors     Automation   Energy                    Coatings
                                     & Distribution

Page 2
Our business
                                                                    Services


                                                  Speed Variation


                              Power              Motors   Transformers            Subestations
                             Generation


                                                    Generators         Electric
                                           Electrical                  Panels
                                          Components


                                               Industrial Automation
    Liquid and powder
   Coatings and industrial
         Varnishes

Page 3
Business areas

                    Electro-             Generation,         Motors for           Industrial
                   Electronic           Transmission        Domestic Use          Paints and
                   Industrial                and                                  Varnishes
                  Equipments             Distribution
  Business          Motors +            Energy + T&D +
  Units            Automation             Automation            Motors             Coatings

                Industrial Production       Growth in      Disposable income,
  Performance        growth and          investments in    supply of credit and   Brazilian GDP
                   Investments in         electric enrgy     level of interest       growth
  Drivers           Fixed Capital
                       (capex)            infrastructure           rates


Page 4
Industrial segments
Today, WEG offers solutions for a
wide variety of segments


 Oil & Gas
 Shipbuilding
 Mining, Cement and Aggregate
 Sugar & Ethanol
 Pulp & Paper
 Steel
 Infrastructure
 Energy
 Food & Beverage


                                    Page 5
Revenues breakdown per
Production site
                                           INDIA


      2010
                         Manufactured
                                           CHINA
                         in Brazil, Sold
                          abroad; 32%


                                           MEXICO


                                           MEXICO
                         Manufactured
   Manufactured            and sold
   & sold in Brazil;      abroad; 7%
         61%
                                           PORTUGAL


                                           ARGENTINA
Revenues breakdown per distribution
channel


     2010
                                 OEM; 58%


         Reseller;
           14%


                     End user;
                       28%
Revenues by
                                                                                    Business Area
                                                                          5.471
                                                                                            5.111            5.283
                                                                             5%
                                                                                              6%               7%
                                                         4.551              12%                                               4.405
                                                           6%                                12%              15%
                                                                                                                                 7%
                                                          14%                                                                   11%
                                       3.527                                27%
                                         6%                                                                   26%
                     2.978                                                                    34%                                24%
   2.603               6%               15%                23%
     6%               18%               18%
    21%
                       14%
    10%
                                                                                                                                 59%
                                                                           55%                                 54%
                      62%                61%              57%                                 48%
    63%


   2004              2005              2006              2007             2008              2009             2010           9M2011
Equipamentos Eletro-eletrônicos Industrais   Energia Geração, Transmissão e Distribuição   Motores para Eletrodomésticos   Tintas e Vernizes


Page 8
Shareholding structure


                Voigt          Silva        Werninghaus
               33.3%          33.3%           33.3%


                                WPA
            Members of                        Treasury
                            Participações                   Free Float
           Control Group                       Shares
                           e Serviços S/A
                   14.4%            50.9%            0.1%           34.6%


                                            WEG S.A.


Page 9
1995   353


Page 10
          1996   372
          1997   466
          1998   527
          1999    628
          2000     800
                                                             CAGR 17%
          2001      1.066
                                                                                                          growth


          2002        1.282
          2003            1.694
          2004                 2.204
                                                                                      Net Revenues (R$)


          2005                    2.515
          2006                         3.009
          2007                                 3.749
          2008                                            4.502
          2009                                         4.211
          2010                                           4.392


          1995   80
                                                                        23%


          1996   84
          1997   106
                                                                                                          Consistent and profitable


          1998    135
          1999    146
                                                                        23% 23%


          2000       207
                                                                           26% 26%


                                                 CAGR 16%
                                                                                      EBITDA (R$)


          2001          291
                                                                                27%


          2002           327
                                                                              26%


          2003                 435
          2004                   487
          2005                    504
                                                               20%


          2006                          666
          2007                                     923
                                                                   25%


          2008                                       1.026
                                                            22% 22% 23%


          2009                                  837
                                                                       20%


          2010                                789
                                                                          18%
Highlights
      Third Quarter, 2011

                                     Q3 2011      Q2 2011 Growth % Q3 2010 Growth %
          Gross Operating Revenue    1.552.044    1.510.276  2,8% 1.419.160   9,4%
           Domestic Market              953.515      936.061 1,9%    906.954  5,1%
           External Markets             598.529      574.215 4,2%    512.207 16,9%
           External Markets in US$     364.730       360.639 1,1%    298.020 22,4%
          Net Operating Revenue      1.317.483    1.277.258  3,1% 1.188.622 10,8%
          Gross Operating Profit       418.266       381.437 9,7%    377.227 10,9%
          Gross Margin                  31,7%        29,9%                  31,7%
          Net Income                  154.567      154.557   0,0%         142.106      8,8%
          Net Margin                    11,7%        12,1%                  12,0%
          EBITDA                      243.743      215.579   13,1%        209.196    16,5%
          EBITDA Margin                 18,5%        16,9%                  17,6%
          EPS                           0,2491      0,2491   0,0%           0,2289      8,9%
                                                                     Figures in R$ Thousands


Page 11
Positioned to benefit
      from mega trends
 Energy Management                                Renewable Energy
  Industrial electricity consumption is the     Global need to diversify energy
  largest portion of global consumption         sources and lower GHG emissions
  Management systems (ISO 50.001)               Scale and technological development
  already being implemented                     increase viability


 Smart Infrastructure                              Mobility
  Electricity distribution network has to       Increasing urbanization adds to
  become “smarter”                              congestions and need of new solutions
  More sensors, more automation, more           Hybrids, pure electric and alternative
  efficient generation and use of electricity   fuels vehicles will become more
                                                important
Page 12
Energy Management
    Electric motors has unique characteristics
   Total Cos
             t     of Owner
                               ship of a
                                         Electric M
                                                   o   tor (*)       Specifications must be exact.
          Acquisitio                                                 Everything affects energy
                     n     1,4%                                      efficiency

   Maintena                                                         “Similar” motors are not
           nce
                         1,6%                                       economical, even if much
                                                                    cheaper to acquire
       Energy
  Consump                                                         Differences become more
          tion
                                                        97%       evident when energy prices go
                                                                  up

                                                                 Return on energy efficiency
  (*) Consid                                                     investments are very attractive
            ering use
                      ful life of
                                  10 years


Page 13
Energy Management
                                              Harmonization of energy efficiency
                                                                    regulations
                                              IE 4
          Conversion of energy (efficiency)


                                              (Super premium)               No regulatory obligation as of today


                                              IE 3         (NEMA Premium
                                                                                              (effective 2015)
                                              (Premium)       efficiency)


                                              IE 2          NEMA Energy
                                              (High)         Efficiency


                                              IE 1
                                              (Standard)                    Most developing markets


Page 14
Renewable Energy
Brazil’s electricity is already clean,
but it can get cleaner
   180.000 
   160.000 
                                                                          8% CAGR          Biomass - 5% CAGR
   140.000                                                                                 Small Hydro – 6% CAGR
                                                                                           Wind - 17% CAGR
   120.000 
   100.000 
    80.000 
    60.000                                                                4% CAGR

    40.000 
    20.000 
                                                                          5% CAGR
          ‐
              2010     2011    2012    2013   2014   2015   2016   2017    2018     2019

                     Fossil Fuels     Large Hydro    Renewables     Nuclear

Source: EPE - PDE 2019

                                                                                                       Page 15
Power grid must evolve
    and become smart                                                                        Demand management
SMART GRID: Applying sensing,                                  Smart apliances
                                                                                              Use can be shifted to off
measurement and control devices with two-                      Can shut off in response       peak times to save money
way communications to dynamically                              to frequency fluctuations
respond to changes in grid conditions                                                                  Sensors
                                                                                                         Detected fluctuations and
                                                                                                         disturbances, and can signal
                                               Solar                                                     for areas to be isolated
                                               panels
                                                                                   Houses
 Storages         Offices
                                                                                                                                 Disturbance
  Energy generated at off
  peak times could be                                                                                                            In the grid
  stored in batteries for later
  uses                                          Storage


                                                                                                                             Isolated
                                                                                                                             microgrid

     Wind farm
                                  Processors
                                                                                                                Central power
                                  Execute special protection                                Generators          plant
                                  schemes in microseconds                 Industrial         Energy from small generators
                                                                          plant              and solar panels can reduce
                                                                                             overall demand on the grid
                                                                                                         16
Solutions for electric &
                 hybrid vehicles
               Complete power train solution
                 Electric motor (power train)
                 Auxiliary Genset (ethanol,
                 biodiesel or natural gas)
                 Frequency inverter and
                 components (system
                 automation)
                 Batteries


Page 17
WEG solutions for
                               marine automation


                             Automation
          Thrusters motors                 Transformers


                             Generators


Page 18
Strategic Positioning
             Appliance
Motors


             Industrial

             High Voltage

             Generators
Power


             Biomass Systems

             Small Hydro

             Wind

             Power

             Dry
T&D


             Distribution

             Substations

             Drives
Automotion


             Controls

             Panels

             Gearbox
New Biz


             Gensets

             Turbines
Portfolio Strategy

  Market              May 2010                     November 2011
  Access

                                         October 2011     November 2011


             May 2010


           May 2011
                                                        March 2011


                                 June 2010         December 2010


                                               Technology
Page 20
EM gives WEG to key technologies

  2 pole turbo generator technology allows WEG to
  increase the power range:
                          Previously, up to 65 MVA, 4 poles
                          technology
                          Now, up 120 MVA,


  American Petroleum Institute (API) compliant machinery
  New opportunities in supplying for:
  Gas turbines
  Steam turbines
                                           21
EM also allows WEG to increase
presence in two important segments
                                 Oil & gas
                                     Crude and natural gas exploration
                                     (up and downstream)
                                     Oil-prices driven growth, both in
                                     new opportunities (i.e. pre-salt) as
                                     improving existing equipment

                                Power generation
                                  Generators and electric motors for
                                  fans, water pumps, etc.
                                  Modernization of aging infrastructure
                                  Recertification of nuclear power
                                  plants

Technology, reputation and relationships can be transferred to other
markets / geographies
                                                      22
WEG can leverage EM’s assets

   Sinergies from combining EM’s and WEG’s strenghts


  Brand recognition and reputation in     Complete line of products, offering
  high-power rotating machines            one stop shop solutions;
  (HPRM)                                  Large commercial network across
  Deep and long standing key              the world
  customer relationships                  Strong market presence in fast
       Oil and gas (in the vendor lists   growing emerging economies, such
       of all majors)                     as Latin America
       Power generation
  Large installed base of more than
  5,500 units in operation


                                                          23
Power Transmission fits
into efficiency theme
   Integration of different products and expertise
   Growing demand for integrated solutions
      Energy efficiency
      Operating performance


      Electric motor             Gearbox                Drives
       (electrical)            (mechanical)          (electronics)


                                                           Page 24
Gearboxes market can be divided in
niches
  Commoditized
     Large volume, low margins
     Simple applications (conveyor belts, lathes, etc.)
     Up to 50 hp, with low efficiency and relatively simple engineering
  Customized
     Similar to WEG’s core industrial motors business (mass
     customization)
     More complex applications (mixers, extruders)
     All power ranges, higher efficiency and relatively higher
     engineering complexity
  Innovations
     One of a kind, similar to WEG’s HV core
     Highly complex applications (wind energy, mining)
     High efficiency, high engineering complexity

                                                                Page 25
Capex
                                   457


                            349


                                          226    233
       206


              146
126                                                          125
                     111


2003   2004   2005   2006   2007   2008   2009   2010 9M2011
                                                       (R$ million)

                                                                 Page 26
Dividend Pay-out Policy
      Net Earnings and Dividends (R$ million)
                                                                                                                                   59%
                                                                                                                        55%
                                                                                                           54%                                 54%
                                                                                               52%

                                                                       44%         45%
                                                           43%
                                 40%          40%
                      39%                                                                     575
           37%                                                                                            560         548
  35%                                                                                                                             520
                                                                                  503

                                                          403
                                                                      375
                                            308                                                     299         301         300         306
                                                                                                                                              276
                                220                                                     229
                     176                                        173         165                                                                     150
          125                                     124
 82 29          46         68         89


 1999 2000 2001 2002 2003 2004 2005 2006 2007 2008 2009 2010 6M2011
                                           Net Earnings                 Dividends                   Pay-out (%)
Page 27
Growth Drivers &
     Opportunities


          New and improved products, focusing efficiency,
          reliability and features
          More integrated systems / complete solutions
          New markets / products, R&D and acquisitions
          and new geographies.


Page 28
Key takeaways
 Global growth driven by emerging economies, with
 massive infrastructure spending
 Energy management will become more important, with
 minimum performance standards (MEPS) regulations
 and standardization
 Growing importance of renewable sources of energy
 Smart infrastructure systems will demand smarter
 equipment
 Brazilian pre-salt oil development will demand significant
 investment


                                                          Page 29
Contacts                       www.weg.net/ri
§Laurence Beltrão Gomes
  Investor Relations Officer
  laurence@weg.net

§ Luís Fernando M. Oliveira
  Investor Relations Manager
  +55 (47) 3276-6973
  luisfernando@weg.net
  twitter.com/weg_ir
Highlights
   Nine months of 2011
                                      09M11        09M10
                                                                   %
          Gross Operating Revenue    4.405.457    3.778.127       16,6%
           Domestic Market            2.752.439    2.539.463        8,4%
           External Markets           1.653.018    1.238.665       33,5%
           External Markets in US$   1.013.580       700.290      44,7%
          Net Operating Revenue      3.720.858    3.133.544       18,7%
          Gross Operating Profit     1.110.365       995.652      11,5%
          Gross Margin                  29,8%         31,8%
          Quarterly Net Income        430.688      378.273        13,9%
          Net Margin                    11,6%         12,1%
          EPS
          EBITDA                      624.130      564.961        10,5%
          EBITDA Margin                 16,8%         18,0%
                                                   Figures in R$ Thousands

Page 31
Highlights
   Assets
                                                                               Figures in R$ Thousands
                                           September 2011      December 2010       September 2010
                                                R$      AV%         R$      AV%         R$      AV%
                                                20                  13                  11
          CURRENT ASSETS                     5.742.007 66%       4.794.009 64%       4.628.280 63%
             Cash & cash equivalents          3.086.568 35%       2.552.996 34%       2.399.773 33%
             Receivables                      1.162.056 13%       1.044.712 14%       1.026.652 14%
             Inventories                      1.269.623 15%       1.008.952 13%       1.015.175 14%
             Other current assets               223.760   3%        187.349   2%        186.680   3%
          LONG TERM ASSETS                     378.587    4%       136.984    2%       149.892    2%
             Long term securities               233.266   3%              0   0%              0   0%
             Deferred taxes                     103.846   1%         78.810   1%         91.613   1%
             Other non-current assets            41.475   0%         58.174   1%         58.279   1%
          FIXED ASSETS                       2.575.233 30%       2.580.171 34%       2.586.940 35%
             Investment in Subs                     933   0%            601   0%            222   0%
             Property, Plant & Equipment      2.397.920 28%       2.395.575 32%       2.394.633 33%
             Intangibles                        176.380   2%        183.995   2%        192.085   3%
          TOTAL ASSETS                       8.695.827 100%      7.511.164 100%      7.365.112 100%


Page 32
Highlights
   Liabilities
                                                                               Figures in R$ Thousands
                                           September 2011      December 2010       September 2010
                                                R$      AV%         R$      AV%         R$      AV%
                                                20                  13                  11
          CURRENT LIABILITIES                2.818.379 32%       1.938.803 26%       1.795.005 24%
            Social and Labor Liabilities        188.599   2%        141.797   2%        167.220   2%
            Suppliers                           317.125   4%        242.300   3%        273.823   4%
            Fiscal and Tax Liabilities           63.632   1%         72.204   1%         73.452   1%
            Short Term Debt                   1.797.222 21%       1.018.995 14%         841.311 11%
            Dividends Payable                    47.903   1%         63.440   1%         32.052   0%
            Advances from Clients               239.143   3%        271.949   4%        233.844   3%
            Profit Sharring                      39.348   0%         23.583   0%         34.050   0%
            Other Short Term Liabilities        125.407   1%        104.535   1%        139.253   2%
          LONG TERM LIABILITIES              2.167.388 25%       2.028.525 27%       2.126.673 29%
            Long Term Debt                    1.491.765 17%       1.399.948 19%       1.503.836 20%
            Other Long Term Liabilities         129.275   1%         86.875   1%         92.250   1%
            Deferred Taxes                      411.545   5%        415.318   6%        417.304   6%
            Contingencies Provisions            134.803   2%        126.384   2%        113.283   2%
          MINORITIES                            98.709    1%        89.229    1%        85.991    1%
          STOCKHOLDERS' EQUITY               3.611.351 42%       3.454.607 46%       3.357.443 46%
          TOTAL LIABILITIES                  8.695.827 100%      7.511.164 100%      7.365.112 100%
Page 33
Highlights
   Cash Flow Statement                                                   9 Months      9 Months
                                                                           2011          2010
                                                                            12            8
                     Operating Activities
                     Net Earnings before Taxes                              554.075       524.849
                     Depreciation and Amortization                         139.393        135.920
                     Earnings from Subs (Equity Method)                           -        (1.687)
                     Provisions:                                             92.160        73.387
                     Changes in Assets & Liabilities                      (494.815)     (312.139)

                     Cash Flow from Operating Activities                  290.813       420.330

                     Investment Activities
                     Fixed Assets                                         (124.813)     (248.847)
                     Intagible Assets                                        (2.462)      (81.274)
                     Asset Write Downs                                        2.472        18.995
                     Accumulated Conversion Adjustment                       38.401       (25.050)
                     Long term securities bought                          (233.266)              -

                     Cash Flow From Investment Activities                (319.668)     (336.176)

                     Financing Activities
                     Shares in Treasury                                    (10.055)              -
                     Working Capital Financing                              767.072       (44.289)
                     Long Term Financing                                    102.972       516.903
                     Dividends & Intesrest on Stockholders Equity Paid    (297.562)     (284.112)

                     Cash Flow From Financing Activities                  562.427       188.502


                     Change in Cash Position                              533.572       272.656
                     Cash & Cash Equivalents
                         Beginning of Period                              2.552.996     2.127.117
                         End of Period                                    3.086.568     2.399.773

Page 34
Our Business

More Related Content

What's hot

At&s company internet presentation february 2013
At&s company internet presentation february 2013At&s company internet presentation february 2013
At&s company internet presentation february 2013AT&S_IR
 
SEB Morgan Stanley Financial Conference April 2009
SEB Morgan Stanley Financial Conference April 2009SEB Morgan Stanley Financial Conference April 2009
SEB Morgan Stanley Financial Conference April 2009SEBgroup
 
18.03.2009 Presentation of E&P Coordinator, Eduardo Alessandro Molinari - P...
18.03.2009   Presentation of E&P Coordinator, Eduardo Alessandro Molinari - P...18.03.2009   Presentation of E&P Coordinator, Eduardo Alessandro Molinari - P...
18.03.2009 Presentation of E&P Coordinator, Eduardo Alessandro Molinari - P...Petrobras
 
Financial analysis total sa - total sa explores for, produces, refines, tra...
Financial analysis   total sa - total sa explores for, produces, refines, tra...Financial analysis   total sa - total sa explores for, produces, refines, tra...
Financial analysis total sa - total sa explores for, produces, refines, tra...BCV
 
Conference call presentation 4 q08 results
Conference call presentation   4 q08 resultsConference call presentation   4 q08 results
Conference call presentation 4 q08 resultsBraskem_RI
 
Financial Analysis - China Communications Construction Company Ltd. is a tran...
Financial Analysis - China Communications Construction Company Ltd. is a tran...Financial Analysis - China Communications Construction Company Ltd. is a tran...
Financial Analysis - China Communications Construction Company Ltd. is a tran...BCV
 
Intact Investor Presentation - March 2010
Intact Investor Presentation - March 2010Intact Investor Presentation - March 2010
Intact Investor Presentation - March 2010Intact
 
HMPRO : Opp day Feb 27, 2012
HMPRO : Opp day Feb 27, 2012HMPRO : Opp day Feb 27, 2012
HMPRO : Opp day Feb 27, 2012TonHor Hor
 
61107576 rallis-india
61107576 rallis-india61107576 rallis-india
61107576 rallis-indiajeetay
 
Financial Analysis - PetroChina Company Limited explores, develops, and produ...
Financial Analysis - PetroChina Company Limited explores, develops, and produ...Financial Analysis - PetroChina Company Limited explores, develops, and produ...
Financial Analysis - PetroChina Company Limited explores, develops, and produ...BCV
 
caterpillar Bank of America Securities Annual Investment Conference
caterpillar Bank of America Securities Annual Investment Conferencecaterpillar Bank of America Securities Annual Investment Conference
caterpillar Bank of America Securities Annual Investment Conferencefinance5
 
Reaching for yield
Reaching for yieldReaching for yield
Reaching for yieldYichuan Wang
 
eCosway 2011 Company Interim Report - eCosway UK and International
eCosway 2011 Company Interim Report - eCosway UK and InternationaleCosway 2011 Company Interim Report - eCosway UK and International
eCosway 2011 Company Interim Report - eCosway UK and InternationaleCosway UK - Franchise For Free
 

What's hot (19)

Automotive Axles
Automotive Axles Automotive Axles
Automotive Axles
 
At&s company internet presentation february 2013
At&s company internet presentation february 2013At&s company internet presentation february 2013
At&s company internet presentation february 2013
 
SEB Morgan Stanley Financial Conference April 2009
SEB Morgan Stanley Financial Conference April 2009SEB Morgan Stanley Financial Conference April 2009
SEB Morgan Stanley Financial Conference April 2009
 
18.03.2009 Presentation of E&P Coordinator, Eduardo Alessandro Molinari - P...
18.03.2009   Presentation of E&P Coordinator, Eduardo Alessandro Molinari - P...18.03.2009   Presentation of E&P Coordinator, Eduardo Alessandro Molinari - P...
18.03.2009 Presentation of E&P Coordinator, Eduardo Alessandro Molinari - P...
 
3Q08
3Q083Q08
3Q08
 
Financial analysis total sa - total sa explores for, produces, refines, tra...
Financial analysis   total sa - total sa explores for, produces, refines, tra...Financial analysis   total sa - total sa explores for, produces, refines, tra...
Financial analysis total sa - total sa explores for, produces, refines, tra...
 
Conference call presentation 4 q08 results
Conference call presentation   4 q08 resultsConference call presentation   4 q08 results
Conference call presentation 4 q08 results
 
Financial Analysis - China Communications Construction Company Ltd. is a tran...
Financial Analysis - China Communications Construction Company Ltd. is a tran...Financial Analysis - China Communications Construction Company Ltd. is a tran...
Financial Analysis - China Communications Construction Company Ltd. is a tran...
 
Intact Investor Presentation - March 2010
Intact Investor Presentation - March 2010Intact Investor Presentation - March 2010
Intact Investor Presentation - March 2010
 
HMPRO : Opp day Feb 27, 2012
HMPRO : Opp day Feb 27, 2012HMPRO : Opp day Feb 27, 2012
HMPRO : Opp day Feb 27, 2012
 
Korea Supplement
Korea SupplementKorea Supplement
Korea Supplement
 
61107576 rallis-india
61107576 rallis-india61107576 rallis-india
61107576 rallis-india
 
Financial Analysis - PetroChina Company Limited explores, develops, and produ...
Financial Analysis - PetroChina Company Limited explores, develops, and produ...Financial Analysis - PetroChina Company Limited explores, develops, and produ...
Financial Analysis - PetroChina Company Limited explores, develops, and produ...
 
Page Industries Limited
Page Industries LimitedPage Industries Limited
Page Industries Limited
 
caterpillar Bank of America Securities Annual Investment Conference
caterpillar Bank of America Securities Annual Investment Conferencecaterpillar Bank of America Securities Annual Investment Conference
caterpillar Bank of America Securities Annual Investment Conference
 
Reaching for yield
Reaching for yieldReaching for yield
Reaching for yield
 
eCosway 2011 Company Interim Report - eCosway UK and International
eCosway 2011 Company Interim Report - eCosway UK and InternationaleCosway 2011 Company Interim Report - eCosway UK and International
eCosway 2011 Company Interim Report - eCosway UK and International
 
Hl td
Hl tdHl td
Hl td
 
Eid parry
Eid parryEid parry
Eid parry
 

Similar to CS Conference 2012

2Q09 Investor Presentation
2Q09 Investor Presentation2Q09 Investor Presentation
2Q09 Investor PresentationWEG
 
2010 01 27 CS Equity Ideas Conference
2010 01 27 CS Equity Ideas Conference2010 01 27 CS Equity Ideas Conference
2010 01 27 CS Equity Ideas ConferenceWEG
 
air products & chemicals 2008 May 21 Goldman Sachs
air products & chemicals 2008 May 21 Goldman Sachsair products & chemicals 2008 May 21 Goldman Sachs
air products & chemicals 2008 May 21 Goldman Sachsfinance26
 
air products & chemicals 2008 June3 JPMorgan
air products & chemicals 2008 June3 JPMorganair products & chemicals 2008 June3 JPMorgan
air products & chemicals 2008 June3 JPMorganfinance26
 
So maximieren Sie den Nutzen von SAP: Business Netzwerke als Schlüssel zum Er...
So maximieren Sie den Nutzen von SAP: Business Netzwerke als Schlüssel zum Er...So maximieren Sie den Nutzen von SAP: Business Netzwerke als Schlüssel zum Er...
So maximieren Sie den Nutzen von SAP: Business Netzwerke als Schlüssel zum Er...SAP Ariba
 
Profarma apresentação 3 q11 final
Profarma apresentação 3 q11 finalProfarma apresentação 3 q11 final
Profarma apresentação 3 q11 finalProfarma
 
2010 06 21 J.P. Morgan LATAM Corporate Access Days (London)
2010 06 21 J.P. Morgan LATAM Corporate Access Days (London)2010 06 21 J.P. Morgan LATAM Corporate Access Days (London)
2010 06 21 J.P. Morgan LATAM Corporate Access Days (London)WEG
 
2분기 영문 캐피탈ir자료
2분기 영문 캐피탈ir자료2분기 영문 캐피탈ir자료
2분기 영문 캐피탈ir자료Hyundai Finance
 
AEP Analyst & Investor Meeting Feburary 10, 2012
AEP Analyst & Investor Meeting Feburary 10, 2012AEP Analyst & Investor Meeting Feburary 10, 2012
AEP Analyst & Investor Meeting Feburary 10, 2012American Electric Power
 
Second Annual Analysts & Investors Presentation - Financial Presentation
Second Annual Analysts & Investors Presentation - Financial PresentationSecond Annual Analysts & Investors Presentation - Financial Presentation
Second Annual Analysts & Investors Presentation - Financial PresentationEmbraer RI
 
2002* Segundo Encontro Anual Com Analistas E Investidores ApresentaçãO Fina...
2002* Segundo Encontro Anual Com Analistas E Investidores   ApresentaçãO Fina...2002* Segundo Encontro Anual Com Analistas E Investidores   ApresentaçãO Fina...
2002* Segundo Encontro Anual Com Analistas E Investidores ApresentaçãO Fina...Embraer RI
 
Segundo Encontro Anual Com Analistas E Investidores ApresentaçãO Financeira
Segundo Encontro Anual Com Analistas E Investidores   ApresentaçãO FinanceiraSegundo Encontro Anual Com Analistas E Investidores   ApresentaçãO Financeira
Segundo Encontro Anual Com Analistas E Investidores ApresentaçãO FinanceiraEmbraer RI
 
sonic automotive SAHStephens20June20Conference20Presentation
sonic automotive SAHStephens20June20Conference20Presentationsonic automotive SAHStephens20June20Conference20Presentation
sonic automotive SAHStephens20June20Conference20Presentationfinance43
 
sonic automotive SAHStephens20June20Conference20Presentation
sonic automotive SAHStephens20June20Conference20Presentationsonic automotive SAHStephens20June20Conference20Presentation
sonic automotive SAHStephens20June20Conference20Presentationfinance43
 

Similar to CS Conference 2012 (20)

2Q09 Investor Presentation
2Q09 Investor Presentation2Q09 Investor Presentation
2Q09 Investor Presentation
 
2010 01 27 CS Equity Ideas Conference
2010 01 27 CS Equity Ideas Conference2010 01 27 CS Equity Ideas Conference
2010 01 27 CS Equity Ideas Conference
 
air products & chemicals 2008 May 21 Goldman Sachs
air products & chemicals 2008 May 21 Goldman Sachsair products & chemicals 2008 May 21 Goldman Sachs
air products & chemicals 2008 May 21 Goldman Sachs
 
air products & chemicals 2008 June3 JPMorgan
air products & chemicals 2008 June3 JPMorganair products & chemicals 2008 June3 JPMorgan
air products & chemicals 2008 June3 JPMorgan
 
Hcs 영문
Hcs 영문Hcs 영문
Hcs 영문
 
So maximieren Sie den Nutzen von SAP: Business Netzwerke als Schlüssel zum Er...
So maximieren Sie den Nutzen von SAP: Business Netzwerke als Schlüssel zum Er...So maximieren Sie den Nutzen von SAP: Business Netzwerke als Schlüssel zum Er...
So maximieren Sie den Nutzen von SAP: Business Netzwerke als Schlüssel zum Er...
 
Profarma apresentação 3 q11 final
Profarma apresentação 3 q11 finalProfarma apresentação 3 q11 final
Profarma apresentação 3 q11 final
 
C:\fakepath\2 q10 apresentação-english
C:\fakepath\2 q10   apresentação-englishC:\fakepath\2 q10   apresentação-english
C:\fakepath\2 q10 apresentação-english
 
2010 06 21 J.P. Morgan LATAM Corporate Access Days (London)
2010 06 21 J.P. Morgan LATAM Corporate Access Days (London)2010 06 21 J.P. Morgan LATAM Corporate Access Days (London)
2010 06 21 J.P. Morgan LATAM Corporate Access Days (London)
 
2분기 영문 캐피탈ir자료
2분기 영문 캐피탈ir자료2분기 영문 캐피탈ir자료
2분기 영문 캐피탈ir자료
 
2Q07 Results
2Q07 Results2Q07 Results
2Q07 Results
 
Customer Management in Life Insurance
Customer Management in Life InsuranceCustomer Management in Life Insurance
Customer Management in Life Insurance
 
AEP Analyst & Investor Meeting Feburary 10, 2012
AEP Analyst & Investor Meeting Feburary 10, 2012AEP Analyst & Investor Meeting Feburary 10, 2012
AEP Analyst & Investor Meeting Feburary 10, 2012
 
Second Annual Analysts & Investors Presentation - Financial Presentation
Second Annual Analysts & Investors Presentation - Financial PresentationSecond Annual Analysts & Investors Presentation - Financial Presentation
Second Annual Analysts & Investors Presentation - Financial Presentation
 
2002* Segundo Encontro Anual Com Analistas E Investidores ApresentaçãO Fina...
2002* Segundo Encontro Anual Com Analistas E Investidores   ApresentaçãO Fina...2002* Segundo Encontro Anual Com Analistas E Investidores   ApresentaçãO Fina...
2002* Segundo Encontro Anual Com Analistas E Investidores ApresentaçãO Fina...
 
Segundo Encontro Anual Com Analistas E Investidores ApresentaçãO Financeira
Segundo Encontro Anual Com Analistas E Investidores   ApresentaçãO FinanceiraSegundo Encontro Anual Com Analistas E Investidores   ApresentaçãO Financeira
Segundo Encontro Anual Com Analistas E Investidores ApresentaçãO Financeira
 
Result presentation 4 q12 2012 eng final
Result presentation 4 q12 2012 eng finalResult presentation 4 q12 2012 eng final
Result presentation 4 q12 2012 eng final
 
2Q09 Results
2Q09 Results2Q09 Results
2Q09 Results
 
sonic automotive SAHStephens20June20Conference20Presentation
sonic automotive SAHStephens20June20Conference20Presentationsonic automotive SAHStephens20June20Conference20Presentation
sonic automotive SAHStephens20June20Conference20Presentation
 
sonic automotive SAHStephens20June20Conference20Presentation
sonic automotive SAHStephens20June20Conference20Presentationsonic automotive SAHStephens20June20Conference20Presentation
sonic automotive SAHStephens20June20Conference20Presentation
 

More from WEG

WEG Q3 2016 INVESTOR PRESENTATION
WEG Q3 2016 INVESTOR PRESENTATIONWEG Q3 2016 INVESTOR PRESENTATION
WEG Q3 2016 INVESTOR PRESENTATIONWEG
 
2014 07 24 2T14 Conference Call
2014 07 24 2T14 Conference Call2014 07 24 2T14 Conference Call
2014 07 24 2T14 Conference CallWEG
 
2014 04 25 1T14 Conference Call
2014 04 25 1T14 Conference Call2014 04 25 1T14 Conference Call
2014 04 25 1T14 Conference CallWEG
 
2014 02 27 4T13 Conference Call
2014 02 27 4T13 Conference Call2014 02 27 4T13 Conference Call
2014 02 27 4T13 Conference CallWEG
 
Apresentação para Investidores Julho 2014
Apresentação para Investidores Julho 2014Apresentação para Investidores Julho 2014
Apresentação para Investidores Julho 2014WEG
 
Q1 2014 Investor Presentation
Q1 2014 Investor PresentationQ1 2014 Investor Presentation
Q1 2014 Investor PresentationWEG
 
Q1 2014 Investor Presentation
Q1 2014 Investor PresentationQ1 2014 Investor Presentation
Q1 2014 Investor PresentationWEG
 
WEG Q3 2013 Conference Call
WEG Q3 2013 Conference CallWEG Q3 2013 Conference Call
WEG Q3 2013 Conference CallWEG
 
WEG 3T13 Apresentação de Resultados
WEG 3T13 Apresentação de ResultadosWEG 3T13 Apresentação de Resultados
WEG 3T13 Apresentação de ResultadosWEG
 
WEG 2T13 Apresentação de Resultados
WEG 2T13 Apresentação de ResultadosWEG 2T13 Apresentação de Resultados
WEG 2T13 Apresentação de ResultadosWEG
 
WEG Q2 2013 Conference Call
WEG Q2 2013 Conference CallWEG Q2 2013 Conference Call
WEG Q2 2013 Conference CallWEG
 
WEG 1T13 Apresentação de Resultados
WEG 1T13 Apresentação de ResultadosWEG 1T13 Apresentação de Resultados
WEG 1T13 Apresentação de ResultadosWEG
 
WEG Q1 2013 Conference Call
WEG Q1 2013 Conference CallWEG Q1 2013 Conference Call
WEG Q1 2013 Conference CallWEG
 
WEG Q4 2012 Conference Call
WEG Q4 2012 Conference CallWEG Q4 2012 Conference Call
WEG Q4 2012 Conference CallWEG
 
WEG 4T12 Apresentação de Resultados
WEG 4T12 Apresentação de ResultadosWEG 4T12 Apresentação de Resultados
WEG 4T12 Apresentação de ResultadosWEG
 
WEG Q2 2012 Conference Call
WEG Q2 2012 Conference CallWEG Q2 2012 Conference Call
WEG Q2 2012 Conference CallWEG
 
WEG 2T12 Apresentação de Resultados
WEG 2T12 Apresentação de ResultadosWEG 2T12 Apresentação de Resultados
WEG 2T12 Apresentação de ResultadosWEG
 
WEG Q3 2012 Conference Call
WEG Q3 2012 Conference CallWEG Q3 2012 Conference Call
WEG Q3 2012 Conference CallWEG
 
WEG 3T12 Apresentação de Resultados
WEG 3T12 Apresentação de ResultadosWEG 3T12 Apresentação de Resultados
WEG 3T12 Apresentação de ResultadosWEG
 
WEG 1T12 Apresentação de Resultados
WEG 1T12 Apresentação de ResultadosWEG 1T12 Apresentação de Resultados
WEG 1T12 Apresentação de ResultadosWEG
 

More from WEG (20)

WEG Q3 2016 INVESTOR PRESENTATION
WEG Q3 2016 INVESTOR PRESENTATIONWEG Q3 2016 INVESTOR PRESENTATION
WEG Q3 2016 INVESTOR PRESENTATION
 
2014 07 24 2T14 Conference Call
2014 07 24 2T14 Conference Call2014 07 24 2T14 Conference Call
2014 07 24 2T14 Conference Call
 
2014 04 25 1T14 Conference Call
2014 04 25 1T14 Conference Call2014 04 25 1T14 Conference Call
2014 04 25 1T14 Conference Call
 
2014 02 27 4T13 Conference Call
2014 02 27 4T13 Conference Call2014 02 27 4T13 Conference Call
2014 02 27 4T13 Conference Call
 
Apresentação para Investidores Julho 2014
Apresentação para Investidores Julho 2014Apresentação para Investidores Julho 2014
Apresentação para Investidores Julho 2014
 
Q1 2014 Investor Presentation
Q1 2014 Investor PresentationQ1 2014 Investor Presentation
Q1 2014 Investor Presentation
 
Q1 2014 Investor Presentation
Q1 2014 Investor PresentationQ1 2014 Investor Presentation
Q1 2014 Investor Presentation
 
WEG Q3 2013 Conference Call
WEG Q3 2013 Conference CallWEG Q3 2013 Conference Call
WEG Q3 2013 Conference Call
 
WEG 3T13 Apresentação de Resultados
WEG 3T13 Apresentação de ResultadosWEG 3T13 Apresentação de Resultados
WEG 3T13 Apresentação de Resultados
 
WEG 2T13 Apresentação de Resultados
WEG 2T13 Apresentação de ResultadosWEG 2T13 Apresentação de Resultados
WEG 2T13 Apresentação de Resultados
 
WEG Q2 2013 Conference Call
WEG Q2 2013 Conference CallWEG Q2 2013 Conference Call
WEG Q2 2013 Conference Call
 
WEG 1T13 Apresentação de Resultados
WEG 1T13 Apresentação de ResultadosWEG 1T13 Apresentação de Resultados
WEG 1T13 Apresentação de Resultados
 
WEG Q1 2013 Conference Call
WEG Q1 2013 Conference CallWEG Q1 2013 Conference Call
WEG Q1 2013 Conference Call
 
WEG Q4 2012 Conference Call
WEG Q4 2012 Conference CallWEG Q4 2012 Conference Call
WEG Q4 2012 Conference Call
 
WEG 4T12 Apresentação de Resultados
WEG 4T12 Apresentação de ResultadosWEG 4T12 Apresentação de Resultados
WEG 4T12 Apresentação de Resultados
 
WEG Q2 2012 Conference Call
WEG Q2 2012 Conference CallWEG Q2 2012 Conference Call
WEG Q2 2012 Conference Call
 
WEG 2T12 Apresentação de Resultados
WEG 2T12 Apresentação de ResultadosWEG 2T12 Apresentação de Resultados
WEG 2T12 Apresentação de Resultados
 
WEG Q3 2012 Conference Call
WEG Q3 2012 Conference CallWEG Q3 2012 Conference Call
WEG Q3 2012 Conference Call
 
WEG 3T12 Apresentação de Resultados
WEG 3T12 Apresentação de ResultadosWEG 3T12 Apresentação de Resultados
WEG 3T12 Apresentação de Resultados
 
WEG 1T12 Apresentação de Resultados
WEG 1T12 Apresentação de ResultadosWEG 1T12 Apresentação de Resultados
WEG 1T12 Apresentação de Resultados
 

Recently uploaded

Methanex Investor Presentation (April 2024)
Methanex Investor Presentation (April 2024)Methanex Investor Presentation (April 2024)
Methanex Investor Presentation (April 2024)Methanex Corporation
 
如何办理密苏里大学堪萨斯分校毕业证(文凭)UMKC学位证书
如何办理密苏里大学堪萨斯分校毕业证(文凭)UMKC学位证书如何办理密苏里大学堪萨斯分校毕业证(文凭)UMKC学位证书
如何办理密苏里大学堪萨斯分校毕业证(文凭)UMKC学位证书Fir La
 
VIP Call Girl Amritsar 7001035870 Enjoy Call Girls With Our Escorts
VIP Call Girl Amritsar 7001035870 Enjoy Call Girls With Our EscortsVIP Call Girl Amritsar 7001035870 Enjoy Call Girls With Our Escorts
VIP Call Girl Amritsar 7001035870 Enjoy Call Girls With Our Escortssonatiwari757
 
VIP 7001035870 Find & Meet Hyderabad Call Girls Shamirpet high-profile Call Girl
VIP 7001035870 Find & Meet Hyderabad Call Girls Shamirpet high-profile Call GirlVIP 7001035870 Find & Meet Hyderabad Call Girls Shamirpet high-profile Call Girl
VIP 7001035870 Find & Meet Hyderabad Call Girls Shamirpet high-profile Call Girladitipandeya
 
Russian Call Girls Kolkata Amaira 🤌 8250192130 🚀 Vip Call Girls Kolkata
Russian Call Girls Kolkata Amaira 🤌  8250192130 🚀 Vip Call Girls KolkataRussian Call Girls Kolkata Amaira 🤌  8250192130 🚀 Vip Call Girls Kolkata
Russian Call Girls Kolkata Amaira 🤌 8250192130 🚀 Vip Call Girls Kolkataanamikaraghav4
 
VIP 7001035870 Find & Meet Hyderabad Call Girls Shamshabad high-profile Call ...
VIP 7001035870 Find & Meet Hyderabad Call Girls Shamshabad high-profile Call ...VIP 7001035870 Find & Meet Hyderabad Call Girls Shamshabad high-profile Call ...
VIP 7001035870 Find & Meet Hyderabad Call Girls Shamshabad high-profile Call ...aditipandeya
 
CALL ON ➥8923113531 🔝Call Girls Fazullaganj Lucknow best sexual service
CALL ON ➥8923113531 🔝Call Girls Fazullaganj Lucknow best sexual serviceCALL ON ➥8923113531 🔝Call Girls Fazullaganj Lucknow best sexual service
CALL ON ➥8923113531 🔝Call Girls Fazullaganj Lucknow best sexual serviceanilsa9823
 
VIP 7001035870 Find & Meet Hyderabad Call Girls Abids high-profile Call Girl
VIP 7001035870 Find & Meet Hyderabad Call Girls Abids high-profile Call GirlVIP 7001035870 Find & Meet Hyderabad Call Girls Abids high-profile Call Girl
VIP 7001035870 Find & Meet Hyderabad Call Girls Abids high-profile Call Girladitipandeya
 
Cyberagent_For New Investors_EN_240424.pdf
Cyberagent_For New Investors_EN_240424.pdfCyberagent_For New Investors_EN_240424.pdf
Cyberagent_For New Investors_EN_240424.pdfCyberAgent, Inc.
 
Short-, Mid-, and Long-term gxxoals.pptx
Short-, Mid-, and Long-term gxxoals.pptxShort-, Mid-, and Long-term gxxoals.pptx
Short-, Mid-, and Long-term gxxoals.pptxHenryBriggs2
 
OKC Thunder Reveal Game 2 Playoff T Shirts
OKC Thunder Reveal Game 2 Playoff T ShirtsOKC Thunder Reveal Game 2 Playoff T Shirts
OKC Thunder Reveal Game 2 Playoff T Shirtsrahman018755
 

Recently uploaded (20)

Rohini Sector 17 Call Girls Delhi 9999965857 @Sabina Saikh No Advance
Rohini Sector 17 Call Girls Delhi 9999965857 @Sabina Saikh No AdvanceRohini Sector 17 Call Girls Delhi 9999965857 @Sabina Saikh No Advance
Rohini Sector 17 Call Girls Delhi 9999965857 @Sabina Saikh No Advance
 
Methanex Investor Presentation (April 2024)
Methanex Investor Presentation (April 2024)Methanex Investor Presentation (April 2024)
Methanex Investor Presentation (April 2024)
 
如何办理密苏里大学堪萨斯分校毕业证(文凭)UMKC学位证书
如何办理密苏里大学堪萨斯分校毕业证(文凭)UMKC学位证书如何办理密苏里大学堪萨斯分校毕业证(文凭)UMKC学位证书
如何办理密苏里大学堪萨斯分校毕业证(文凭)UMKC学位证书
 
VIP Call Girl Amritsar 7001035870 Enjoy Call Girls With Our Escorts
VIP Call Girl Amritsar 7001035870 Enjoy Call Girls With Our EscortsVIP Call Girl Amritsar 7001035870 Enjoy Call Girls With Our Escorts
VIP Call Girl Amritsar 7001035870 Enjoy Call Girls With Our Escorts
 
VIP 7001035870 Find & Meet Hyderabad Call Girls Shamirpet high-profile Call Girl
VIP 7001035870 Find & Meet Hyderabad Call Girls Shamirpet high-profile Call GirlVIP 7001035870 Find & Meet Hyderabad Call Girls Shamirpet high-profile Call Girl
VIP 7001035870 Find & Meet Hyderabad Call Girls Shamirpet high-profile Call Girl
 
Russian Call Girls Kolkata Amaira 🤌 8250192130 🚀 Vip Call Girls Kolkata
Russian Call Girls Kolkata Amaira 🤌  8250192130 🚀 Vip Call Girls KolkataRussian Call Girls Kolkata Amaira 🤌  8250192130 🚀 Vip Call Girls Kolkata
Russian Call Girls Kolkata Amaira 🤌 8250192130 🚀 Vip Call Girls Kolkata
 
Escort Service Call Girls In Shalimar Bagh, 99530°56974 Delhi NCR
Escort Service Call Girls In Shalimar Bagh, 99530°56974 Delhi NCREscort Service Call Girls In Shalimar Bagh, 99530°56974 Delhi NCR
Escort Service Call Girls In Shalimar Bagh, 99530°56974 Delhi NCR
 
VIP 7001035870 Find & Meet Hyderabad Call Girls Shamshabad high-profile Call ...
VIP 7001035870 Find & Meet Hyderabad Call Girls Shamshabad high-profile Call ...VIP 7001035870 Find & Meet Hyderabad Call Girls Shamshabad high-profile Call ...
VIP 7001035870 Find & Meet Hyderabad Call Girls Shamshabad high-profile Call ...
 
Model Call Girl in Uttam Nagar Delhi reach out to us at 🔝9953056974🔝
Model Call Girl in Uttam Nagar Delhi reach out to us at 🔝9953056974🔝Model Call Girl in Uttam Nagar Delhi reach out to us at 🔝9953056974🔝
Model Call Girl in Uttam Nagar Delhi reach out to us at 🔝9953056974🔝
 
CALL ON ➥8923113531 🔝Call Girls Fazullaganj Lucknow best sexual service
CALL ON ➥8923113531 🔝Call Girls Fazullaganj Lucknow best sexual serviceCALL ON ➥8923113531 🔝Call Girls Fazullaganj Lucknow best sexual service
CALL ON ➥8923113531 🔝Call Girls Fazullaganj Lucknow best sexual service
 
VIP 7001035870 Find & Meet Hyderabad Call Girls Abids high-profile Call Girl
VIP 7001035870 Find & Meet Hyderabad Call Girls Abids high-profile Call GirlVIP 7001035870 Find & Meet Hyderabad Call Girls Abids high-profile Call Girl
VIP 7001035870 Find & Meet Hyderabad Call Girls Abids high-profile Call Girl
 
Russian Call Girls Rohini Sector 22 💓 Delhi 9999965857 @Sabina Modi VVIP MODE...
Russian Call Girls Rohini Sector 22 💓 Delhi 9999965857 @Sabina Modi VVIP MODE...Russian Call Girls Rohini Sector 22 💓 Delhi 9999965857 @Sabina Modi VVIP MODE...
Russian Call Girls Rohini Sector 22 💓 Delhi 9999965857 @Sabina Modi VVIP MODE...
 
(👉゚9999965857 ゚)👉 VIP Call Girls Greater Noida 👉 Delhi 👈 : 9999 Cash Payment...
(👉゚9999965857 ゚)👉 VIP Call Girls Greater Noida  👉 Delhi 👈 : 9999 Cash Payment...(👉゚9999965857 ゚)👉 VIP Call Girls Greater Noida  👉 Delhi 👈 : 9999 Cash Payment...
(👉゚9999965857 ゚)👉 VIP Call Girls Greater Noida 👉 Delhi 👈 : 9999 Cash Payment...
 
Cyberagent_For New Investors_EN_240424.pdf
Cyberagent_For New Investors_EN_240424.pdfCyberagent_For New Investors_EN_240424.pdf
Cyberagent_For New Investors_EN_240424.pdf
 
@9999965857 🫦 Sexy Desi Call Girls Vaishali 💓 High Profile Escorts Delhi 🫶
@9999965857 🫦 Sexy Desi Call Girls Vaishali 💓 High Profile Escorts Delhi 🫶@9999965857 🫦 Sexy Desi Call Girls Vaishali 💓 High Profile Escorts Delhi 🫶
@9999965857 🫦 Sexy Desi Call Girls Vaishali 💓 High Profile Escorts Delhi 🫶
 
Short-, Mid-, and Long-term gxxoals.pptx
Short-, Mid-, and Long-term gxxoals.pptxShort-, Mid-, and Long-term gxxoals.pptx
Short-, Mid-, and Long-term gxxoals.pptx
 
OKC Thunder Reveal Game 2 Playoff T Shirts
OKC Thunder Reveal Game 2 Playoff T ShirtsOKC Thunder Reveal Game 2 Playoff T Shirts
OKC Thunder Reveal Game 2 Playoff T Shirts
 
Call Girls 🫤 Mahipalpur ➡️ 9999965857 ➡️ Delhi 🫦 Russian Escorts FULL ENJOY
Call Girls 🫤 Mahipalpur ➡️ 9999965857  ➡️ Delhi 🫦  Russian Escorts FULL ENJOYCall Girls 🫤 Mahipalpur ➡️ 9999965857  ➡️ Delhi 🫦  Russian Escorts FULL ENJOY
Call Girls 🫤 Mahipalpur ➡️ 9999965857 ➡️ Delhi 🫦 Russian Escorts FULL ENJOY
 
Call Girls 🫤 East Of Kailash ➡️ 9999965857 ➡️ Delhi 🫦 Russian Escorts FULL ...
Call Girls 🫤 East Of Kailash ➡️ 9999965857  ➡️ Delhi 🫦  Russian Escorts FULL ...Call Girls 🫤 East Of Kailash ➡️ 9999965857  ➡️ Delhi 🫦  Russian Escorts FULL ...
Call Girls 🫤 East Of Kailash ➡️ 9999965857 ➡️ Delhi 🫦 Russian Escorts FULL ...
 
Call Girls 🫤 Hauz Khas ➡️ 9999965857 ➡️ Delhi 🫦 Russian Escorts FULL ENJOY
Call Girls 🫤 Hauz Khas ➡️ 9999965857  ➡️ Delhi 🫦  Russian Escorts FULL ENJOYCall Girls 🫤 Hauz Khas ➡️ 9999965857  ➡️ Delhi 🫦  Russian Escorts FULL ENJOY
Call Girls 🫤 Hauz Khas ➡️ 9999965857 ➡️ Delhi 🫦 Russian Escorts FULL ENJOY
 

CS Conference 2012

  • 1. Motors | Automation | Energy | T&D | Paints Credit Suisse Equity Ideas Conference 2012 January, 2012 WEGE3 / WEGZY
  • 2. Disclaimer The information contained herein has been prepared by WEG S.A. (“WEG” or the “Company”) solely for meetings held with investors and/or potential investors. This material does not constitute offering material in whole or part, and you must obtain further information before making an investment decision in respect of the common shares of the Company. This material has been prepared solely for informational purposes and is not to be construed as a solicitation or an offer to buy or sell any securities and should not be treated as giving investment advice. It is not targeted to the specific investment objectives, financial situation or particular needs of any recipient. No representation or warranty, either express or implied, is made as to the accuracy, completeness or reliability of the information contained herein. It should not be regarded by recipients as a substitute for the exercise of their own judgment. Any opinions expressed in this material are subject to change without notice and WEG is not under obligation to update or keep current the information contained herein. In addition, WEG has been informed that their affiliates, agents, directors, partners and employees may make purchases and/or sales as principals or may act as market makers or provide investment banking or other services to the Company. The Company and their respective affiliates, agents, directors, partners and employees accept no liability whatsoever for any loss or damage of any kind arising out of the use of all or any part of this material. You should consult your own legal, regulatory, tax, business, investment, financial and accounting advisers to the extent that you deem necessary, and you must make your own investment, hedging or trading decision based upon your own judgment and advice from such advisers as you deem necessary and not upon any view expressed in this material. This material includes forward-looking statements subject to risks and uncertainties, which are based on current expectations and projections about future events and trends that may affect the Company’s business. These statements include projections of economic growth and energy demand and supply, as well as information about competitive position, the regulatory environment, potential opportunities for growth and other matters. Several factors may adversely affect the estimates and assumptions on which these statements are based, many of which are beyond our control. 1
  • 3. Business Units Transmission Motors Automation Energy Coatings & Distribution Page 2
  • 4. Our business Services Speed Variation Power Motors Transformers Subestations Generation Generators Electric Electrical Panels Components Industrial Automation Liquid and powder Coatings and industrial Varnishes Page 3
  • 5. Business areas Electro- Generation, Motors for Industrial Electronic Transmission Domestic Use Paints and Industrial and Varnishes Equipments Distribution Business Motors + Energy + T&D + Units Automation Automation Motors Coatings Industrial Production Growth in Disposable income, Performance growth and investments in supply of credit and Brazilian GDP Investments in electric enrgy level of interest growth Drivers Fixed Capital (capex) infrastructure rates Page 4
  • 6. Industrial segments Today, WEG offers solutions for a wide variety of segments Oil & Gas Shipbuilding Mining, Cement and Aggregate Sugar & Ethanol Pulp & Paper Steel Infrastructure Energy Food & Beverage Page 5
  • 7. Revenues breakdown per Production site INDIA 2010 Manufactured CHINA in Brazil, Sold abroad; 32% MEXICO MEXICO Manufactured Manufactured and sold & sold in Brazil; abroad; 7% 61% PORTUGAL ARGENTINA
  • 8. Revenues breakdown per distribution channel 2010 OEM; 58% Reseller; 14% End user; 28%
  • 9. Revenues by Business Area 5.471 5.111 5.283 5% 6% 7% 4.551 12% 4.405 6% 12% 15% 7% 14% 11% 3.527 27% 6% 26% 2.978 34% 24% 2.603 6% 15% 23% 6% 18% 18% 21% 14% 10% 59% 55% 54% 62% 61% 57% 48% 63% 2004 2005 2006 2007 2008 2009 2010 9M2011 Equipamentos Eletro-eletrônicos Industrais Energia Geração, Transmissão e Distribuição Motores para Eletrodomésticos Tintas e Vernizes Page 8
  • 10. Shareholding structure Voigt Silva Werninghaus 33.3% 33.3% 33.3% WPA Members of Treasury Participações Free Float Control Group Shares e Serviços S/A 14.4% 50.9% 0.1% 34.6% WEG S.A. Page 9
  • 11. 1995 353 Page 10 1996 372 1997 466 1998 527 1999 628 2000 800 CAGR 17% 2001 1.066 growth 2002 1.282 2003 1.694 2004 2.204 Net Revenues (R$) 2005 2.515 2006 3.009 2007 3.749 2008 4.502 2009 4.211 2010 4.392 1995 80 23% 1996 84 1997 106 Consistent and profitable 1998 135 1999 146 23% 23% 2000 207 26% 26% CAGR 16% EBITDA (R$) 2001 291 27% 2002 327 26% 2003 435 2004 487 2005 504 20% 2006 666 2007 923 25% 2008 1.026 22% 22% 23% 2009 837 20% 2010 789 18%
  • 12. Highlights Third Quarter, 2011 Q3 2011 Q2 2011 Growth % Q3 2010 Growth % Gross Operating Revenue 1.552.044 1.510.276 2,8% 1.419.160 9,4% Domestic Market 953.515 936.061 1,9% 906.954 5,1% External Markets 598.529 574.215 4,2% 512.207 16,9% External Markets in US$ 364.730 360.639 1,1% 298.020 22,4% Net Operating Revenue 1.317.483 1.277.258 3,1% 1.188.622 10,8% Gross Operating Profit 418.266 381.437 9,7% 377.227 10,9% Gross Margin 31,7% 29,9% 31,7% Net Income 154.567 154.557 0,0% 142.106 8,8% Net Margin 11,7% 12,1% 12,0% EBITDA 243.743 215.579 13,1% 209.196 16,5% EBITDA Margin 18,5% 16,9% 17,6% EPS 0,2491 0,2491 0,0% 0,2289 8,9% Figures in R$ Thousands Page 11
  • 13. Positioned to benefit from mega trends Energy Management Renewable Energy Industrial electricity consumption is the Global need to diversify energy largest portion of global consumption sources and lower GHG emissions Management systems (ISO 50.001) Scale and technological development already being implemented increase viability Smart Infrastructure Mobility Electricity distribution network has to Increasing urbanization adds to become “smarter” congestions and need of new solutions More sensors, more automation, more Hybrids, pure electric and alternative efficient generation and use of electricity fuels vehicles will become more important Page 12
  • 14. Energy Management Electric motors has unique characteristics Total Cos t of Owner ship of a Electric M o tor (*) Specifications must be exact. Acquisitio Everything affects energy n 1,4% efficiency Maintena “Similar” motors are not nce 1,6% economical, even if much cheaper to acquire Energy Consump Differences become more tion 97% evident when energy prices go up Return on energy efficiency (*) Consid investments are very attractive ering use ful life of 10 years Page 13
  • 15. Energy Management Harmonization of energy efficiency regulations IE 4 Conversion of energy (efficiency) (Super premium) No regulatory obligation as of today IE 3 (NEMA Premium (effective 2015) (Premium) efficiency) IE 2 NEMA Energy (High) Efficiency IE 1 (Standard) Most developing markets Page 14
  • 16. Renewable Energy Brazil’s electricity is already clean, but it can get cleaner 180.000  160.000  8% CAGR Biomass - 5% CAGR 140.000  Small Hydro – 6% CAGR Wind - 17% CAGR 120.000  100.000  80.000  60.000  4% CAGR 40.000  20.000  5% CAGR ‐ 2010 2011 2012 2013 2014 2015 2016 2017 2018 2019 Fossil Fuels Large Hydro Renewables Nuclear Source: EPE - PDE 2019 Page 15
  • 17. Power grid must evolve and become smart Demand management SMART GRID: Applying sensing, Smart apliances Use can be shifted to off measurement and control devices with two- Can shut off in response peak times to save money way communications to dynamically to frequency fluctuations respond to changes in grid conditions Sensors Detected fluctuations and disturbances, and can signal Solar for areas to be isolated panels Houses Storages Offices Disturbance Energy generated at off peak times could be In the grid stored in batteries for later uses Storage Isolated microgrid Wind farm Processors Central power Execute special protection Generators plant schemes in microseconds Industrial Energy from small generators plant and solar panels can reduce overall demand on the grid 16
  • 18. Solutions for electric & hybrid vehicles Complete power train solution Electric motor (power train) Auxiliary Genset (ethanol, biodiesel or natural gas) Frequency inverter and components (system automation) Batteries Page 17
  • 19. WEG solutions for marine automation Automation Thrusters motors Transformers Generators Page 18
  • 20. Strategic Positioning Appliance Motors Industrial High Voltage Generators Power Biomass Systems Small Hydro Wind Power Dry T&D Distribution Substations Drives Automotion Controls Panels Gearbox New Biz Gensets Turbines
  • 21. Portfolio Strategy Market May 2010 November 2011 Access October 2011 November 2011 May 2010 May 2011 March 2011 June 2010 December 2010 Technology Page 20
  • 22. EM gives WEG to key technologies 2 pole turbo generator technology allows WEG to increase the power range: Previously, up to 65 MVA, 4 poles technology Now, up 120 MVA, American Petroleum Institute (API) compliant machinery New opportunities in supplying for: Gas turbines Steam turbines 21
  • 23. EM also allows WEG to increase presence in two important segments Oil & gas Crude and natural gas exploration (up and downstream) Oil-prices driven growth, both in new opportunities (i.e. pre-salt) as improving existing equipment Power generation Generators and electric motors for fans, water pumps, etc. Modernization of aging infrastructure Recertification of nuclear power plants Technology, reputation and relationships can be transferred to other markets / geographies 22
  • 24. WEG can leverage EM’s assets Sinergies from combining EM’s and WEG’s strenghts Brand recognition and reputation in Complete line of products, offering high-power rotating machines one stop shop solutions; (HPRM) Large commercial network across Deep and long standing key the world customer relationships Strong market presence in fast Oil and gas (in the vendor lists growing emerging economies, such of all majors) as Latin America Power generation Large installed base of more than 5,500 units in operation 23
  • 25. Power Transmission fits into efficiency theme Integration of different products and expertise Growing demand for integrated solutions Energy efficiency Operating performance Electric motor Gearbox Drives (electrical) (mechanical) (electronics) Page 24
  • 26. Gearboxes market can be divided in niches Commoditized Large volume, low margins Simple applications (conveyor belts, lathes, etc.) Up to 50 hp, with low efficiency and relatively simple engineering Customized Similar to WEG’s core industrial motors business (mass customization) More complex applications (mixers, extruders) All power ranges, higher efficiency and relatively higher engineering complexity Innovations One of a kind, similar to WEG’s HV core Highly complex applications (wind energy, mining) High efficiency, high engineering complexity Page 25
  • 27. Capex 457 349 226 233 206 146 126 125 111 2003 2004 2005 2006 2007 2008 2009 2010 9M2011 (R$ million) Page 26
  • 28. Dividend Pay-out Policy Net Earnings and Dividends (R$ million) 59% 55% 54% 54% 52% 44% 45% 43% 40% 40% 39% 575 37% 560 548 35% 520 503 403 375 308 299 301 300 306 276 220 229 176 173 165 150 125 124 82 29 46 68 89 1999 2000 2001 2002 2003 2004 2005 2006 2007 2008 2009 2010 6M2011 Net Earnings Dividends Pay-out (%) Page 27
  • 29. Growth Drivers & Opportunities New and improved products, focusing efficiency, reliability and features More integrated systems / complete solutions New markets / products, R&D and acquisitions and new geographies. Page 28
  • 30. Key takeaways Global growth driven by emerging economies, with massive infrastructure spending Energy management will become more important, with minimum performance standards (MEPS) regulations and standardization Growing importance of renewable sources of energy Smart infrastructure systems will demand smarter equipment Brazilian pre-salt oil development will demand significant investment Page 29
  • 31. Contacts www.weg.net/ri §Laurence Beltrão Gomes Investor Relations Officer laurence@weg.net § Luís Fernando M. Oliveira Investor Relations Manager +55 (47) 3276-6973 luisfernando@weg.net twitter.com/weg_ir
  • 32. Highlights Nine months of 2011 09M11 09M10 % Gross Operating Revenue 4.405.457 3.778.127 16,6% Domestic Market 2.752.439 2.539.463 8,4% External Markets 1.653.018 1.238.665 33,5% External Markets in US$ 1.013.580 700.290 44,7% Net Operating Revenue 3.720.858 3.133.544 18,7% Gross Operating Profit 1.110.365 995.652 11,5% Gross Margin 29,8% 31,8% Quarterly Net Income 430.688 378.273 13,9% Net Margin 11,6% 12,1% EPS EBITDA 624.130 564.961 10,5% EBITDA Margin 16,8% 18,0% Figures in R$ Thousands Page 31
  • 33. Highlights Assets Figures in R$ Thousands September 2011 December 2010 September 2010 R$ AV% R$ AV% R$ AV% 20 13 11 CURRENT ASSETS 5.742.007 66% 4.794.009 64% 4.628.280 63% Cash & cash equivalents 3.086.568 35% 2.552.996 34% 2.399.773 33% Receivables 1.162.056 13% 1.044.712 14% 1.026.652 14% Inventories 1.269.623 15% 1.008.952 13% 1.015.175 14% Other current assets 223.760 3% 187.349 2% 186.680 3% LONG TERM ASSETS 378.587 4% 136.984 2% 149.892 2% Long term securities 233.266 3% 0 0% 0 0% Deferred taxes 103.846 1% 78.810 1% 91.613 1% Other non-current assets 41.475 0% 58.174 1% 58.279 1% FIXED ASSETS 2.575.233 30% 2.580.171 34% 2.586.940 35% Investment in Subs 933 0% 601 0% 222 0% Property, Plant & Equipment 2.397.920 28% 2.395.575 32% 2.394.633 33% Intangibles 176.380 2% 183.995 2% 192.085 3% TOTAL ASSETS 8.695.827 100% 7.511.164 100% 7.365.112 100% Page 32
  • 34. Highlights Liabilities Figures in R$ Thousands September 2011 December 2010 September 2010 R$ AV% R$ AV% R$ AV% 20 13 11 CURRENT LIABILITIES 2.818.379 32% 1.938.803 26% 1.795.005 24% Social and Labor Liabilities 188.599 2% 141.797 2% 167.220 2% Suppliers 317.125 4% 242.300 3% 273.823 4% Fiscal and Tax Liabilities 63.632 1% 72.204 1% 73.452 1% Short Term Debt 1.797.222 21% 1.018.995 14% 841.311 11% Dividends Payable 47.903 1% 63.440 1% 32.052 0% Advances from Clients 239.143 3% 271.949 4% 233.844 3% Profit Sharring 39.348 0% 23.583 0% 34.050 0% Other Short Term Liabilities 125.407 1% 104.535 1% 139.253 2% LONG TERM LIABILITIES 2.167.388 25% 2.028.525 27% 2.126.673 29% Long Term Debt 1.491.765 17% 1.399.948 19% 1.503.836 20% Other Long Term Liabilities 129.275 1% 86.875 1% 92.250 1% Deferred Taxes 411.545 5% 415.318 6% 417.304 6% Contingencies Provisions 134.803 2% 126.384 2% 113.283 2% MINORITIES 98.709 1% 89.229 1% 85.991 1% STOCKHOLDERS' EQUITY 3.611.351 42% 3.454.607 46% 3.357.443 46% TOTAL LIABILITIES 8.695.827 100% 7.511.164 100% 7.365.112 100% Page 33
  • 35. Highlights Cash Flow Statement 9 Months 9 Months 2011 2010 12 8 Operating Activities Net Earnings before Taxes 554.075 524.849 Depreciation and Amortization 139.393 135.920 Earnings from Subs (Equity Method) - (1.687) Provisions: 92.160 73.387 Changes in Assets & Liabilities (494.815) (312.139) Cash Flow from Operating Activities 290.813 420.330 Investment Activities Fixed Assets (124.813) (248.847) Intagible Assets (2.462) (81.274) Asset Write Downs 2.472 18.995 Accumulated Conversion Adjustment 38.401 (25.050) Long term securities bought (233.266) - Cash Flow From Investment Activities (319.668) (336.176) Financing Activities Shares in Treasury (10.055) - Working Capital Financing 767.072 (44.289) Long Term Financing 102.972 516.903 Dividends & Intesrest on Stockholders Equity Paid (297.562) (284.112) Cash Flow From Financing Activities 562.427 188.502 Change in Cash Position 533.572 272.656 Cash & Cash Equivalents Beginning of Period 2.552.996 2.127.117 End of Period 3.086.568 2.399.773 Page 34