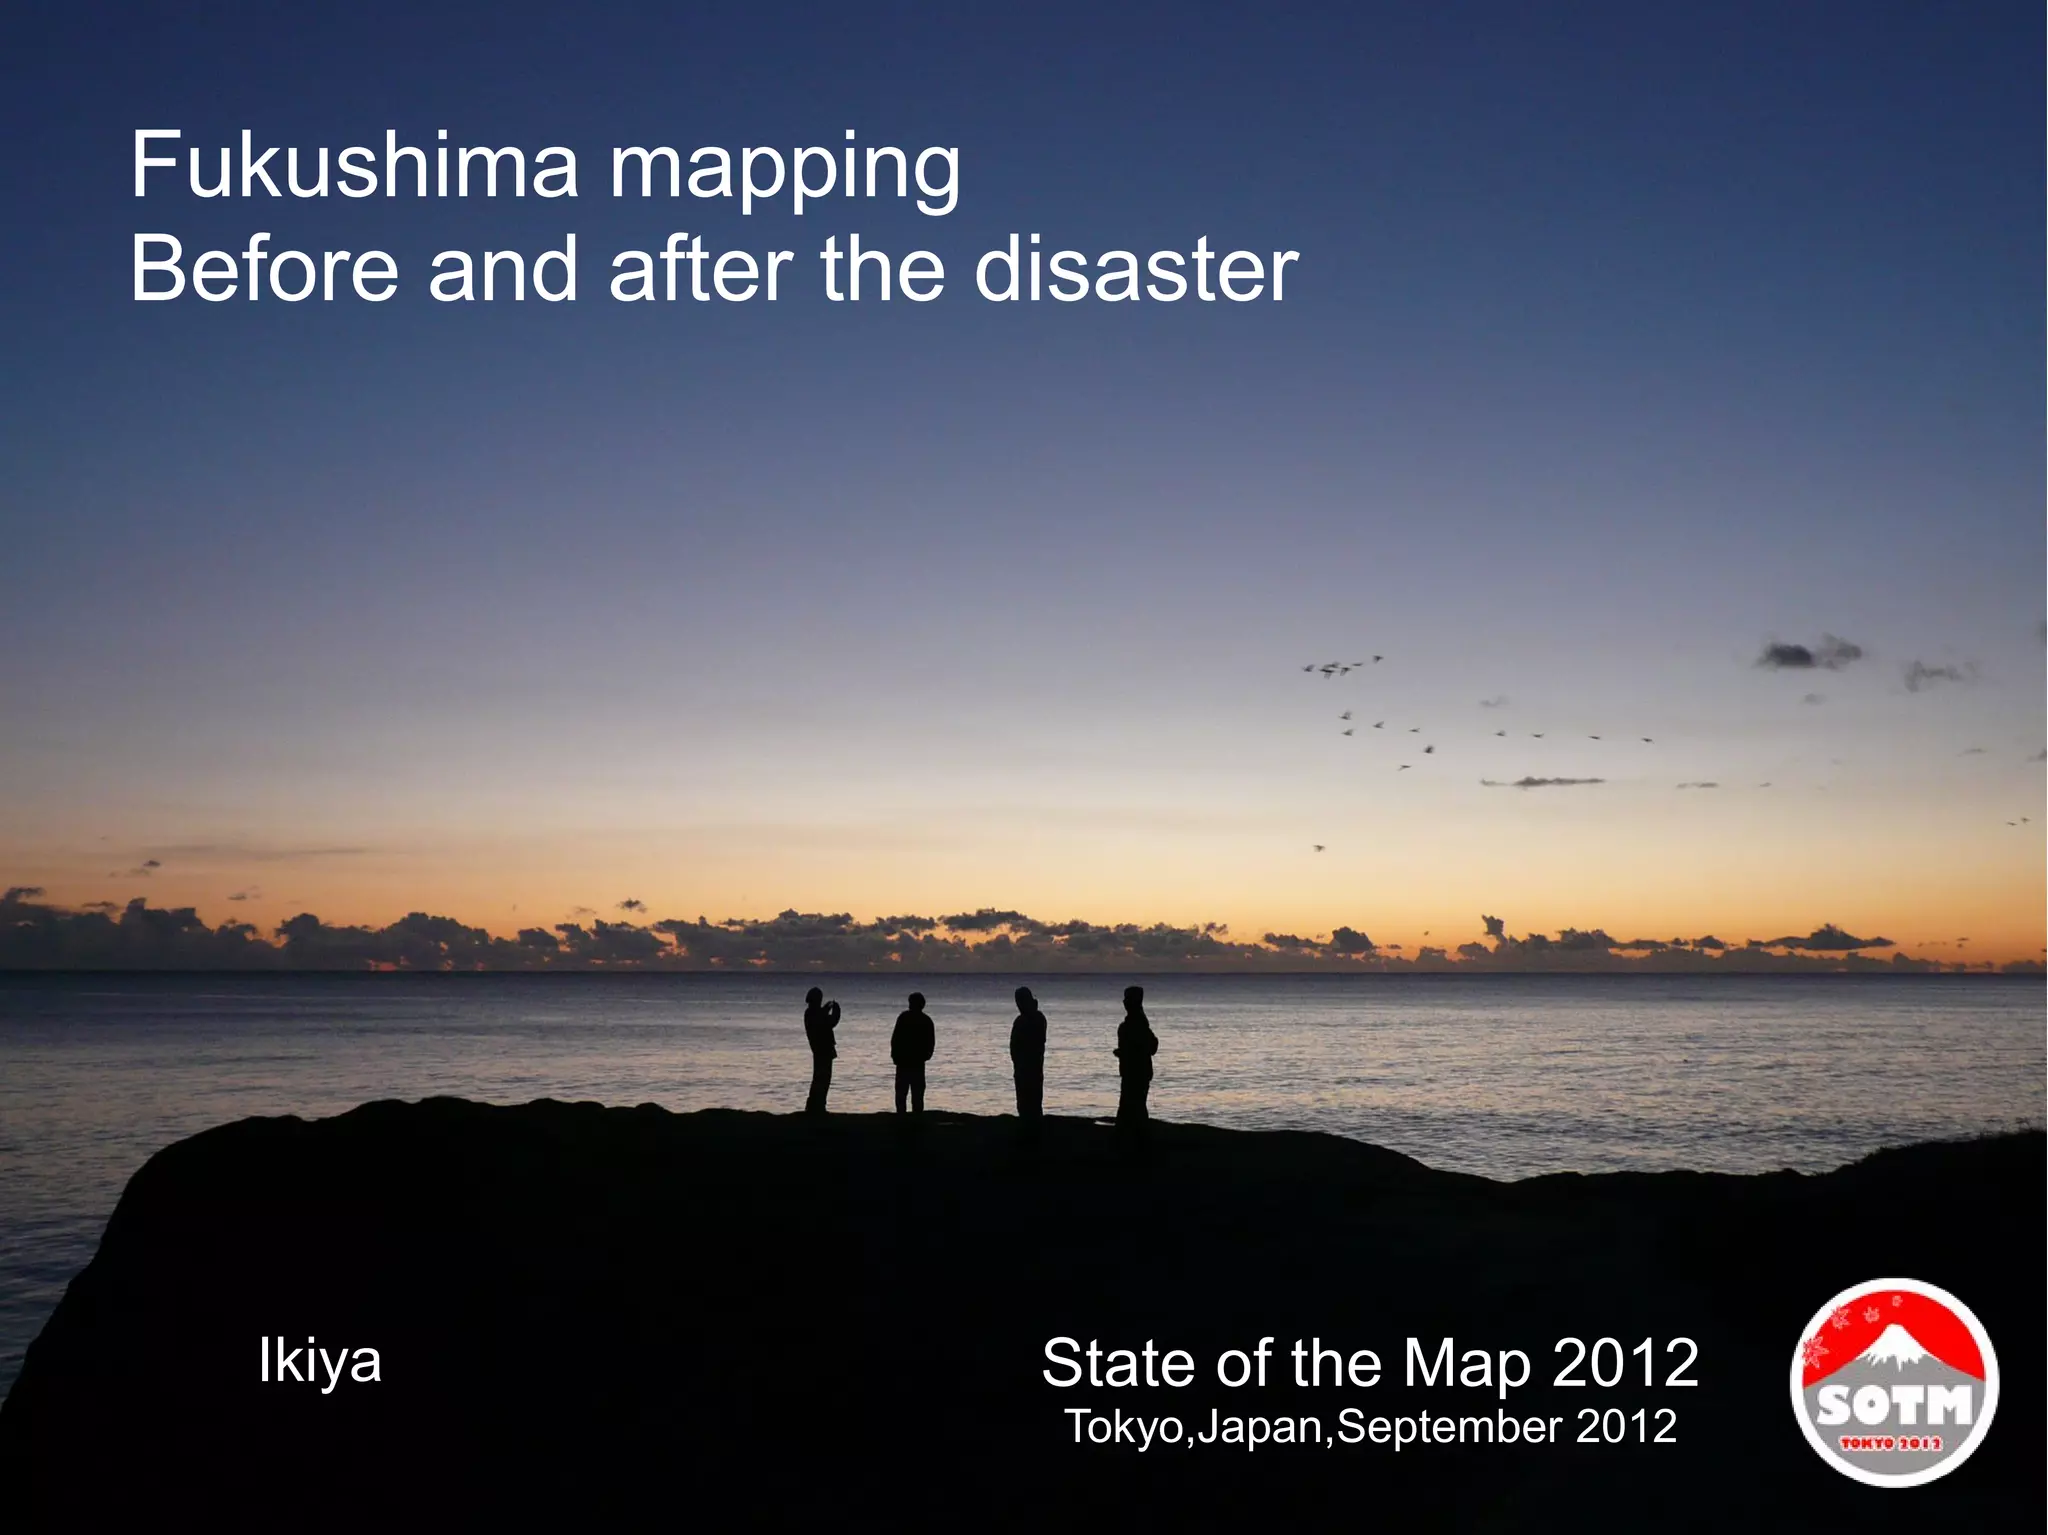
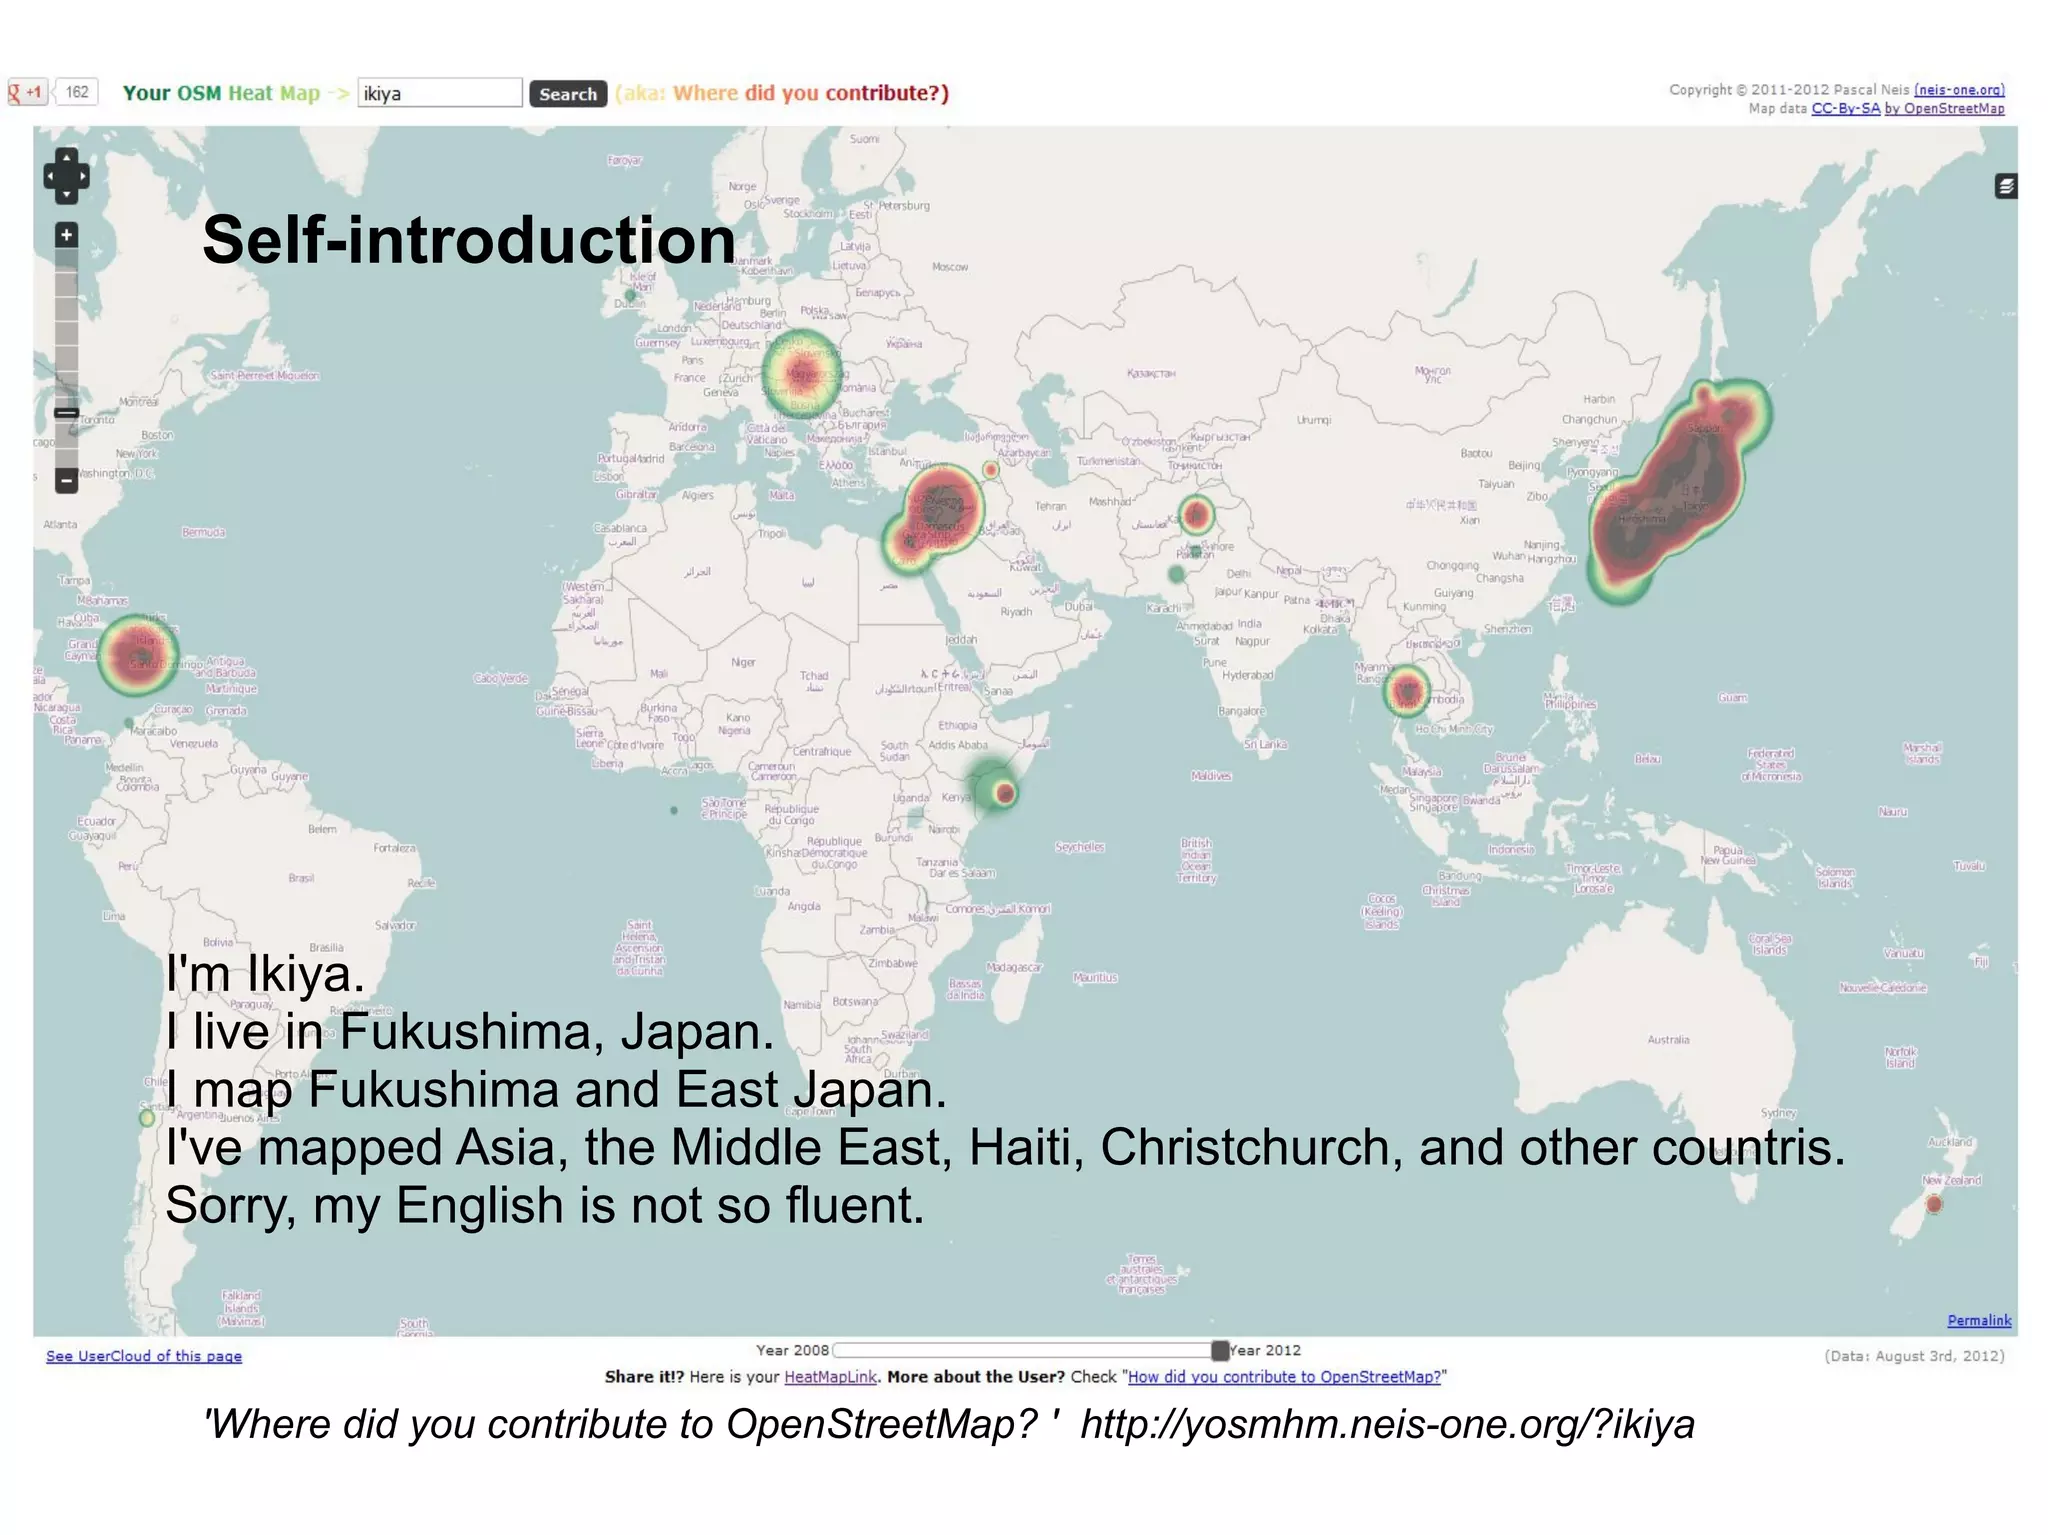
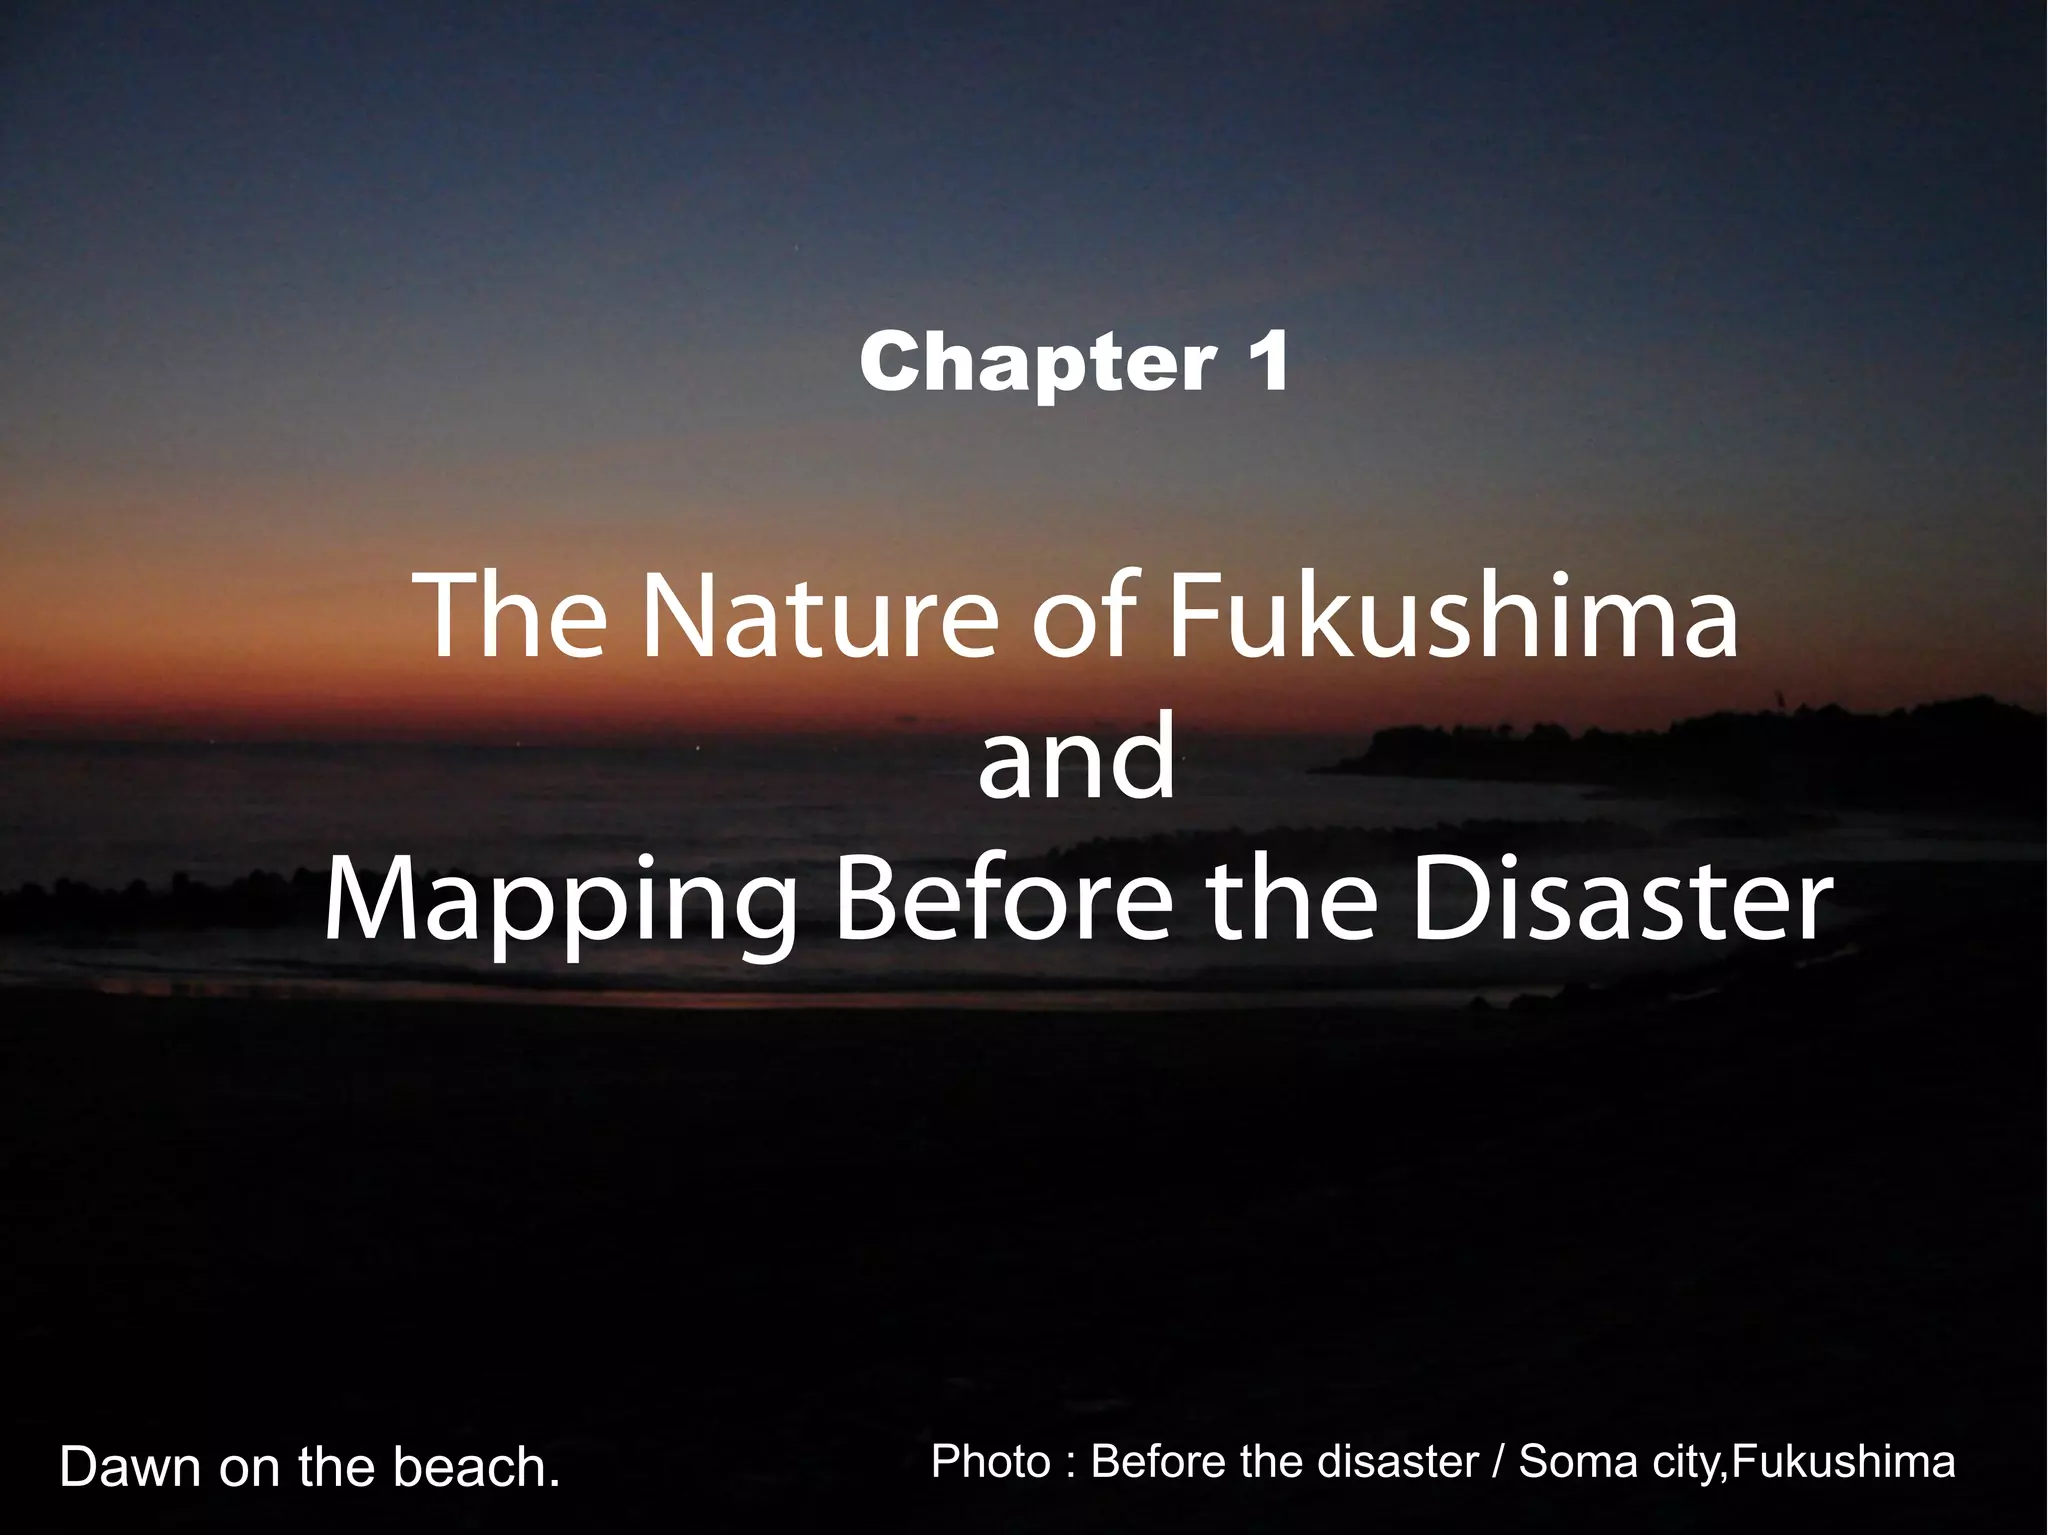
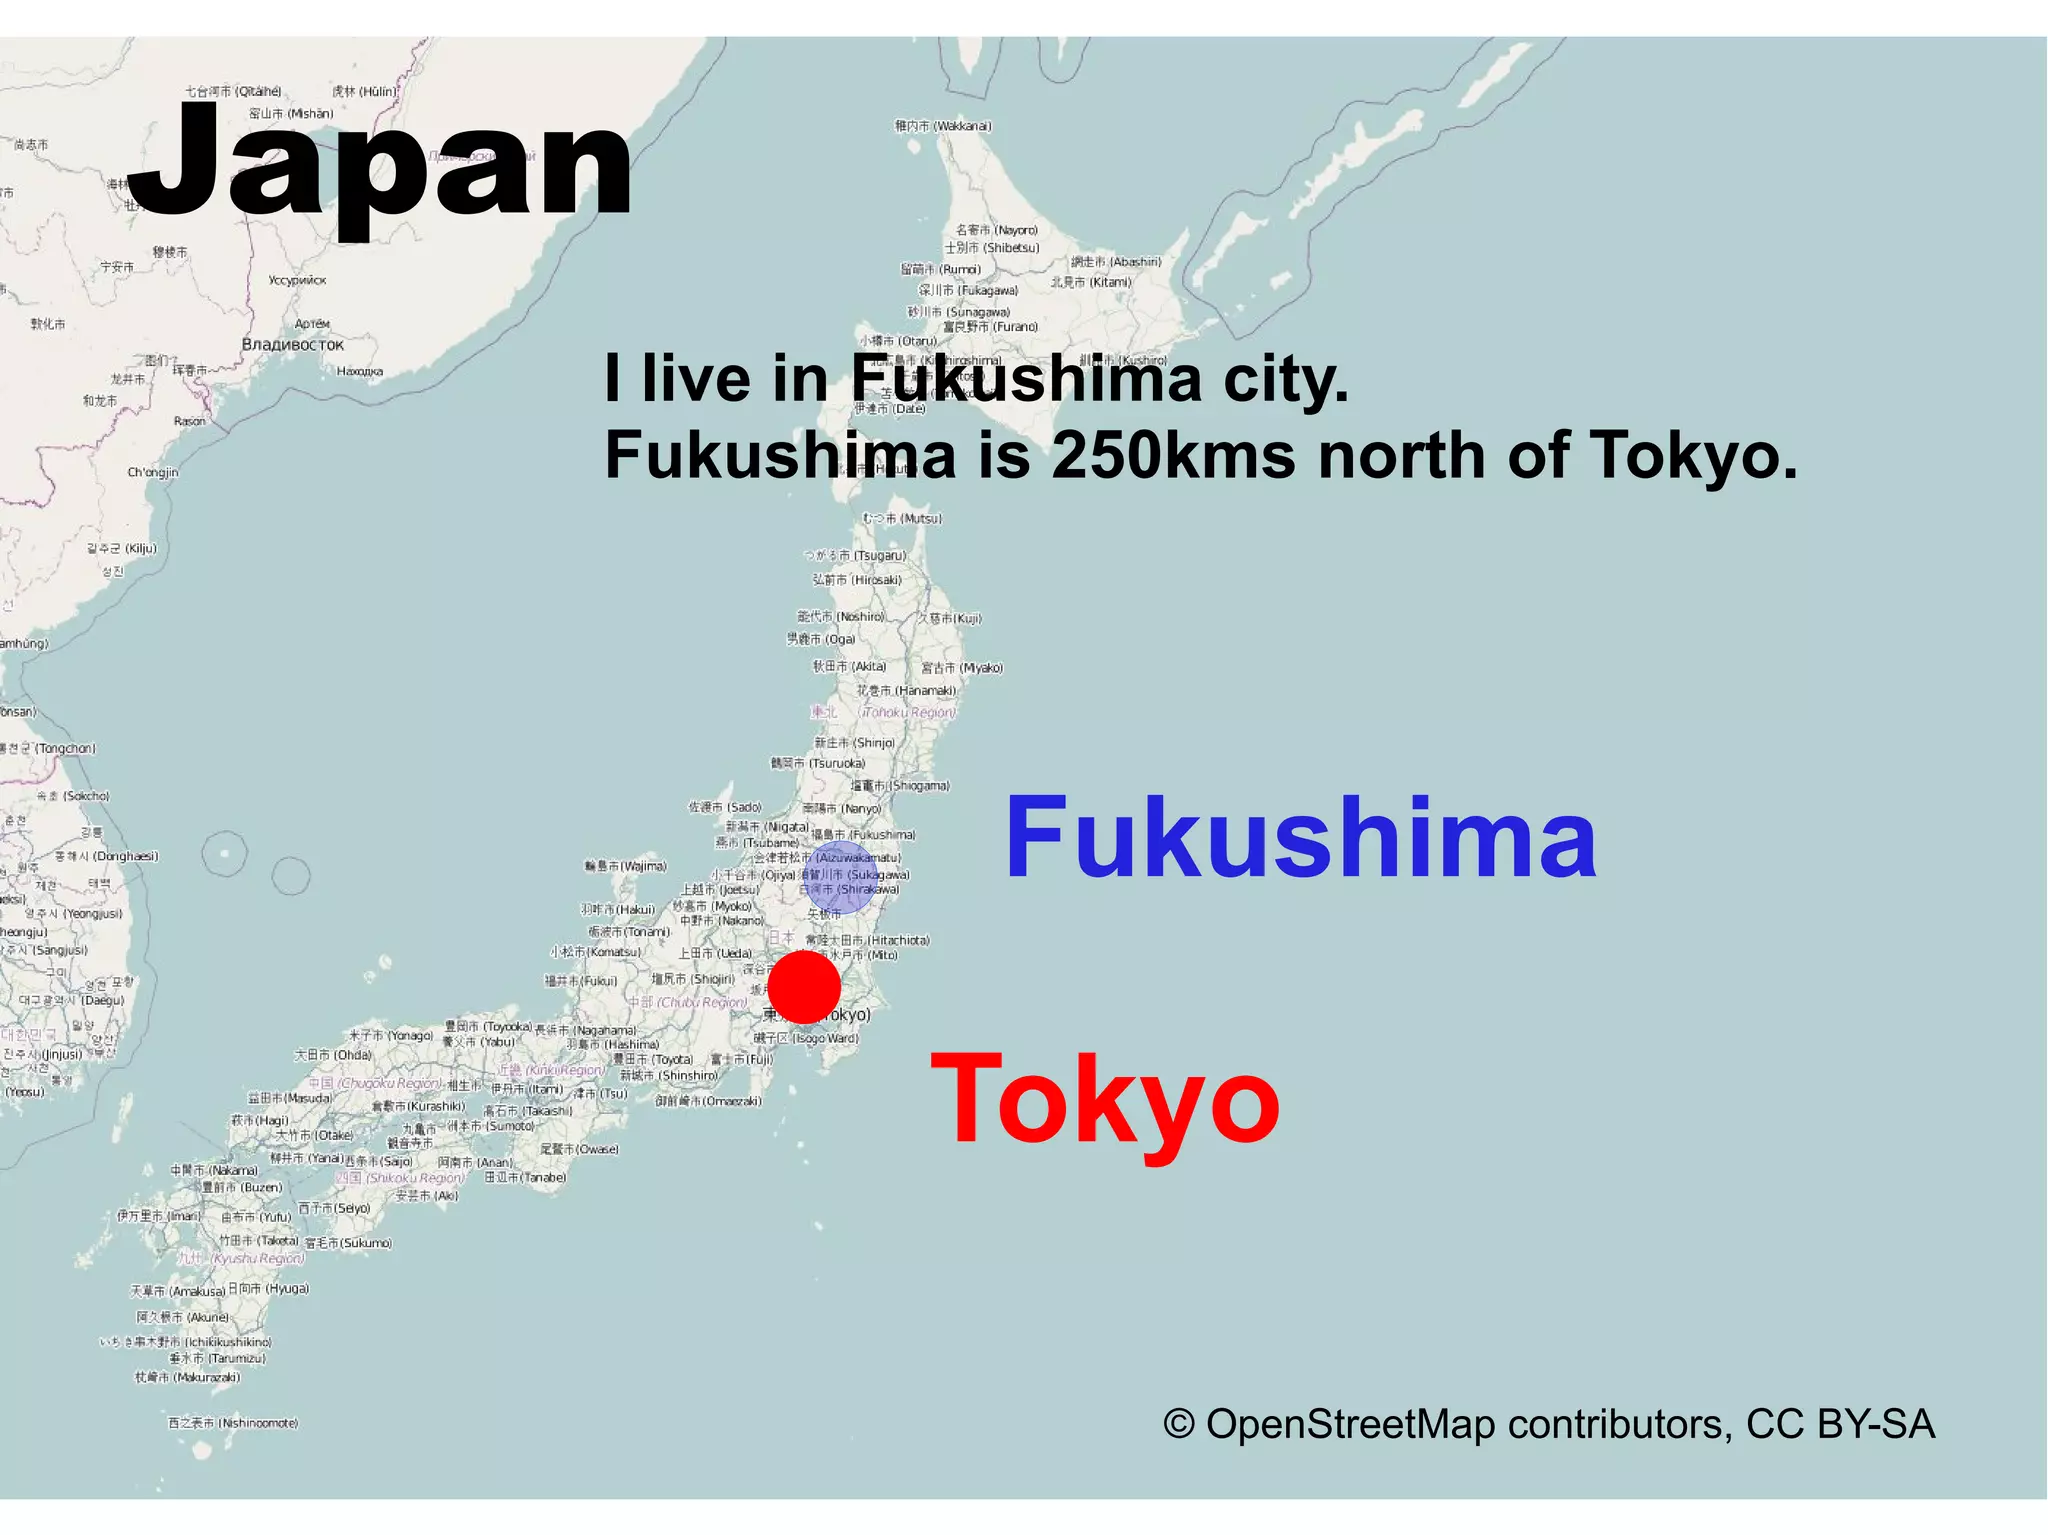
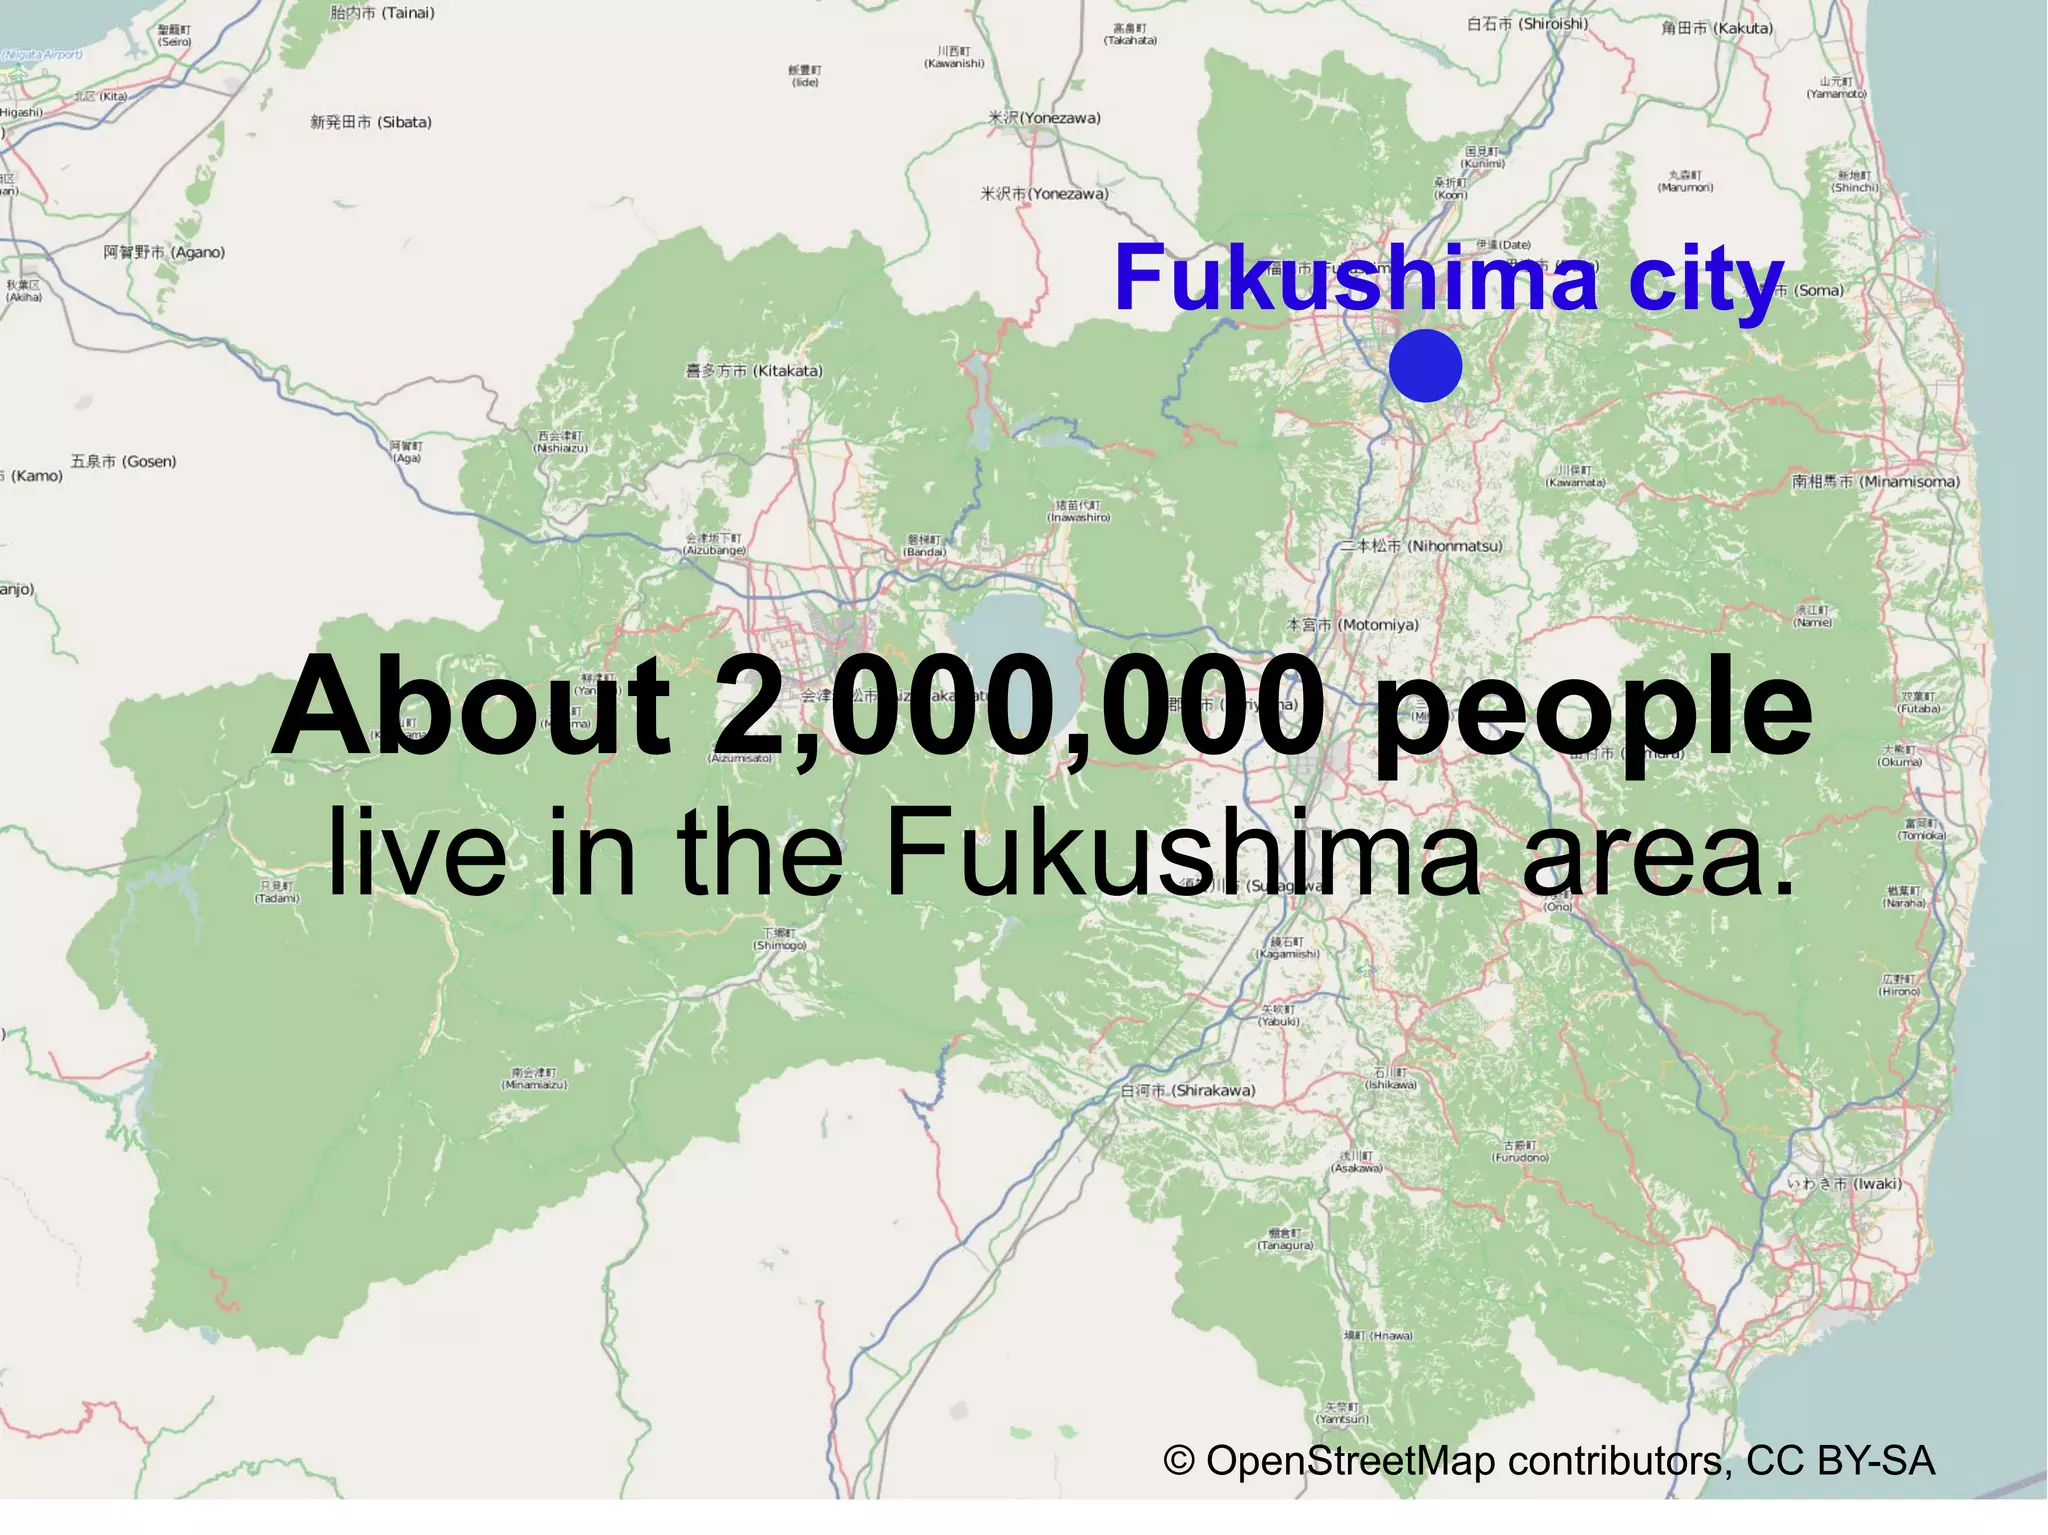
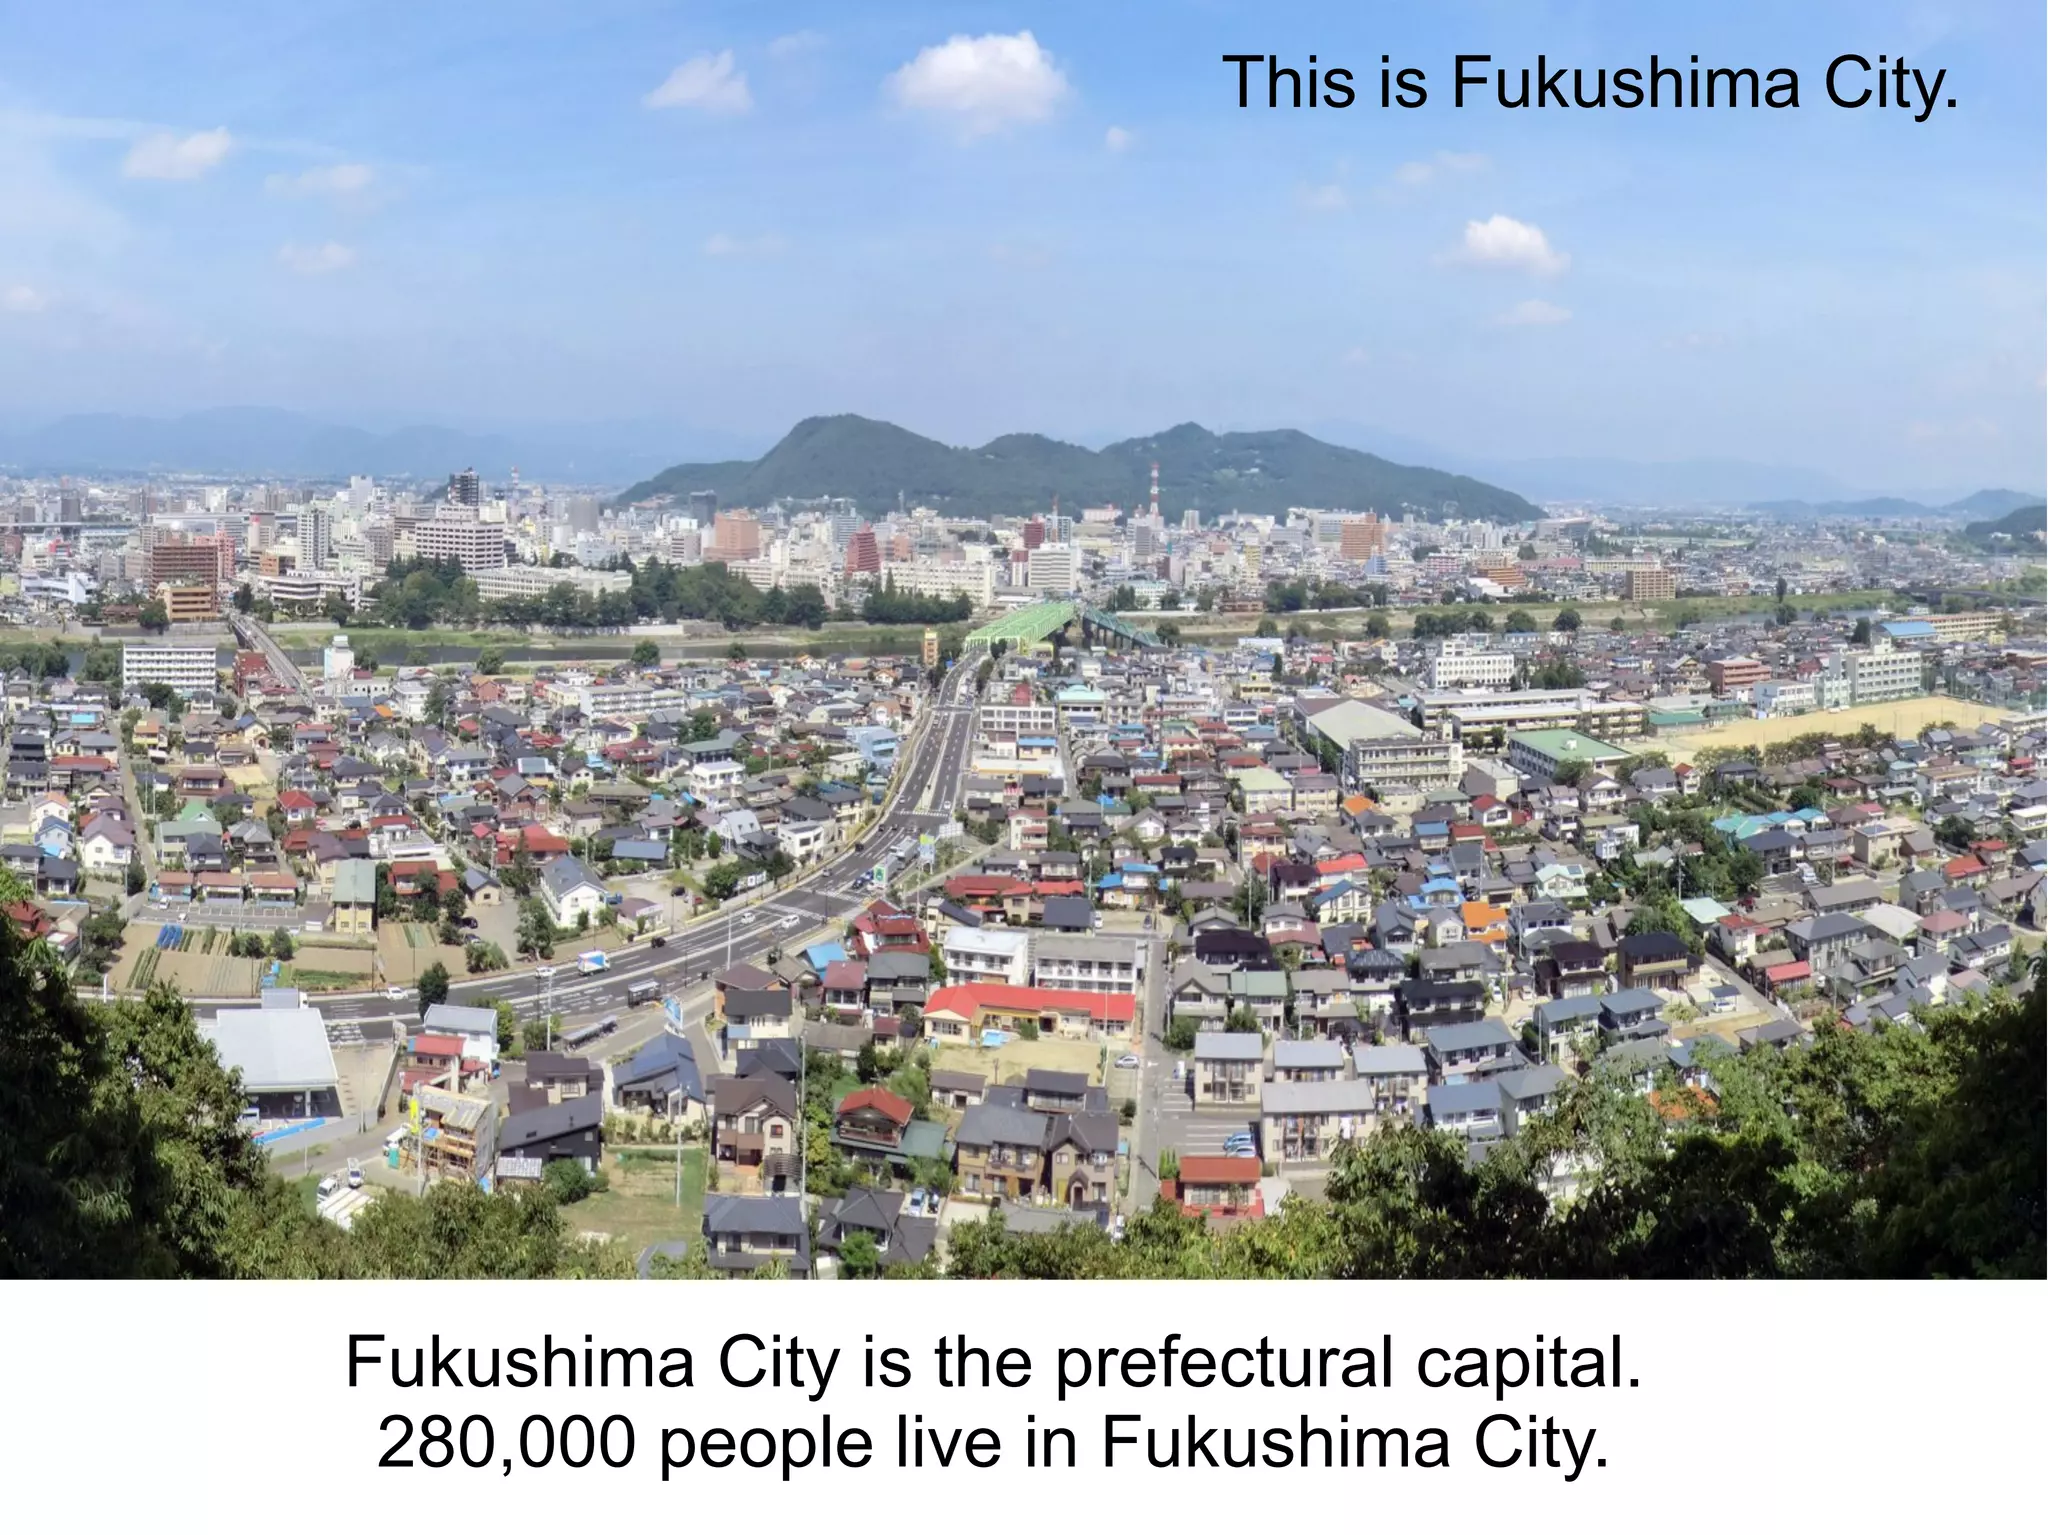
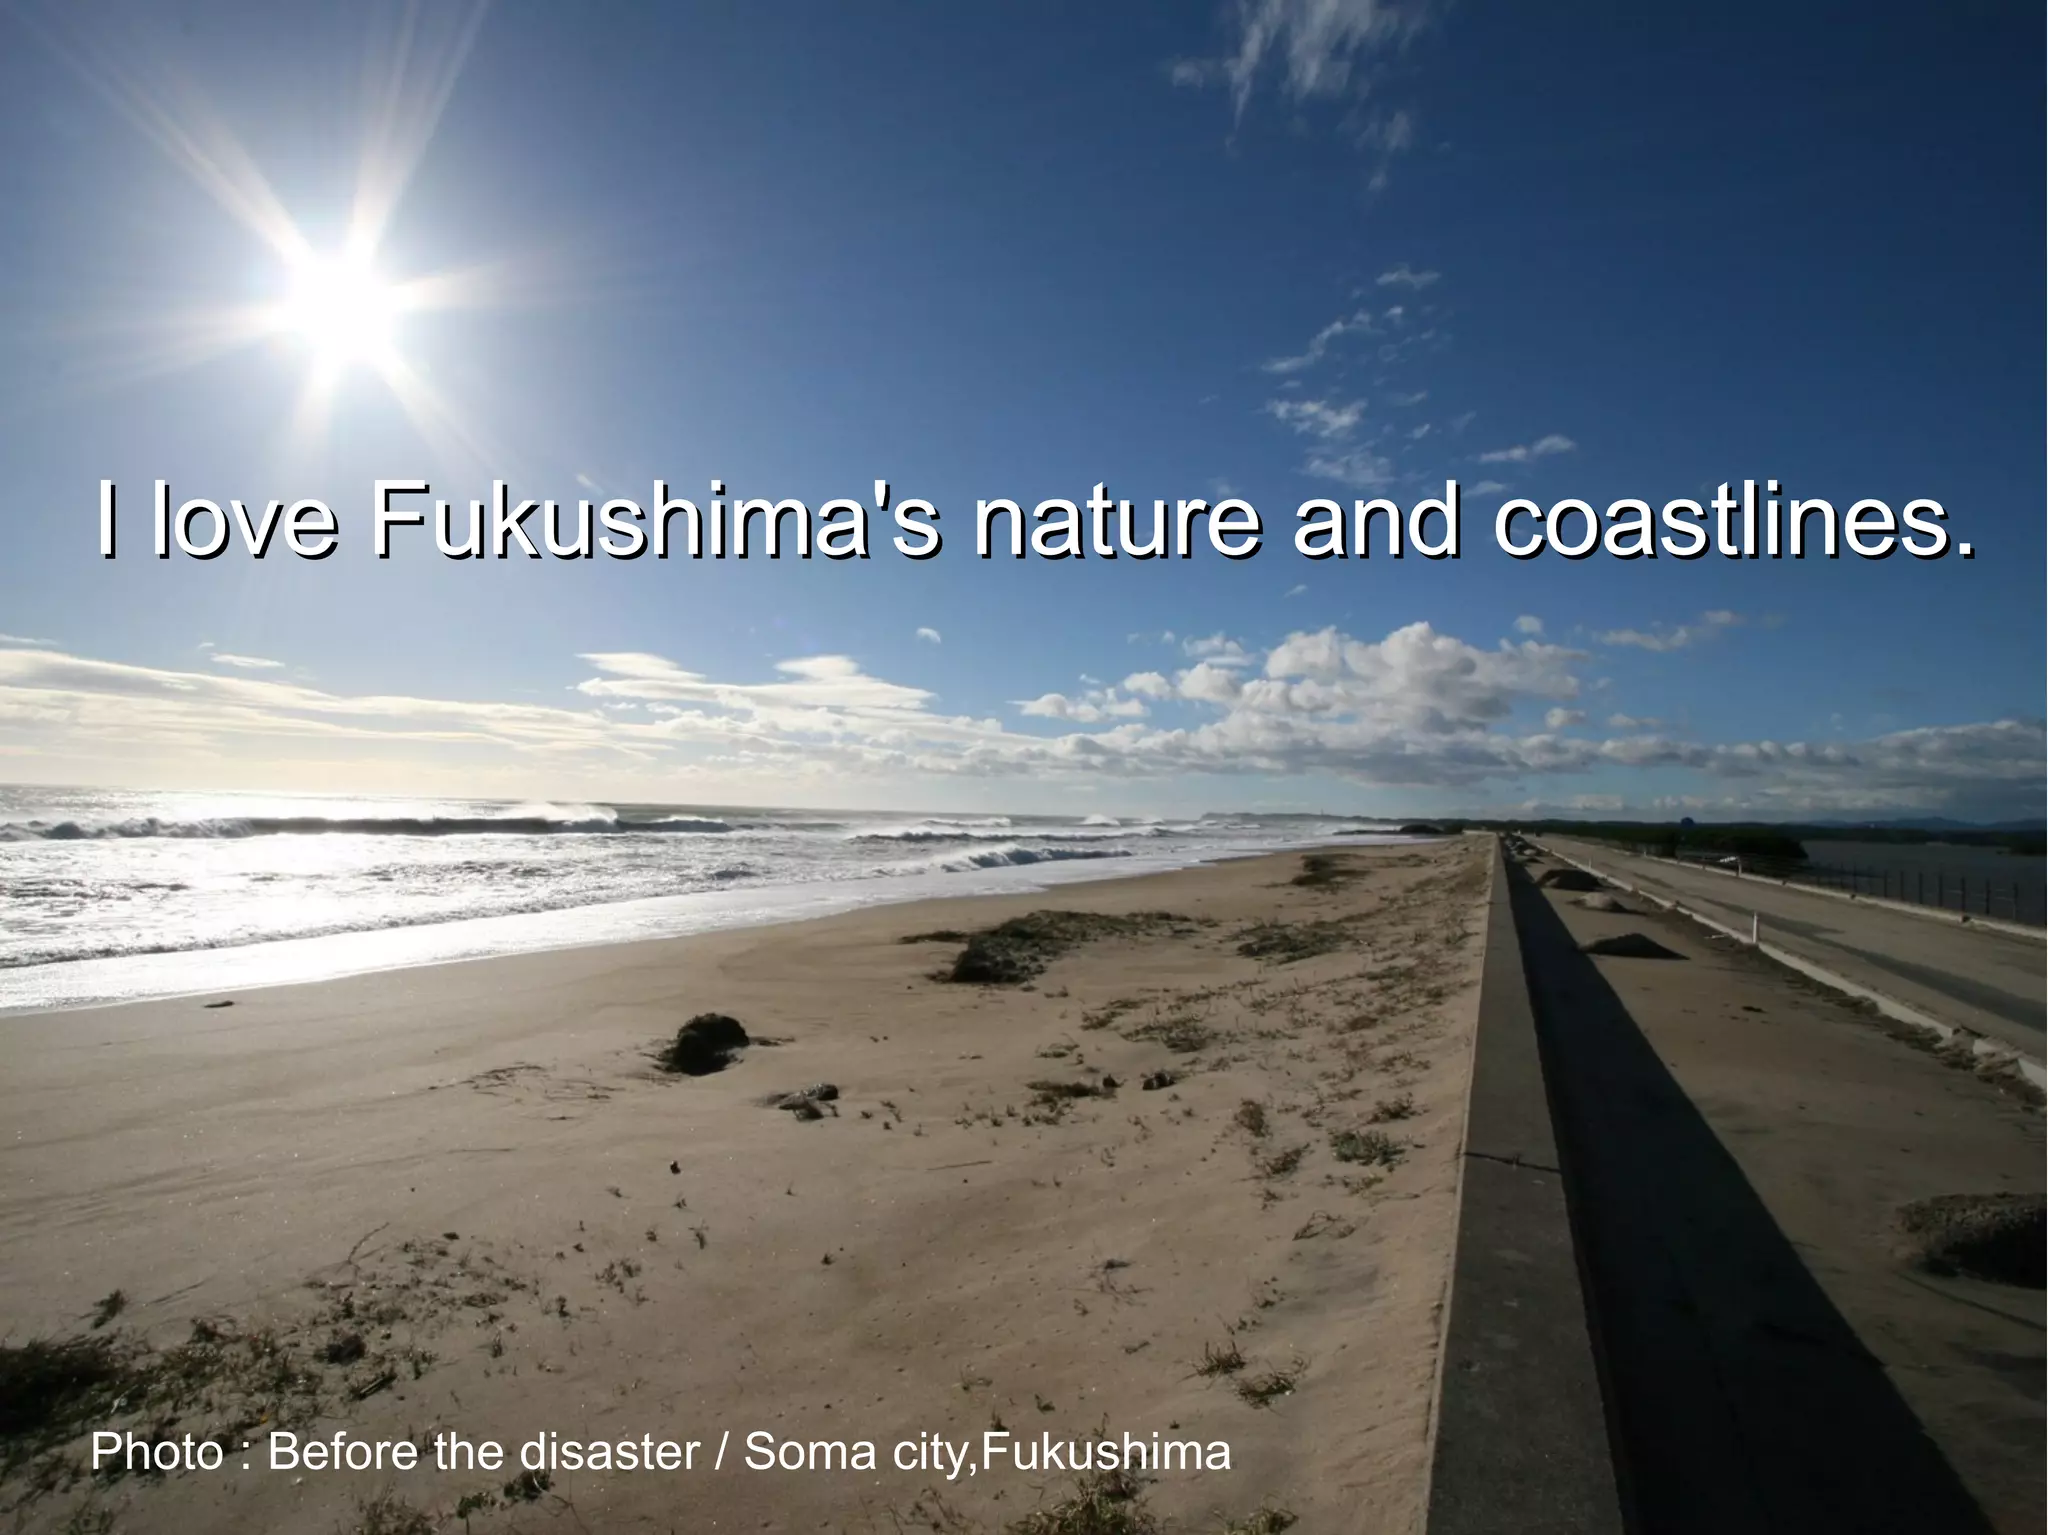
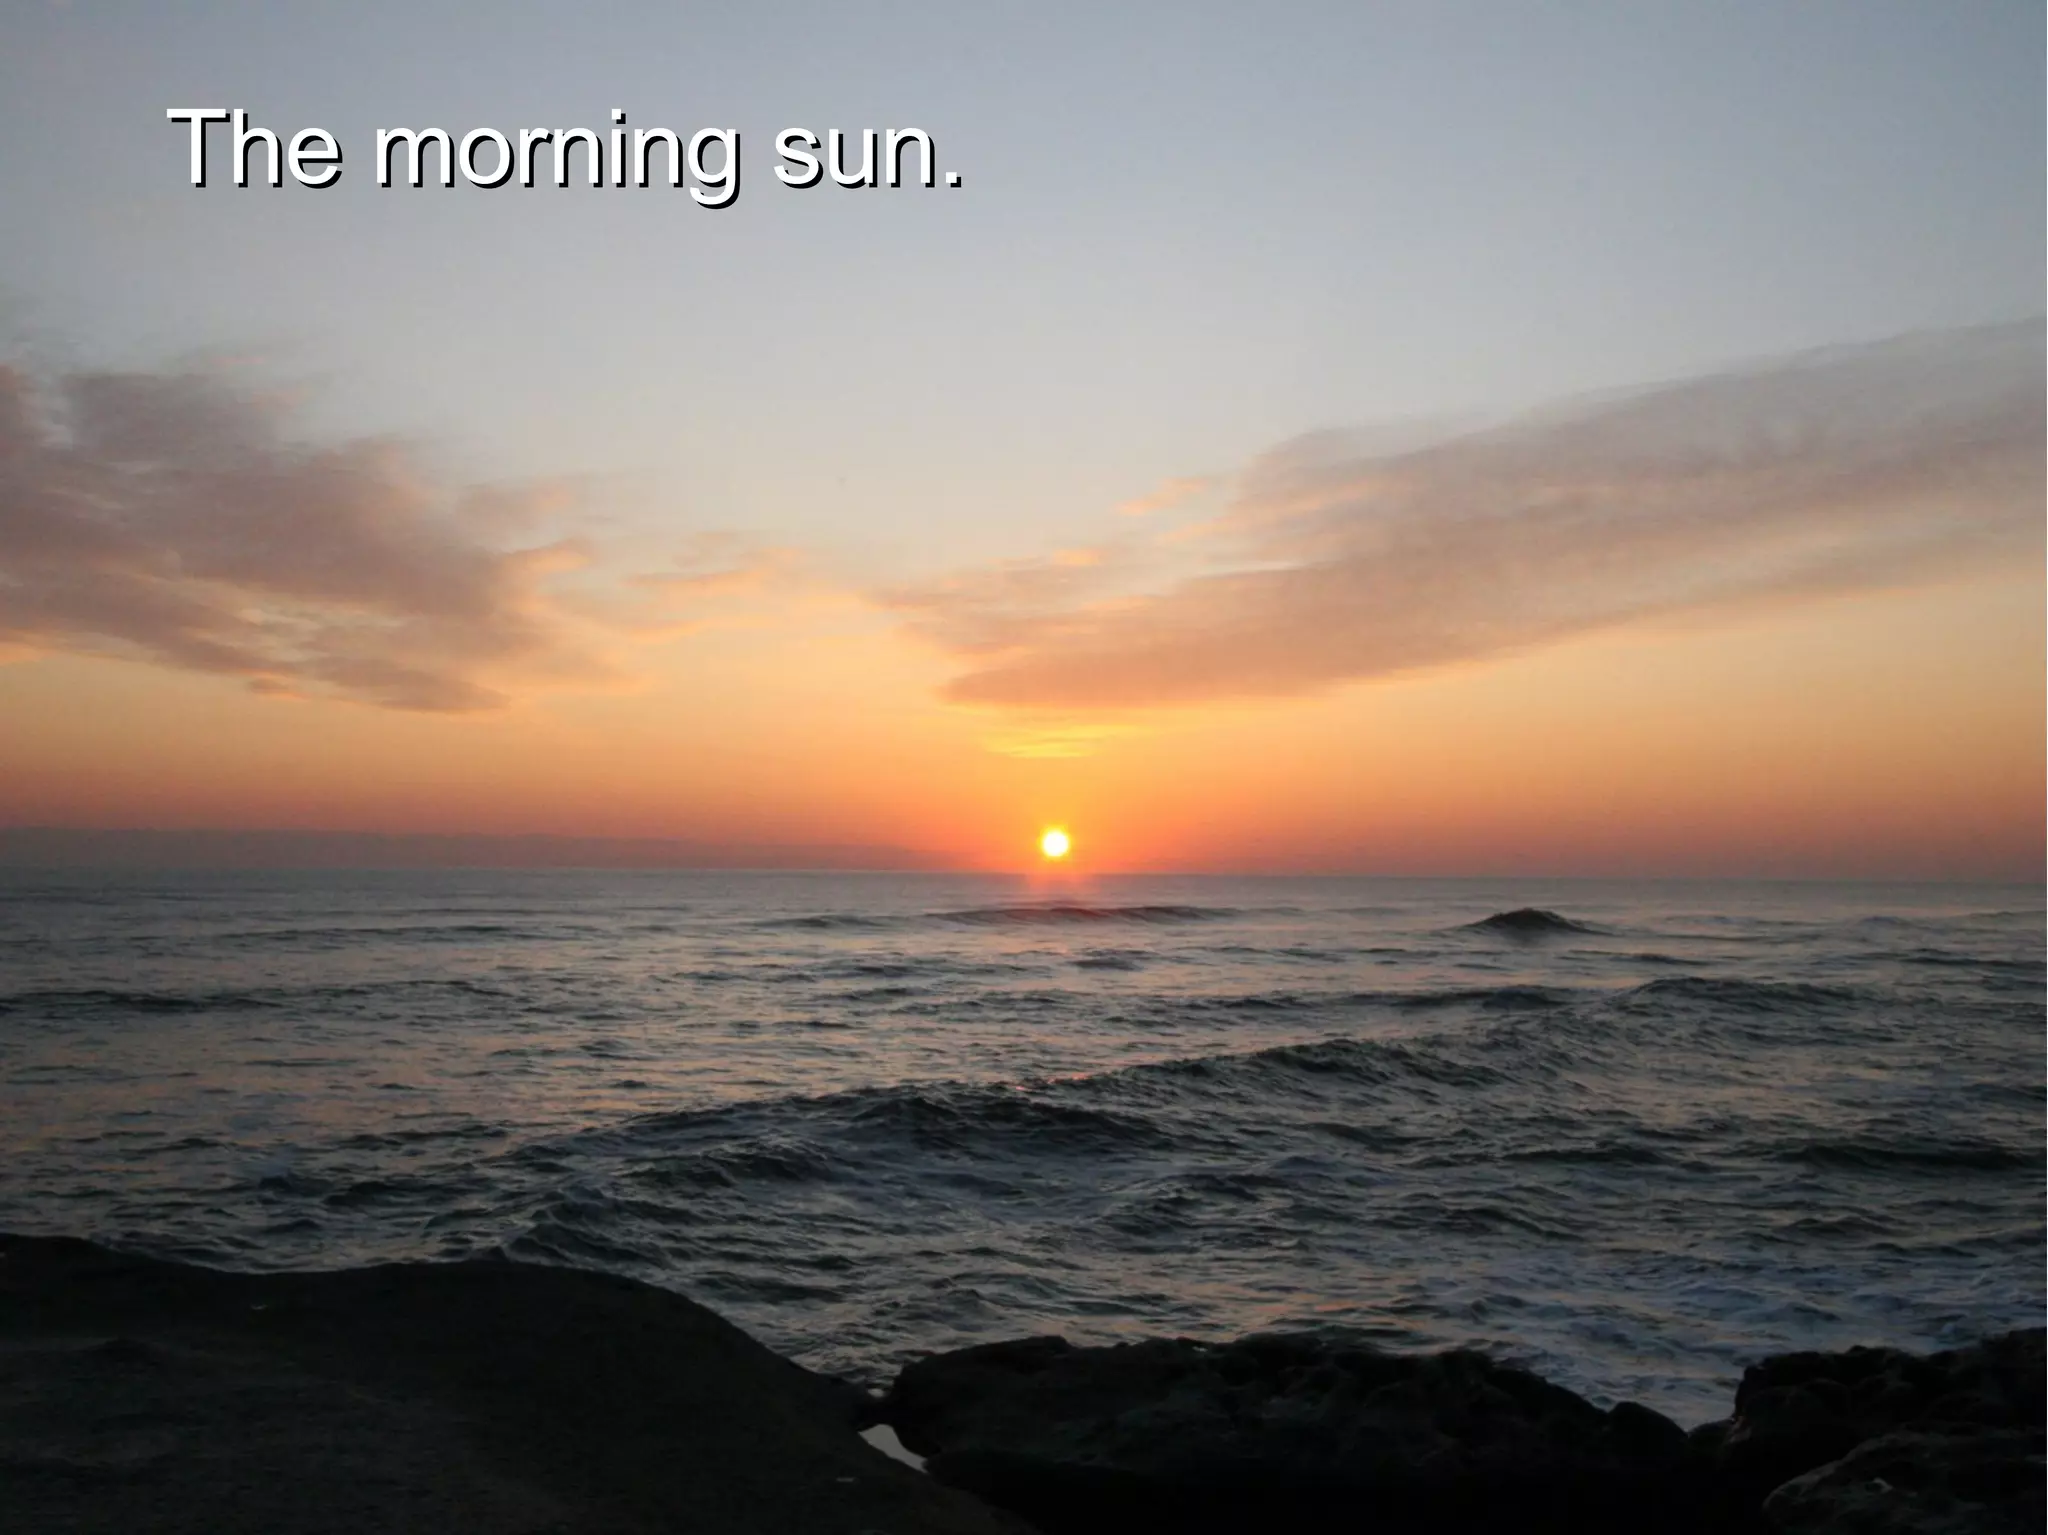
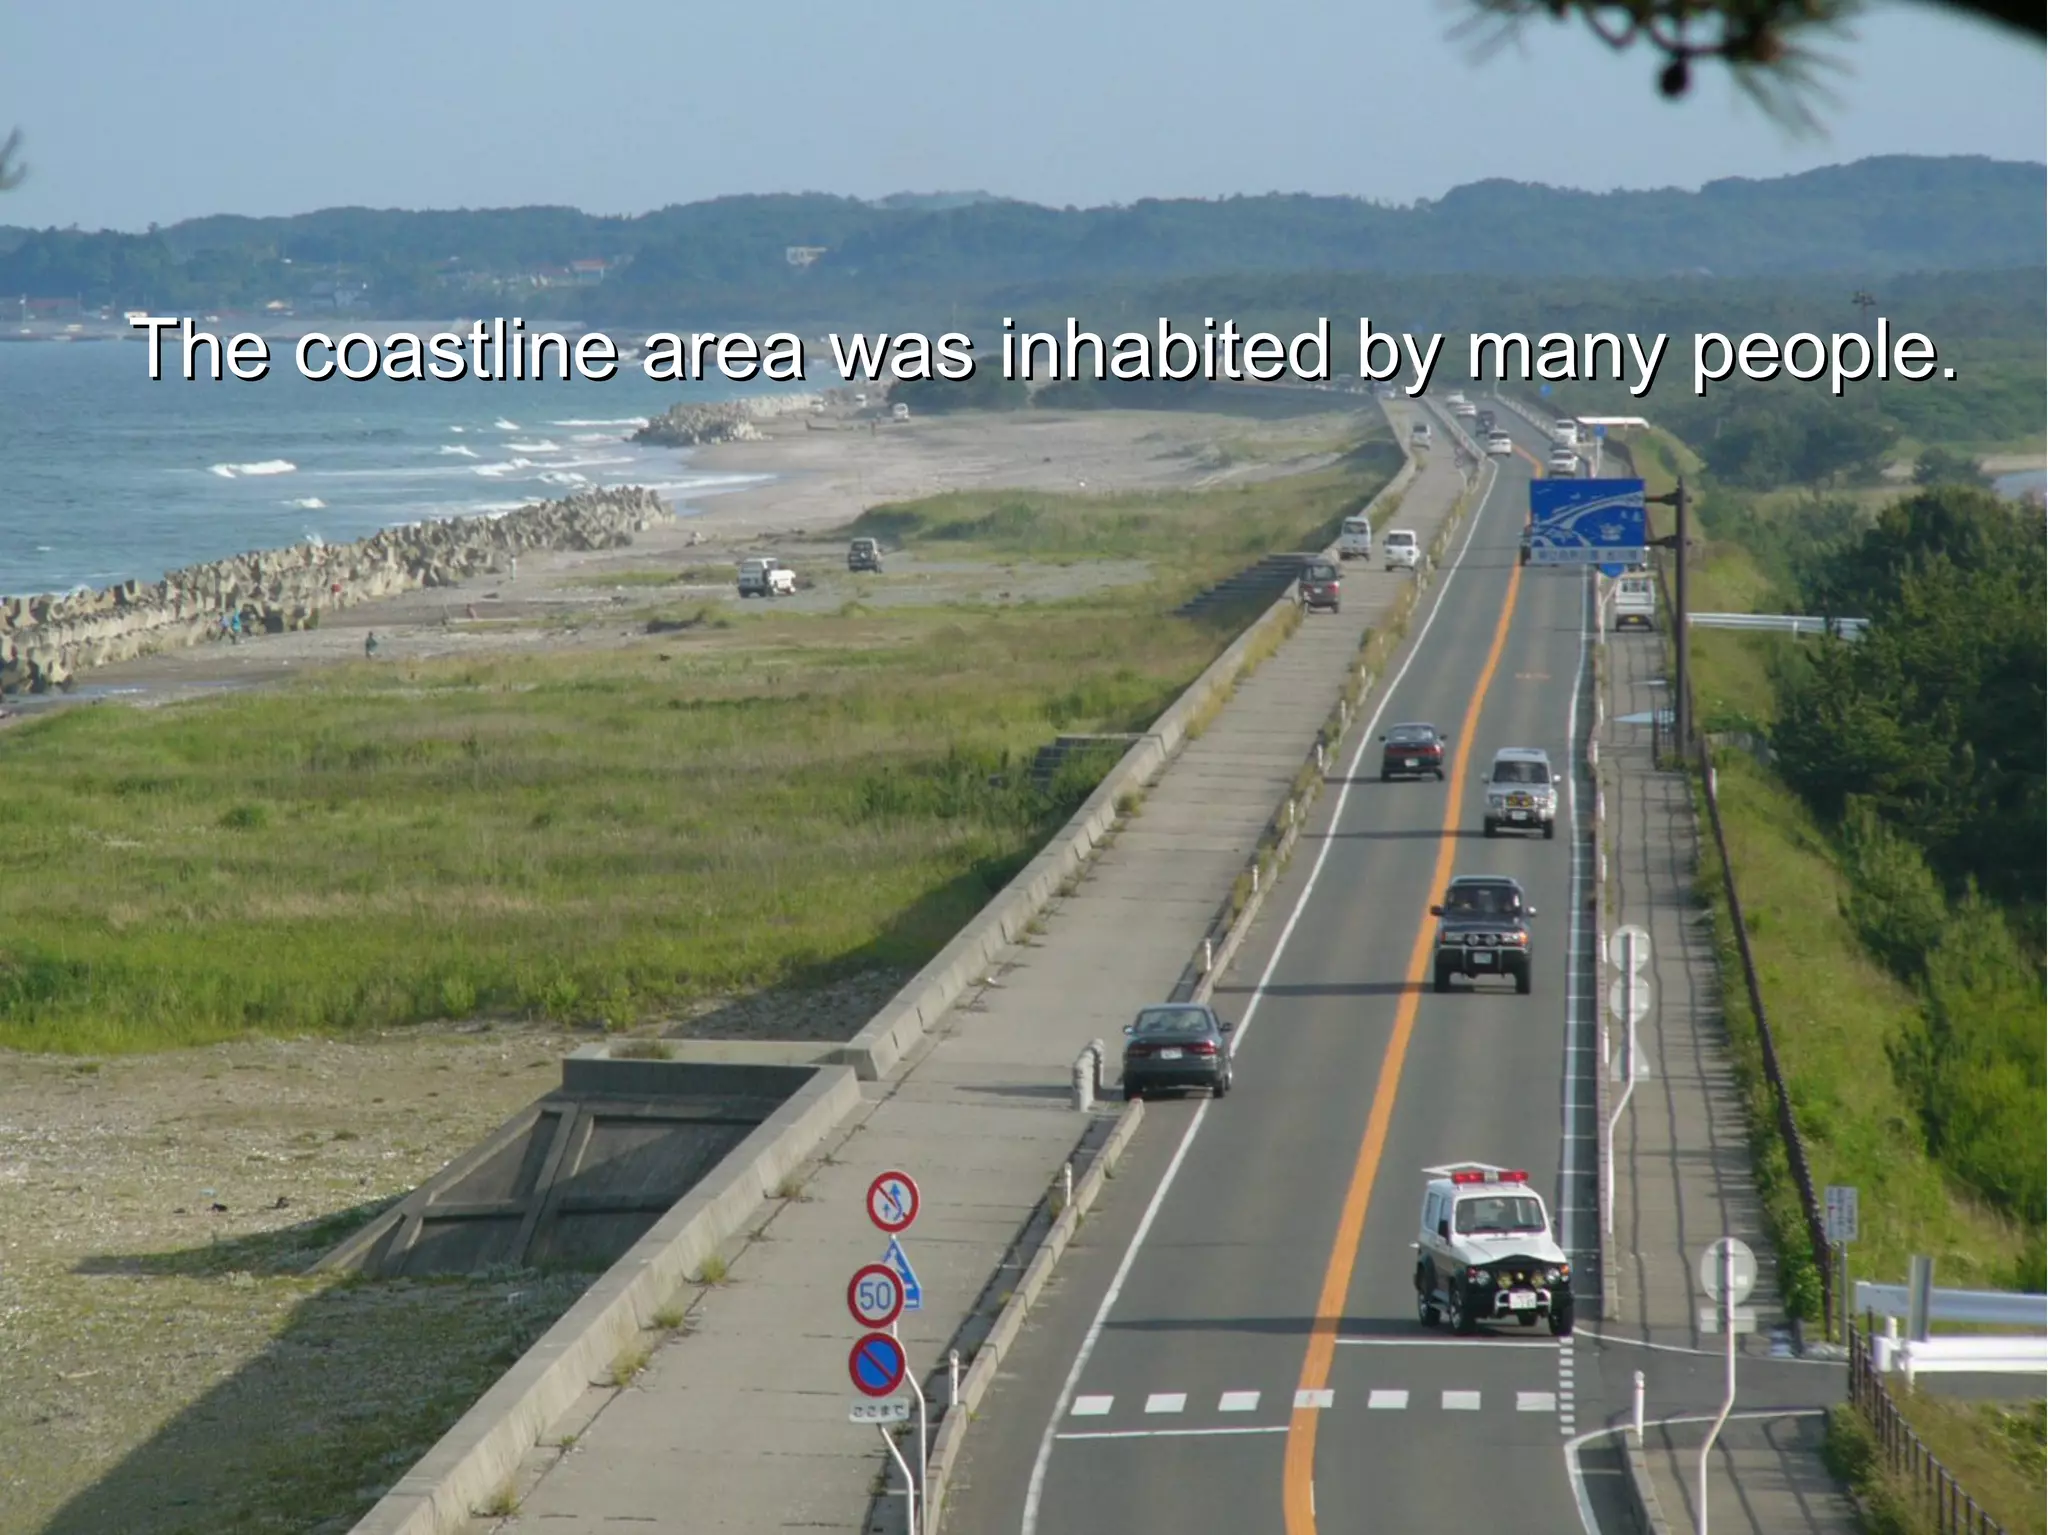
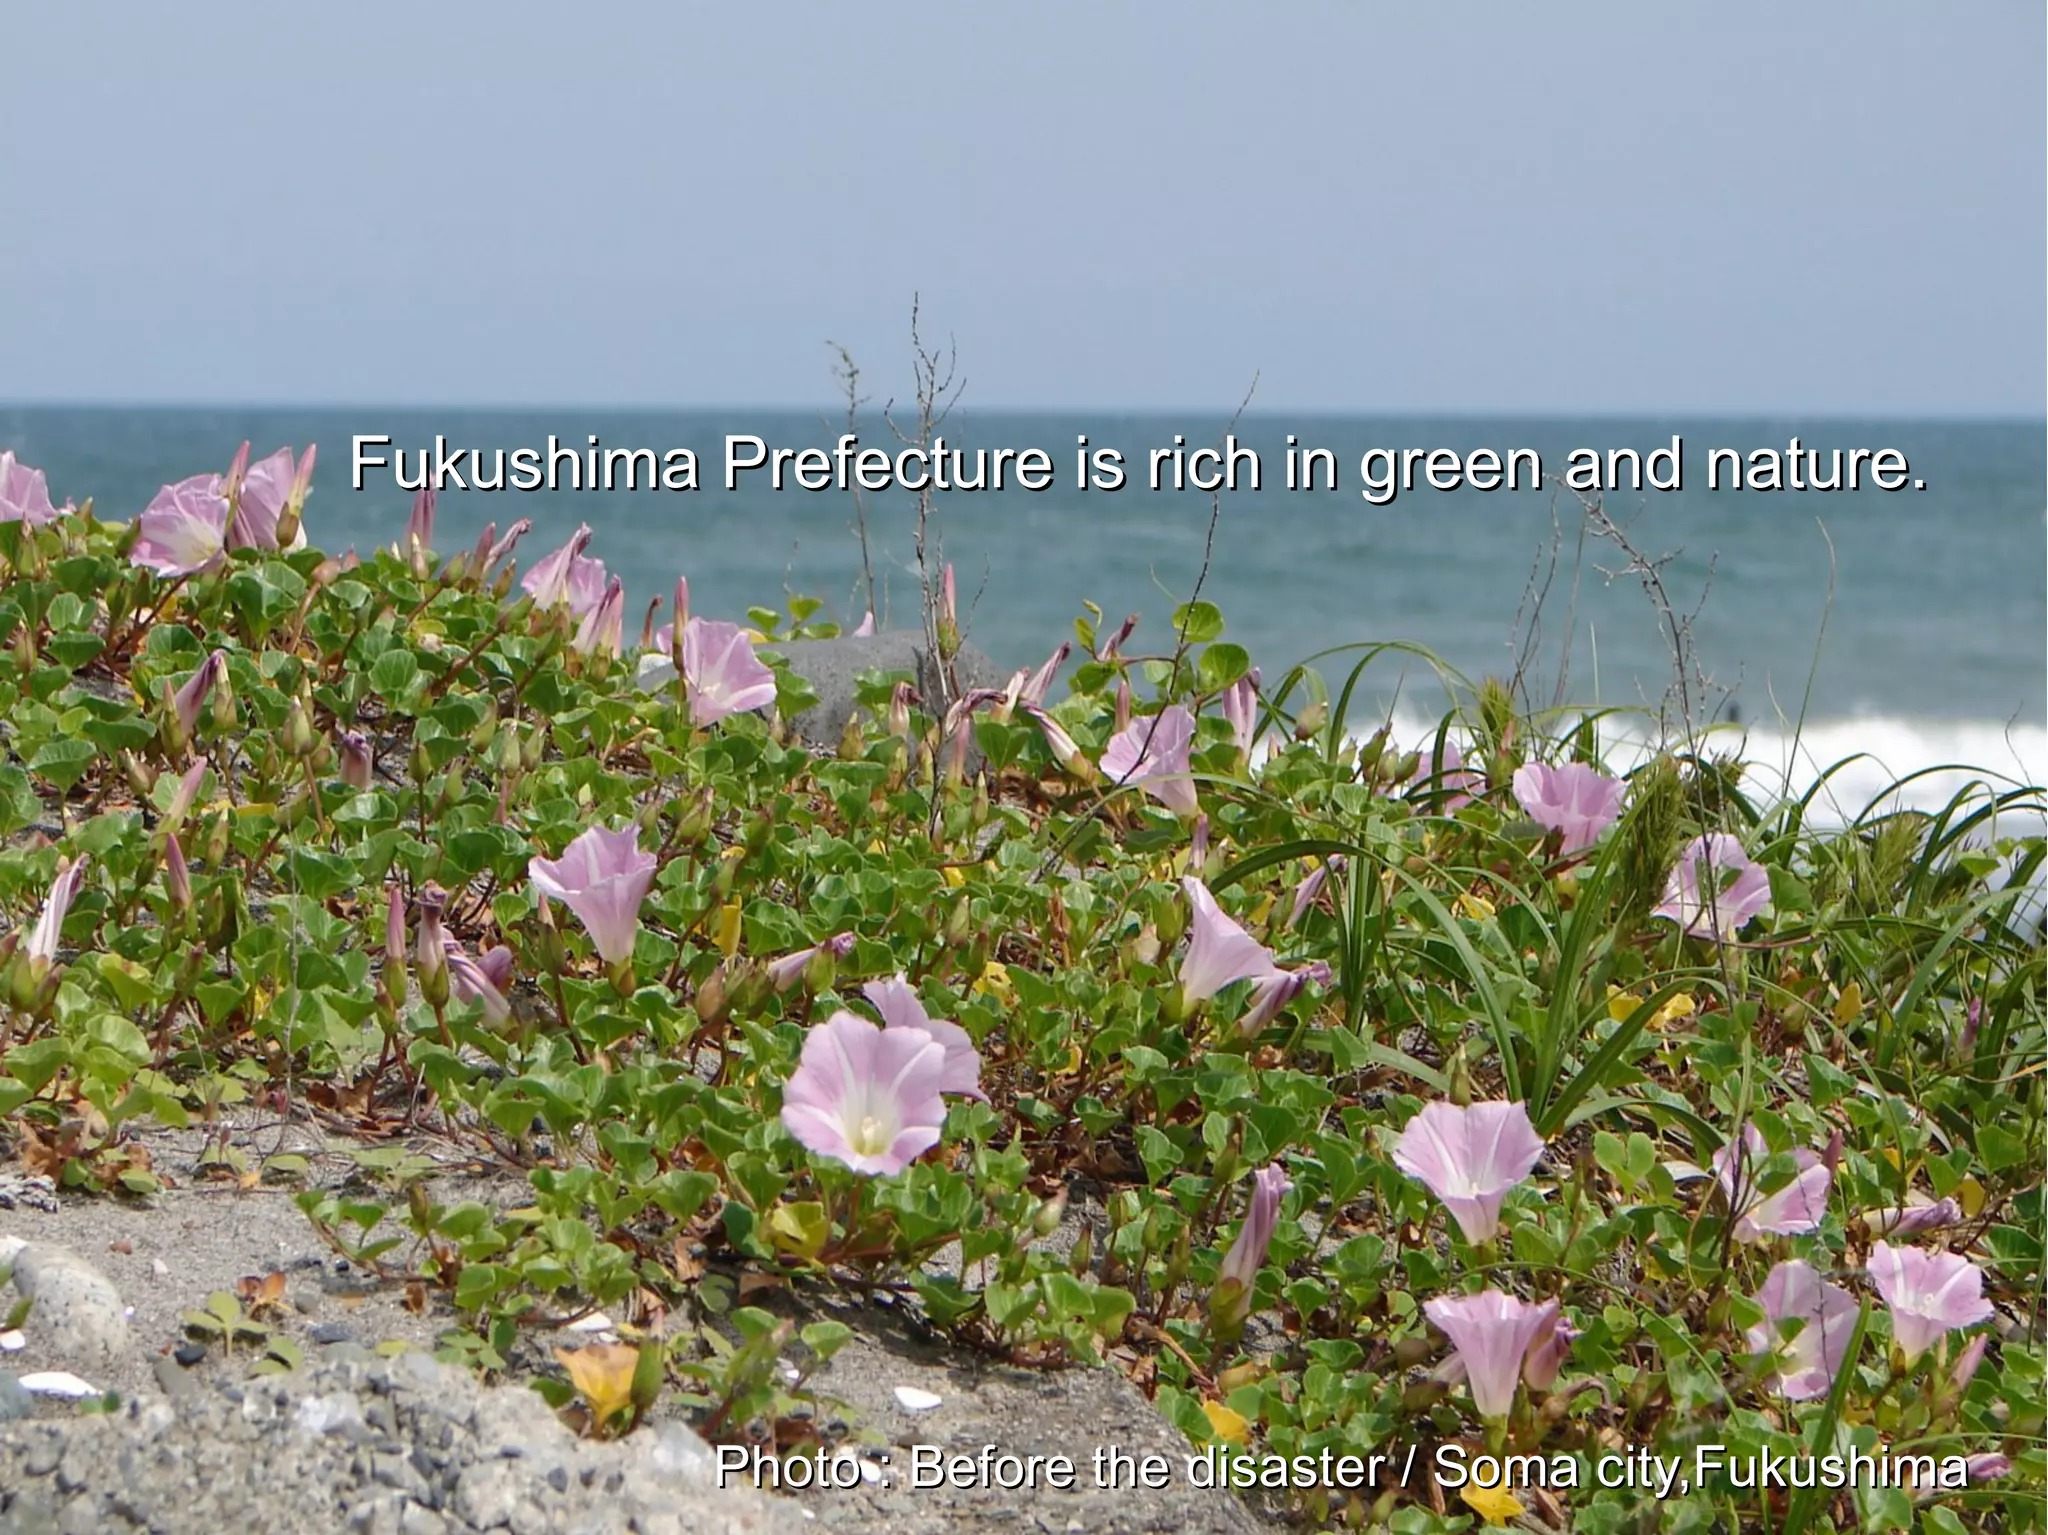
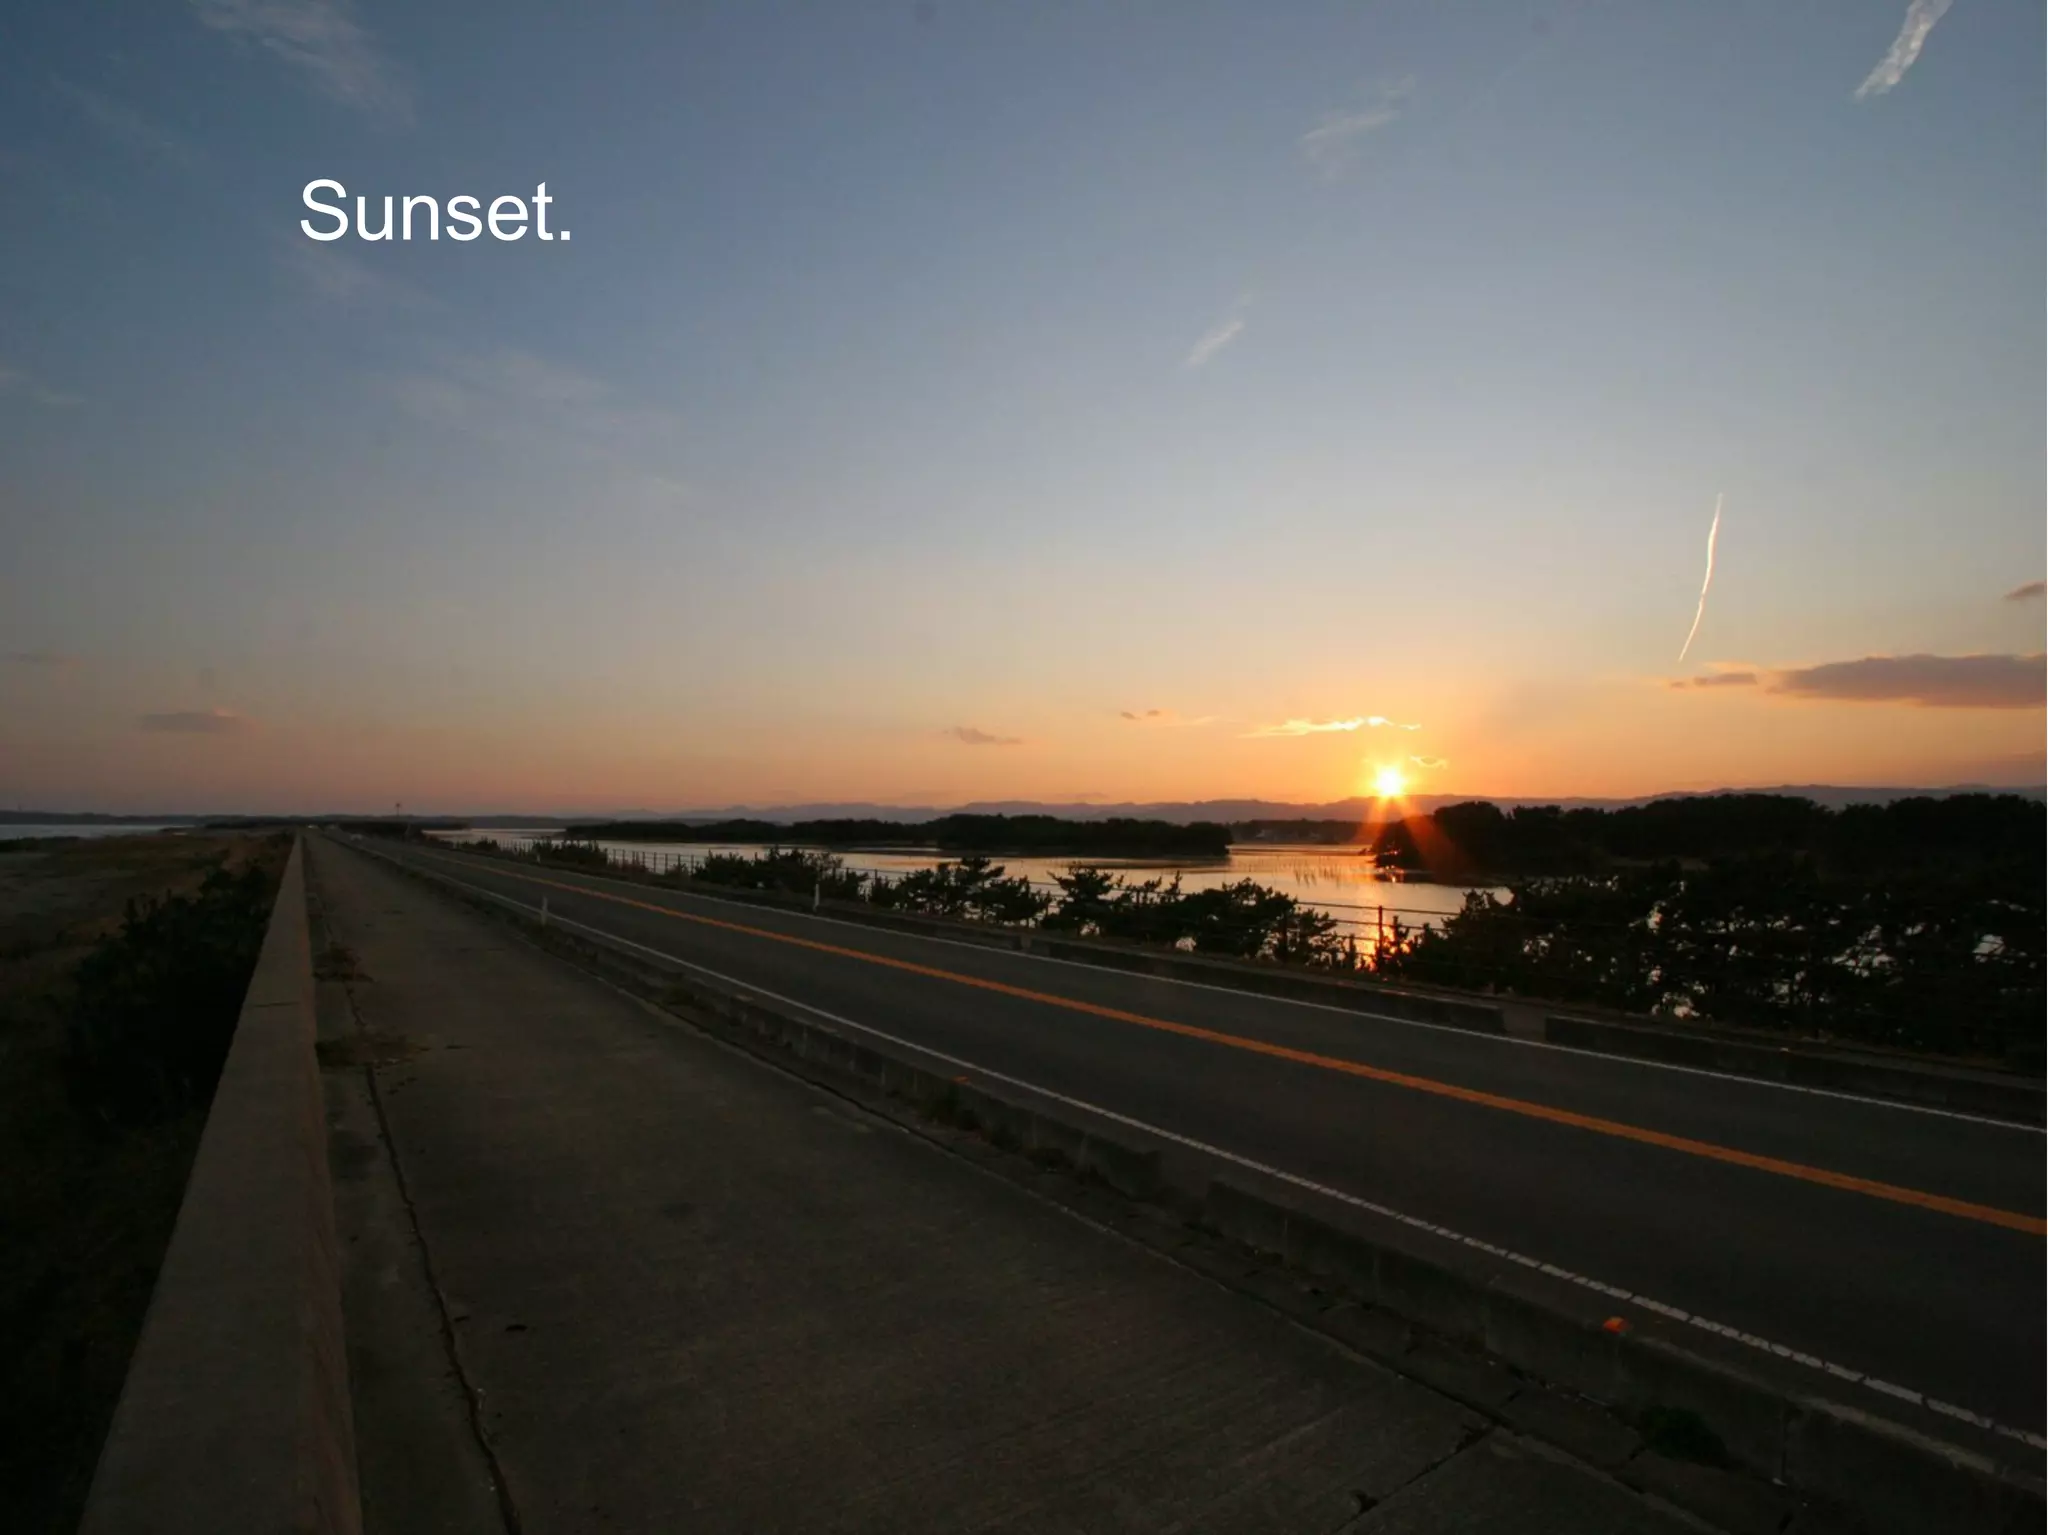
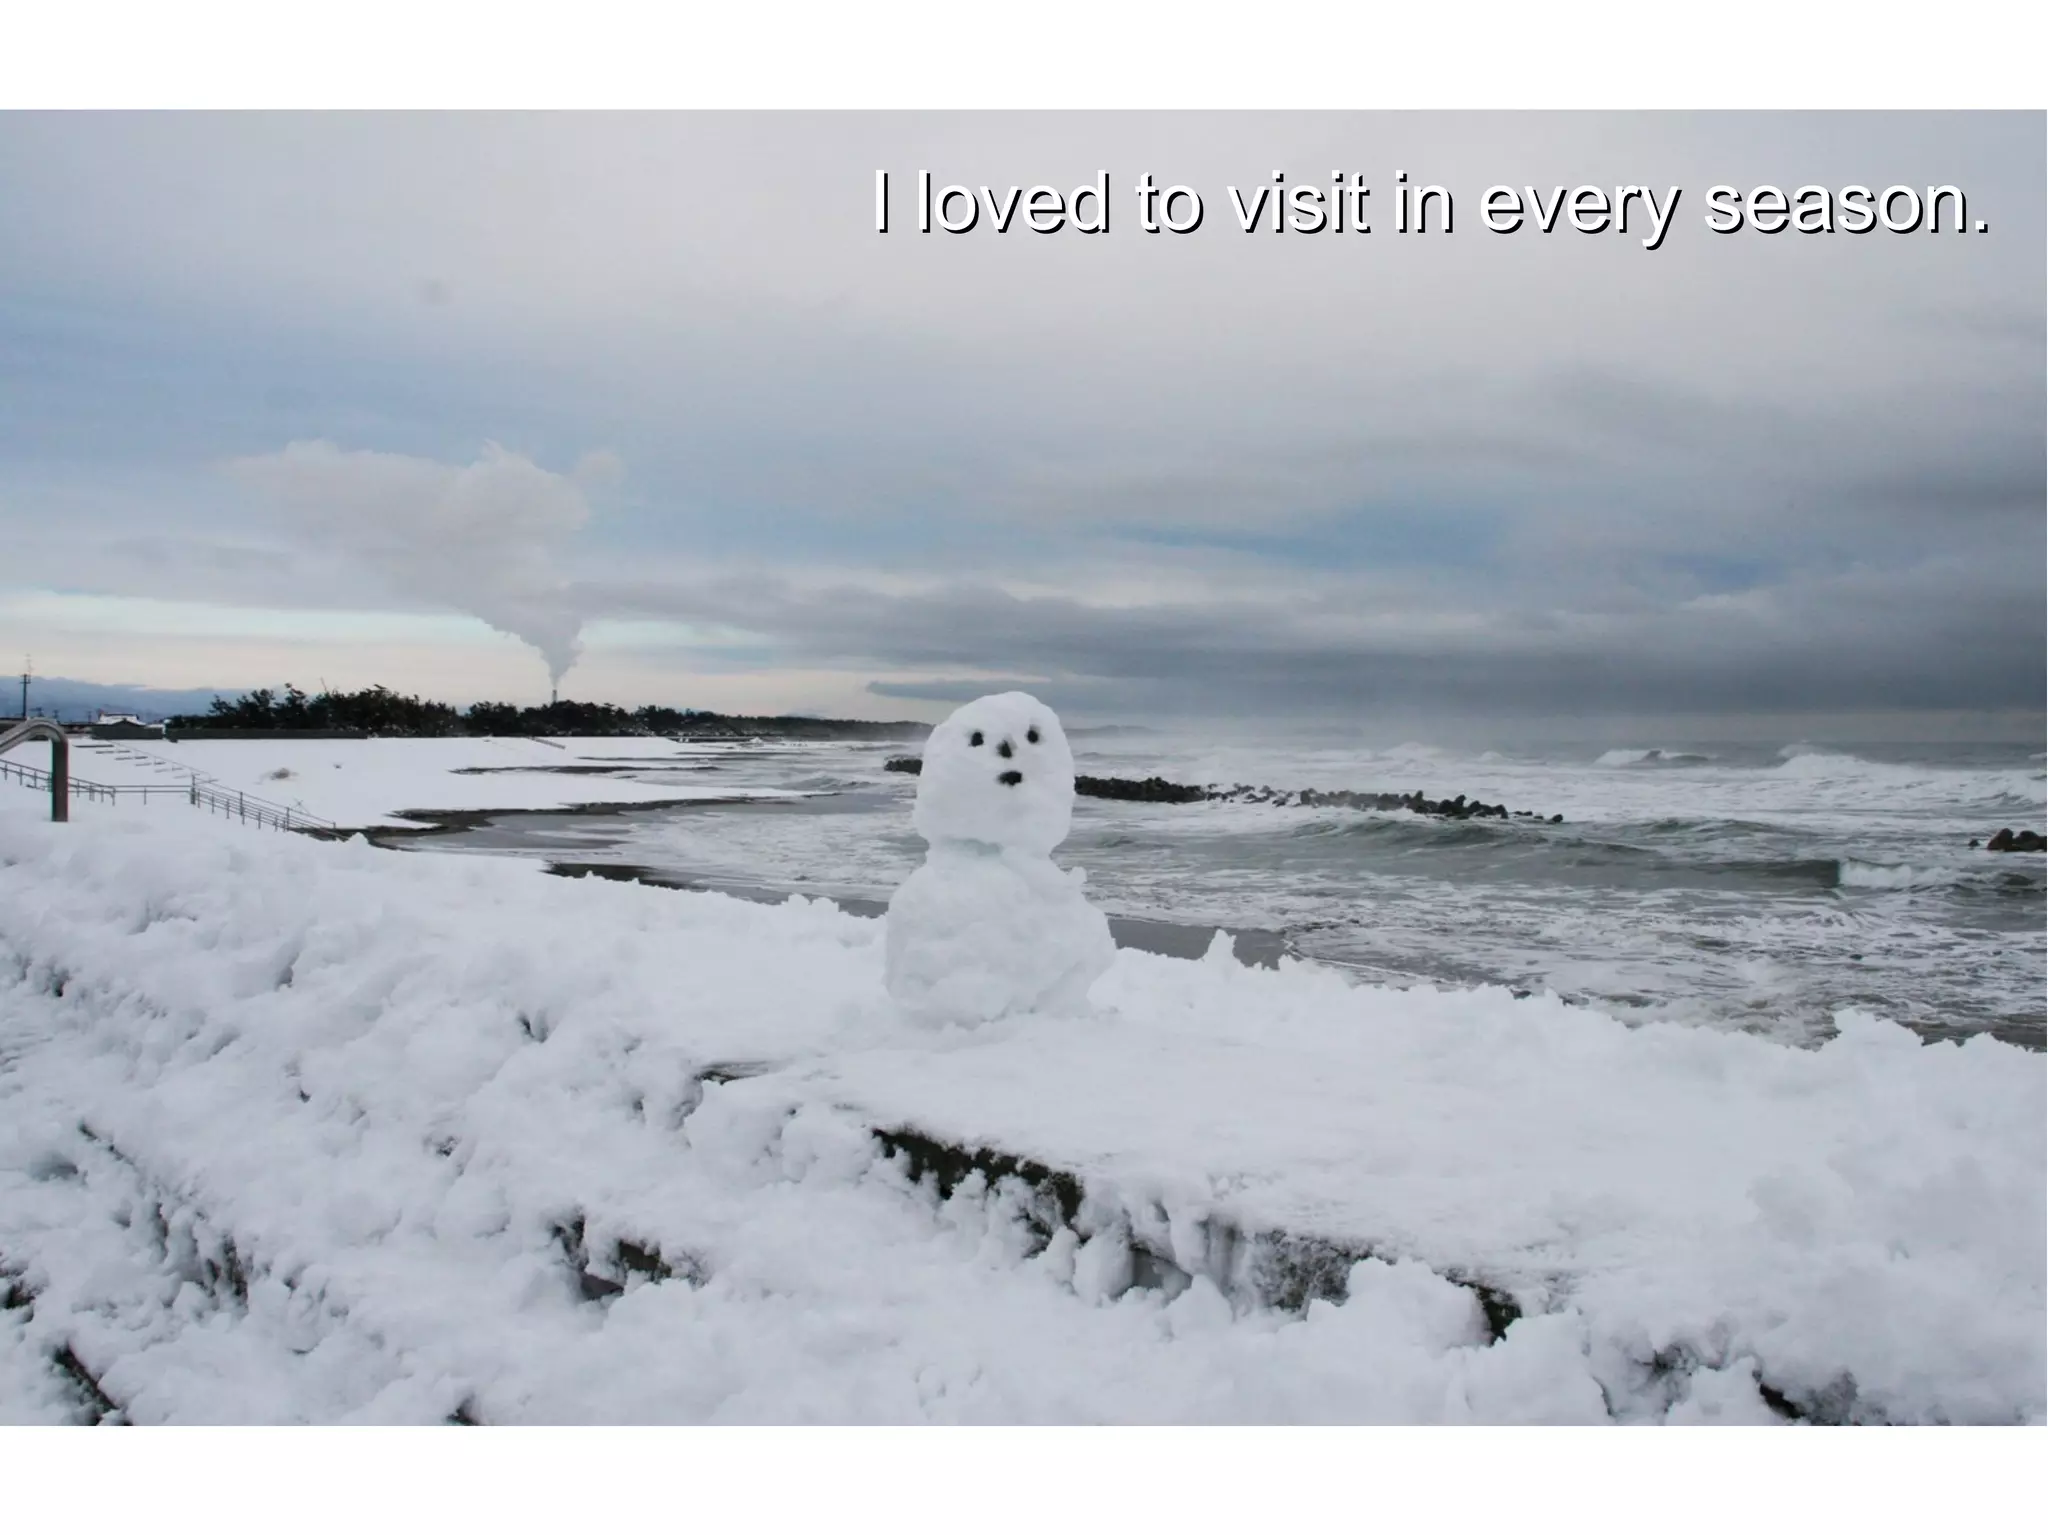
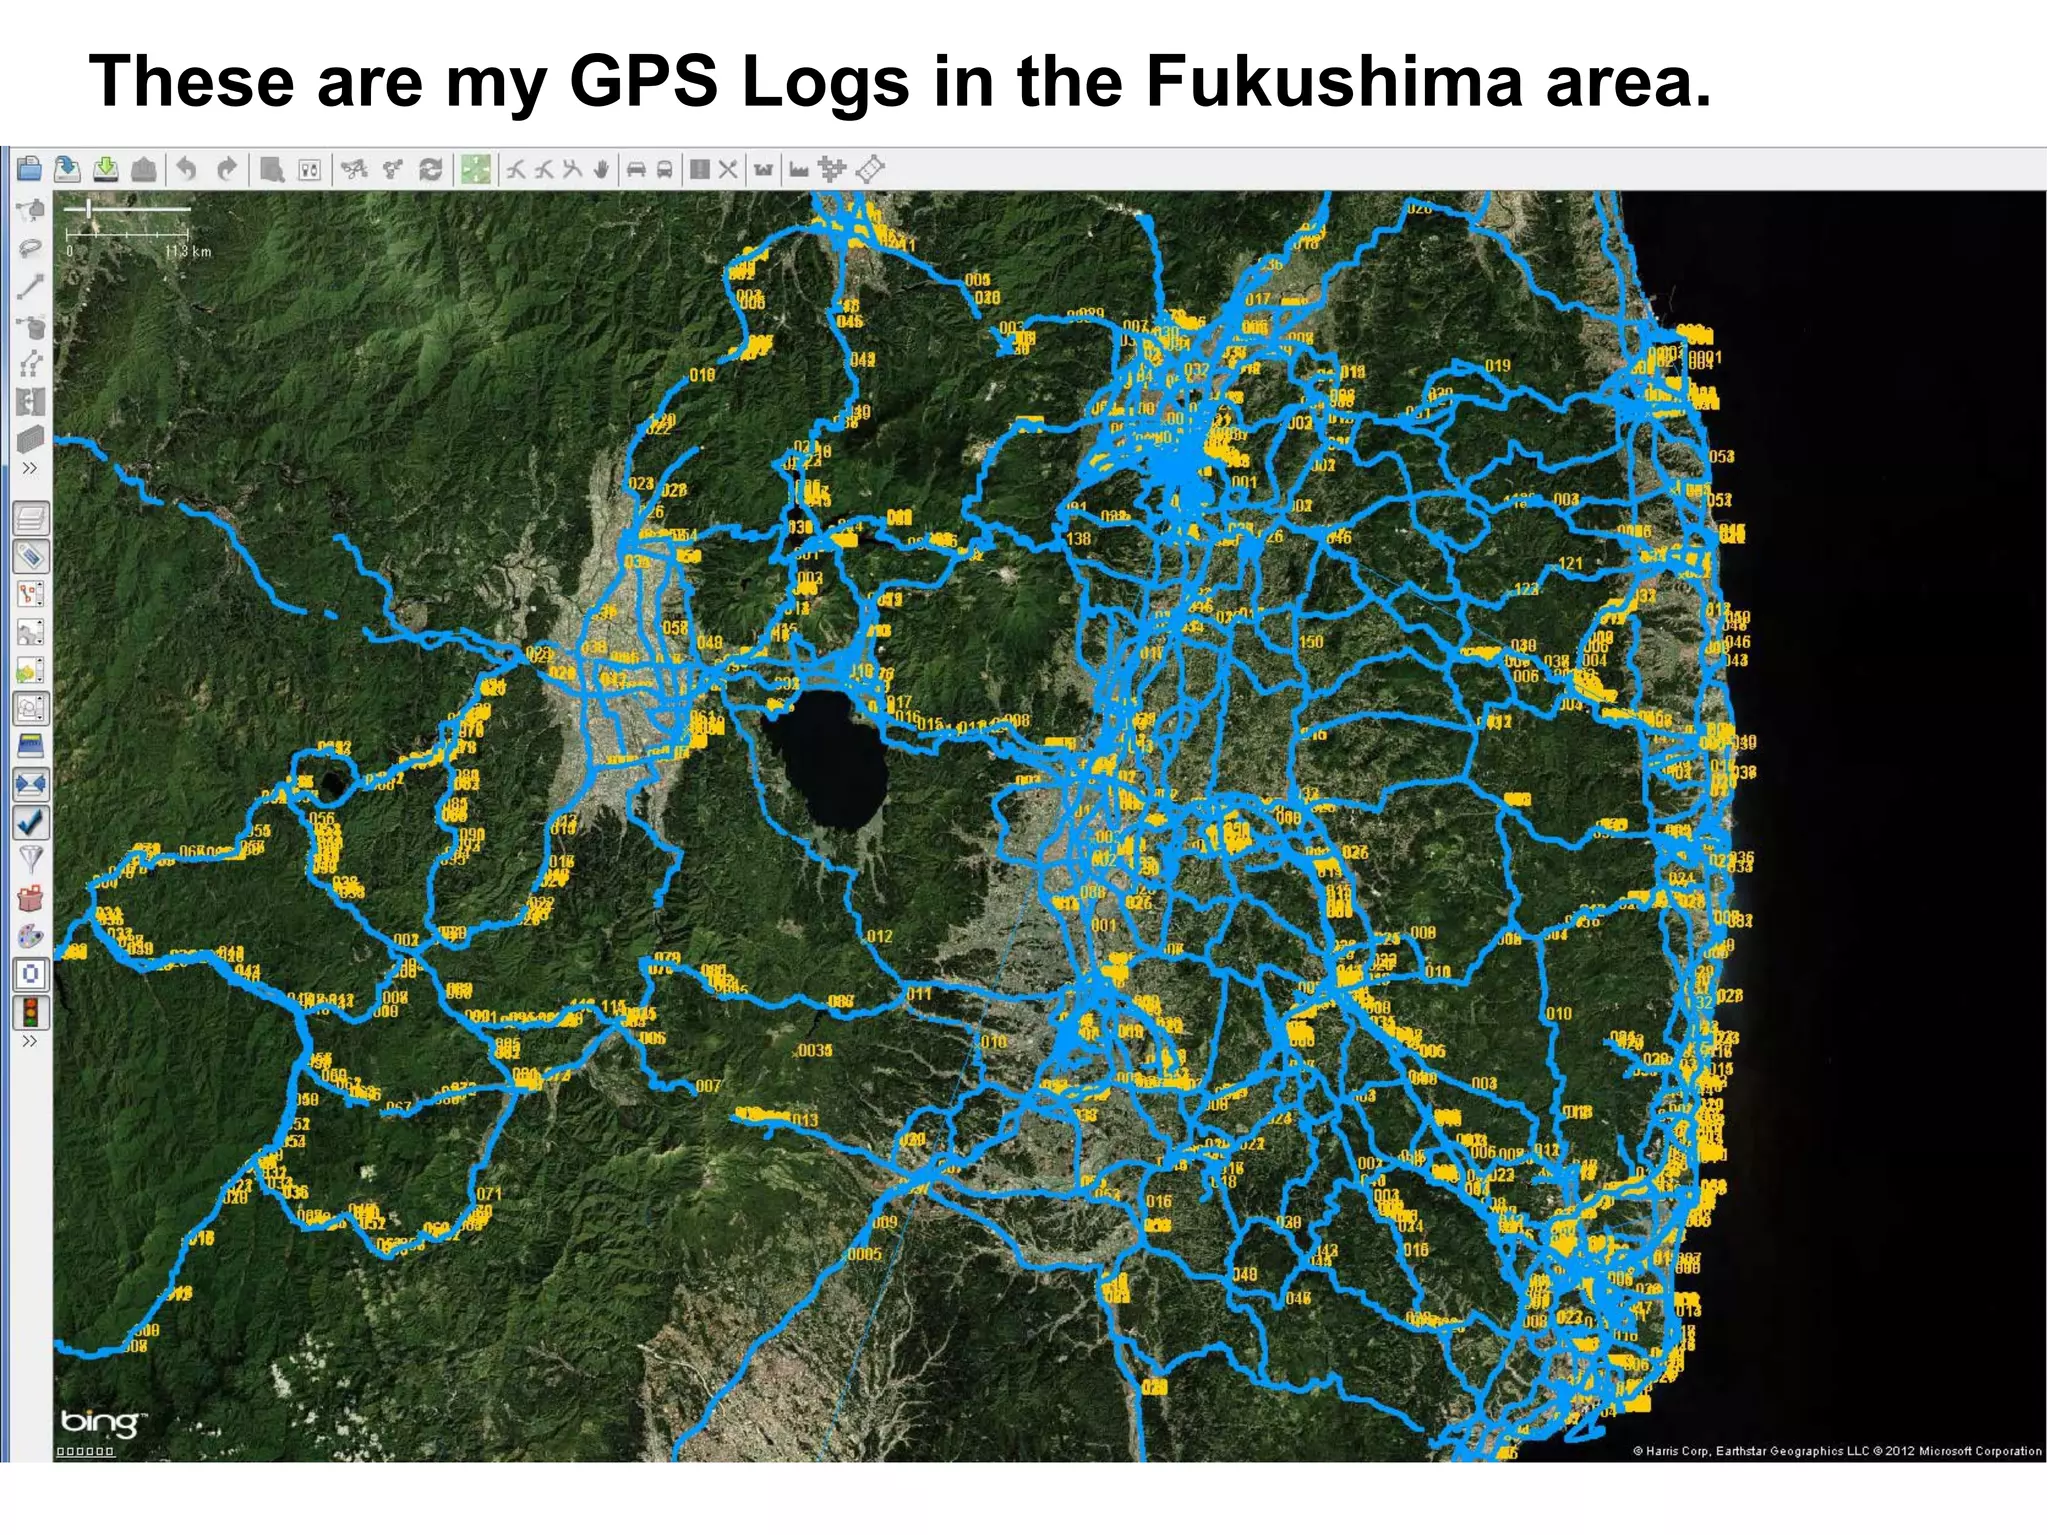
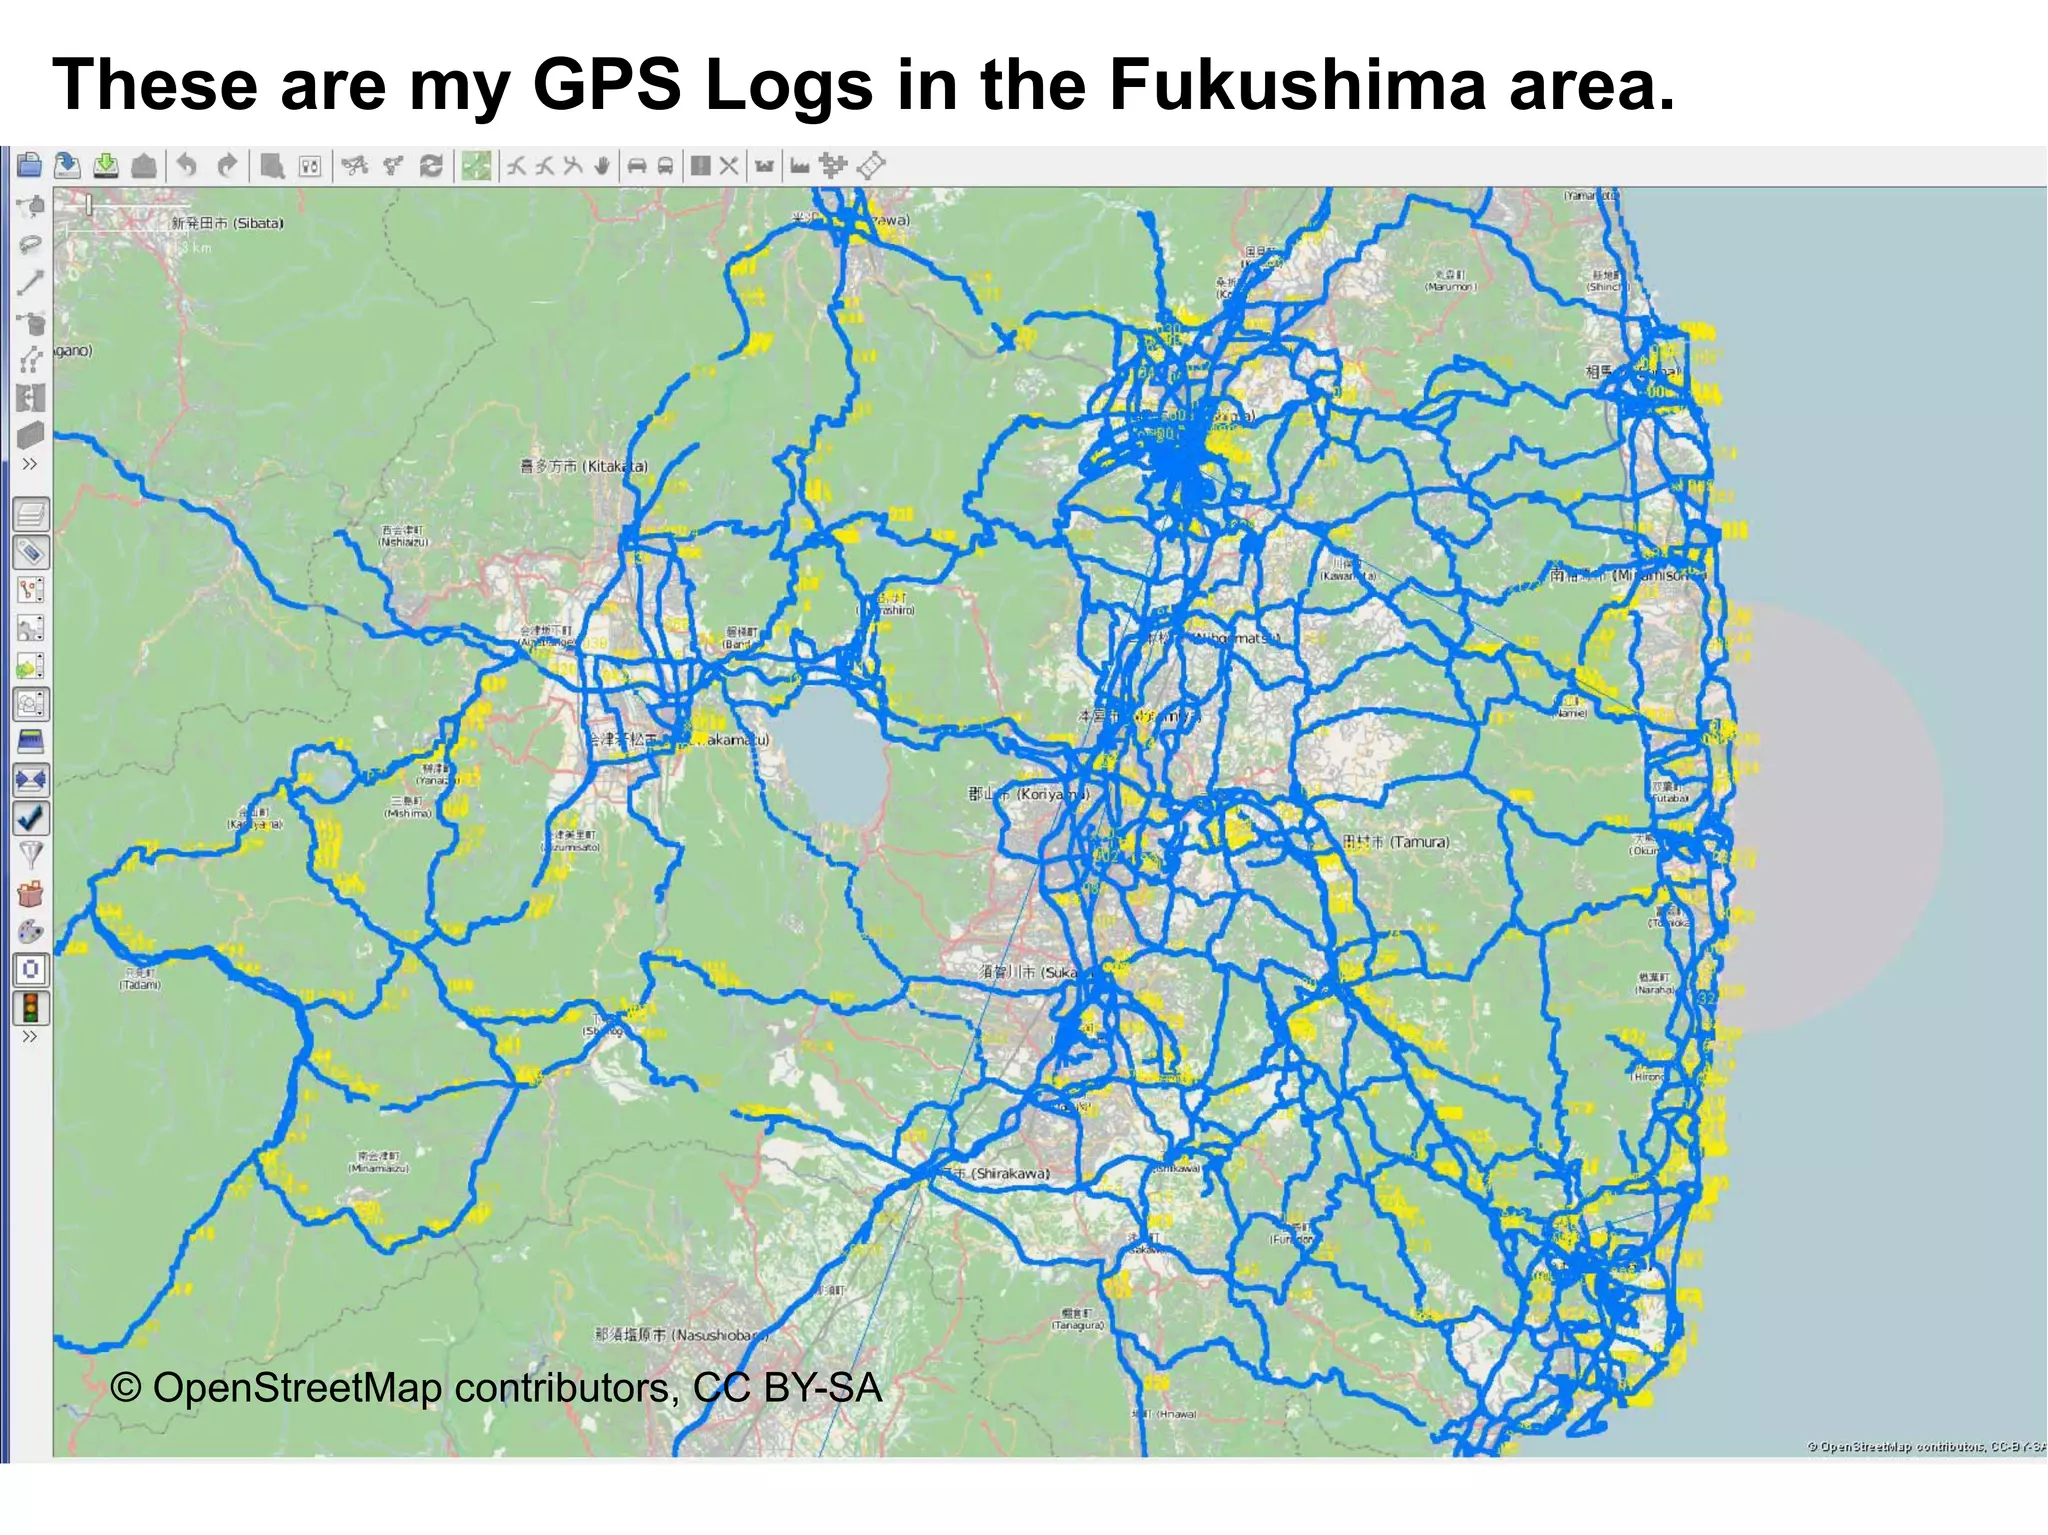
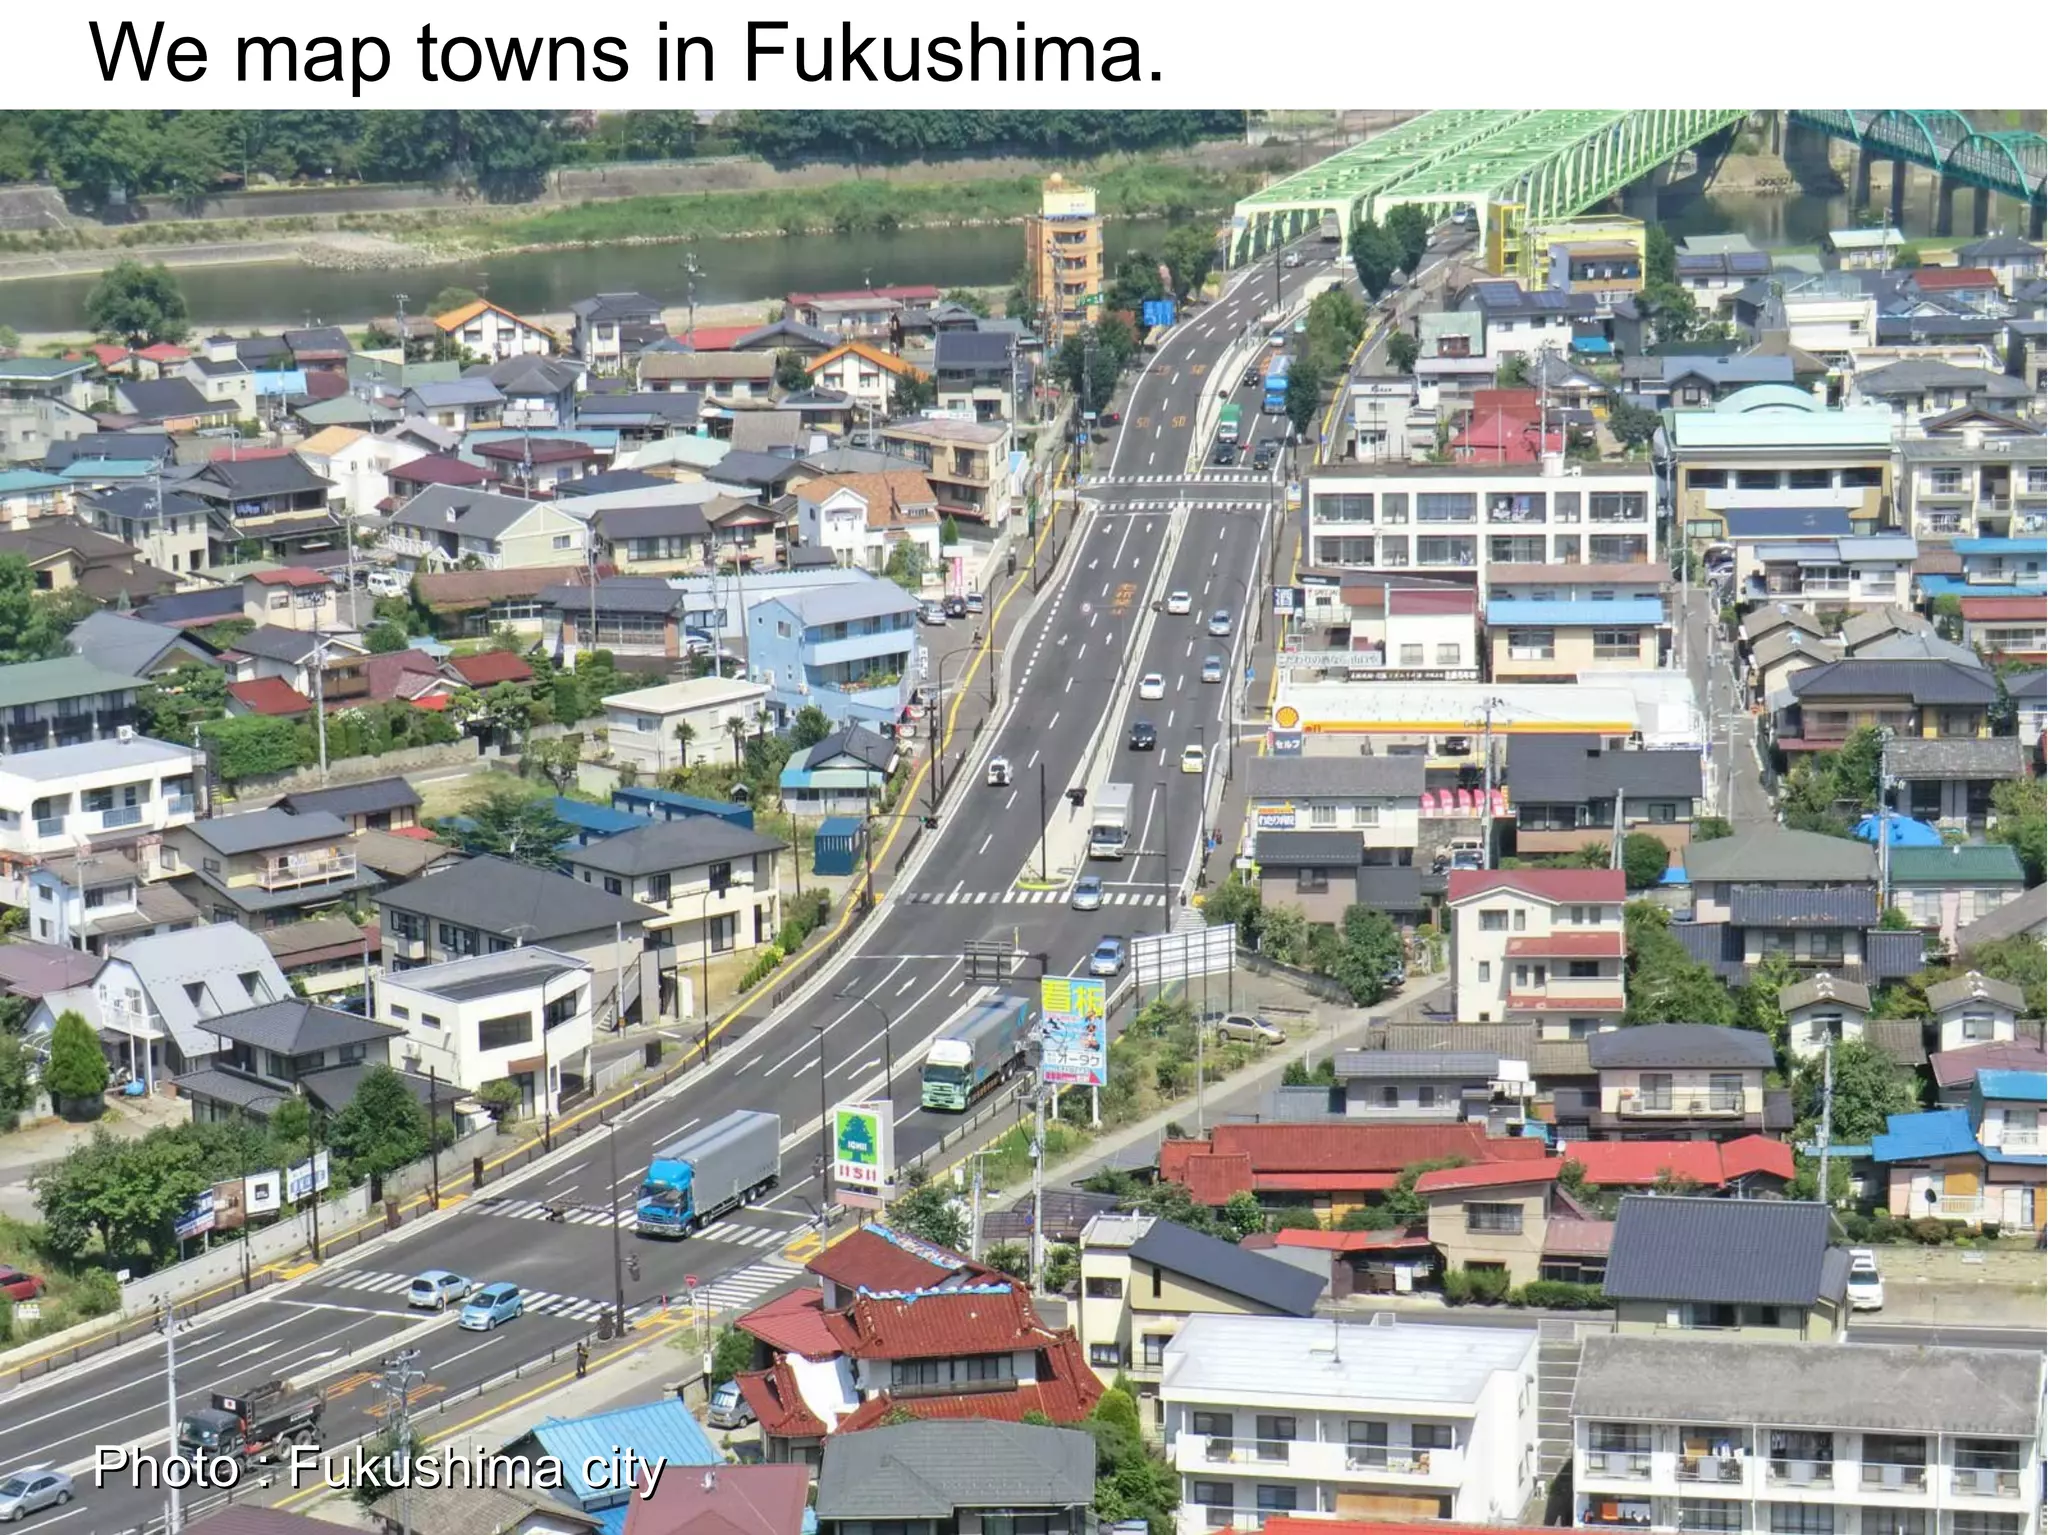
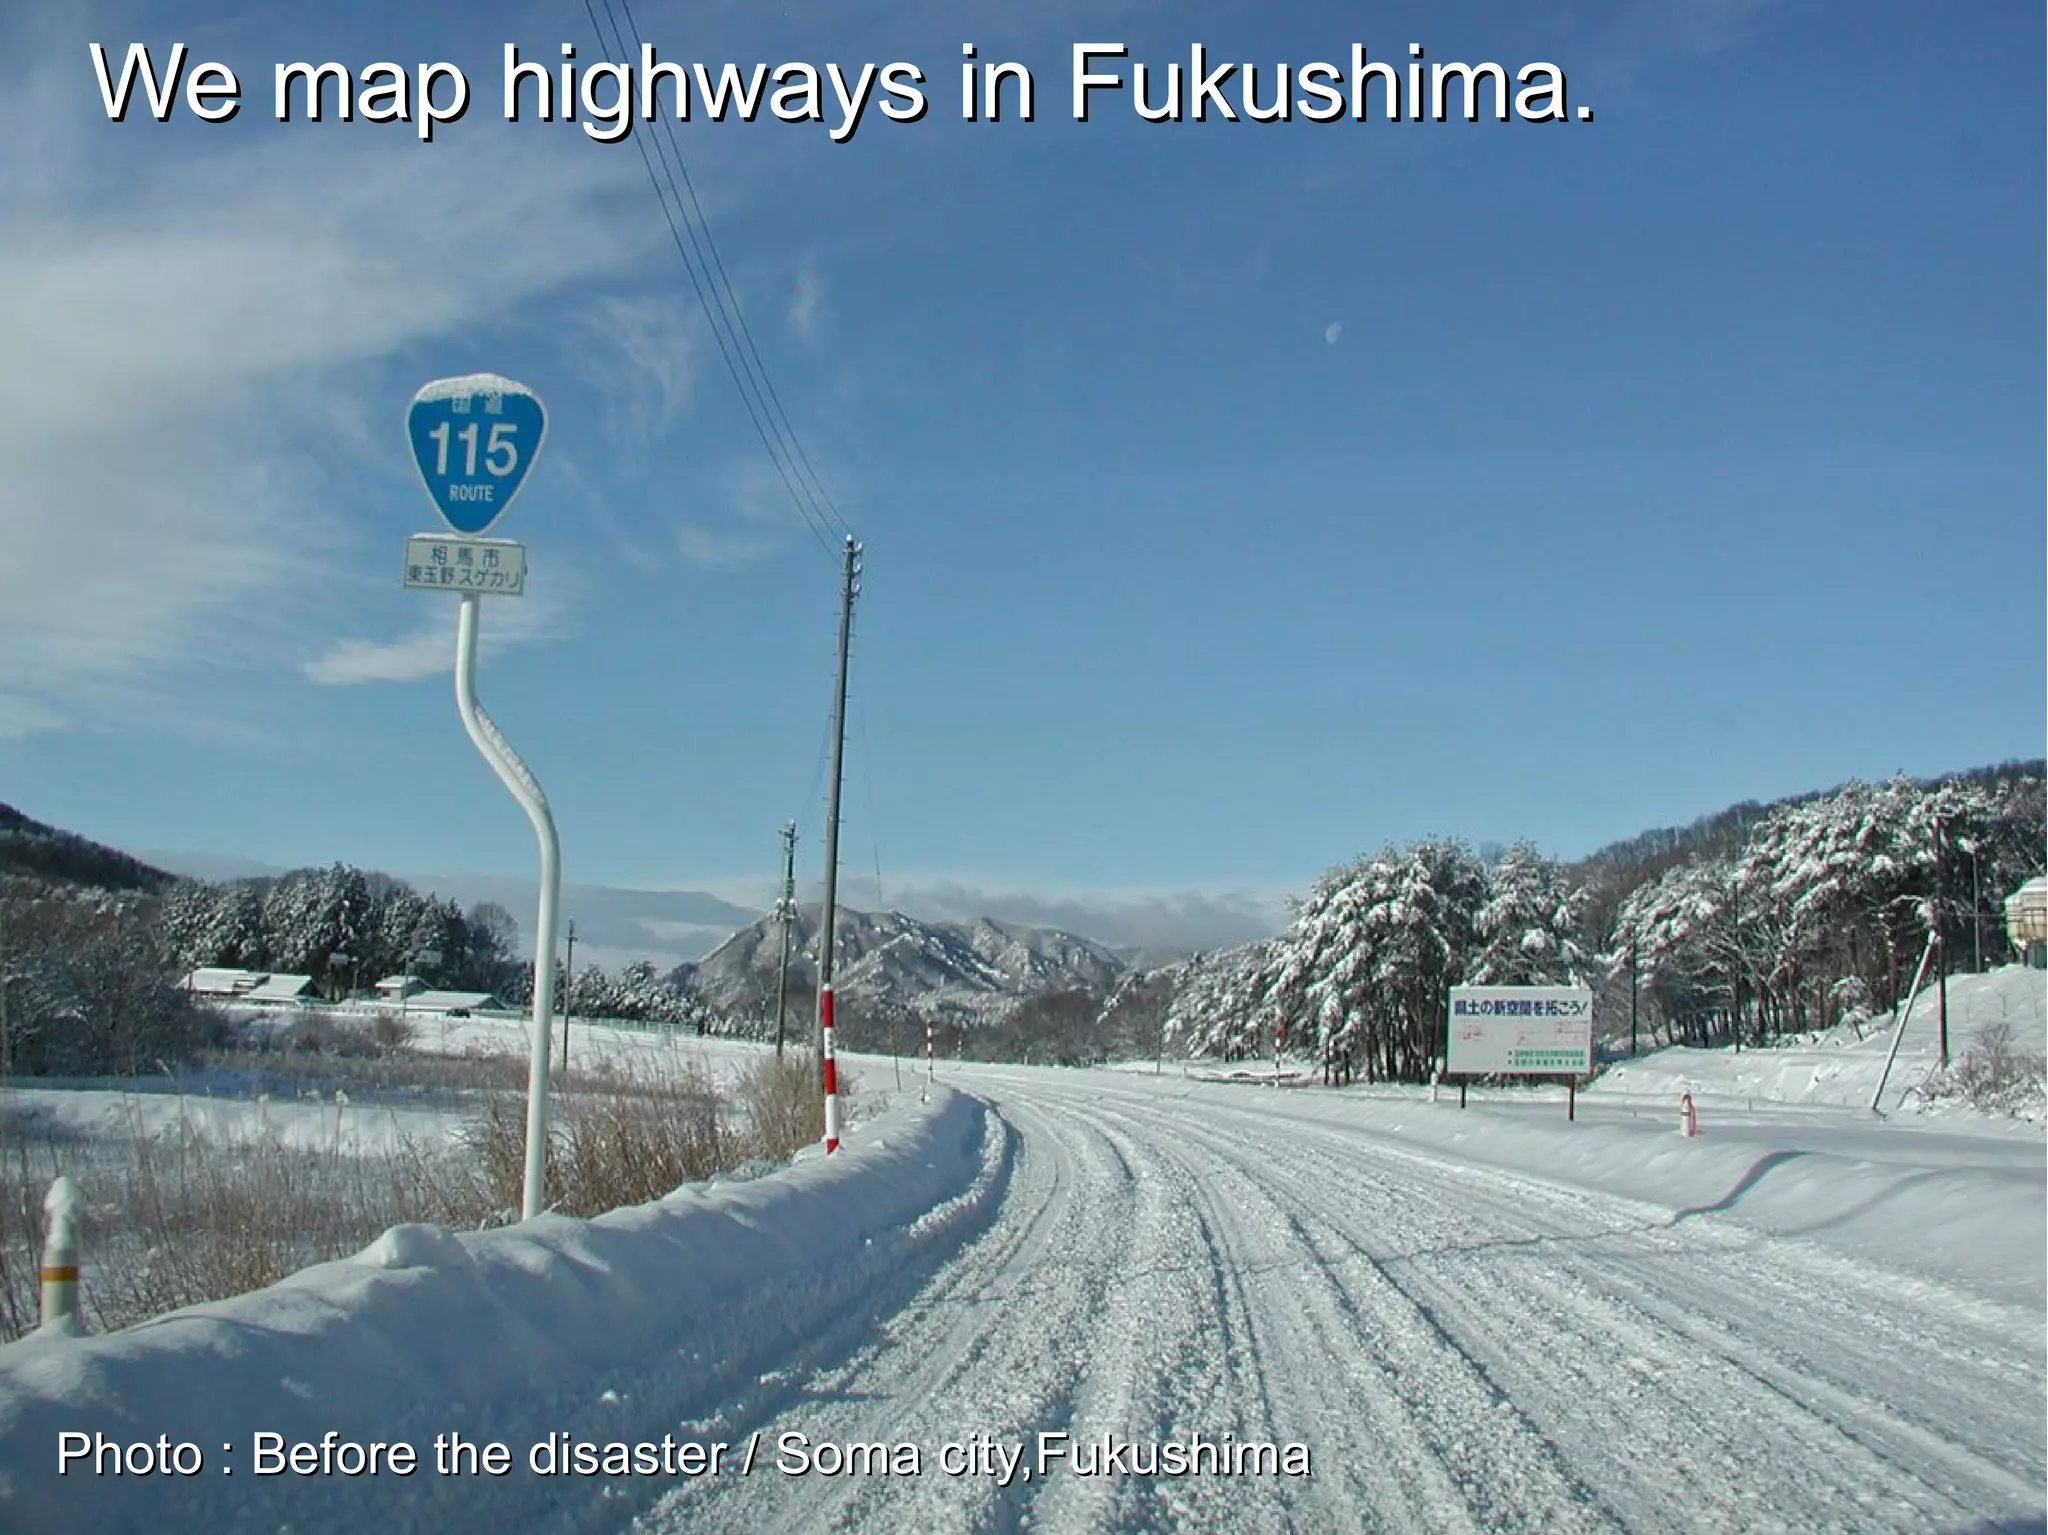
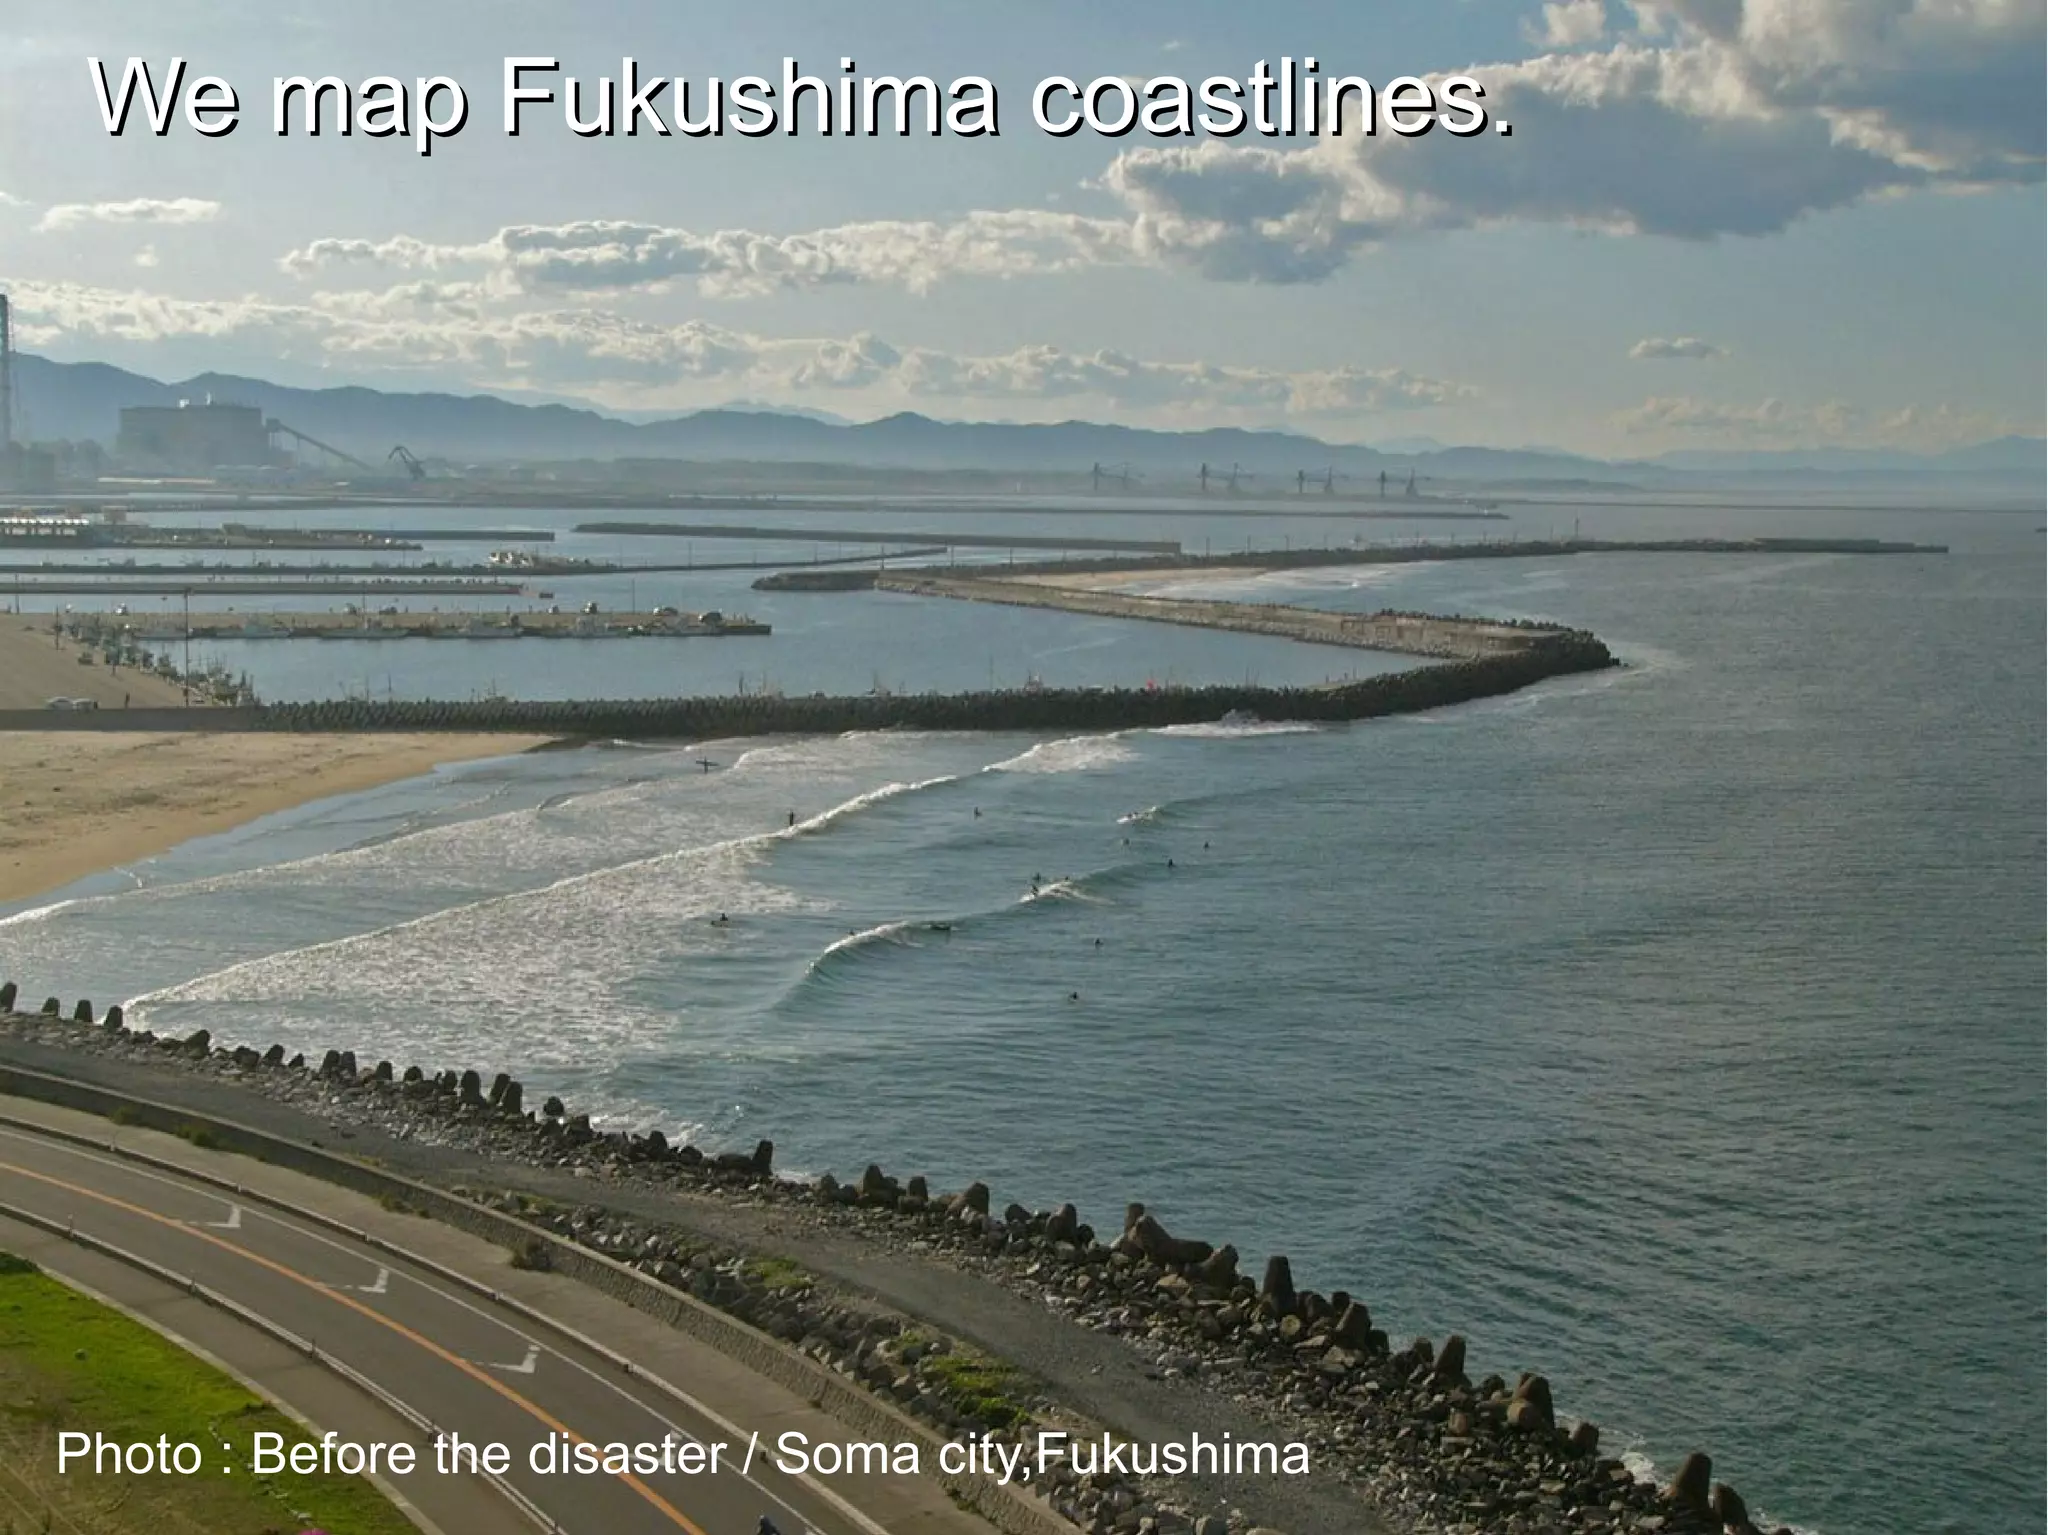
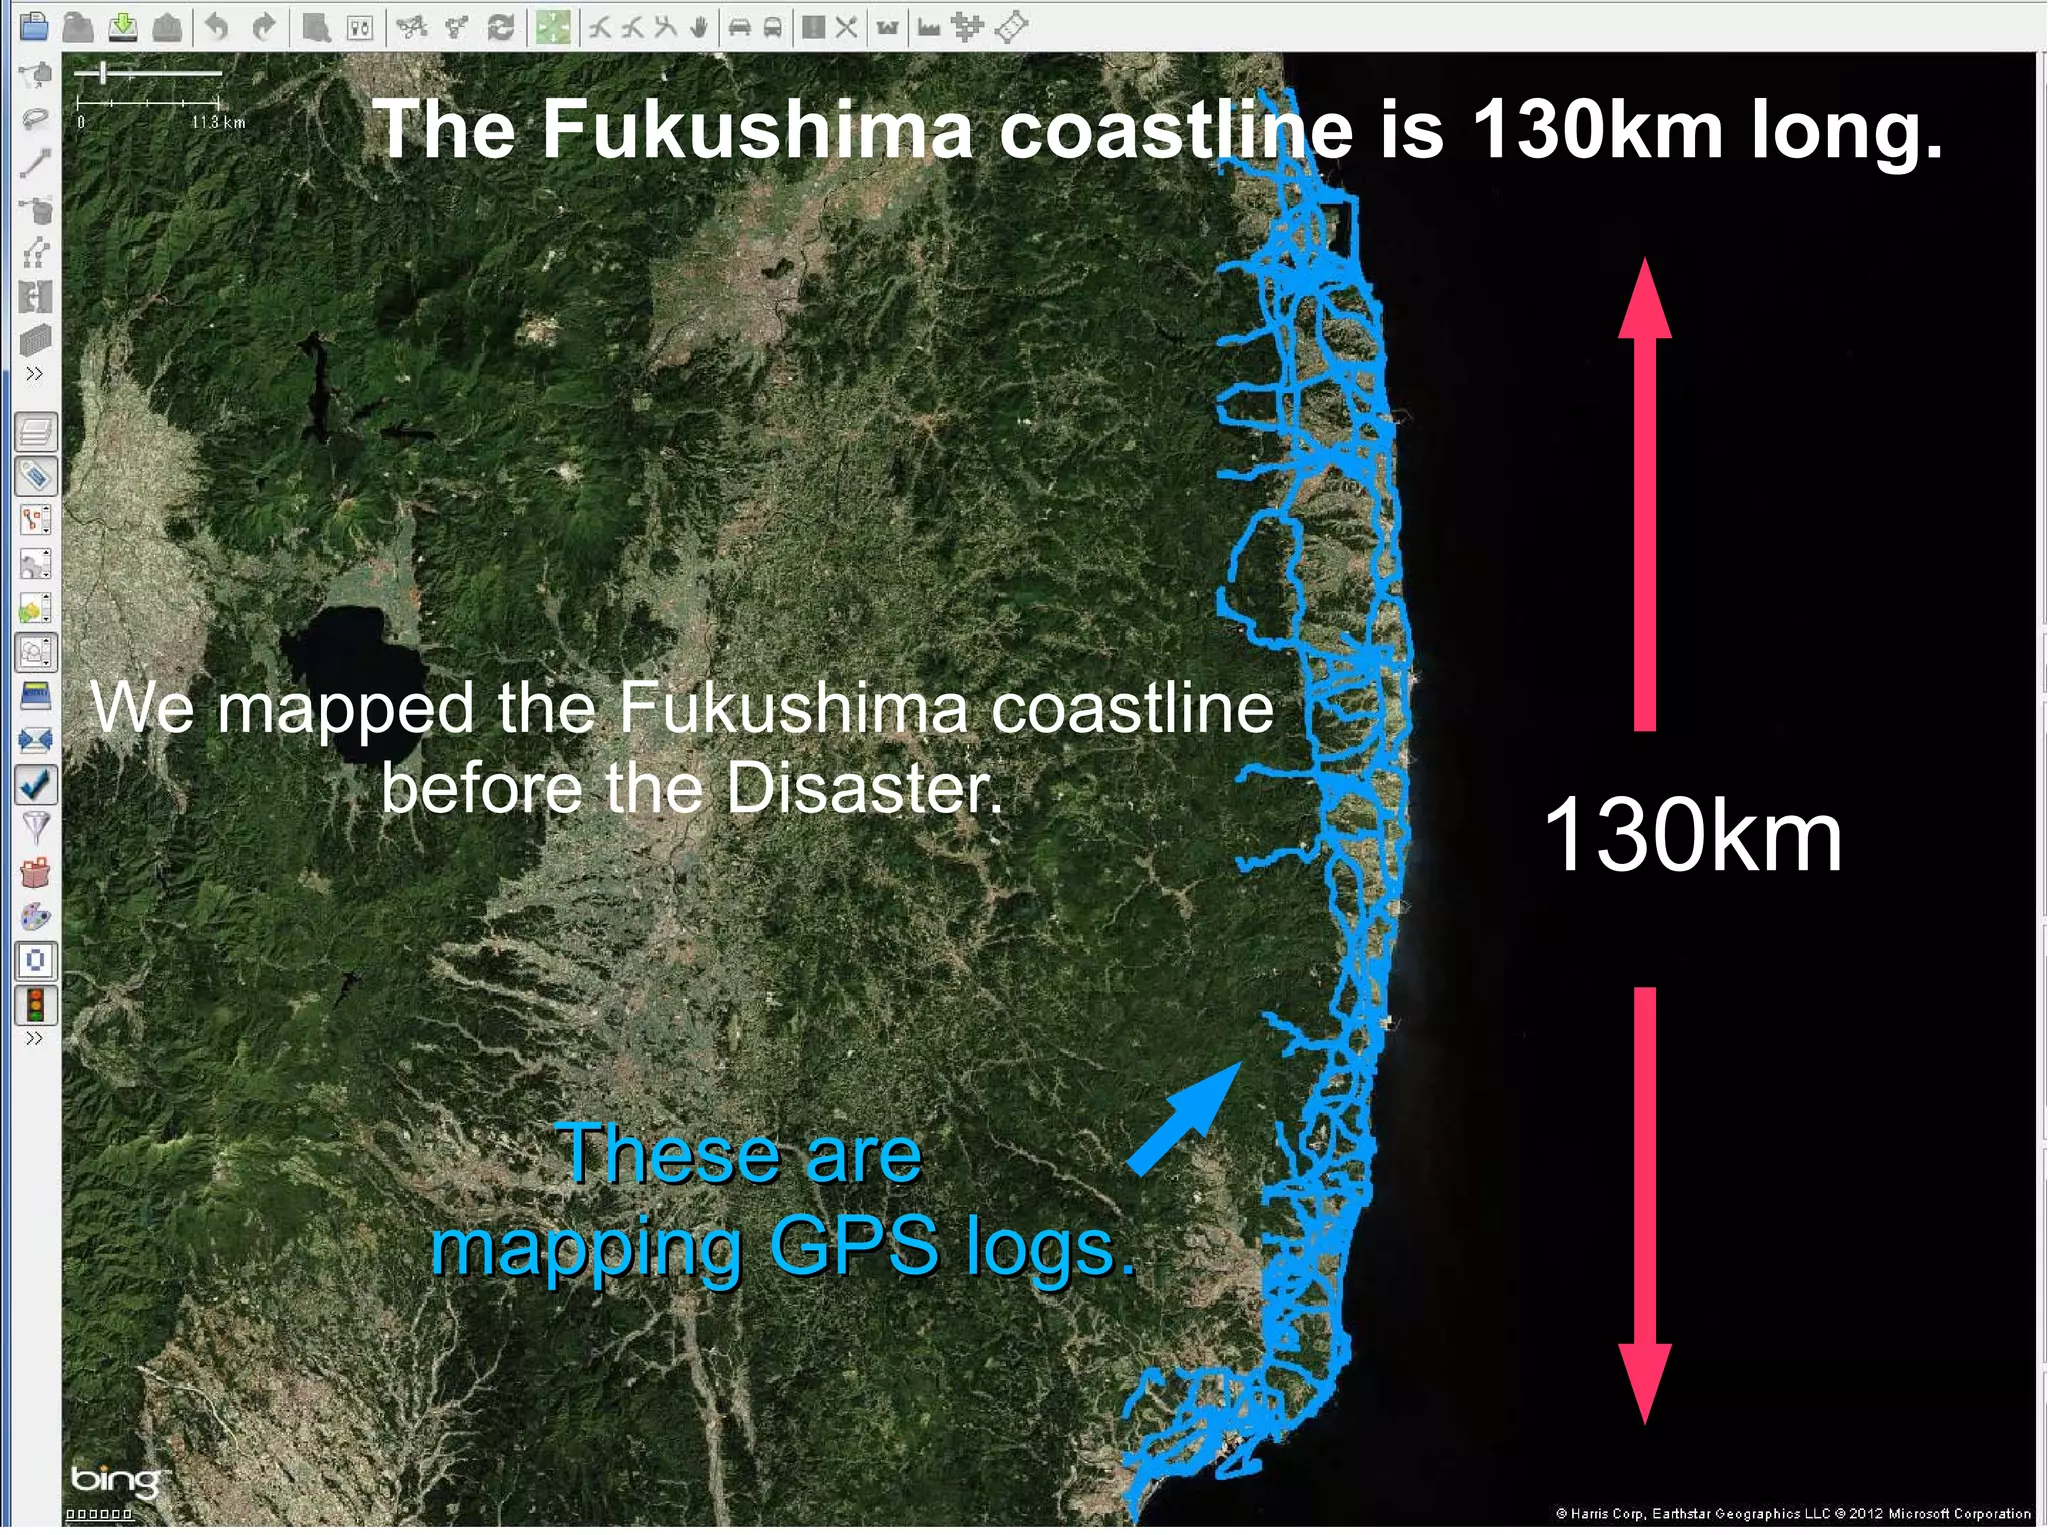
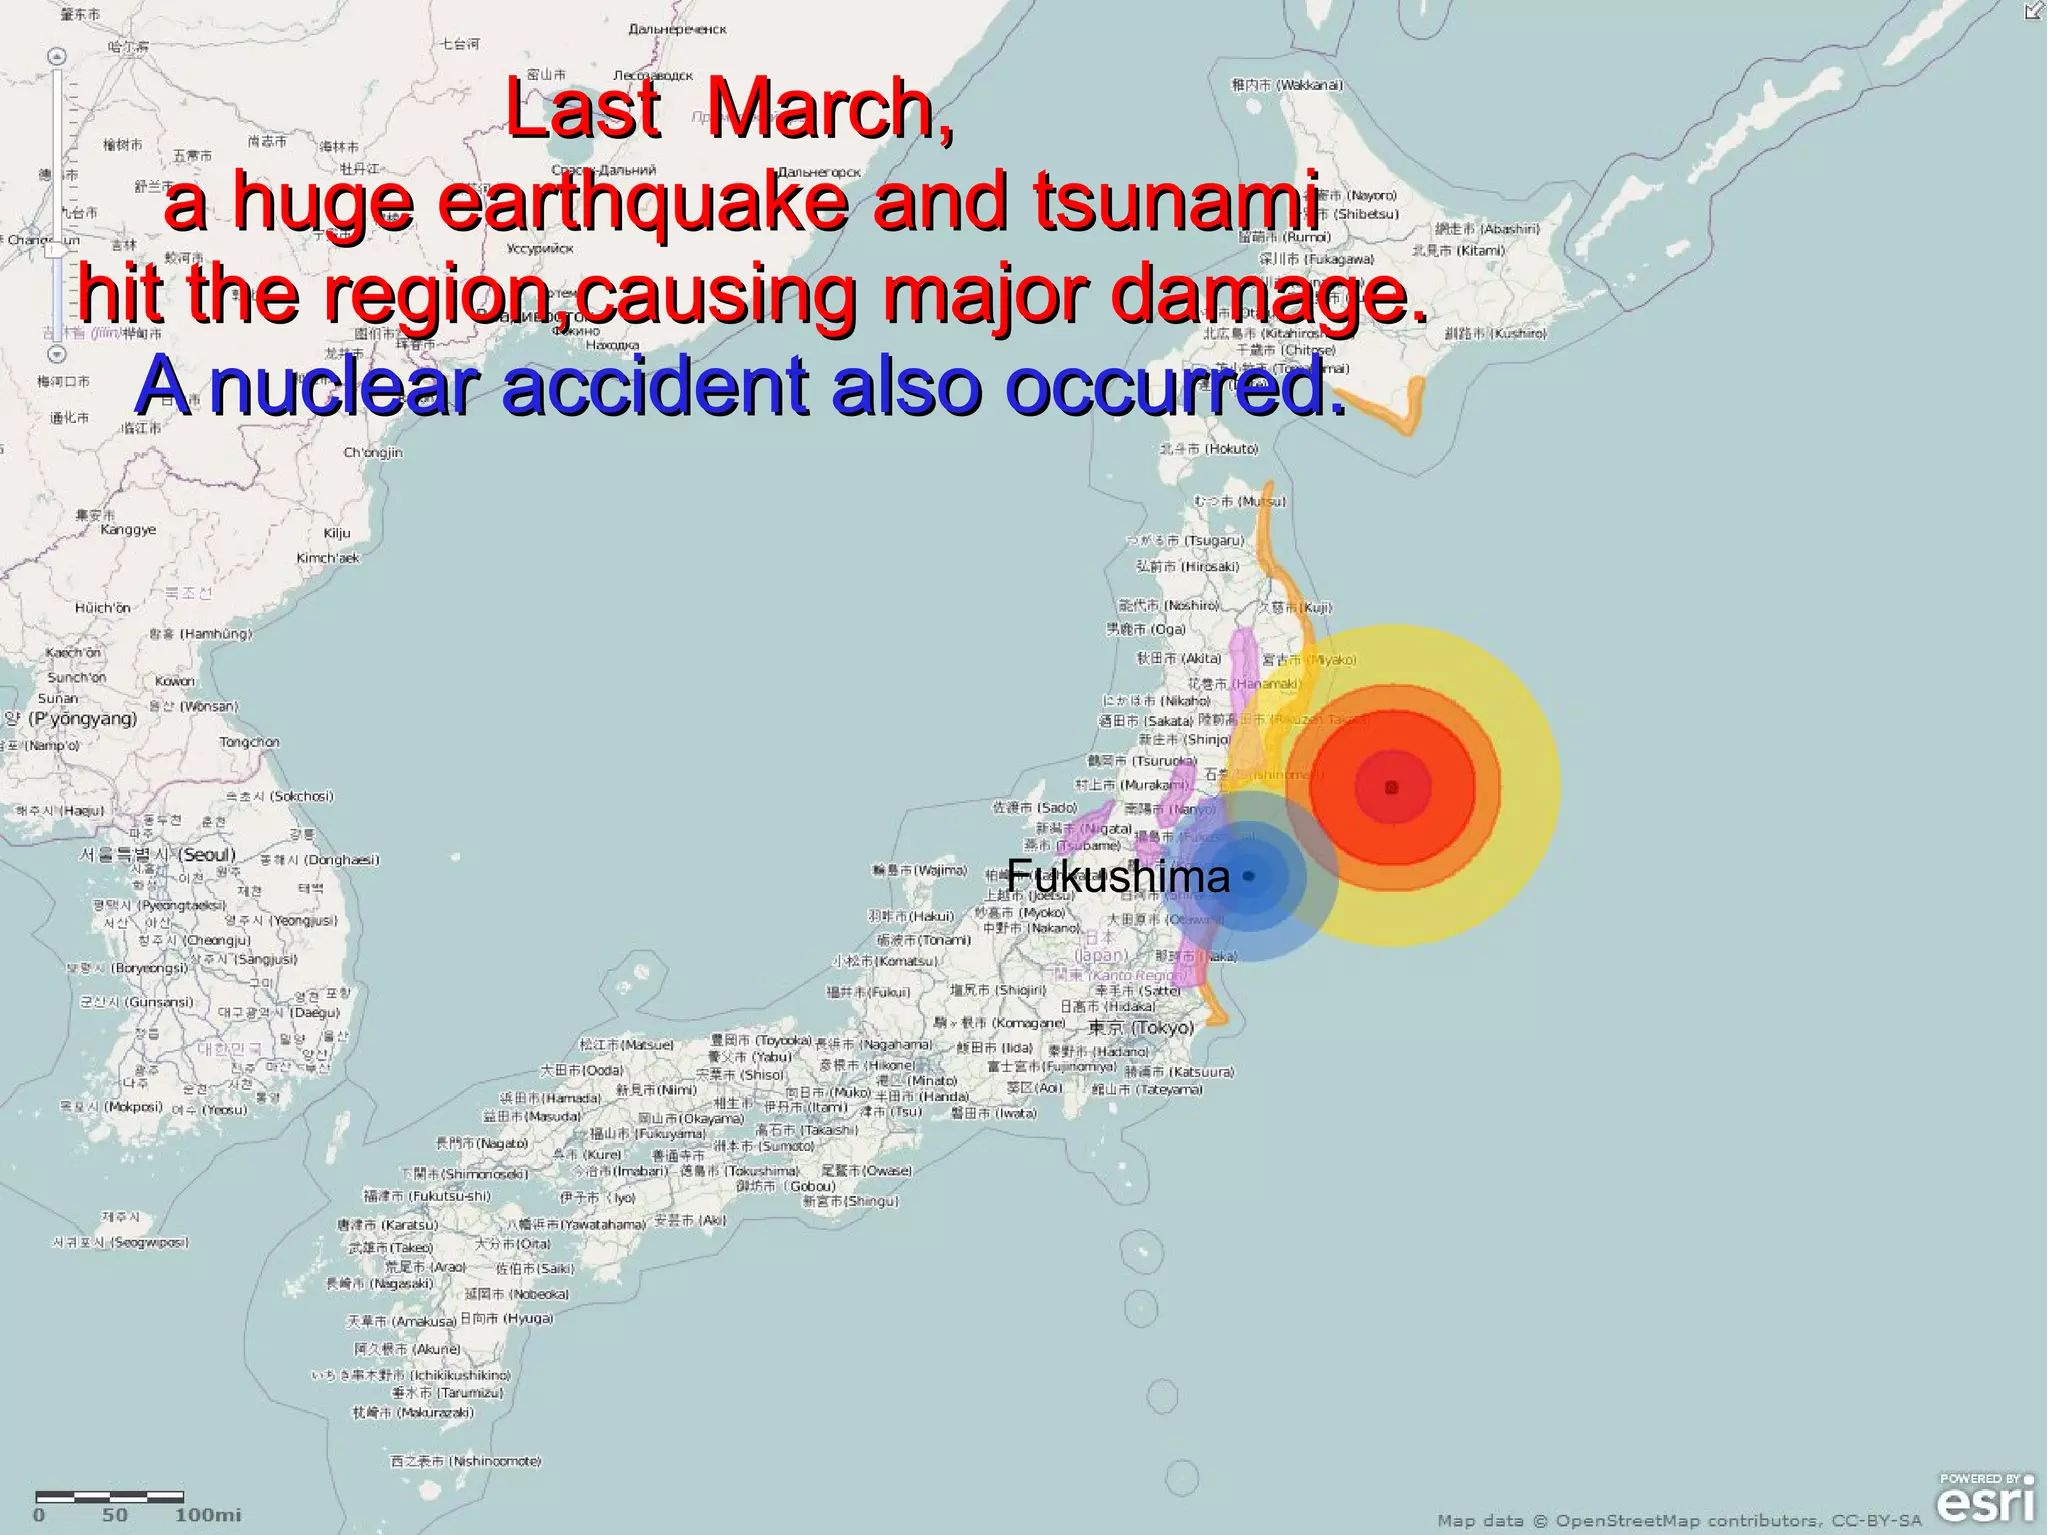
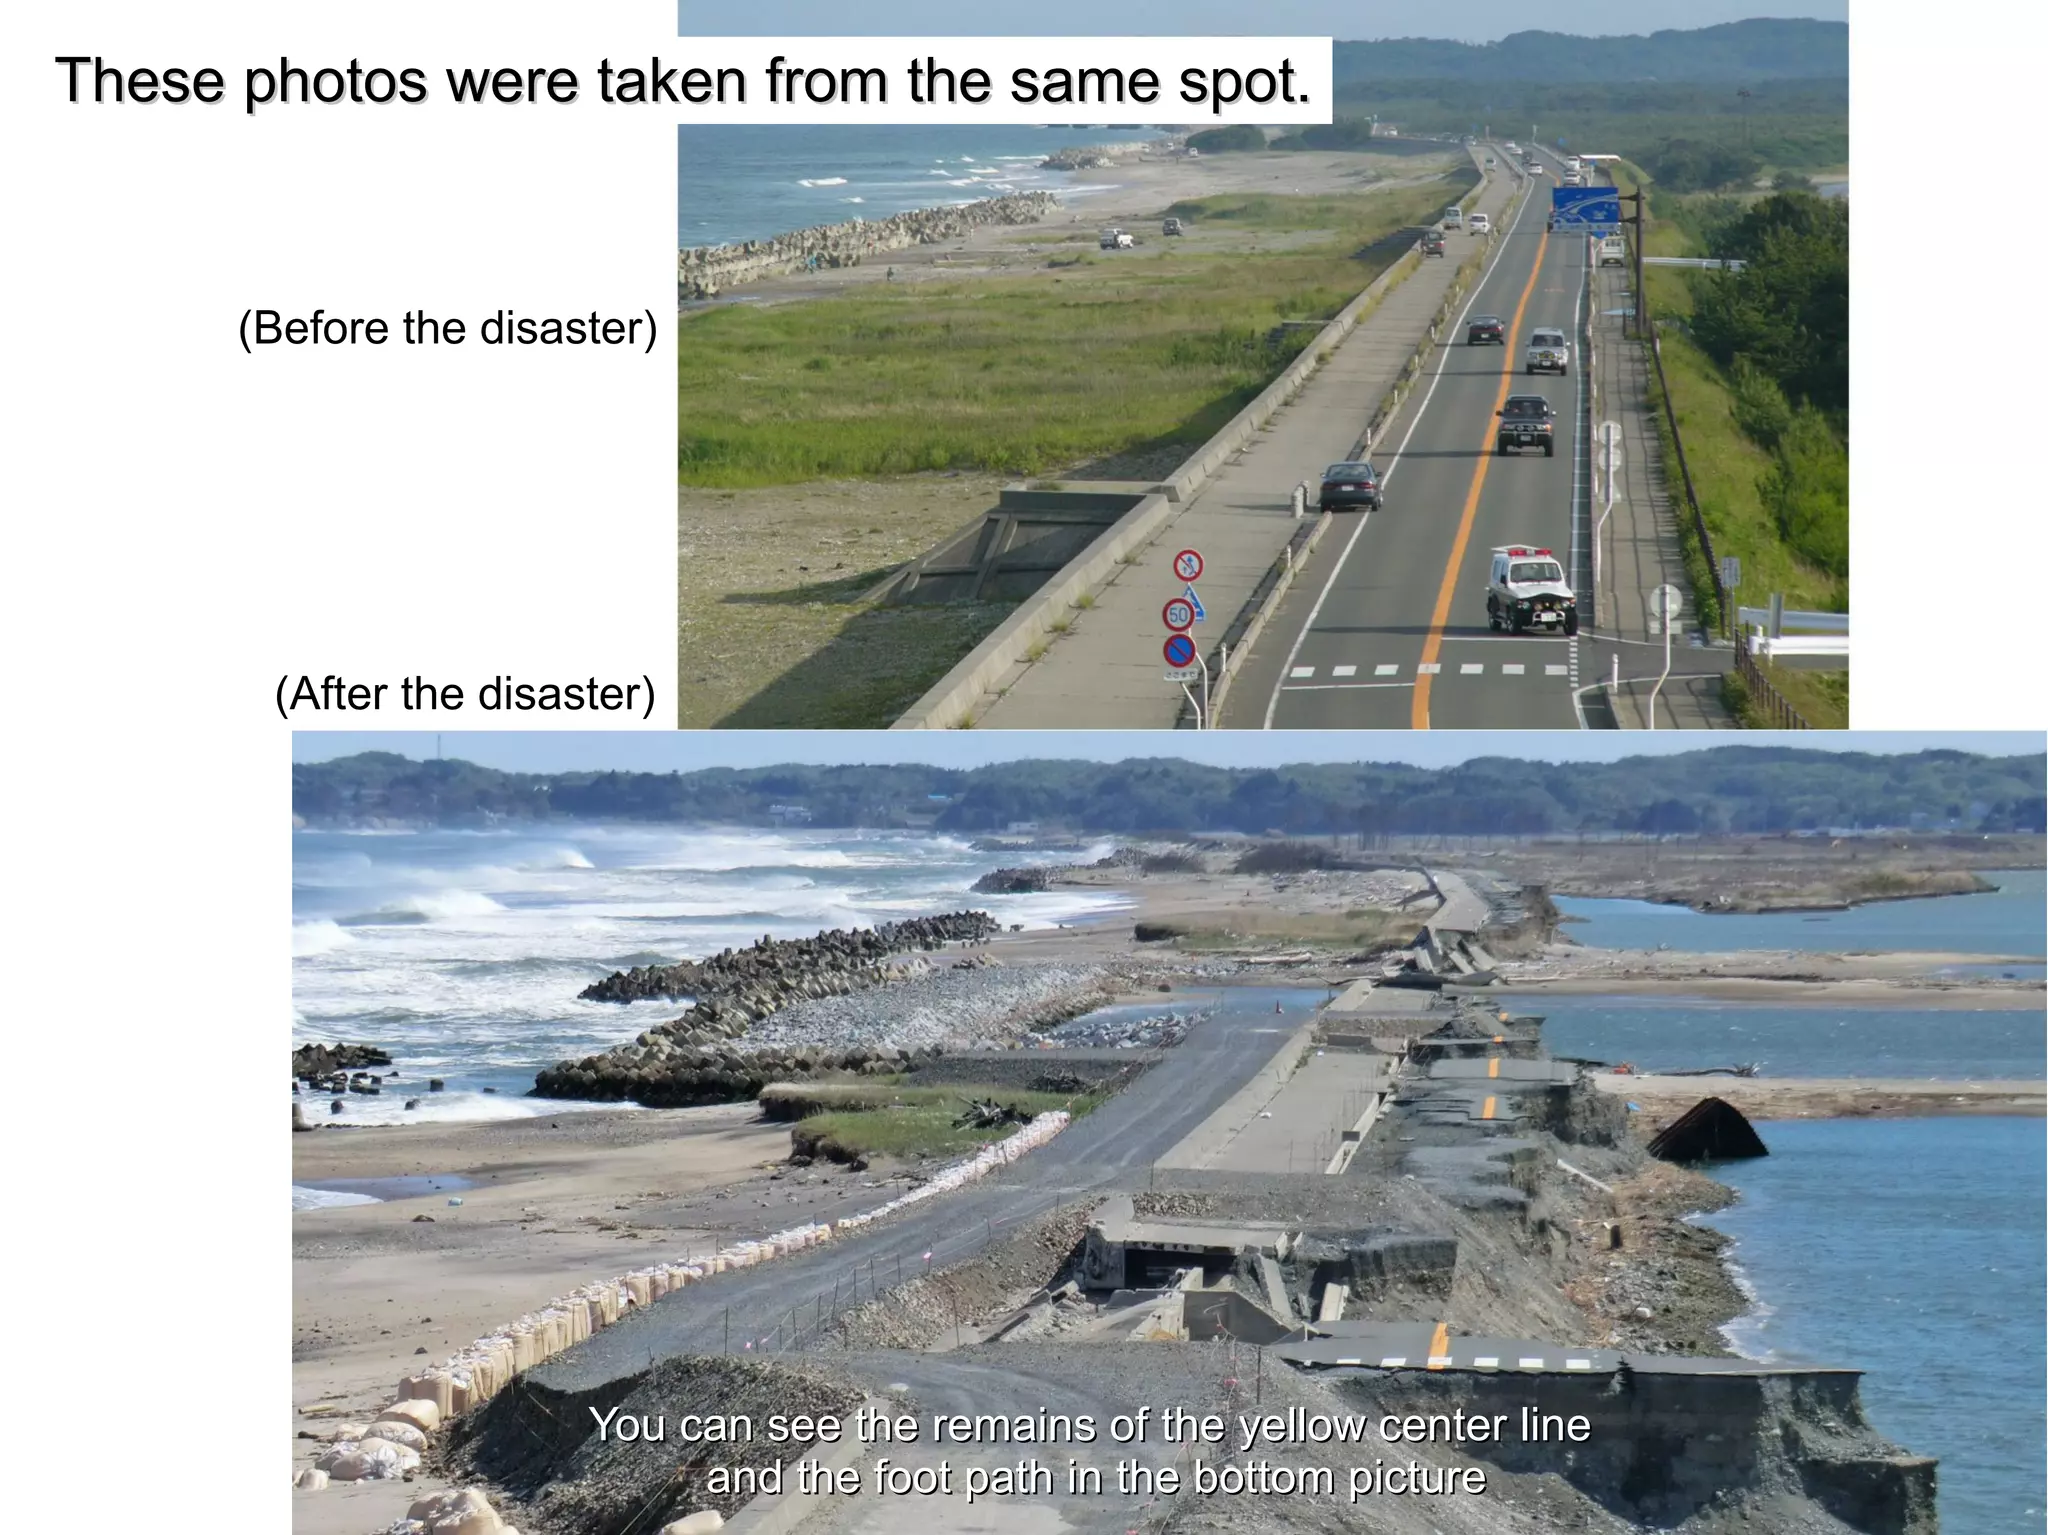
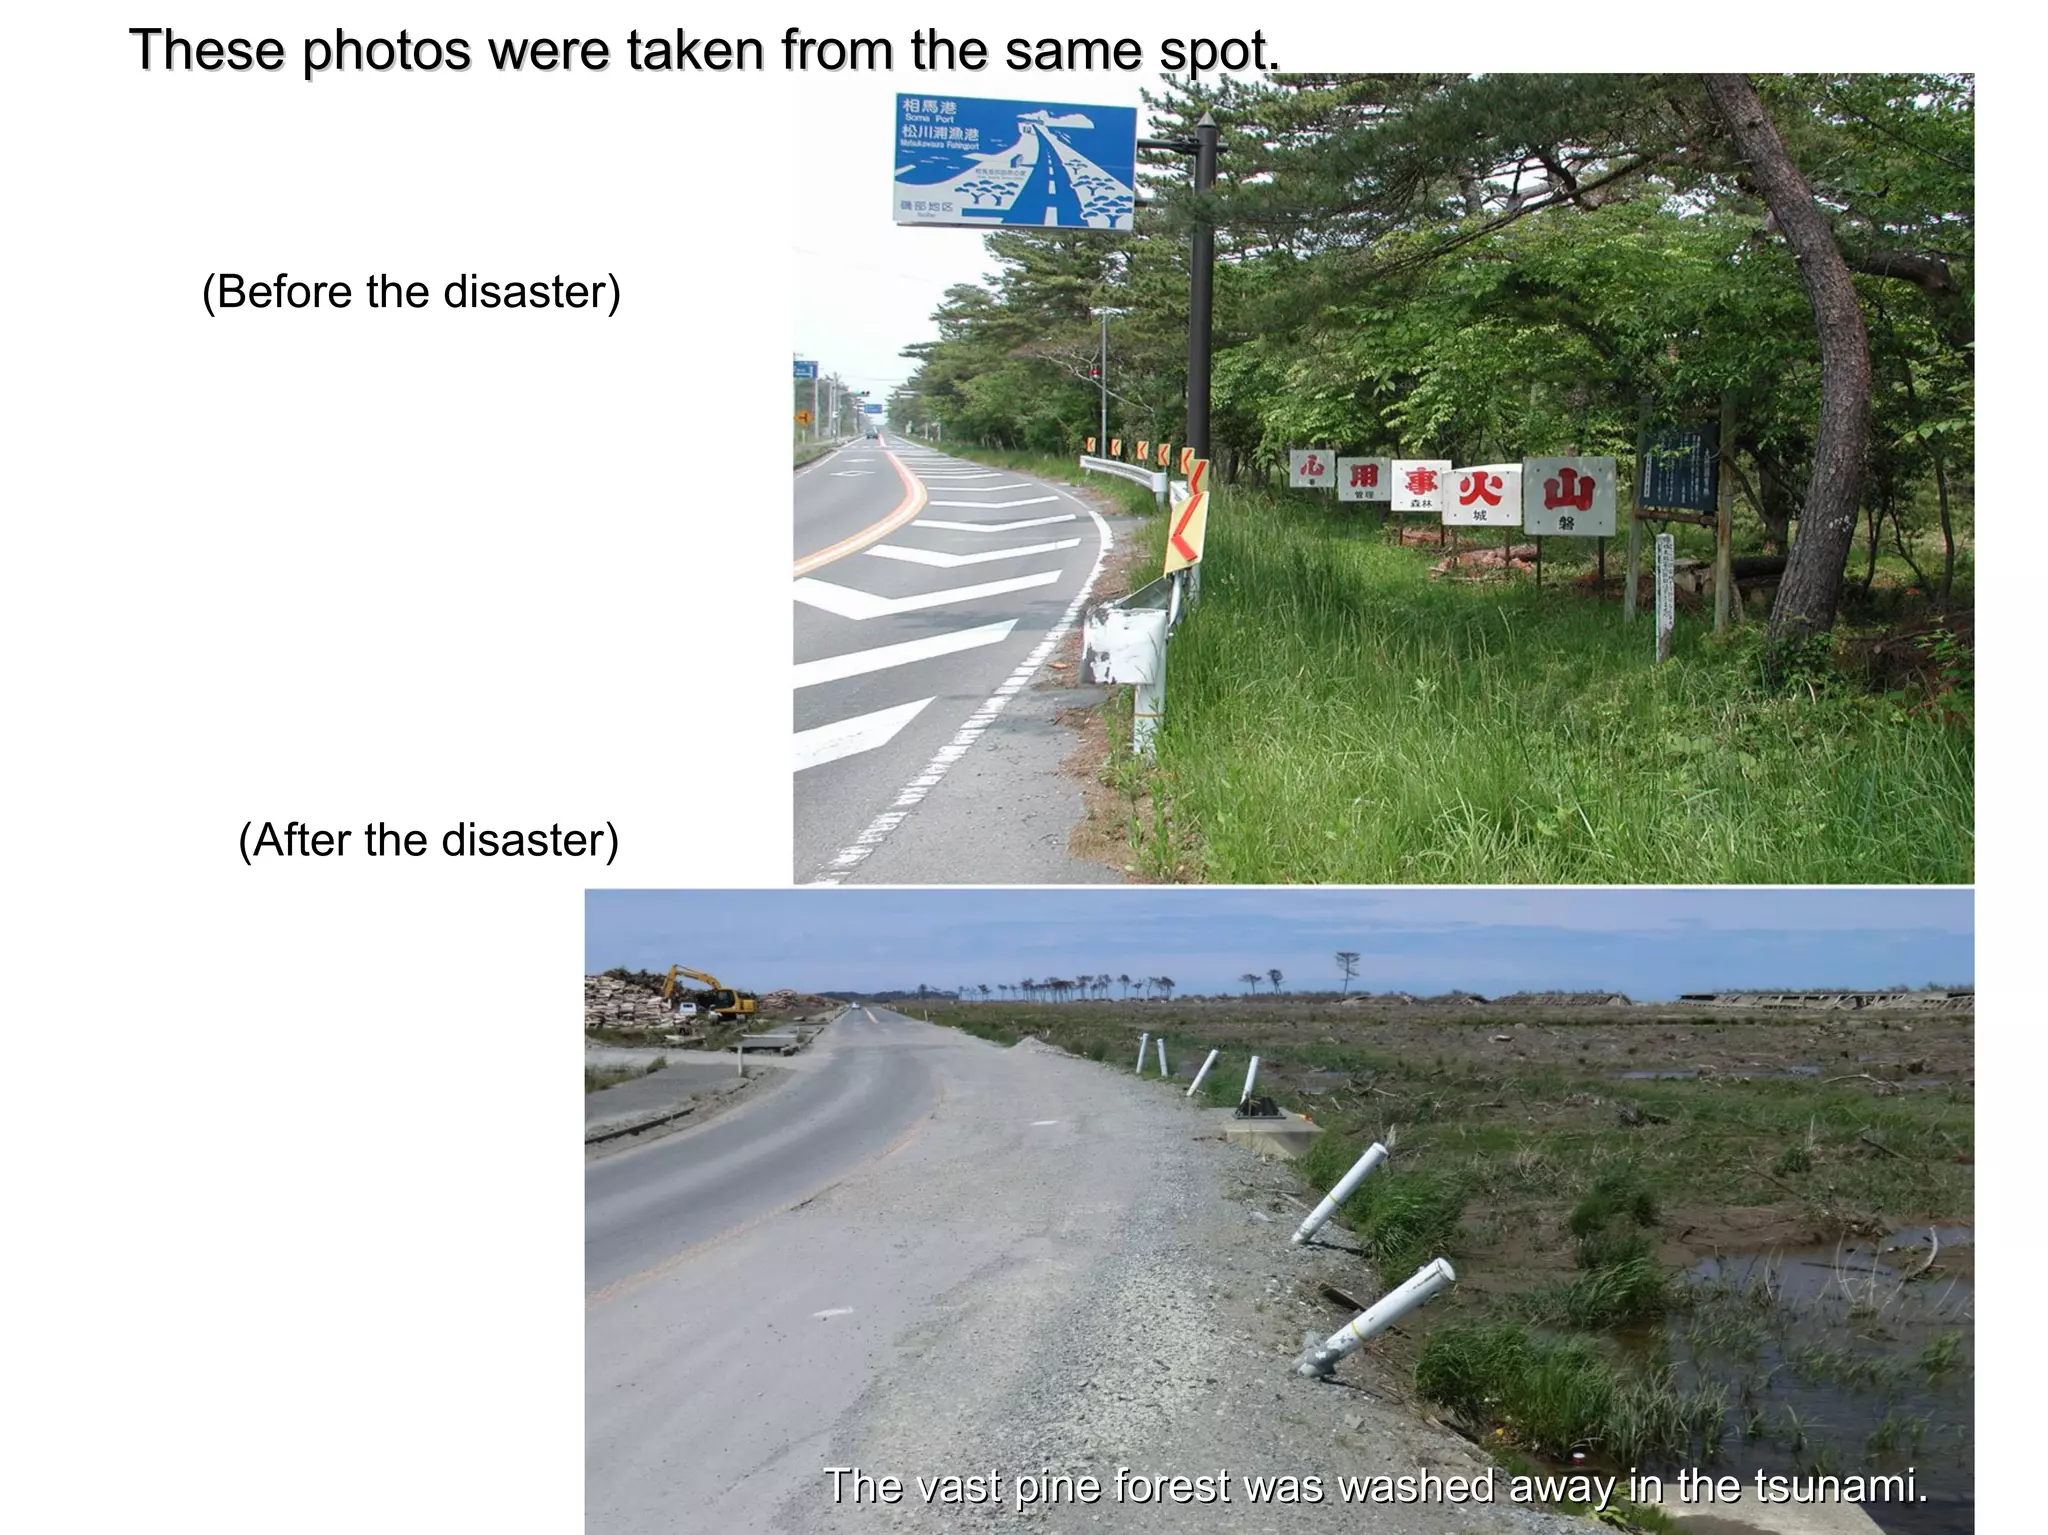
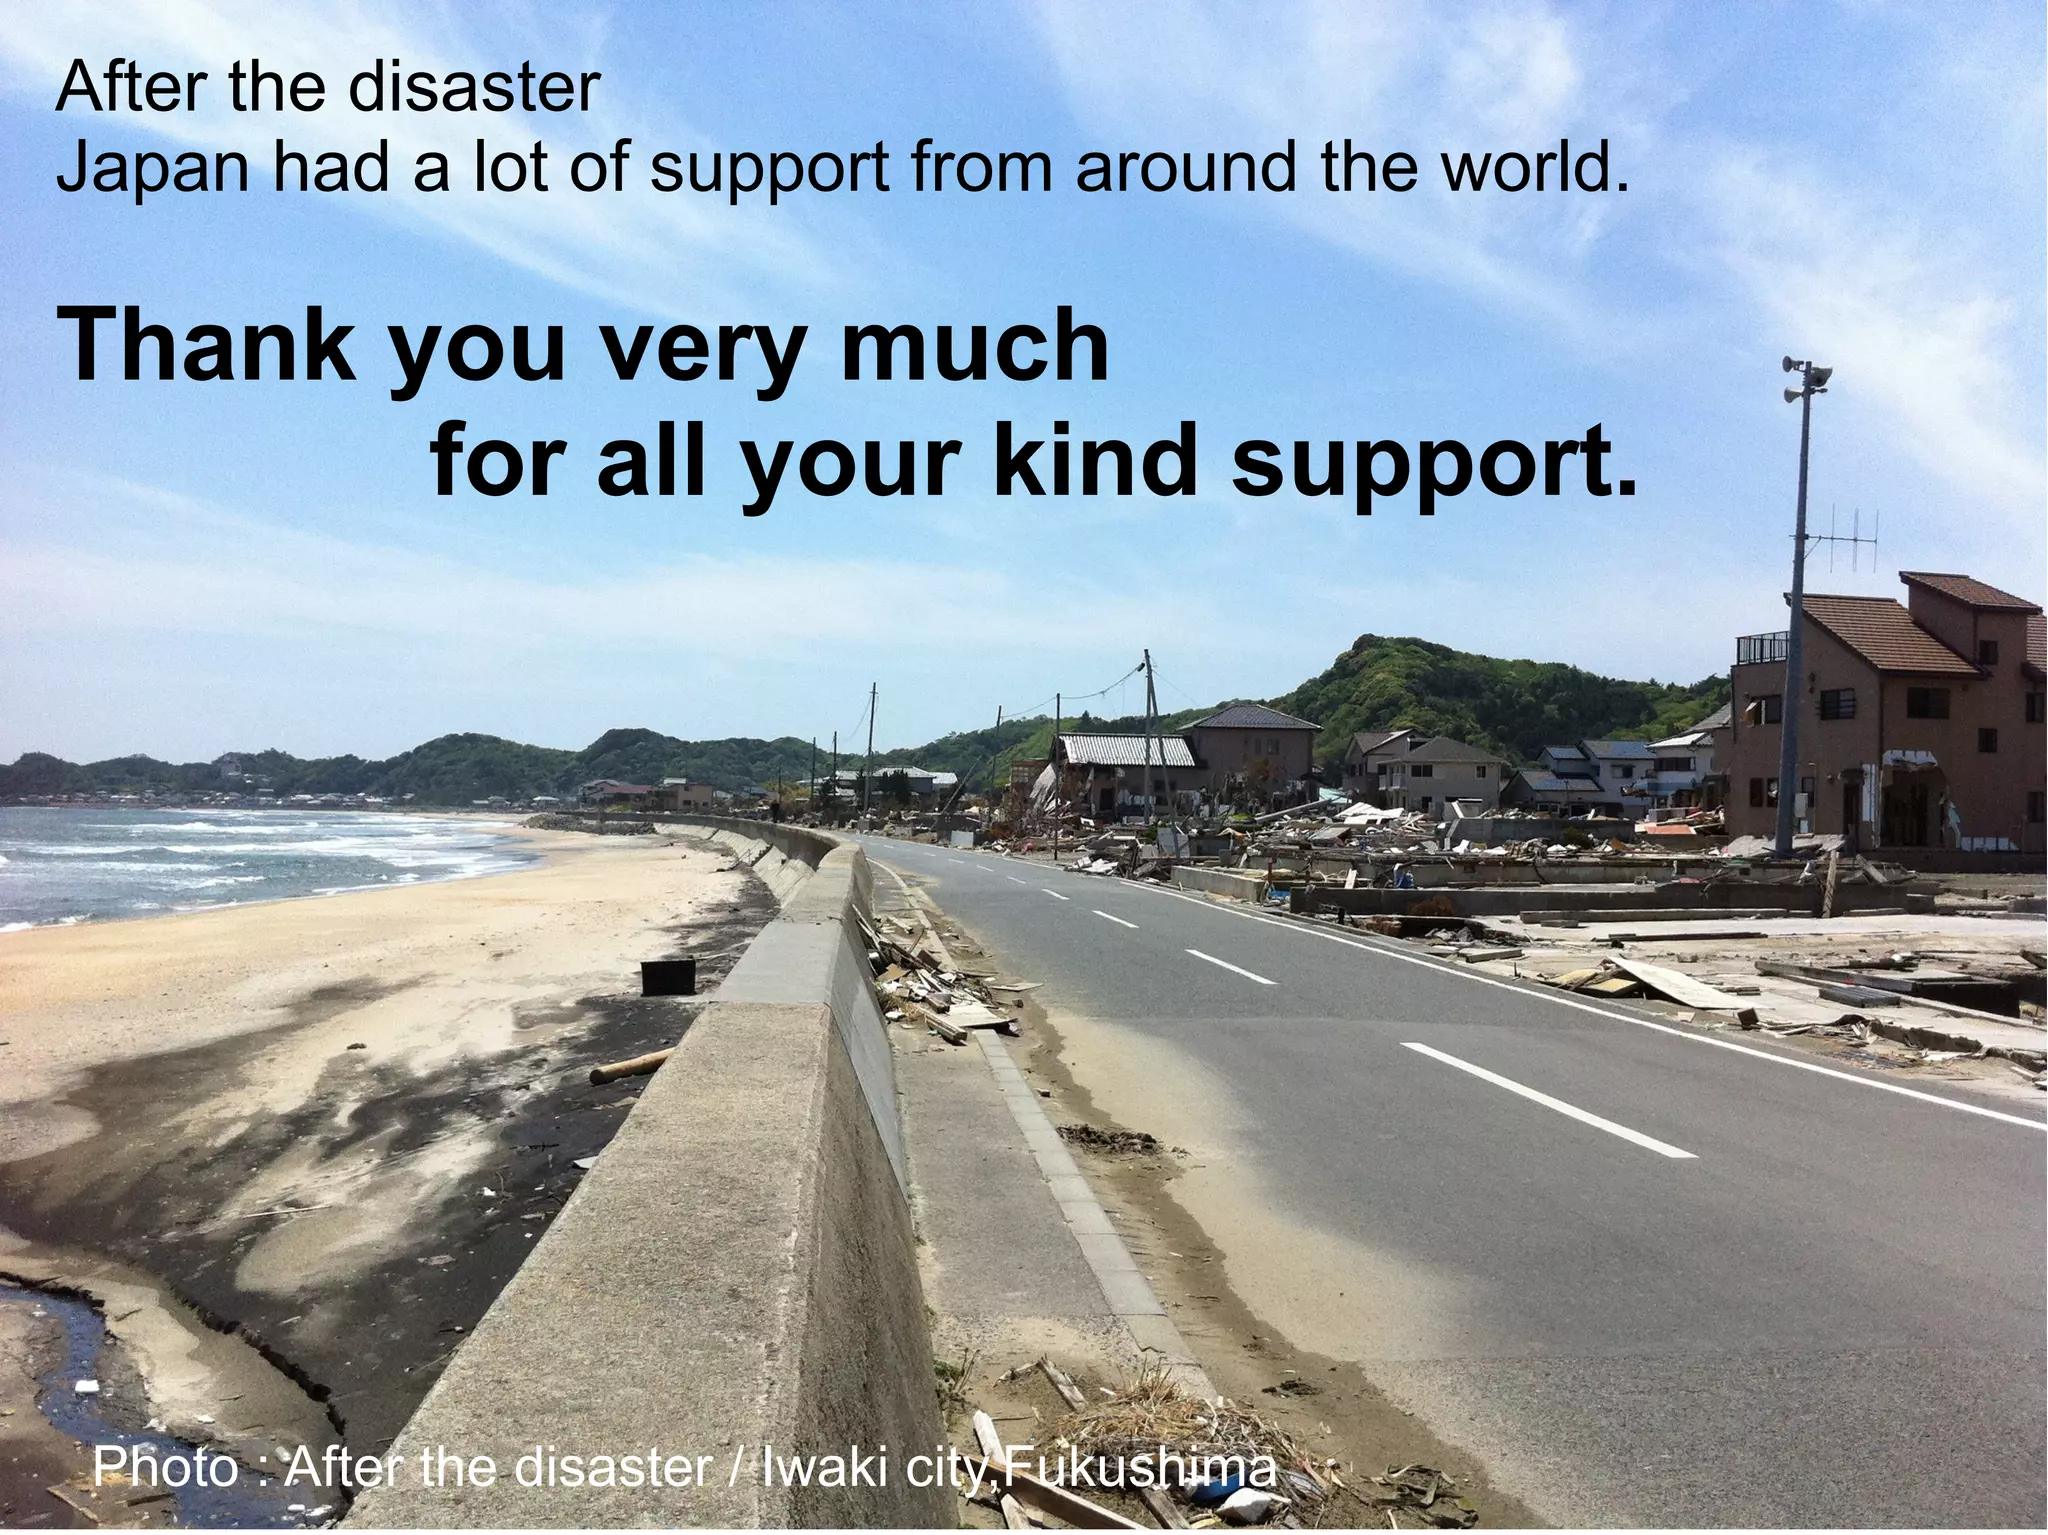
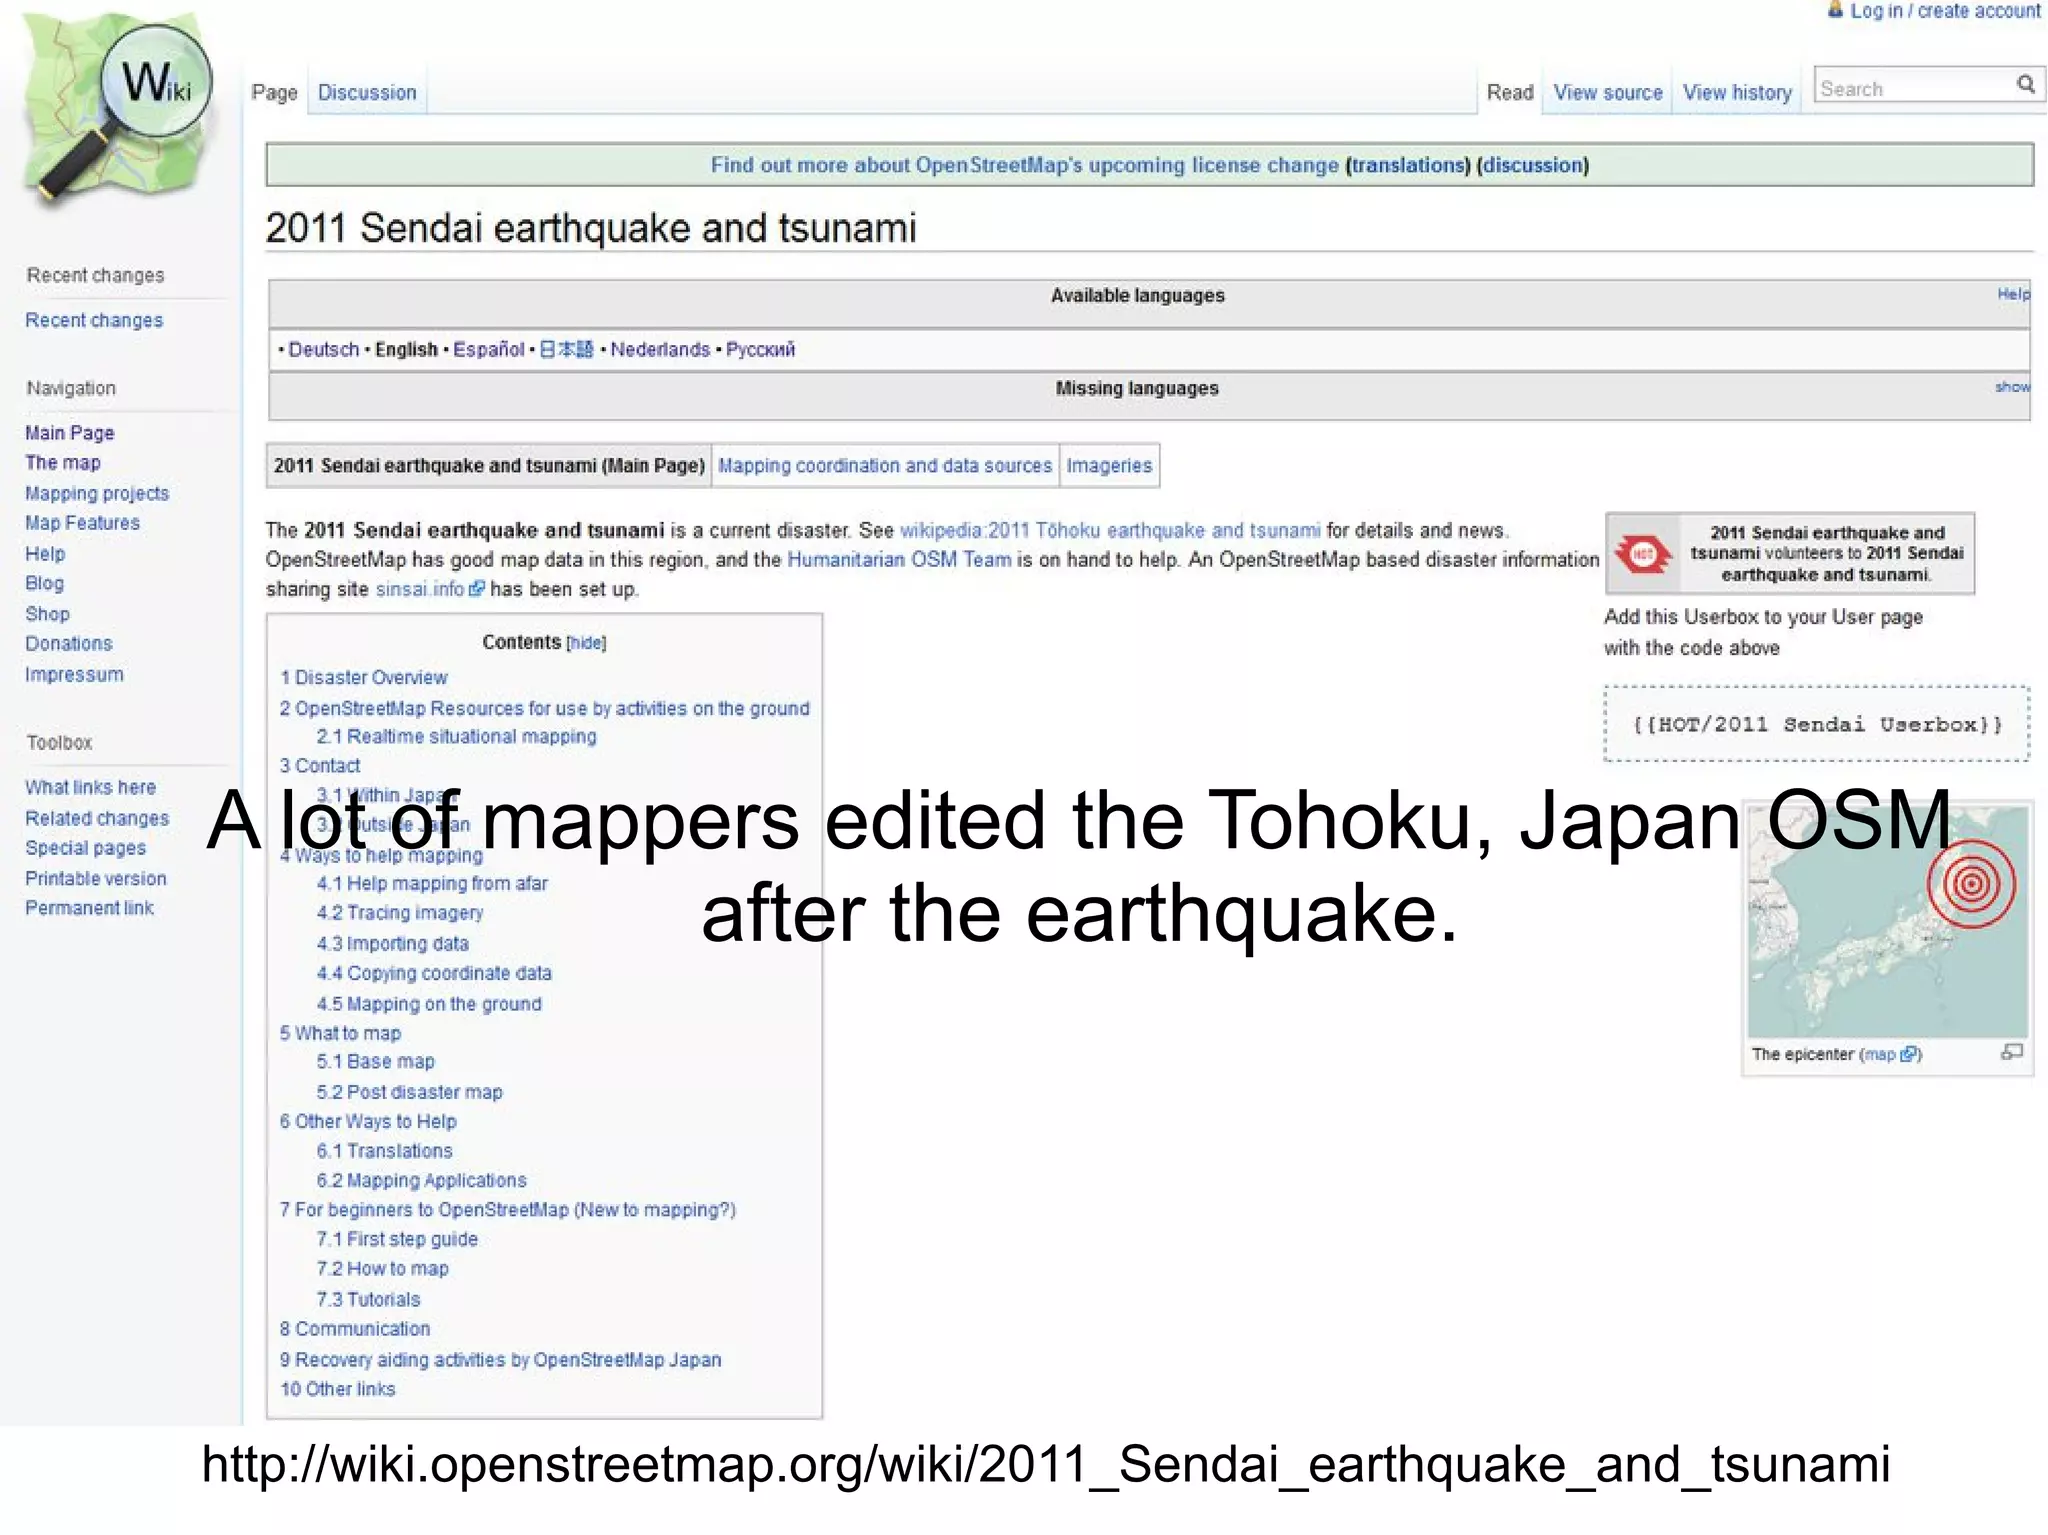
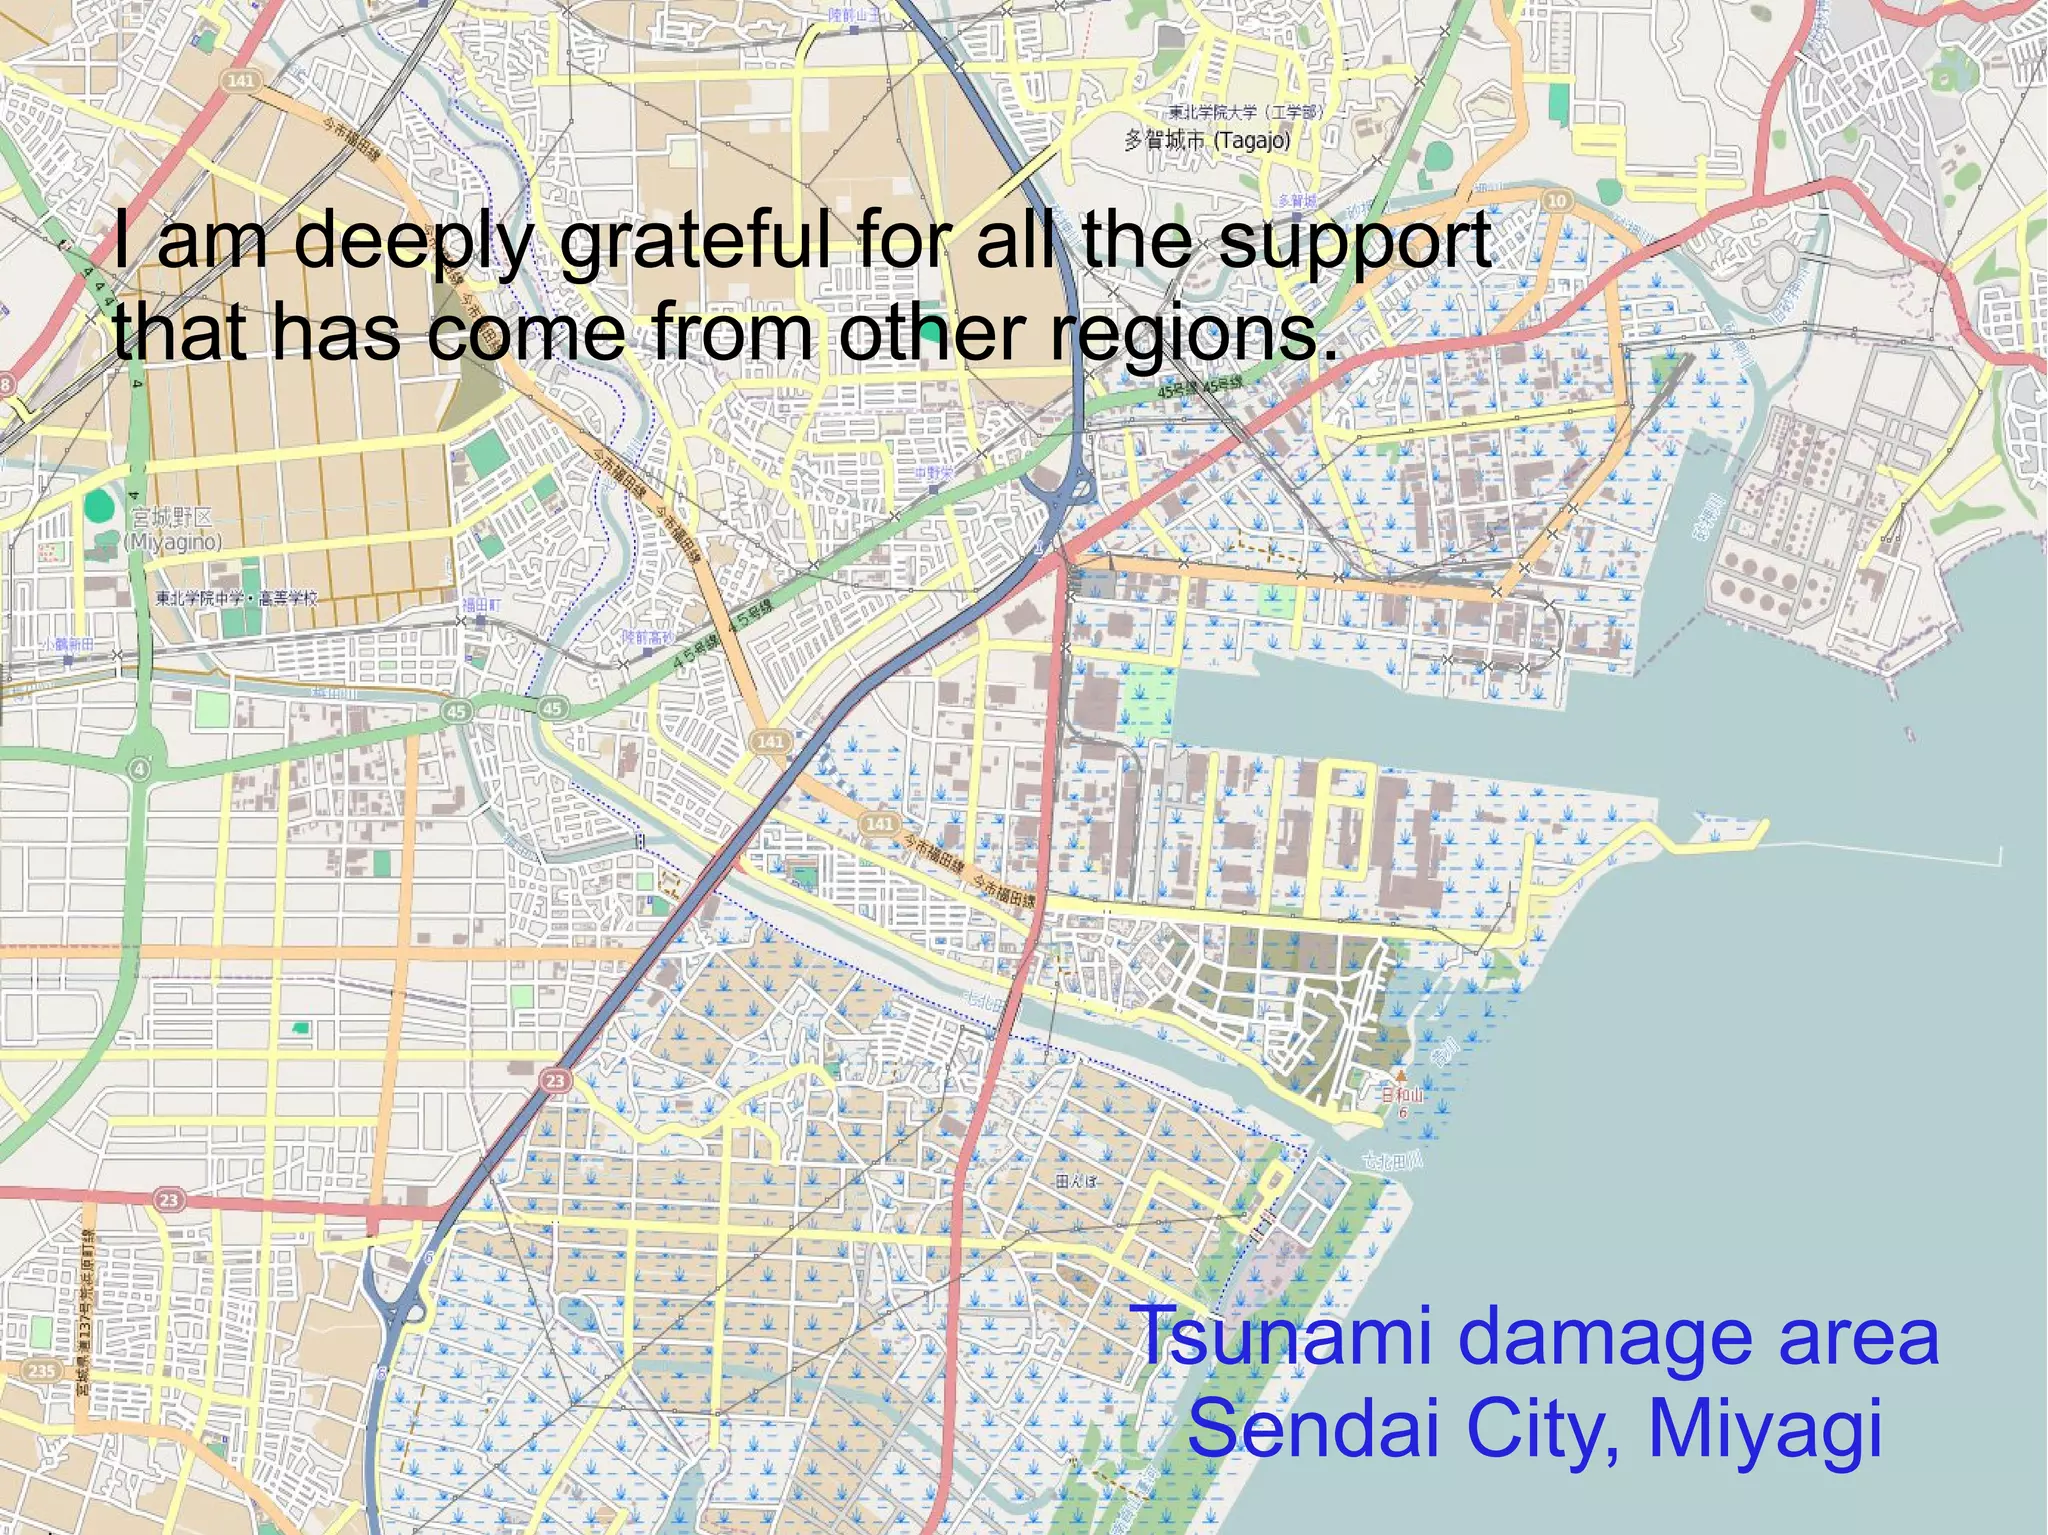
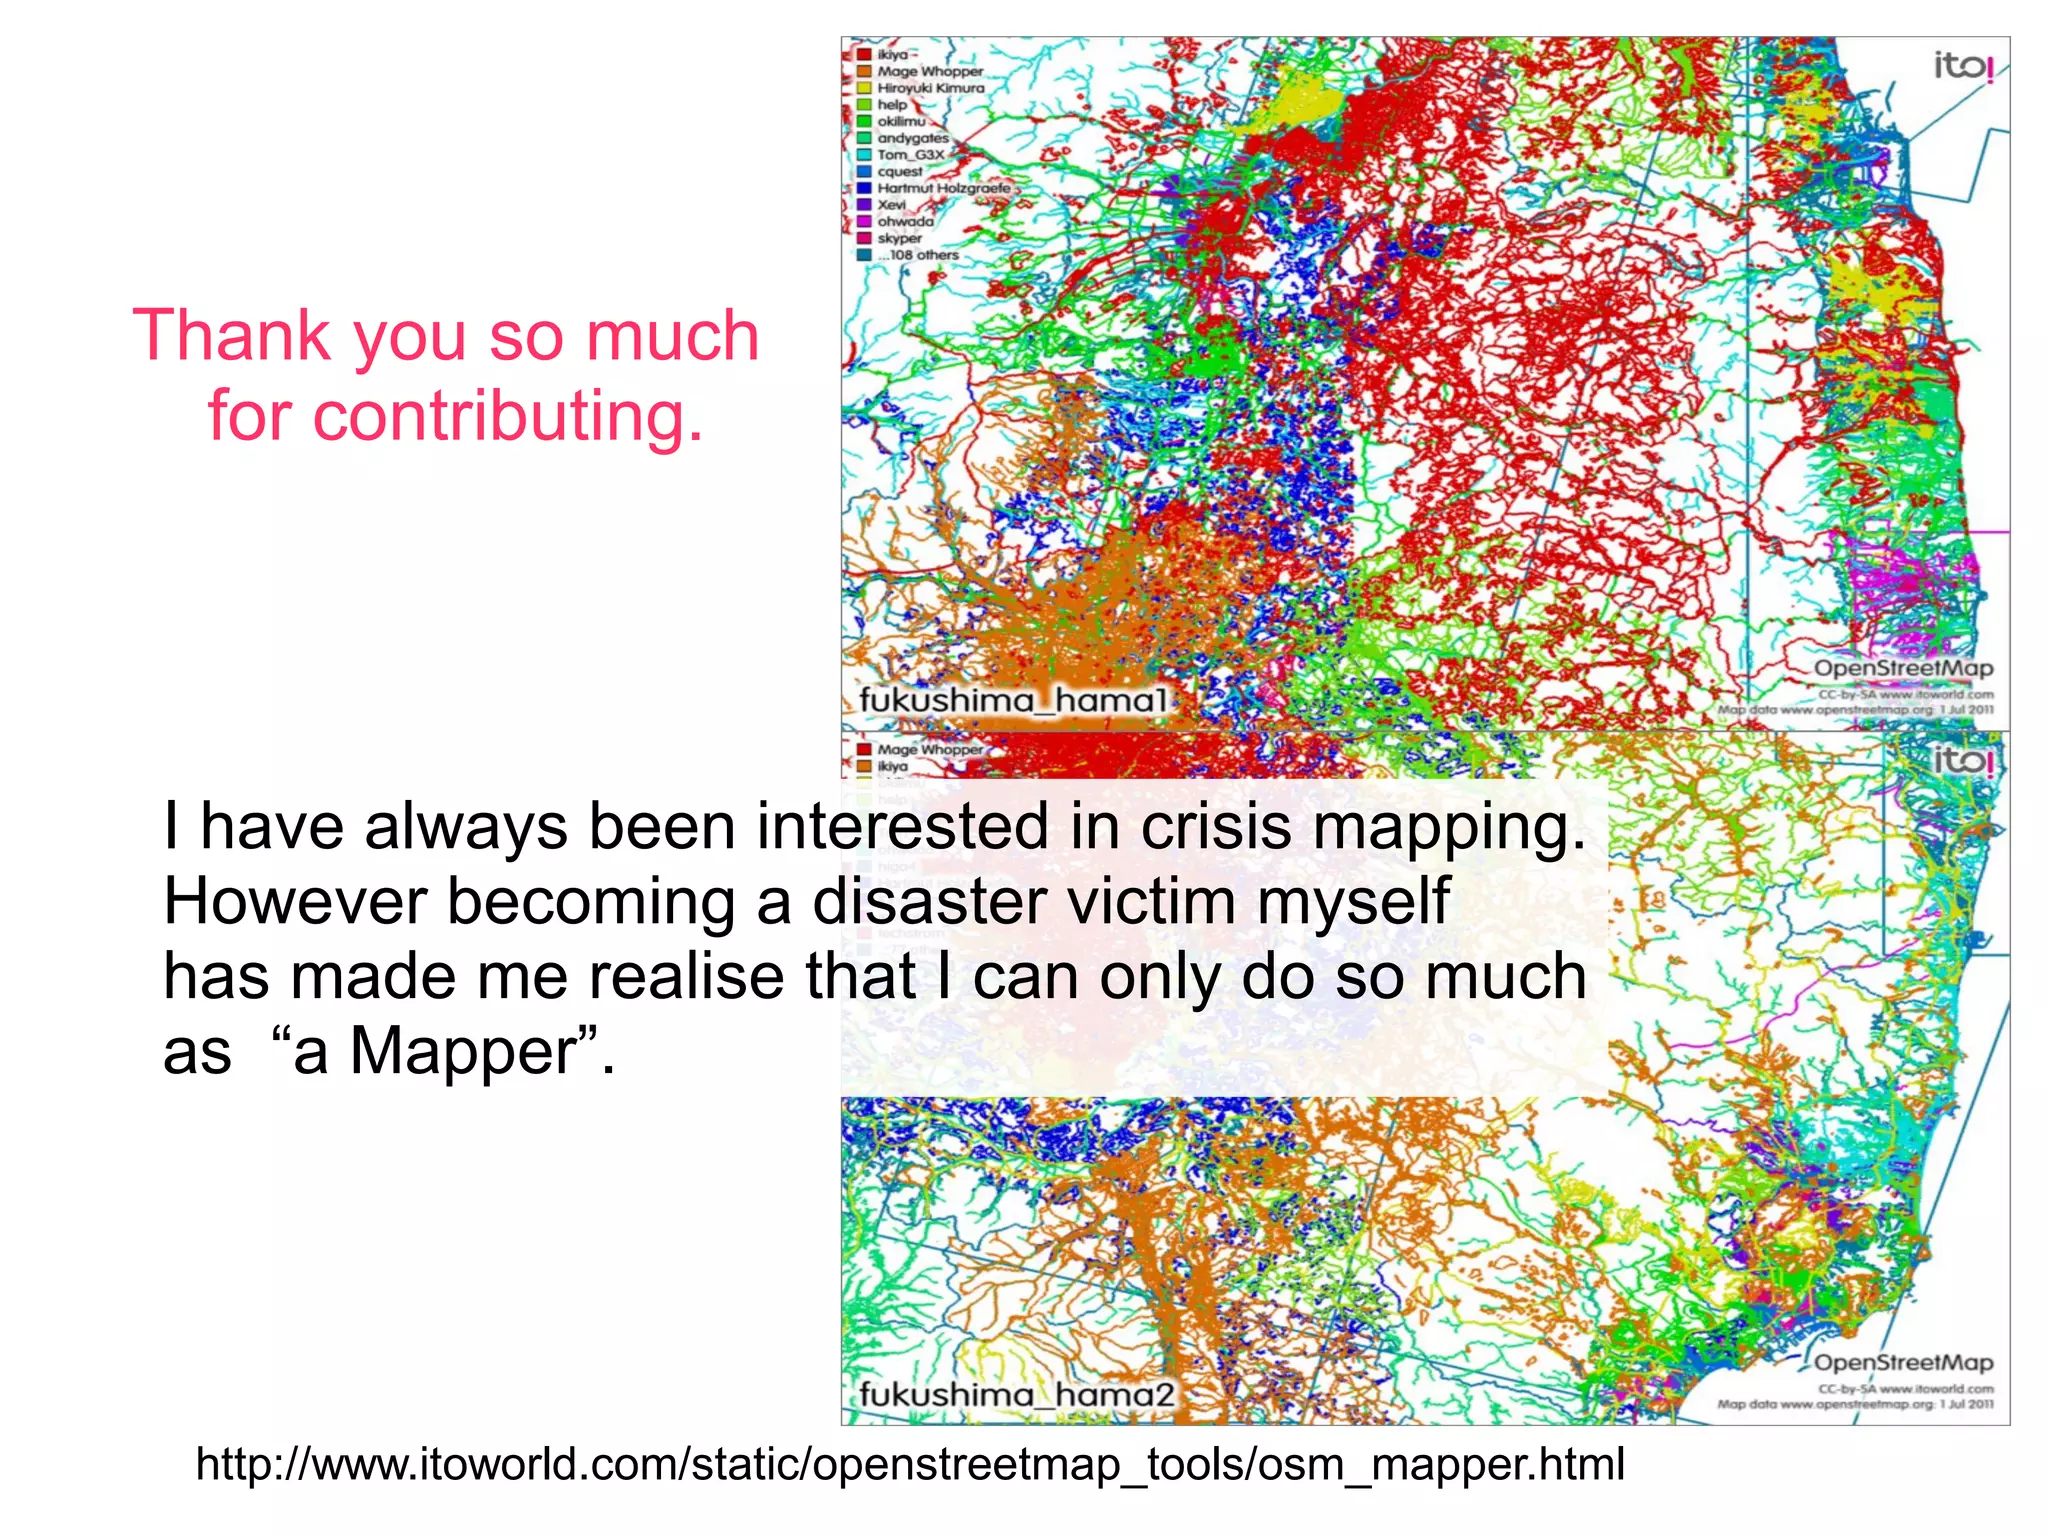
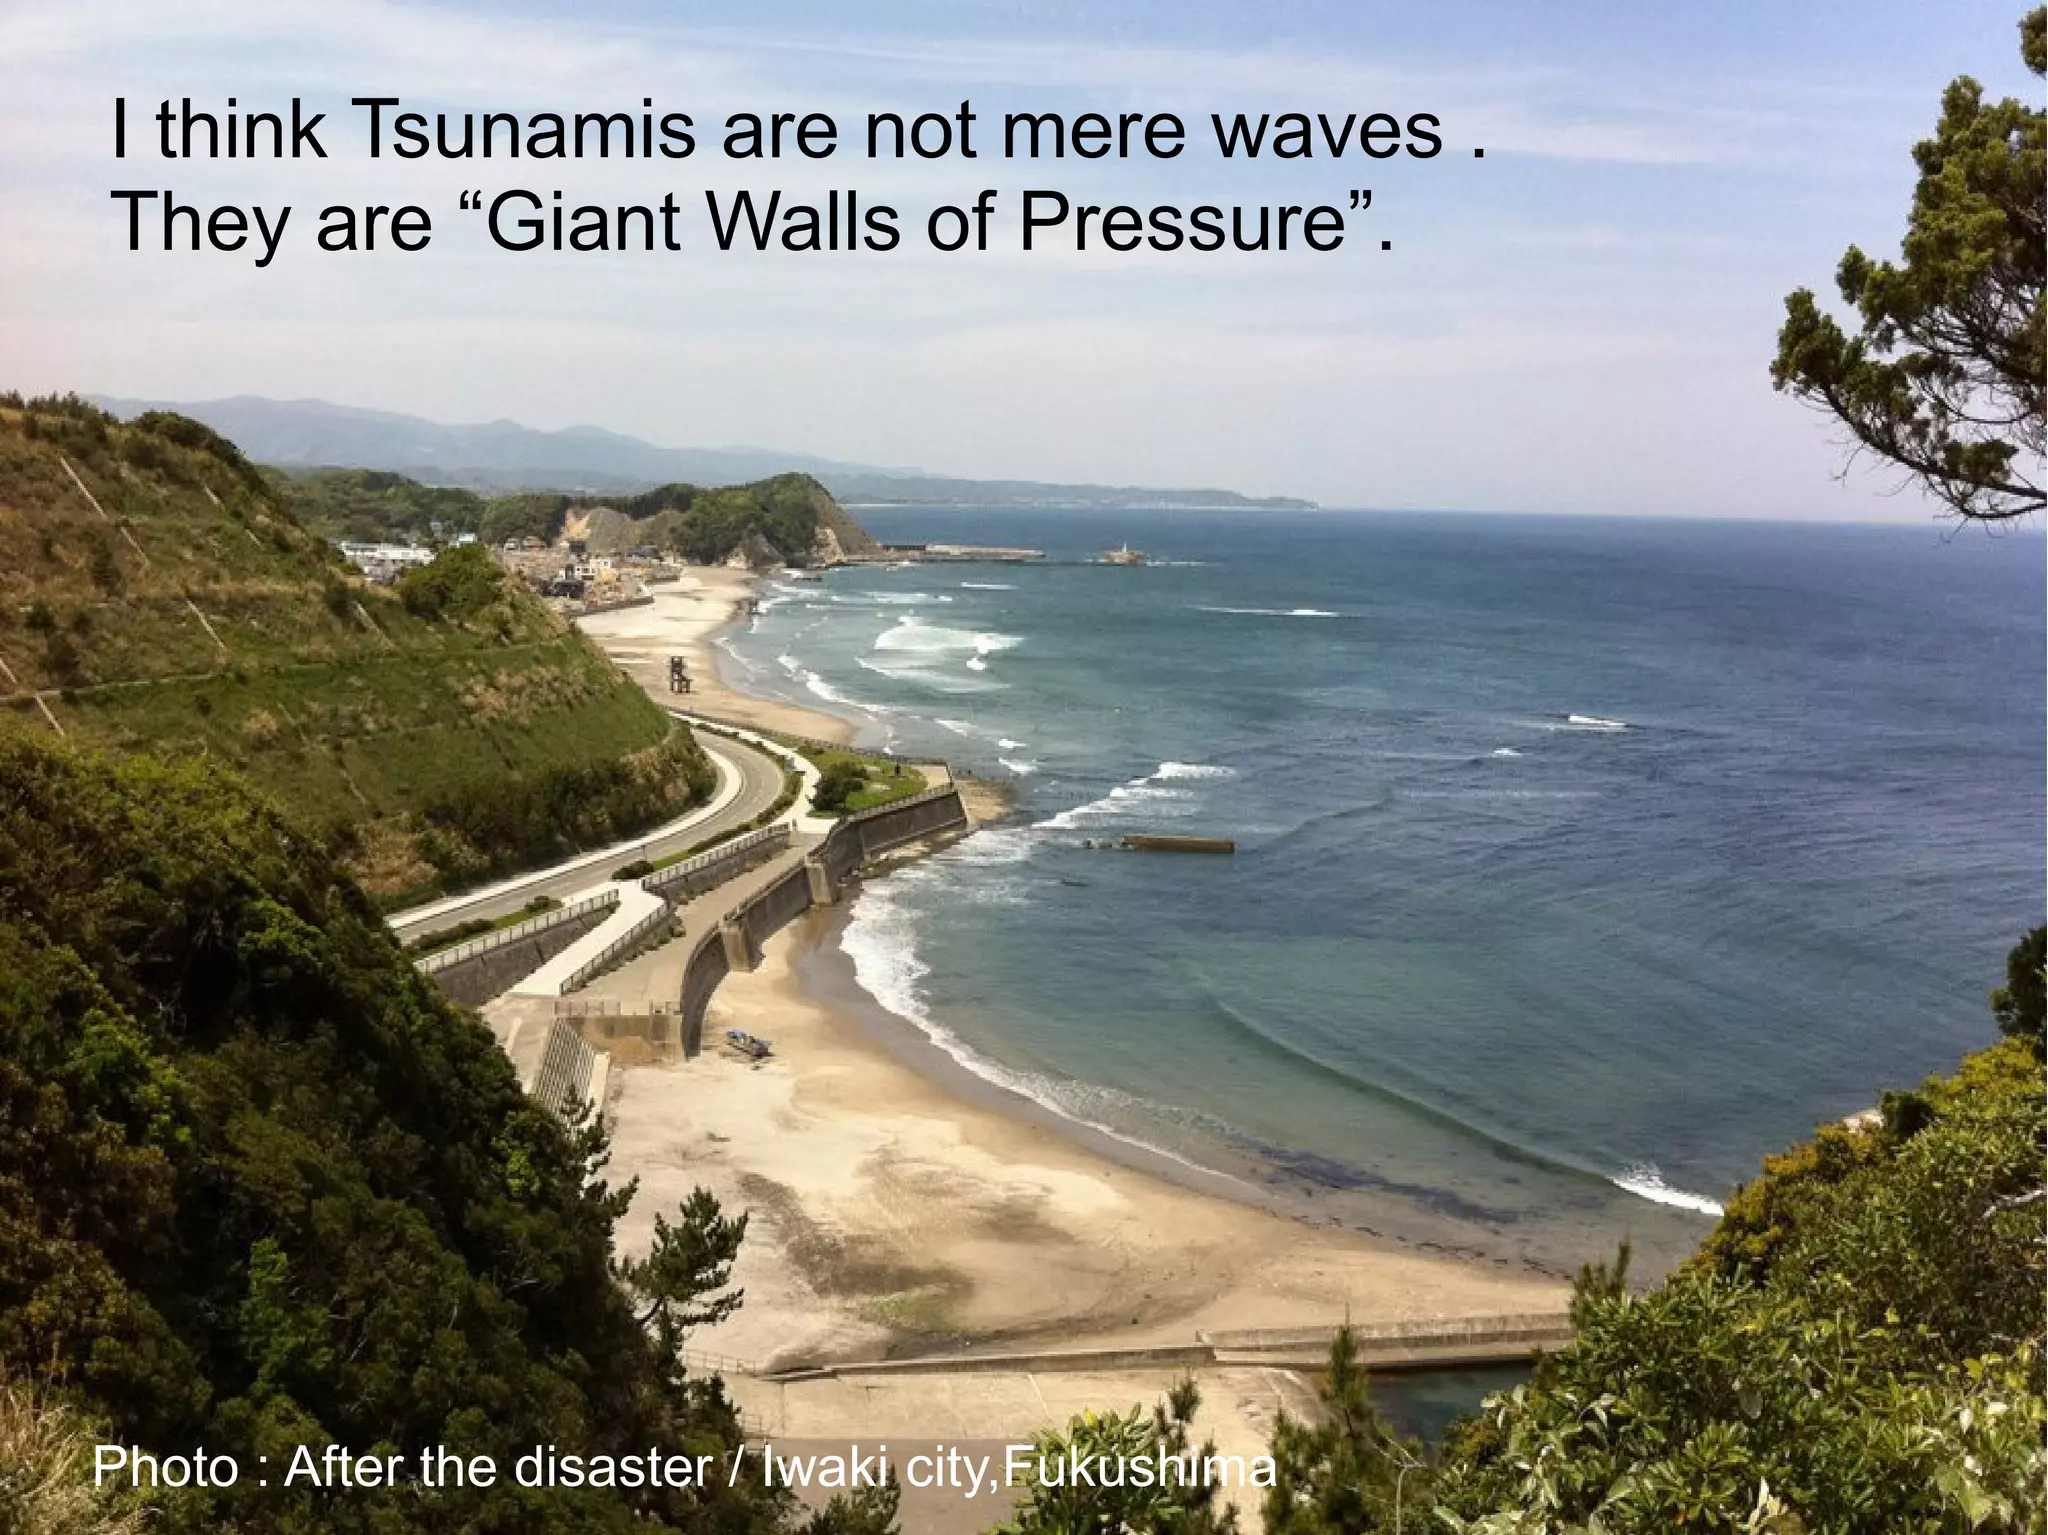
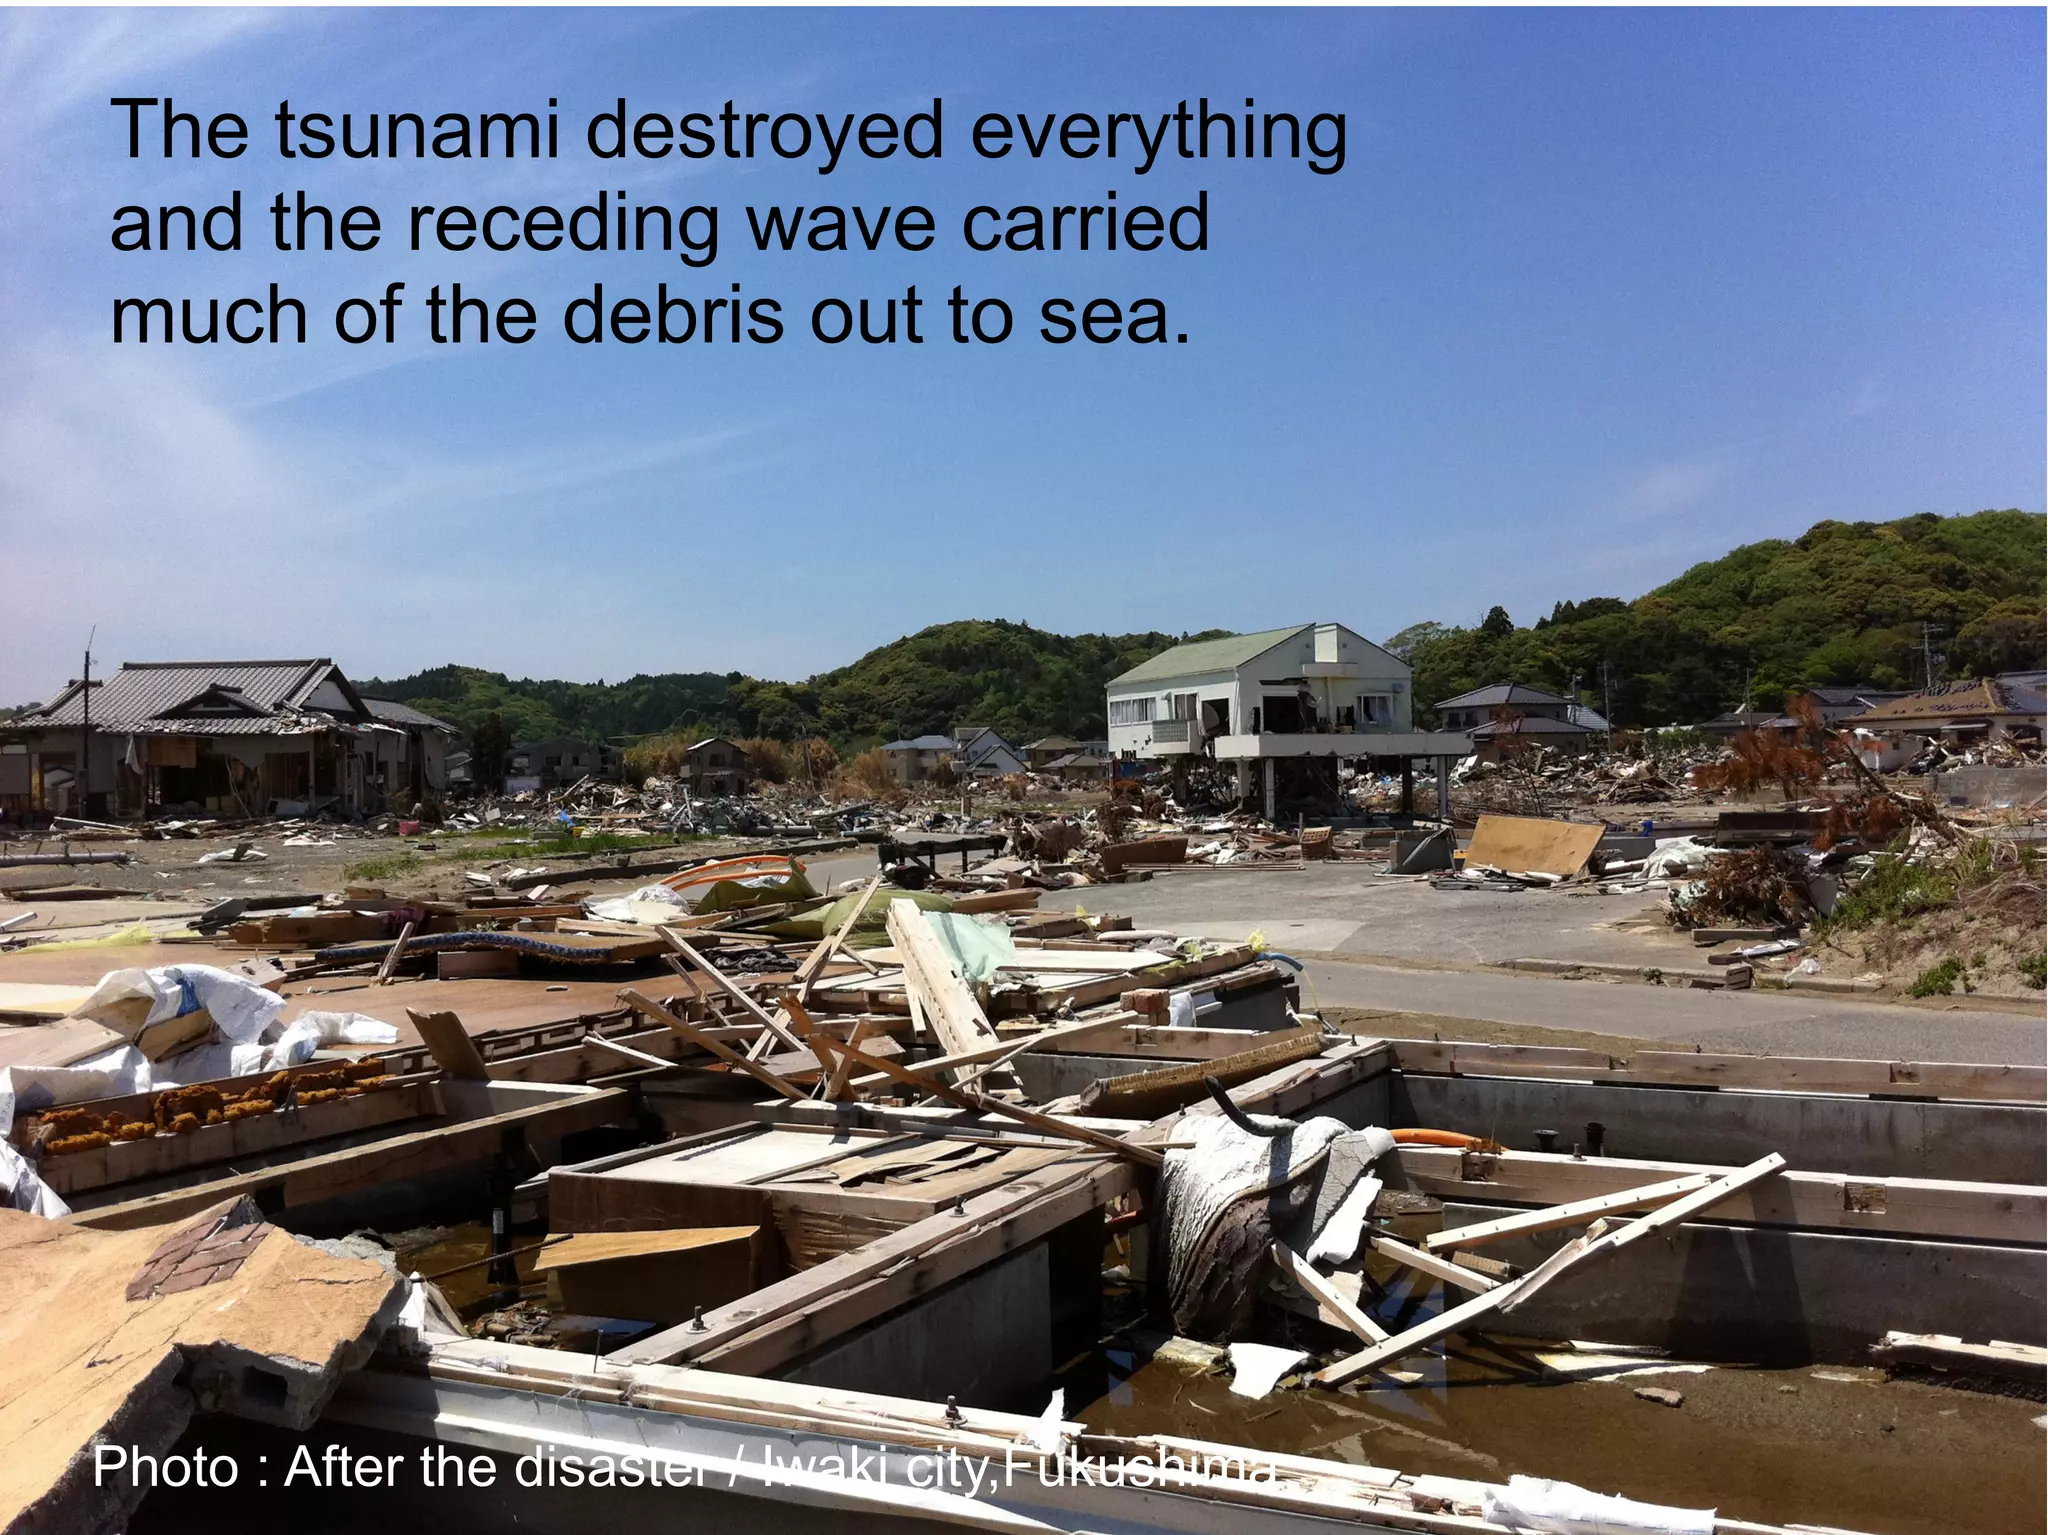
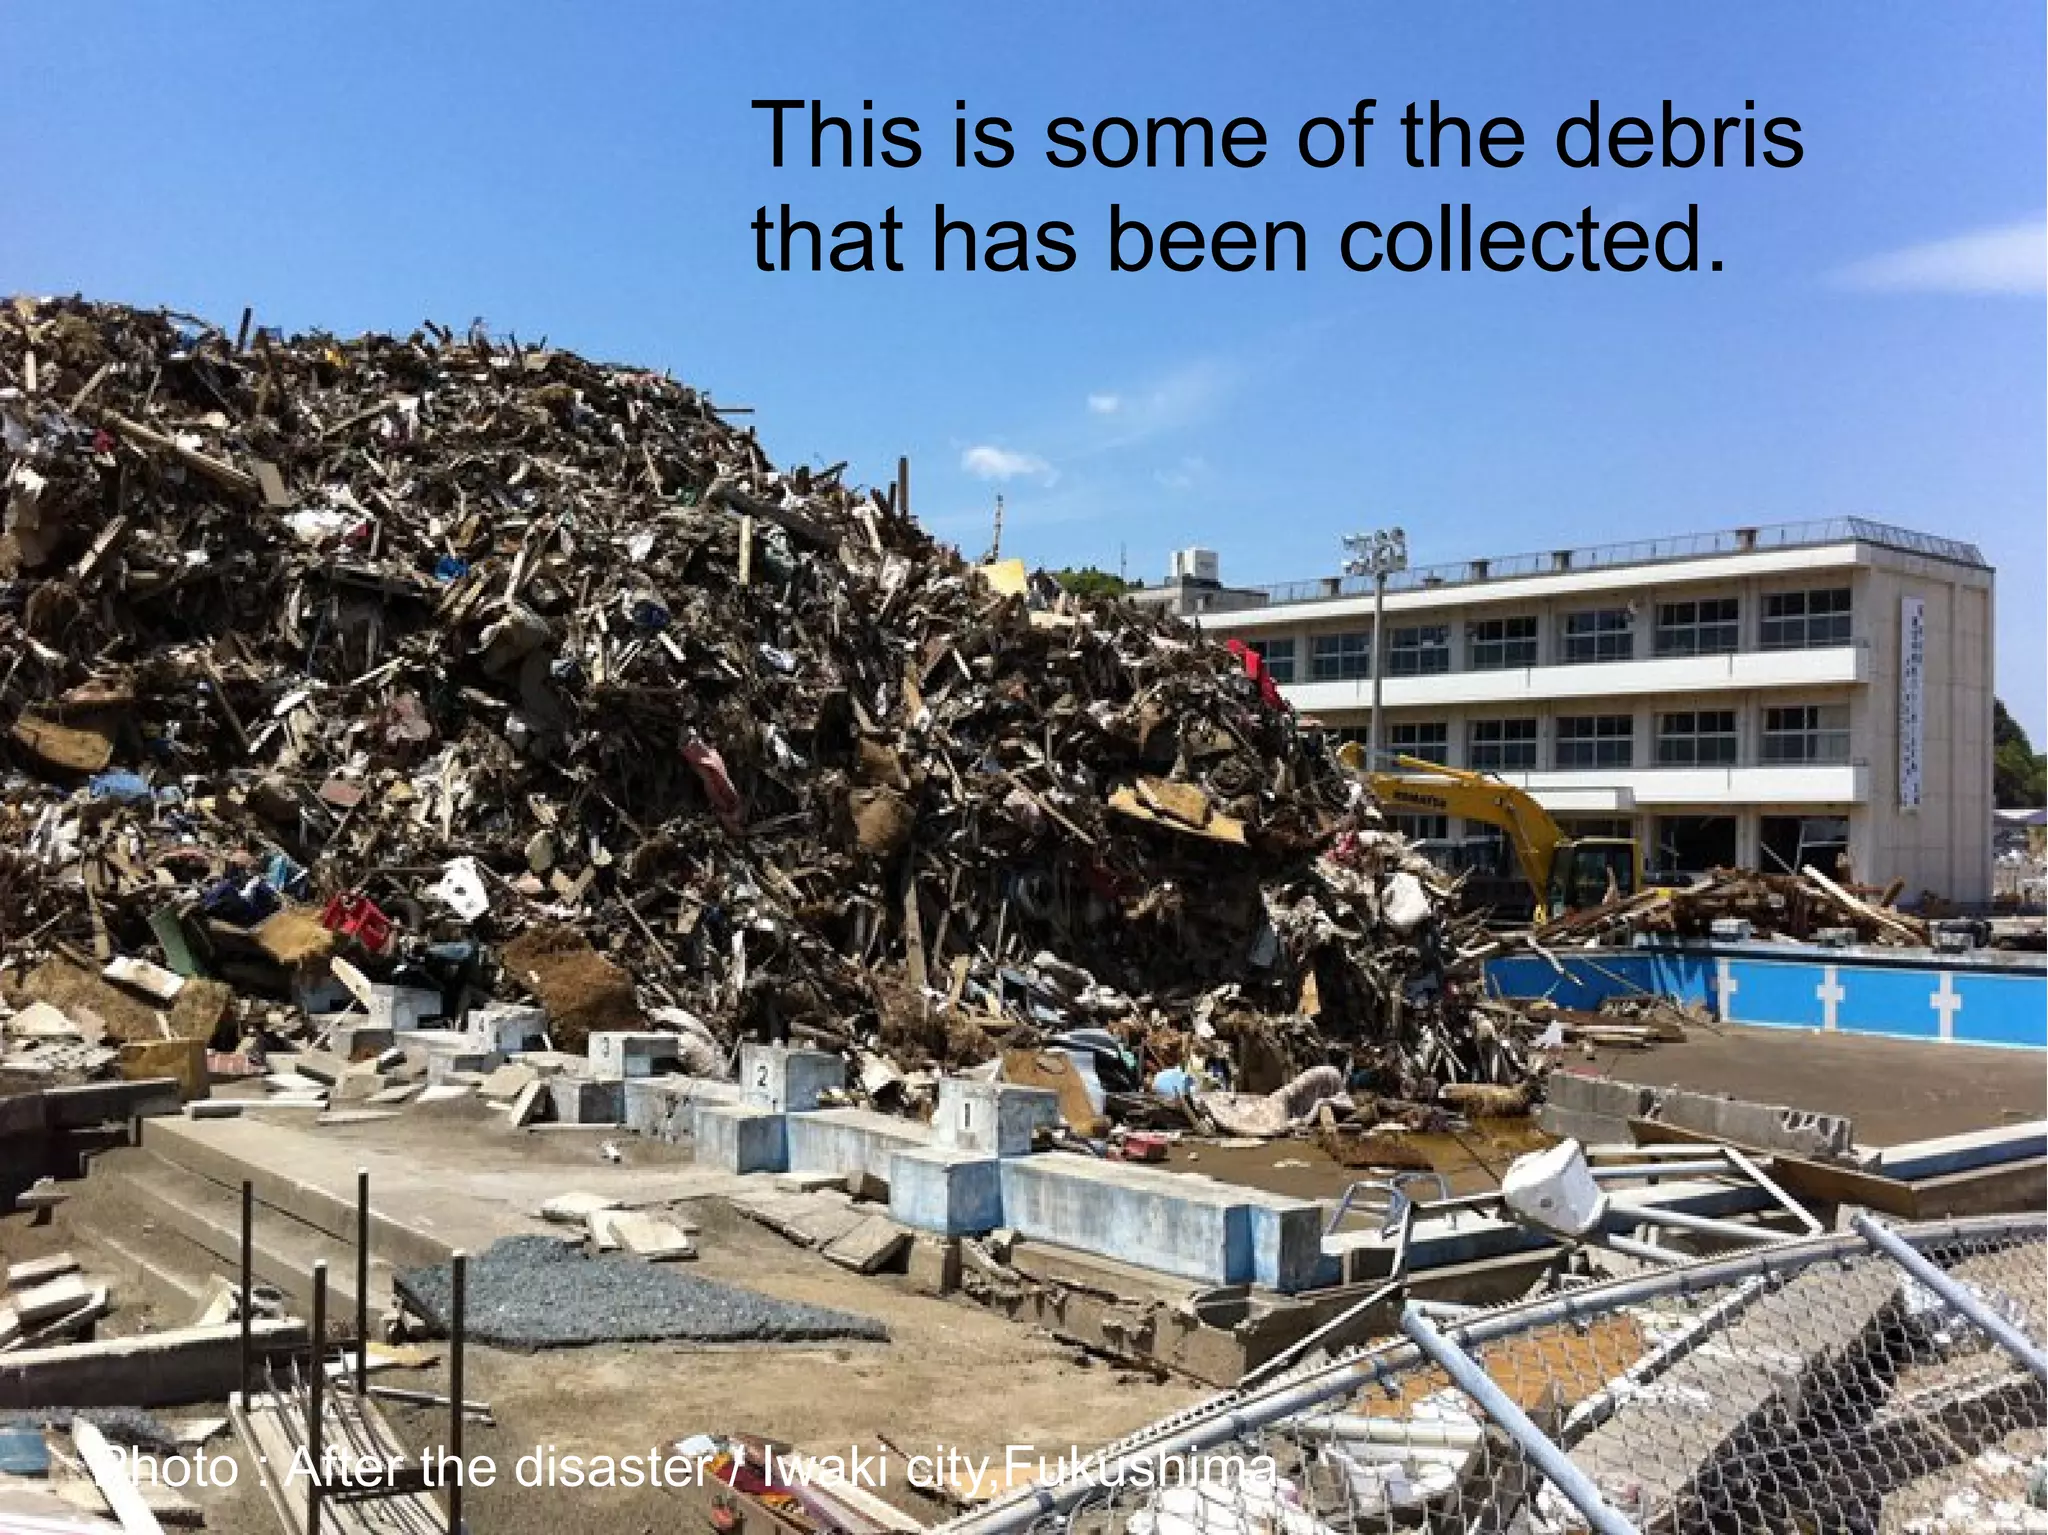
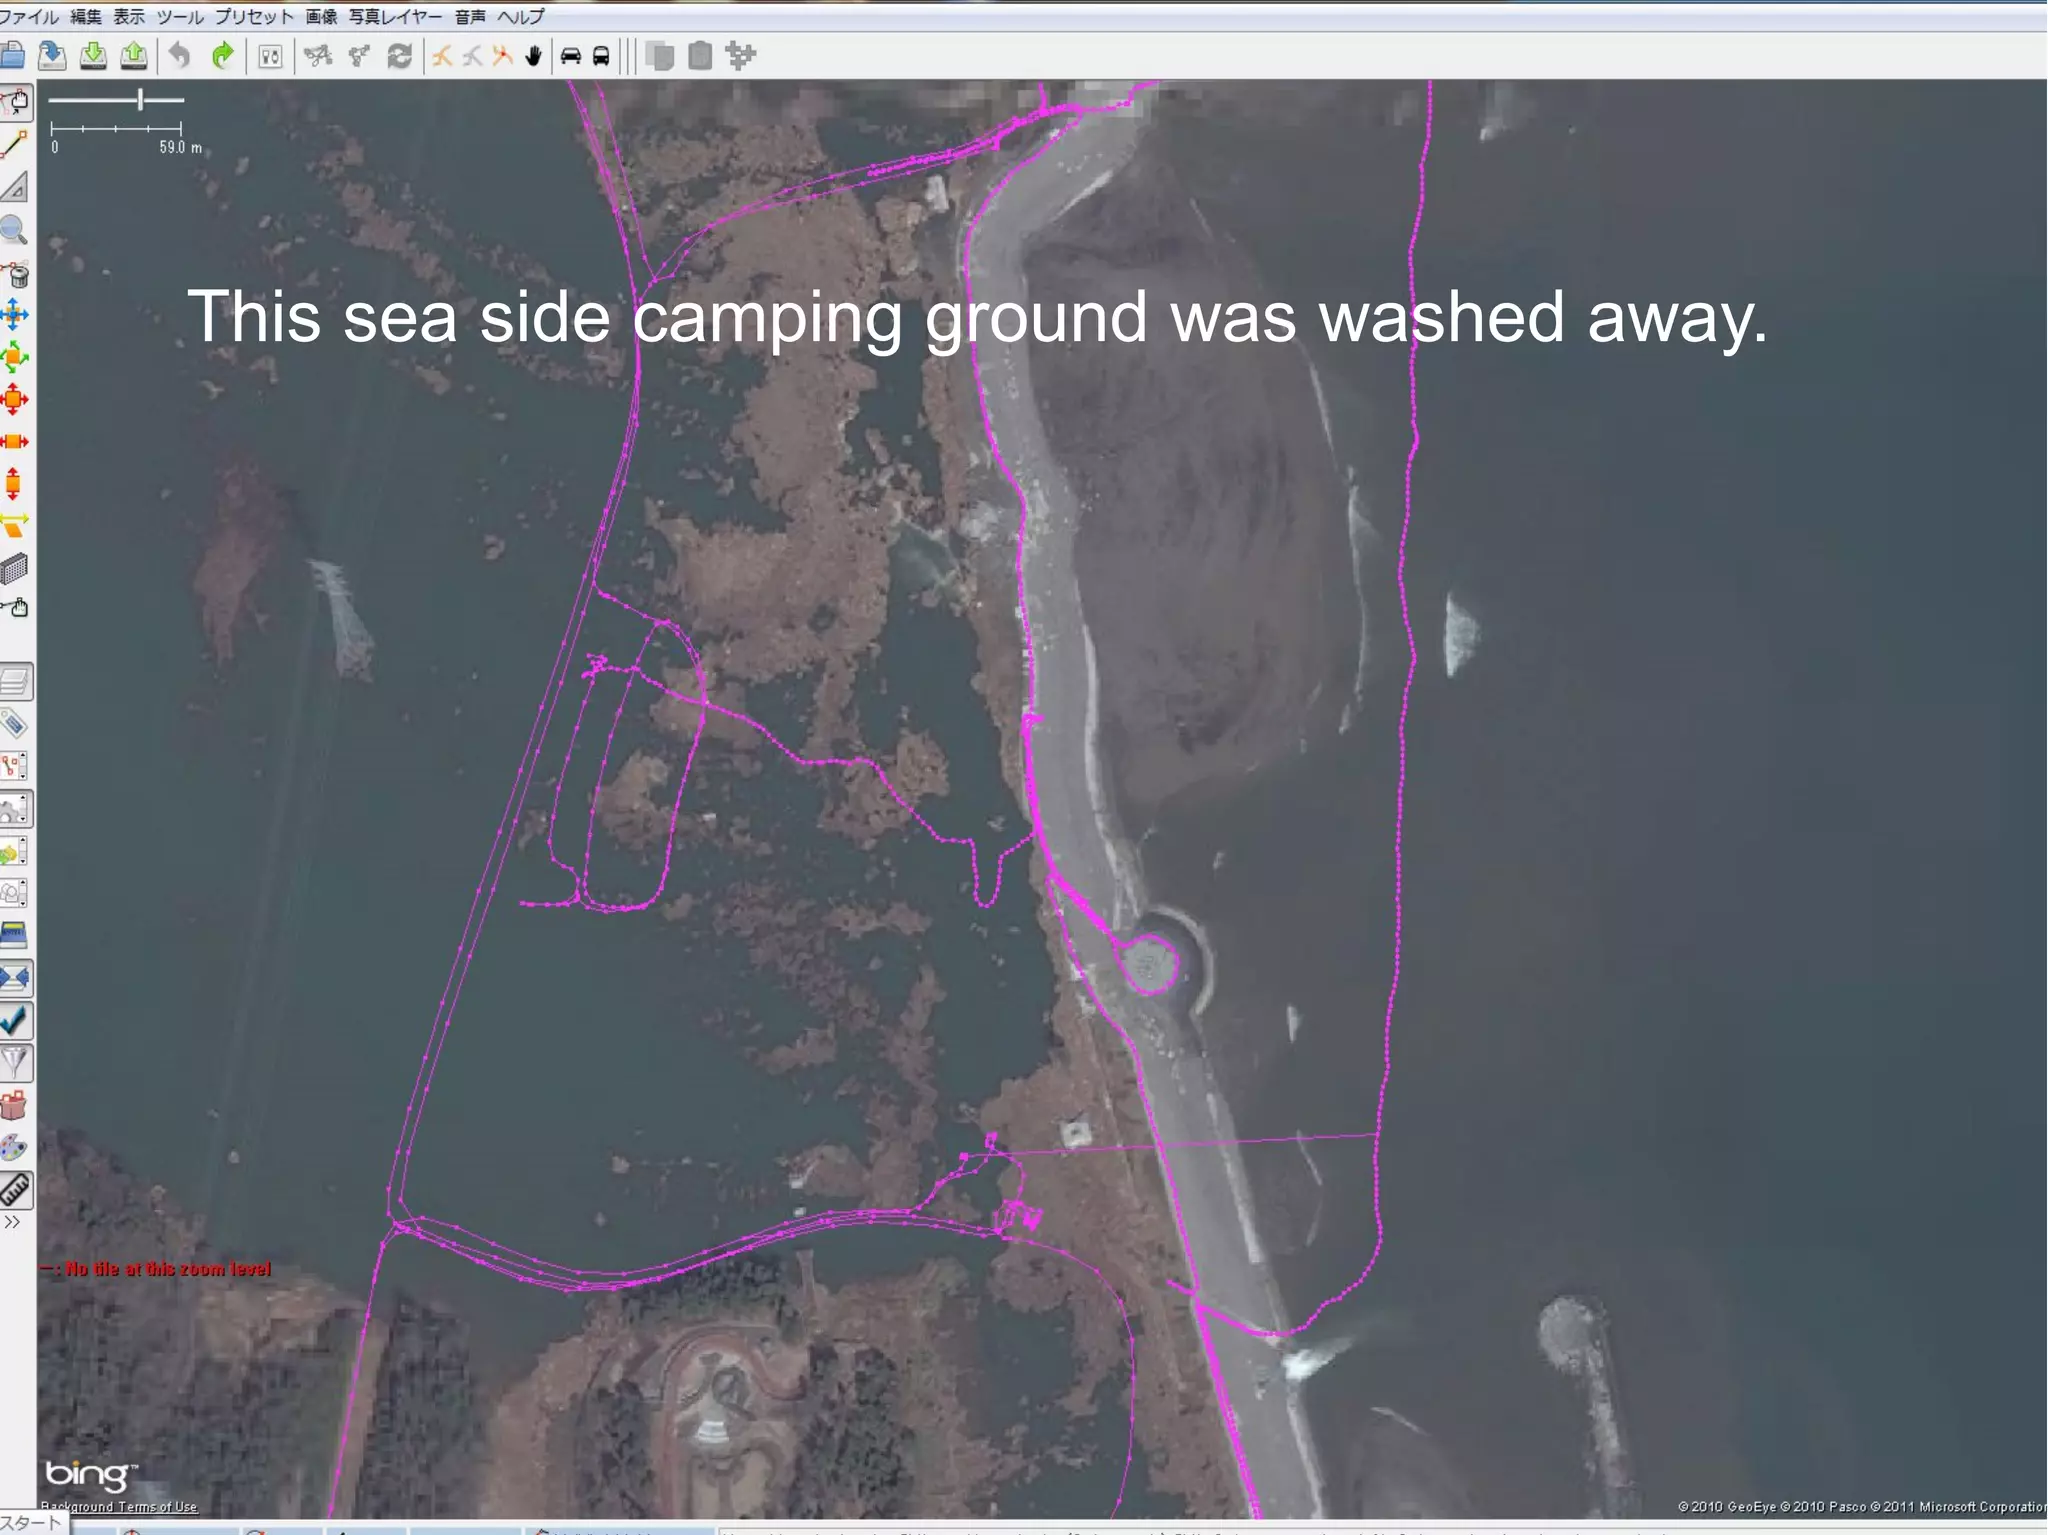
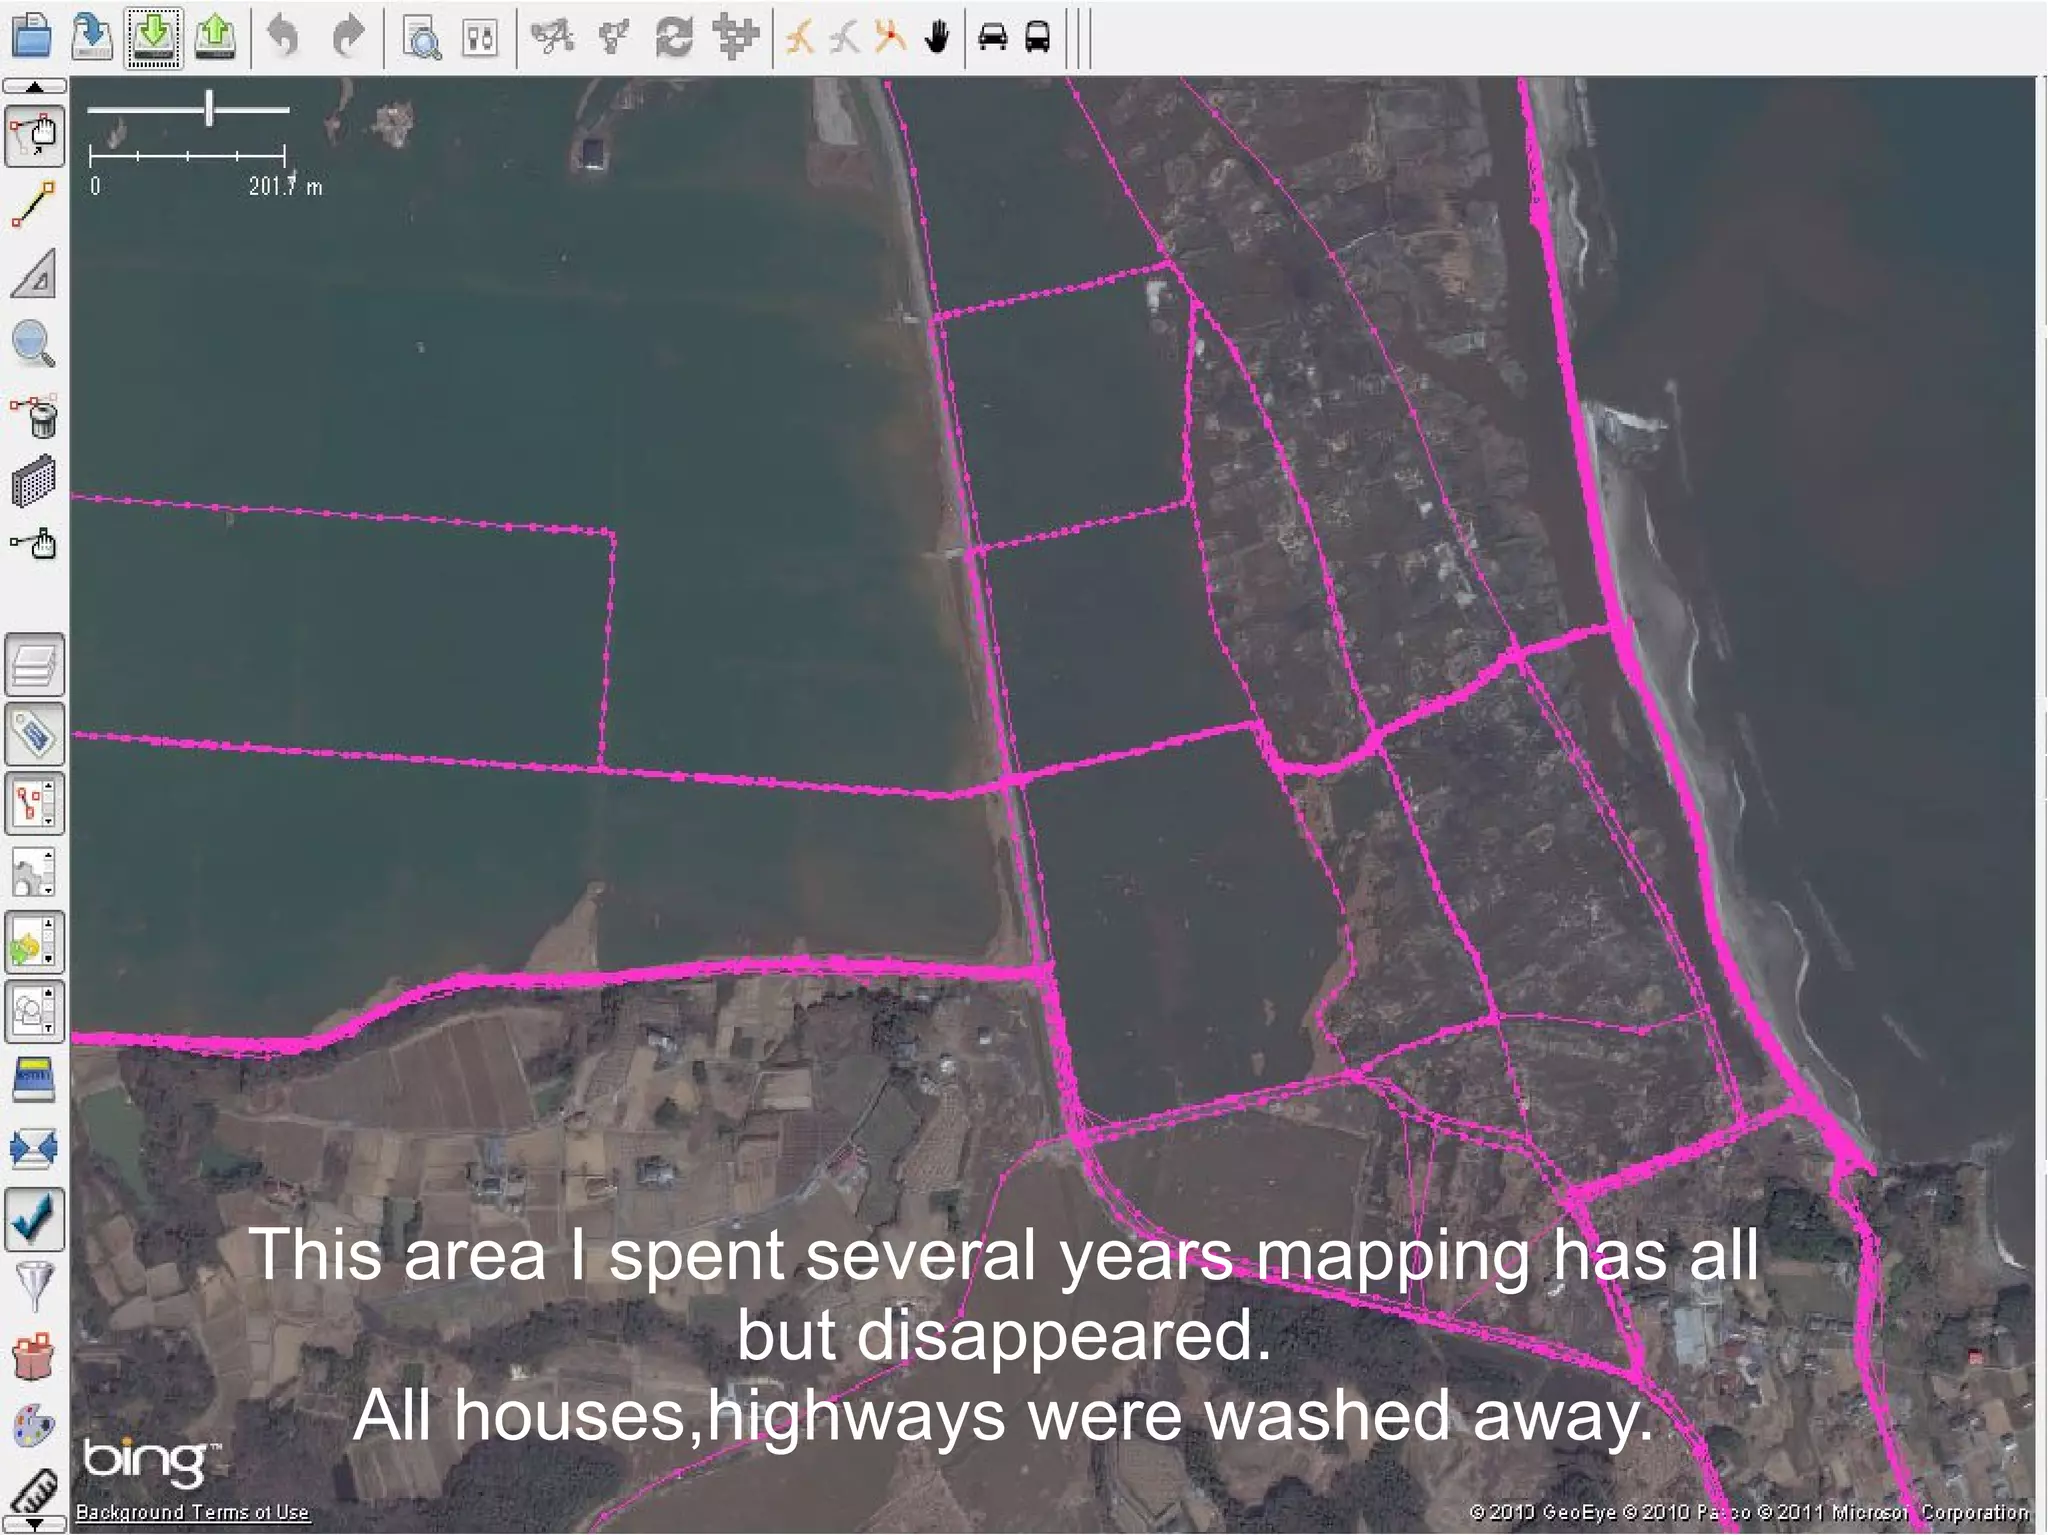
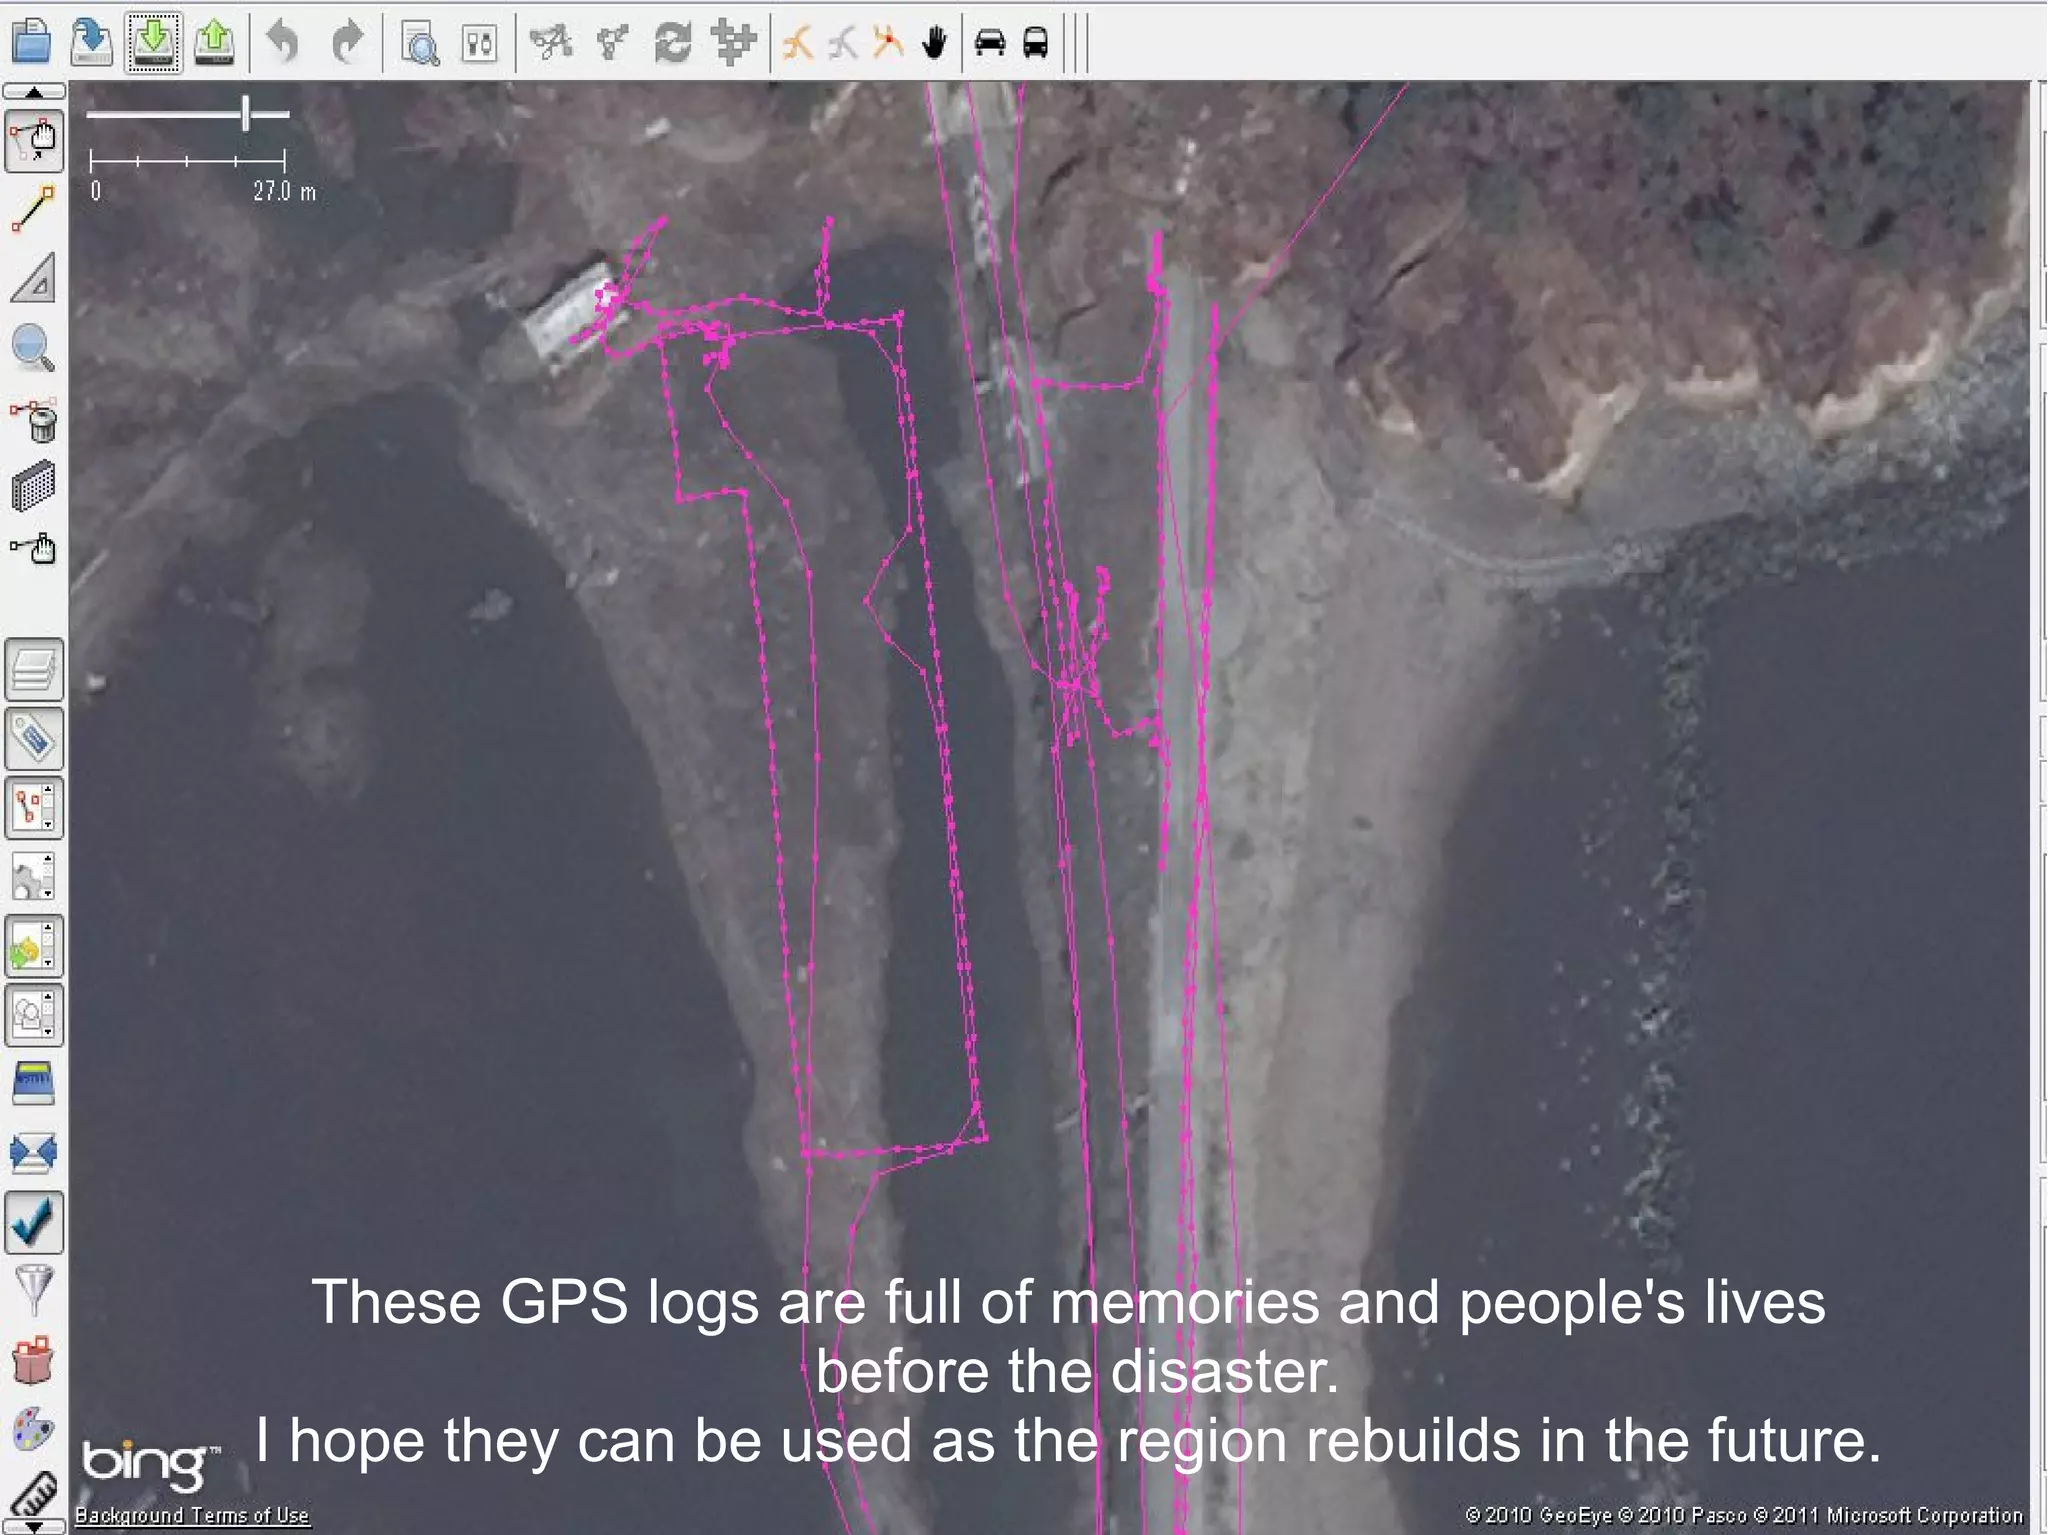
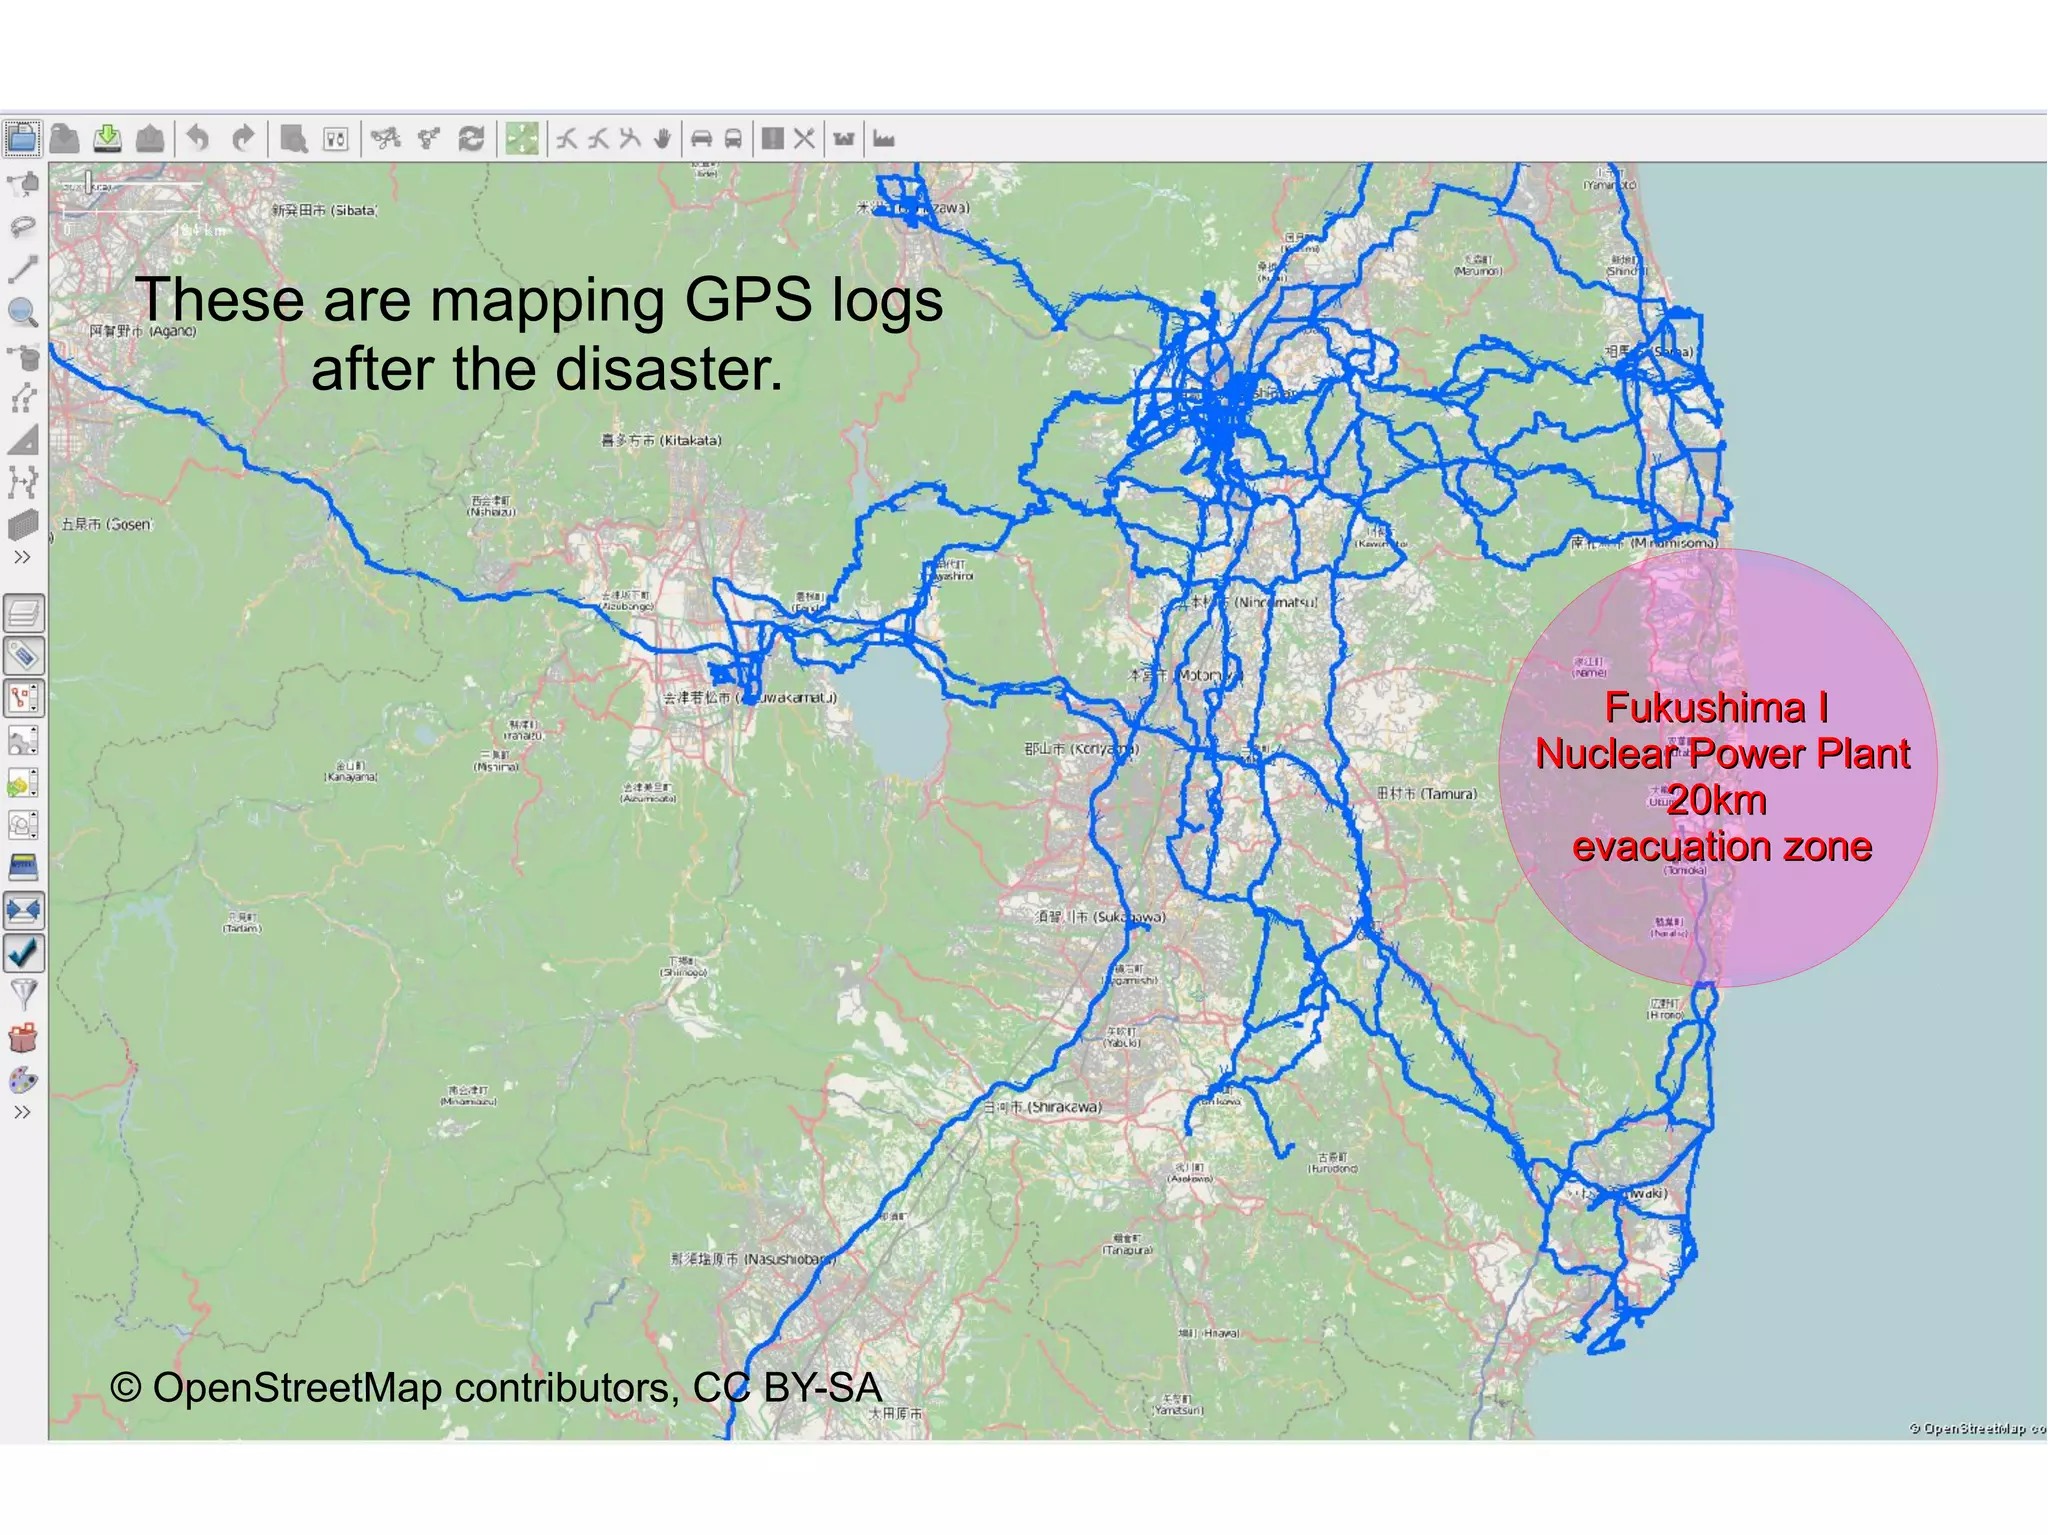
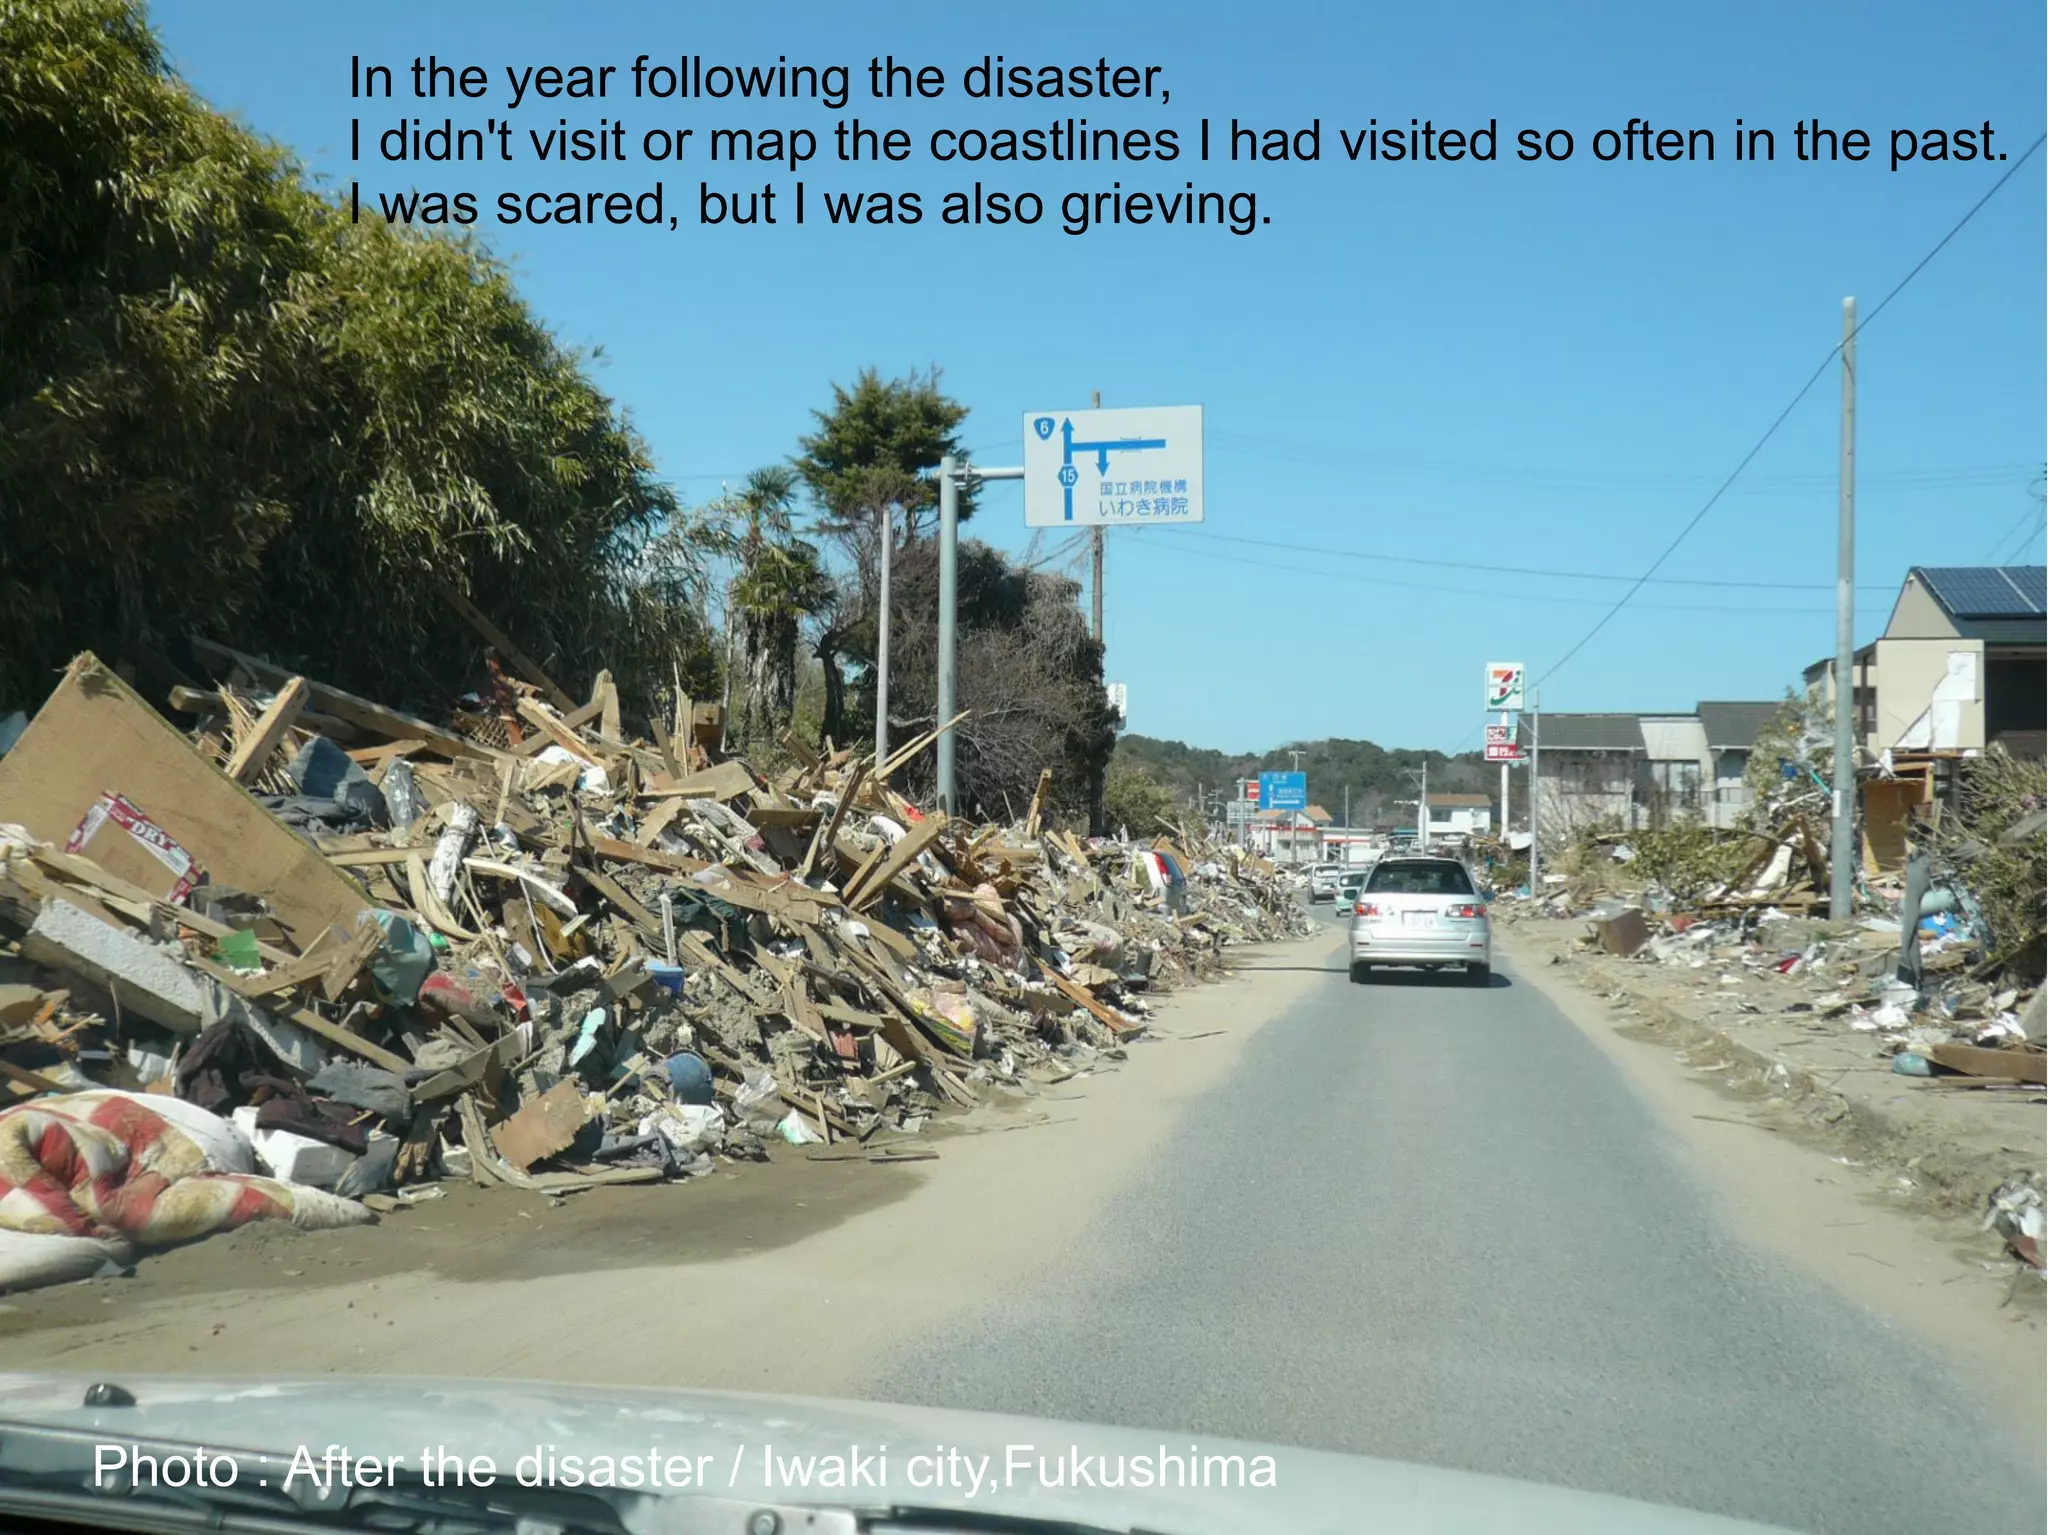
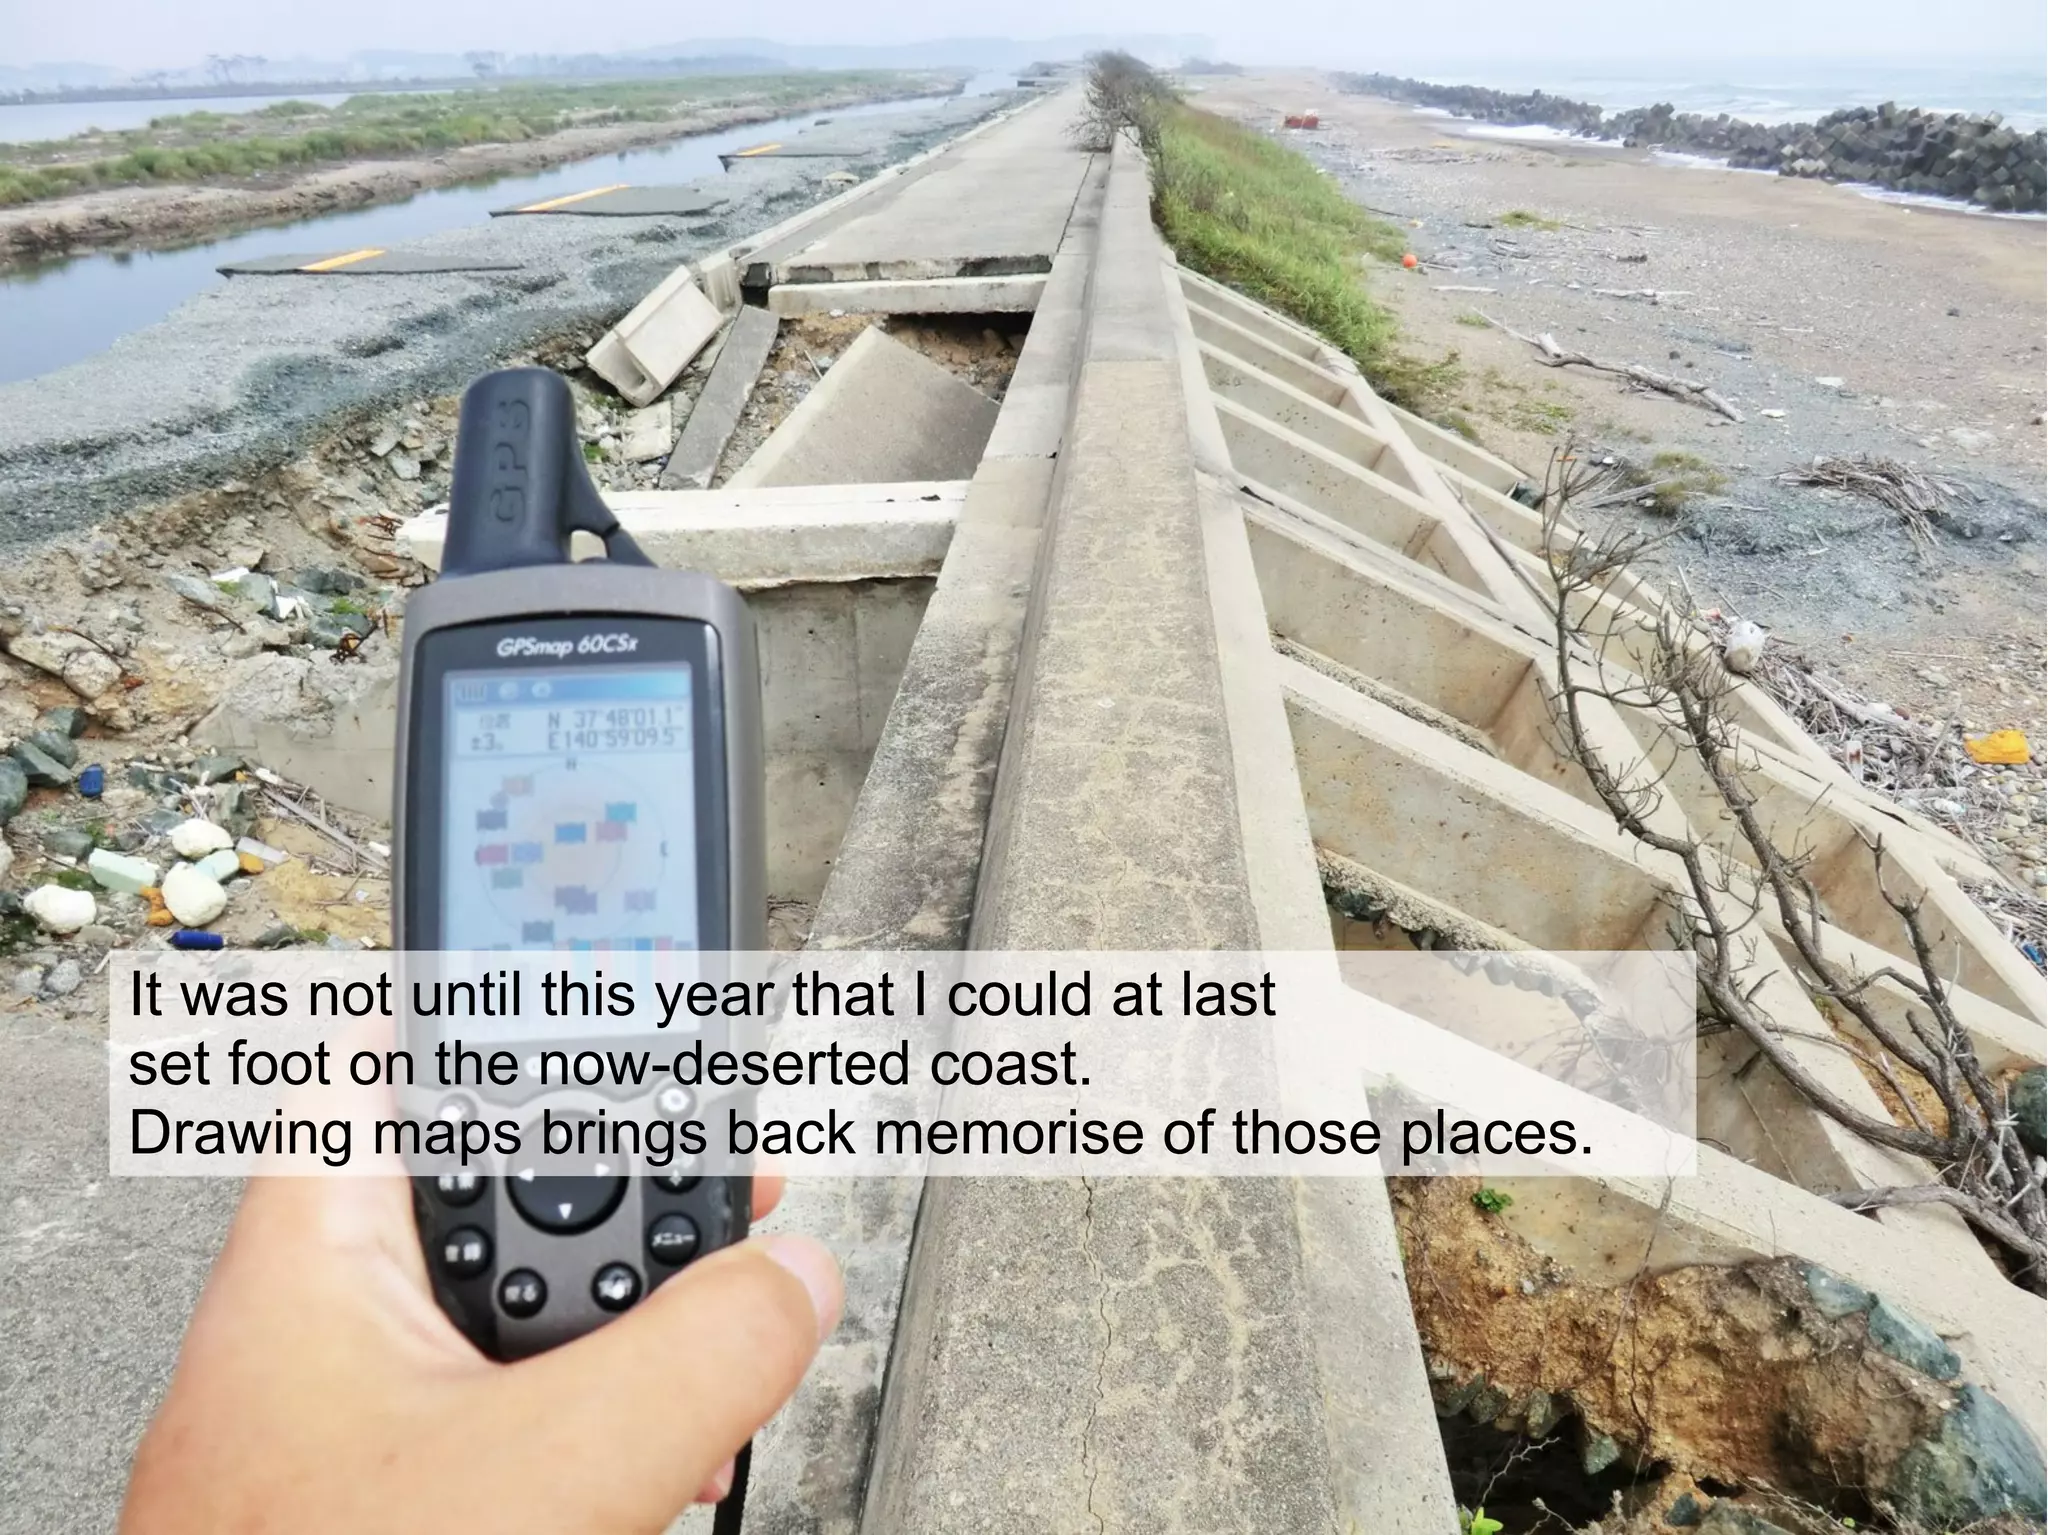
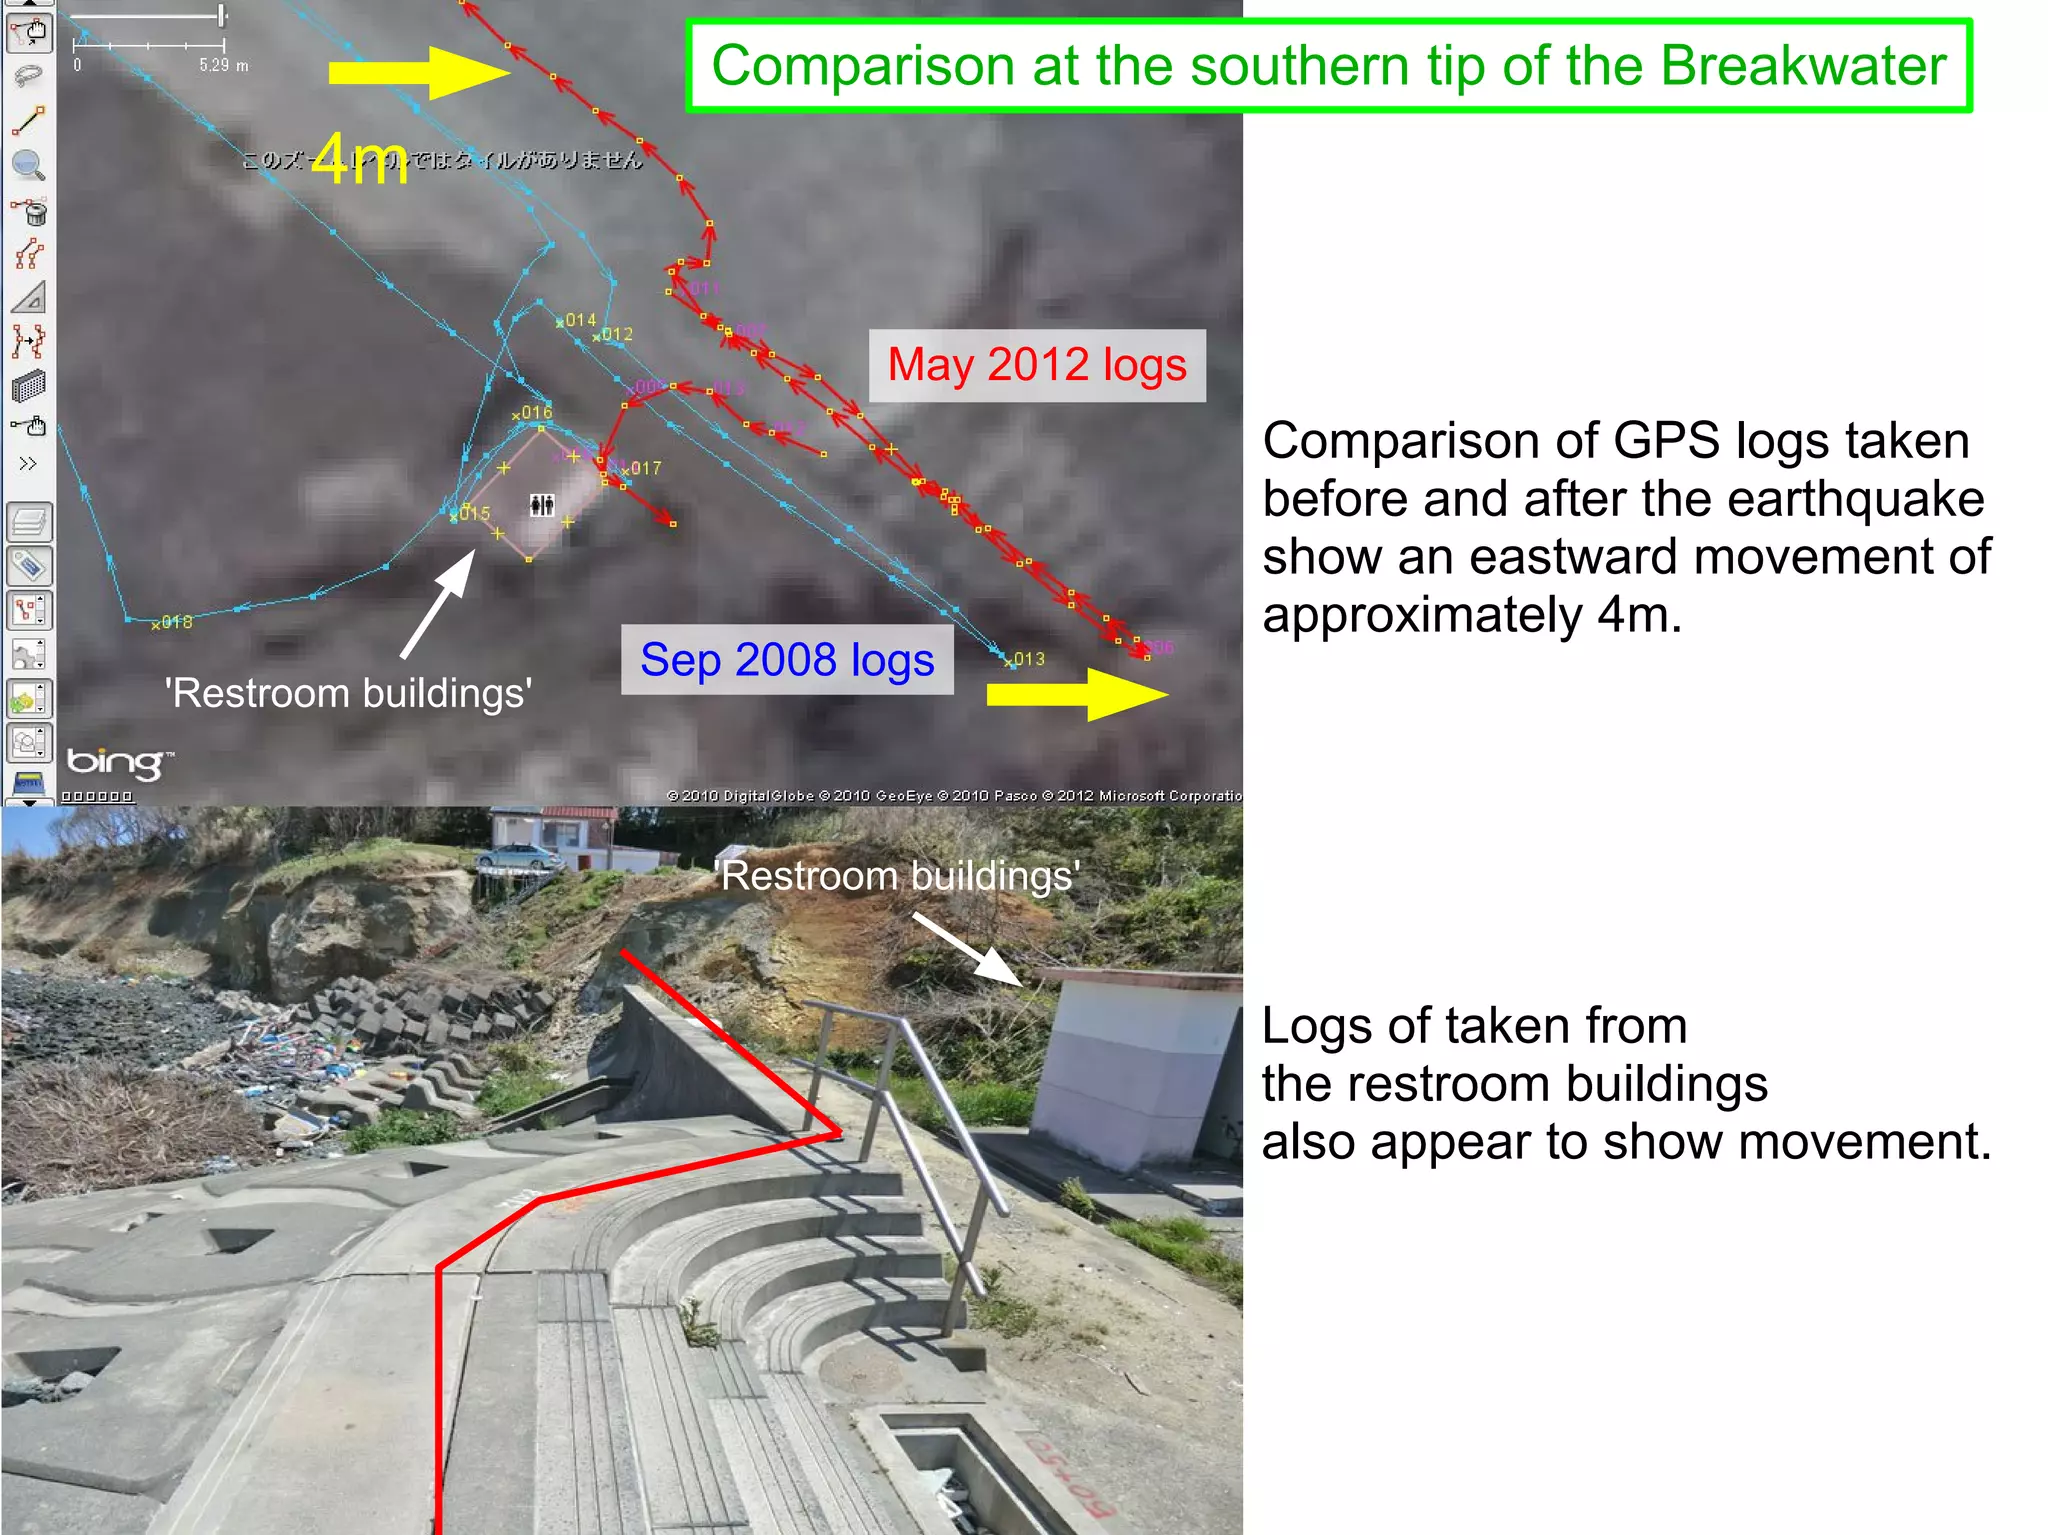
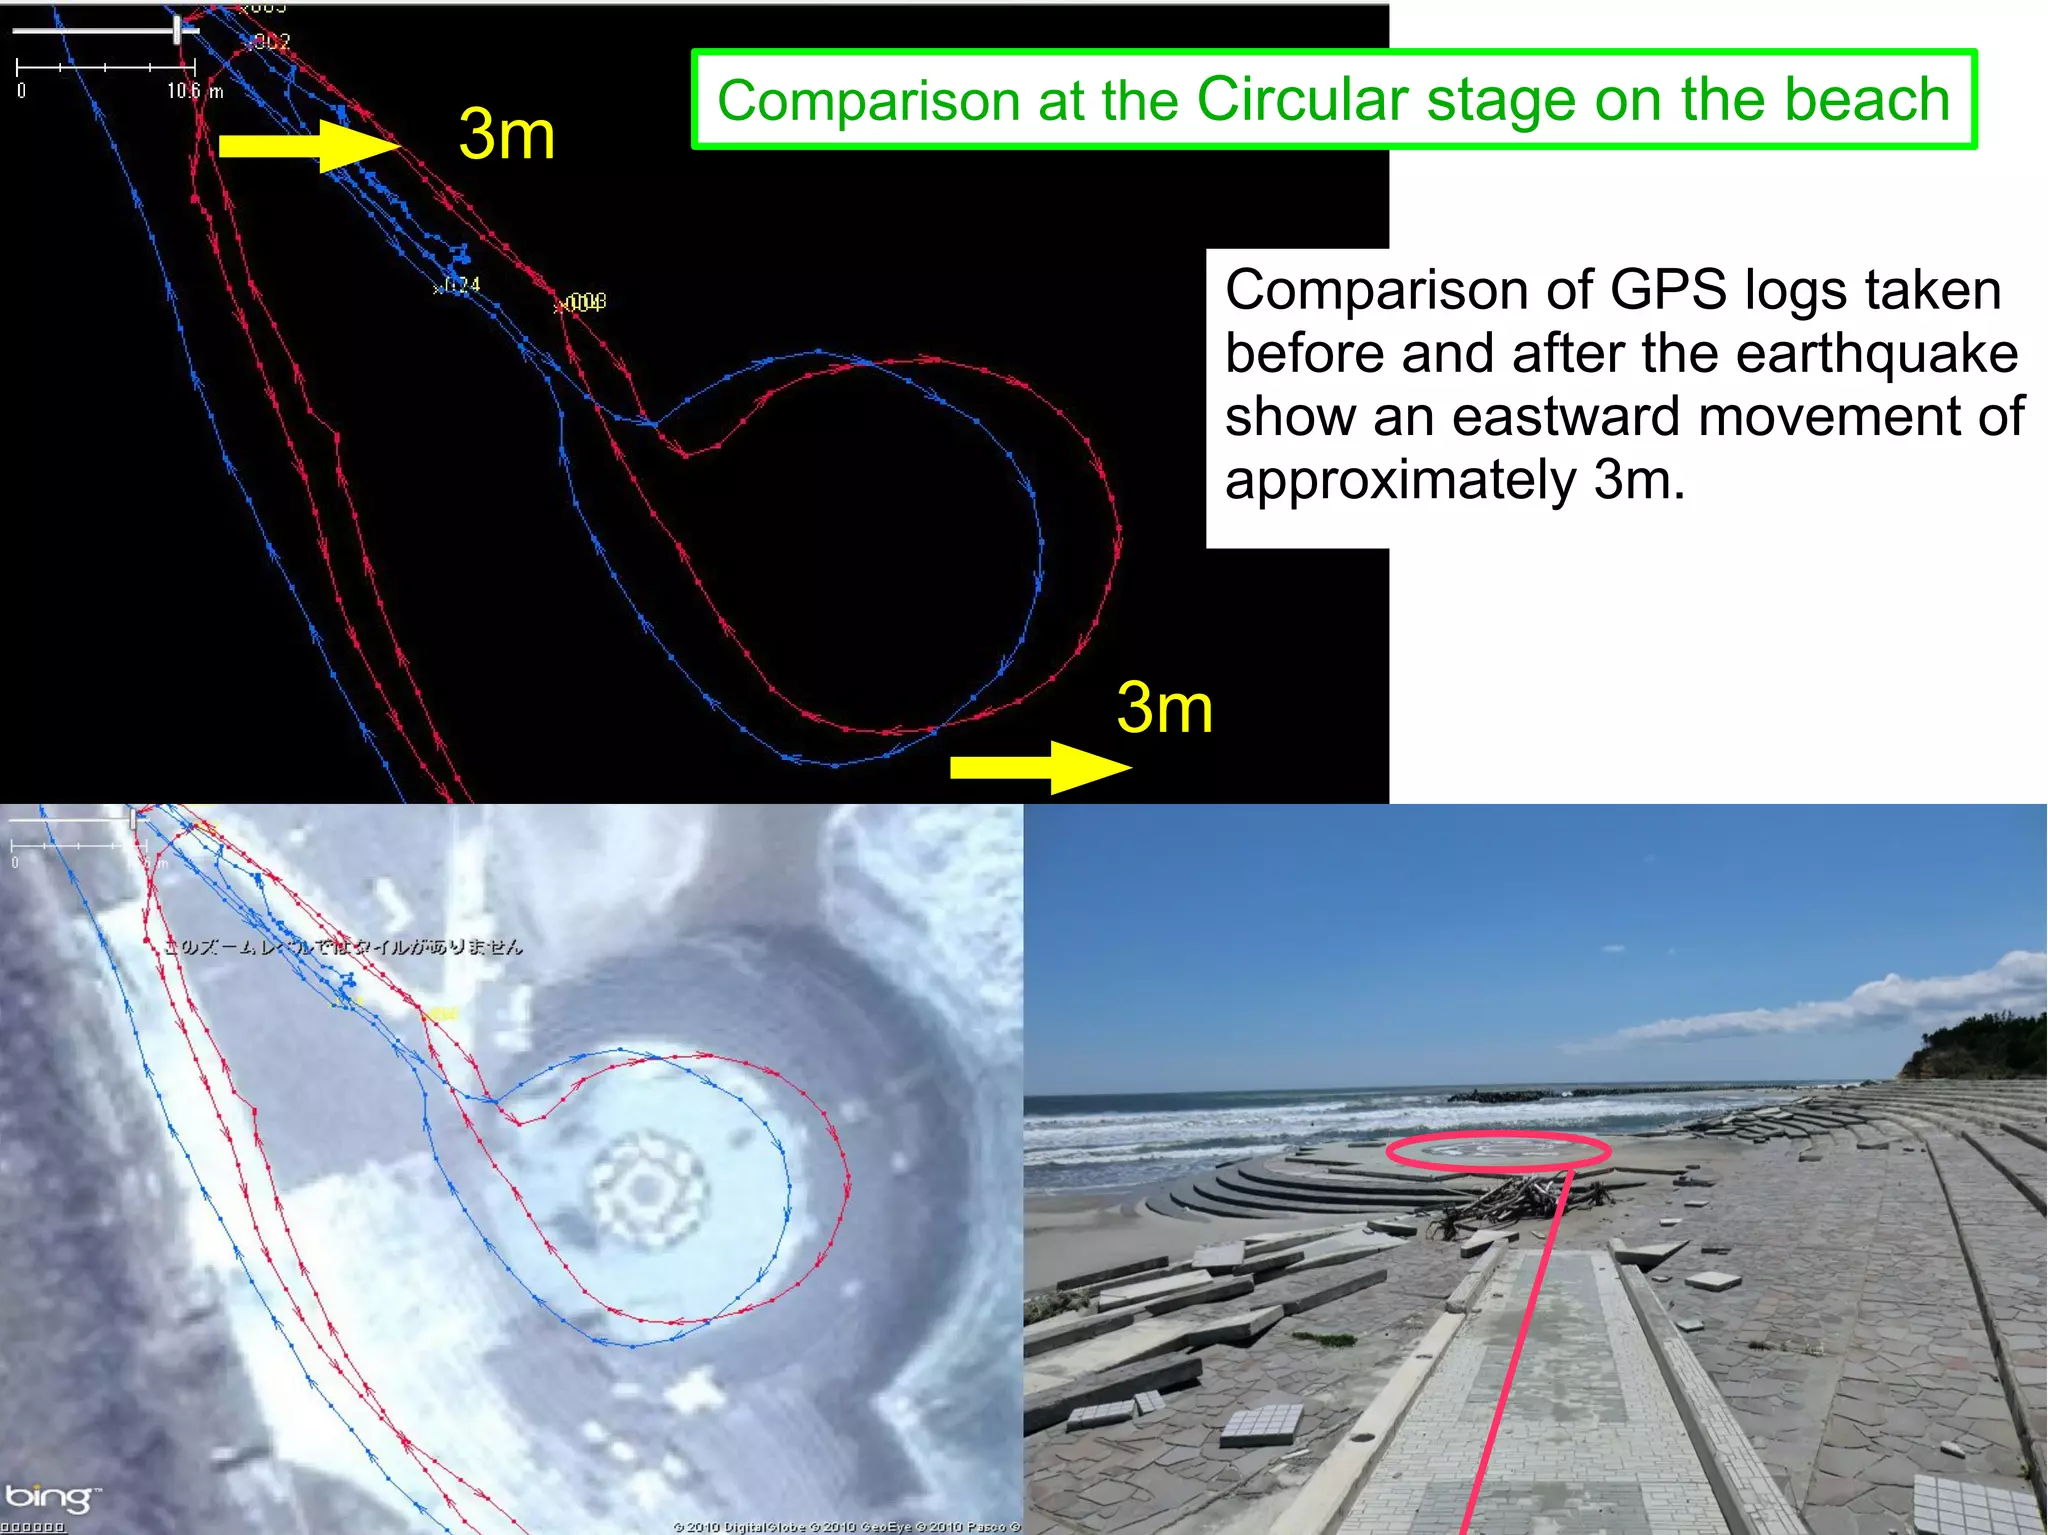
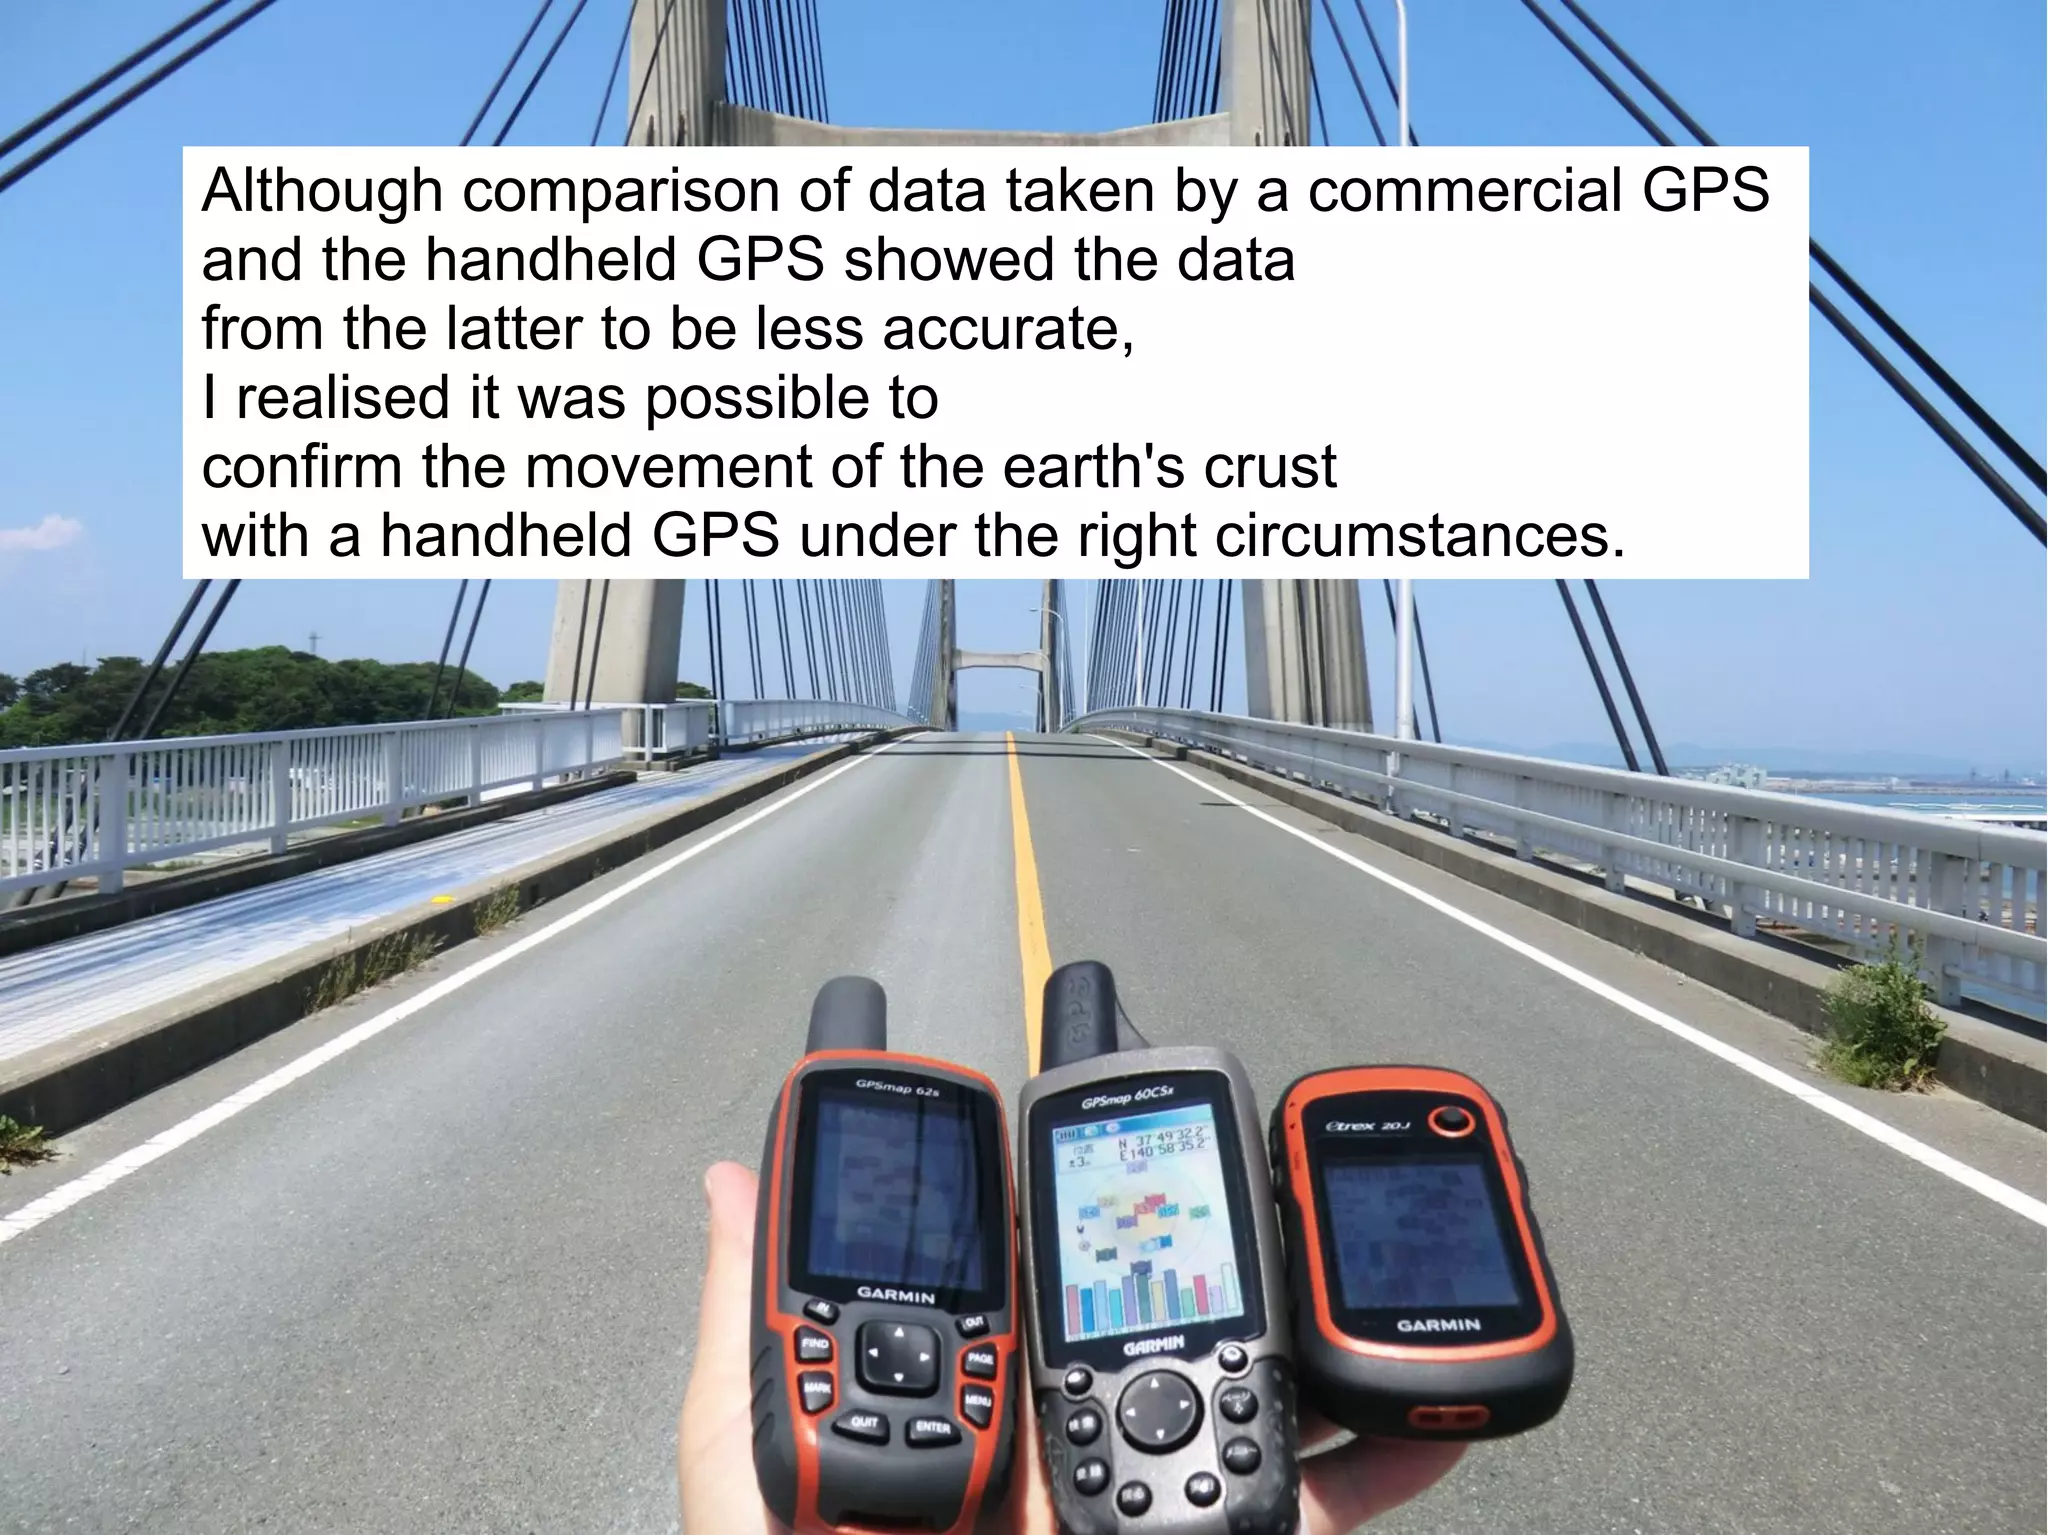
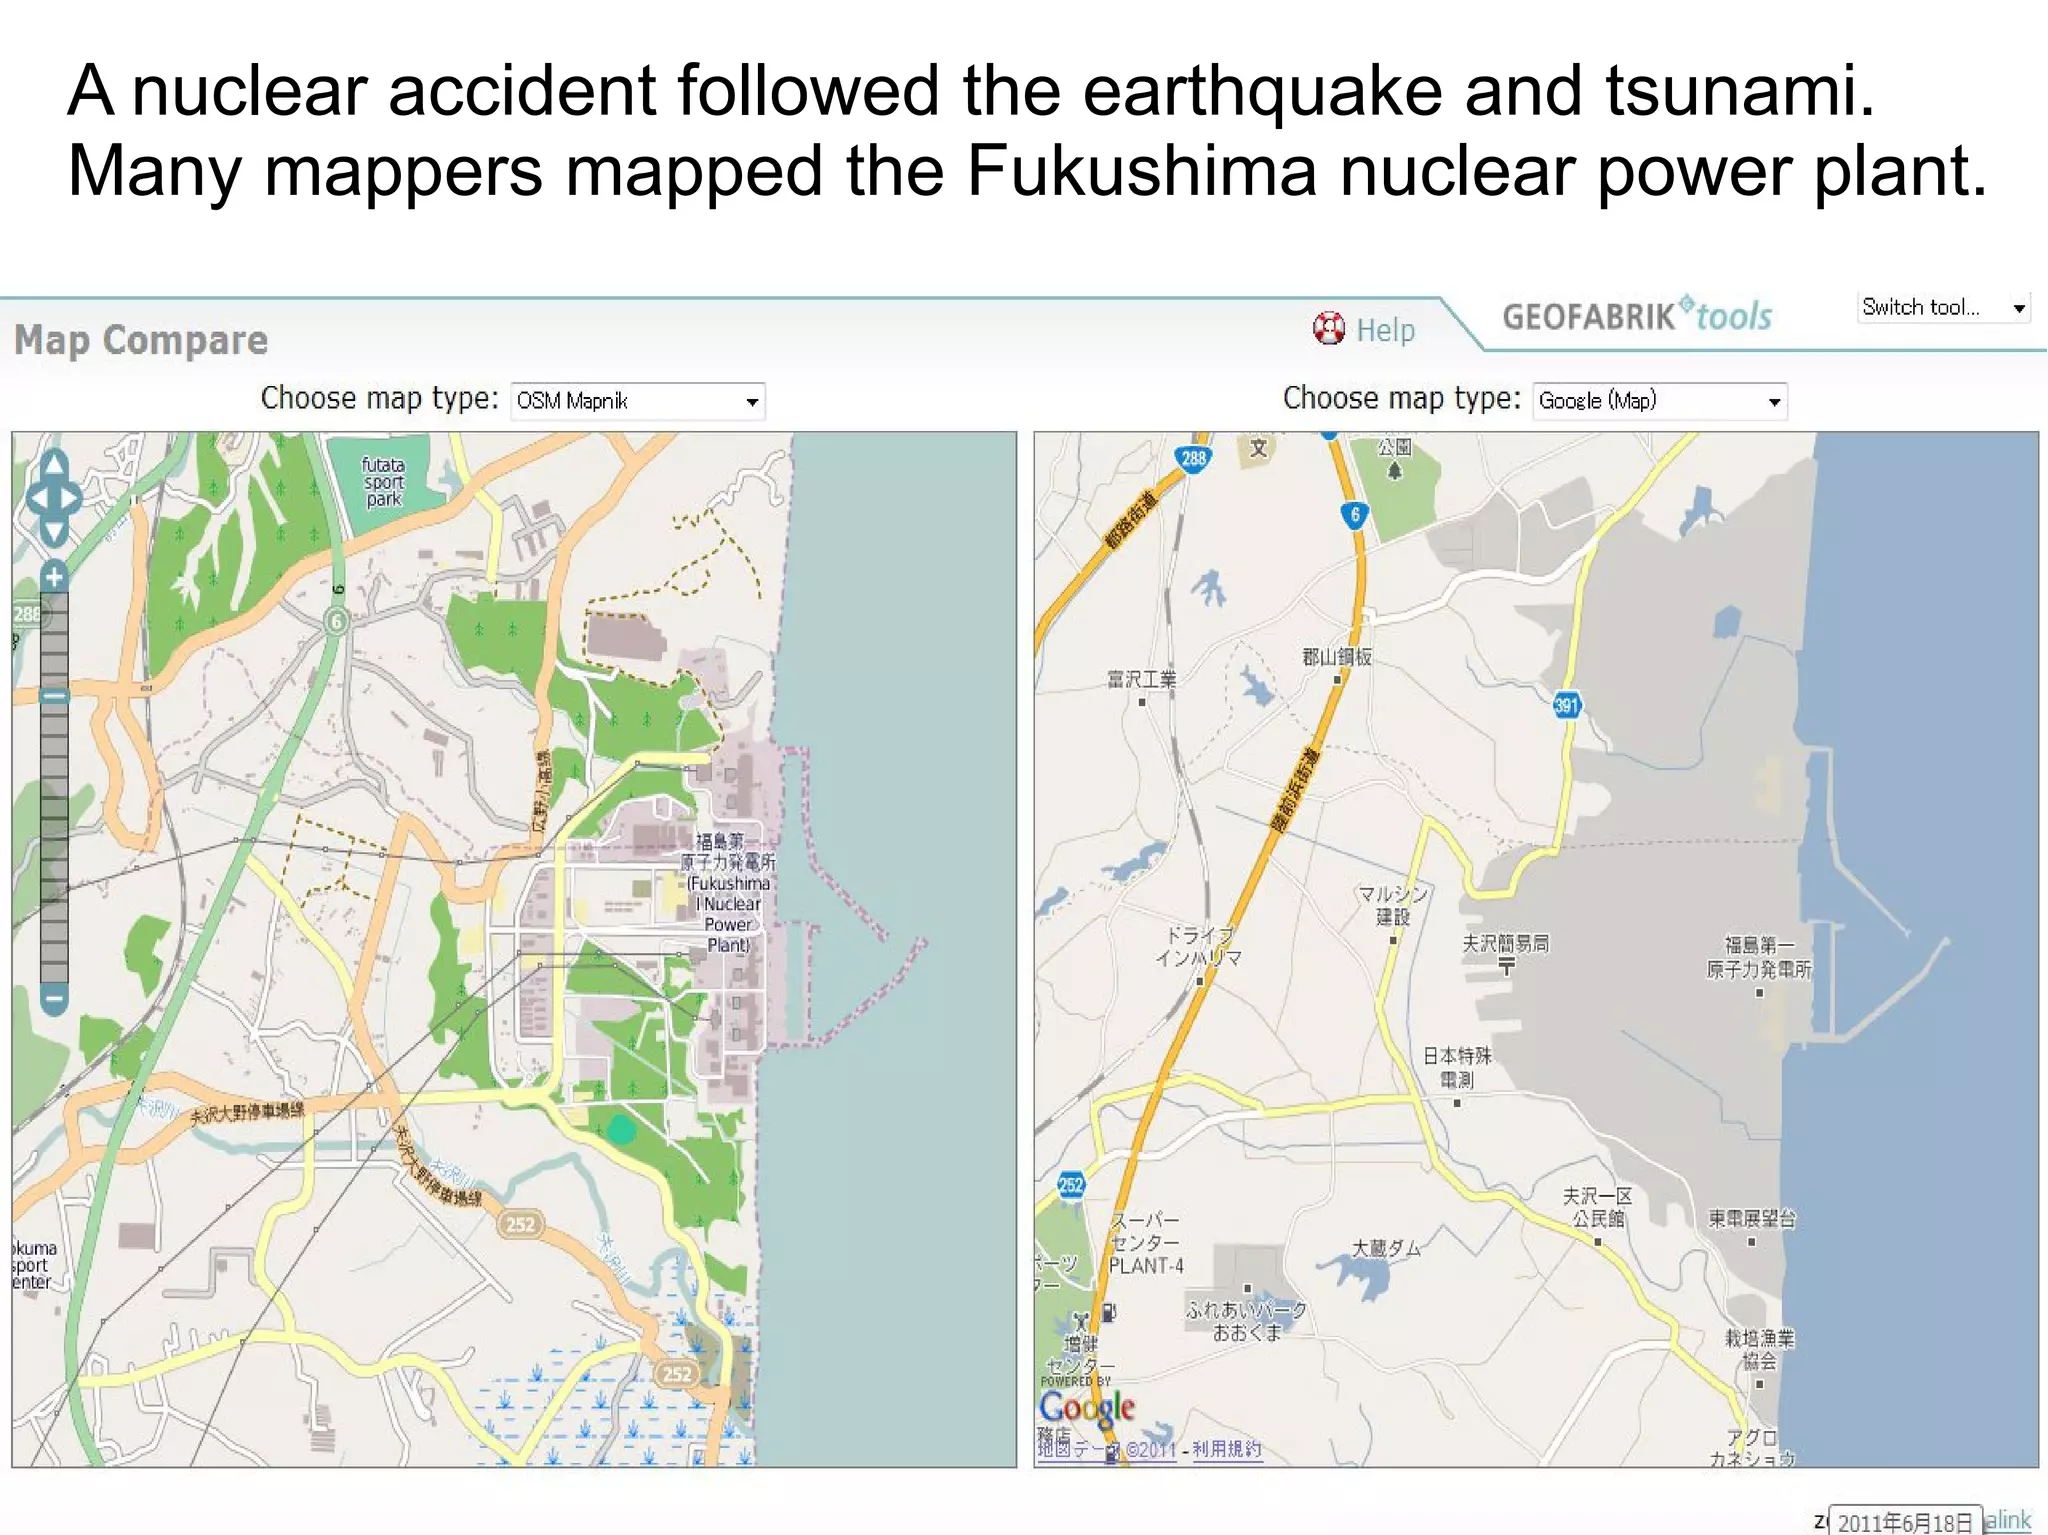
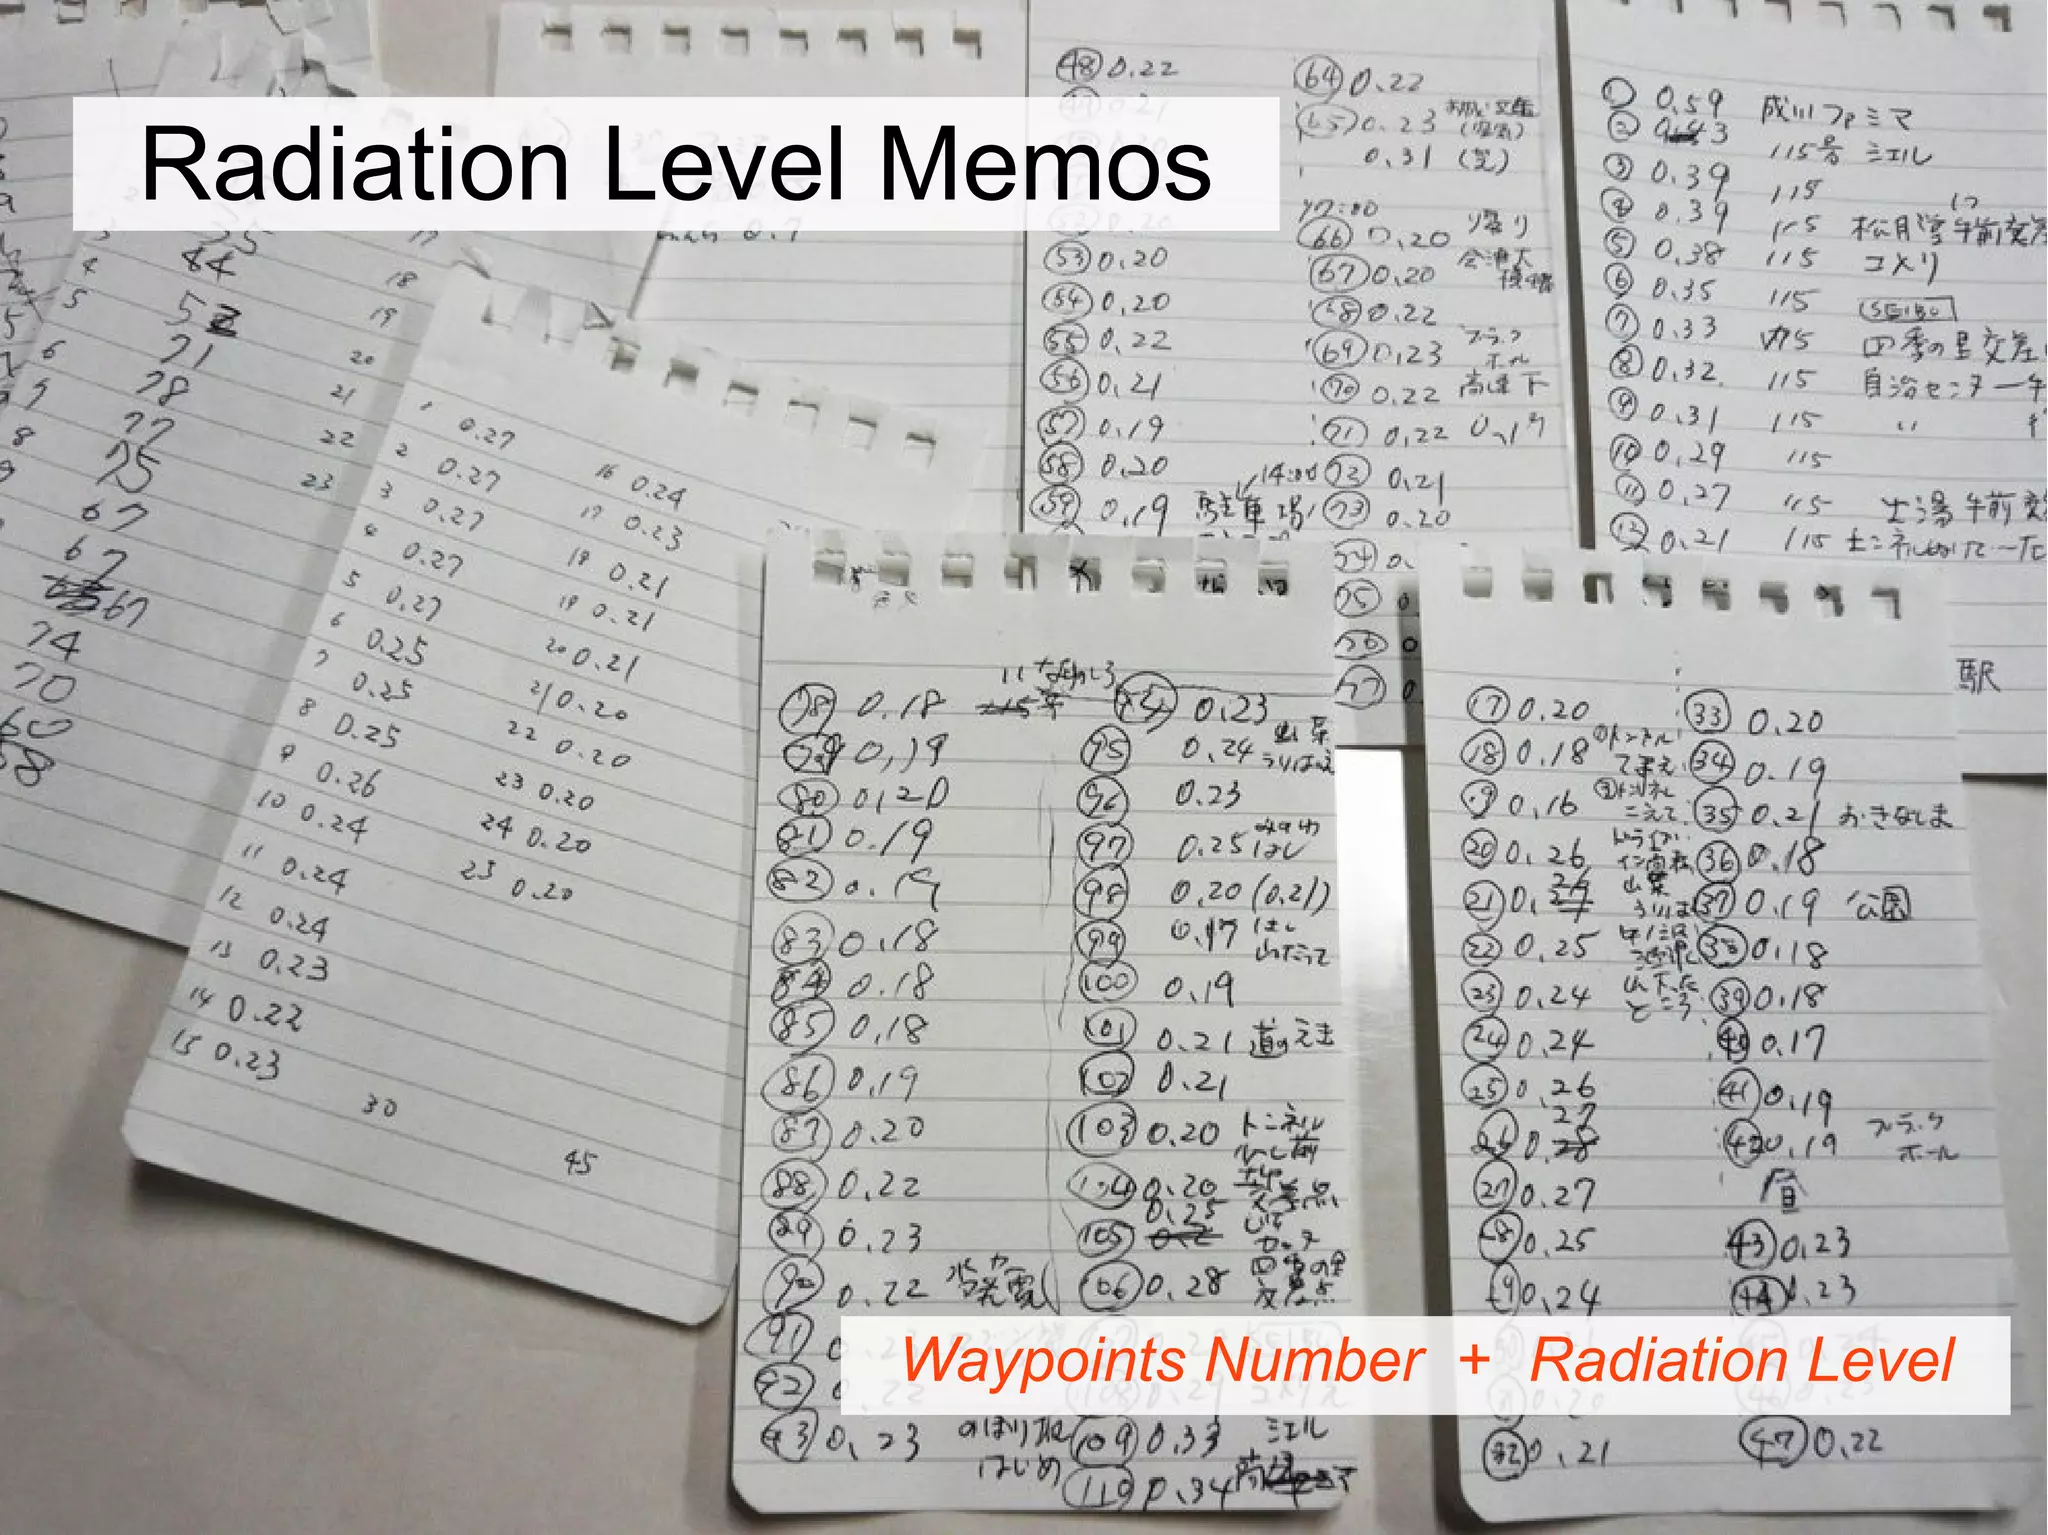
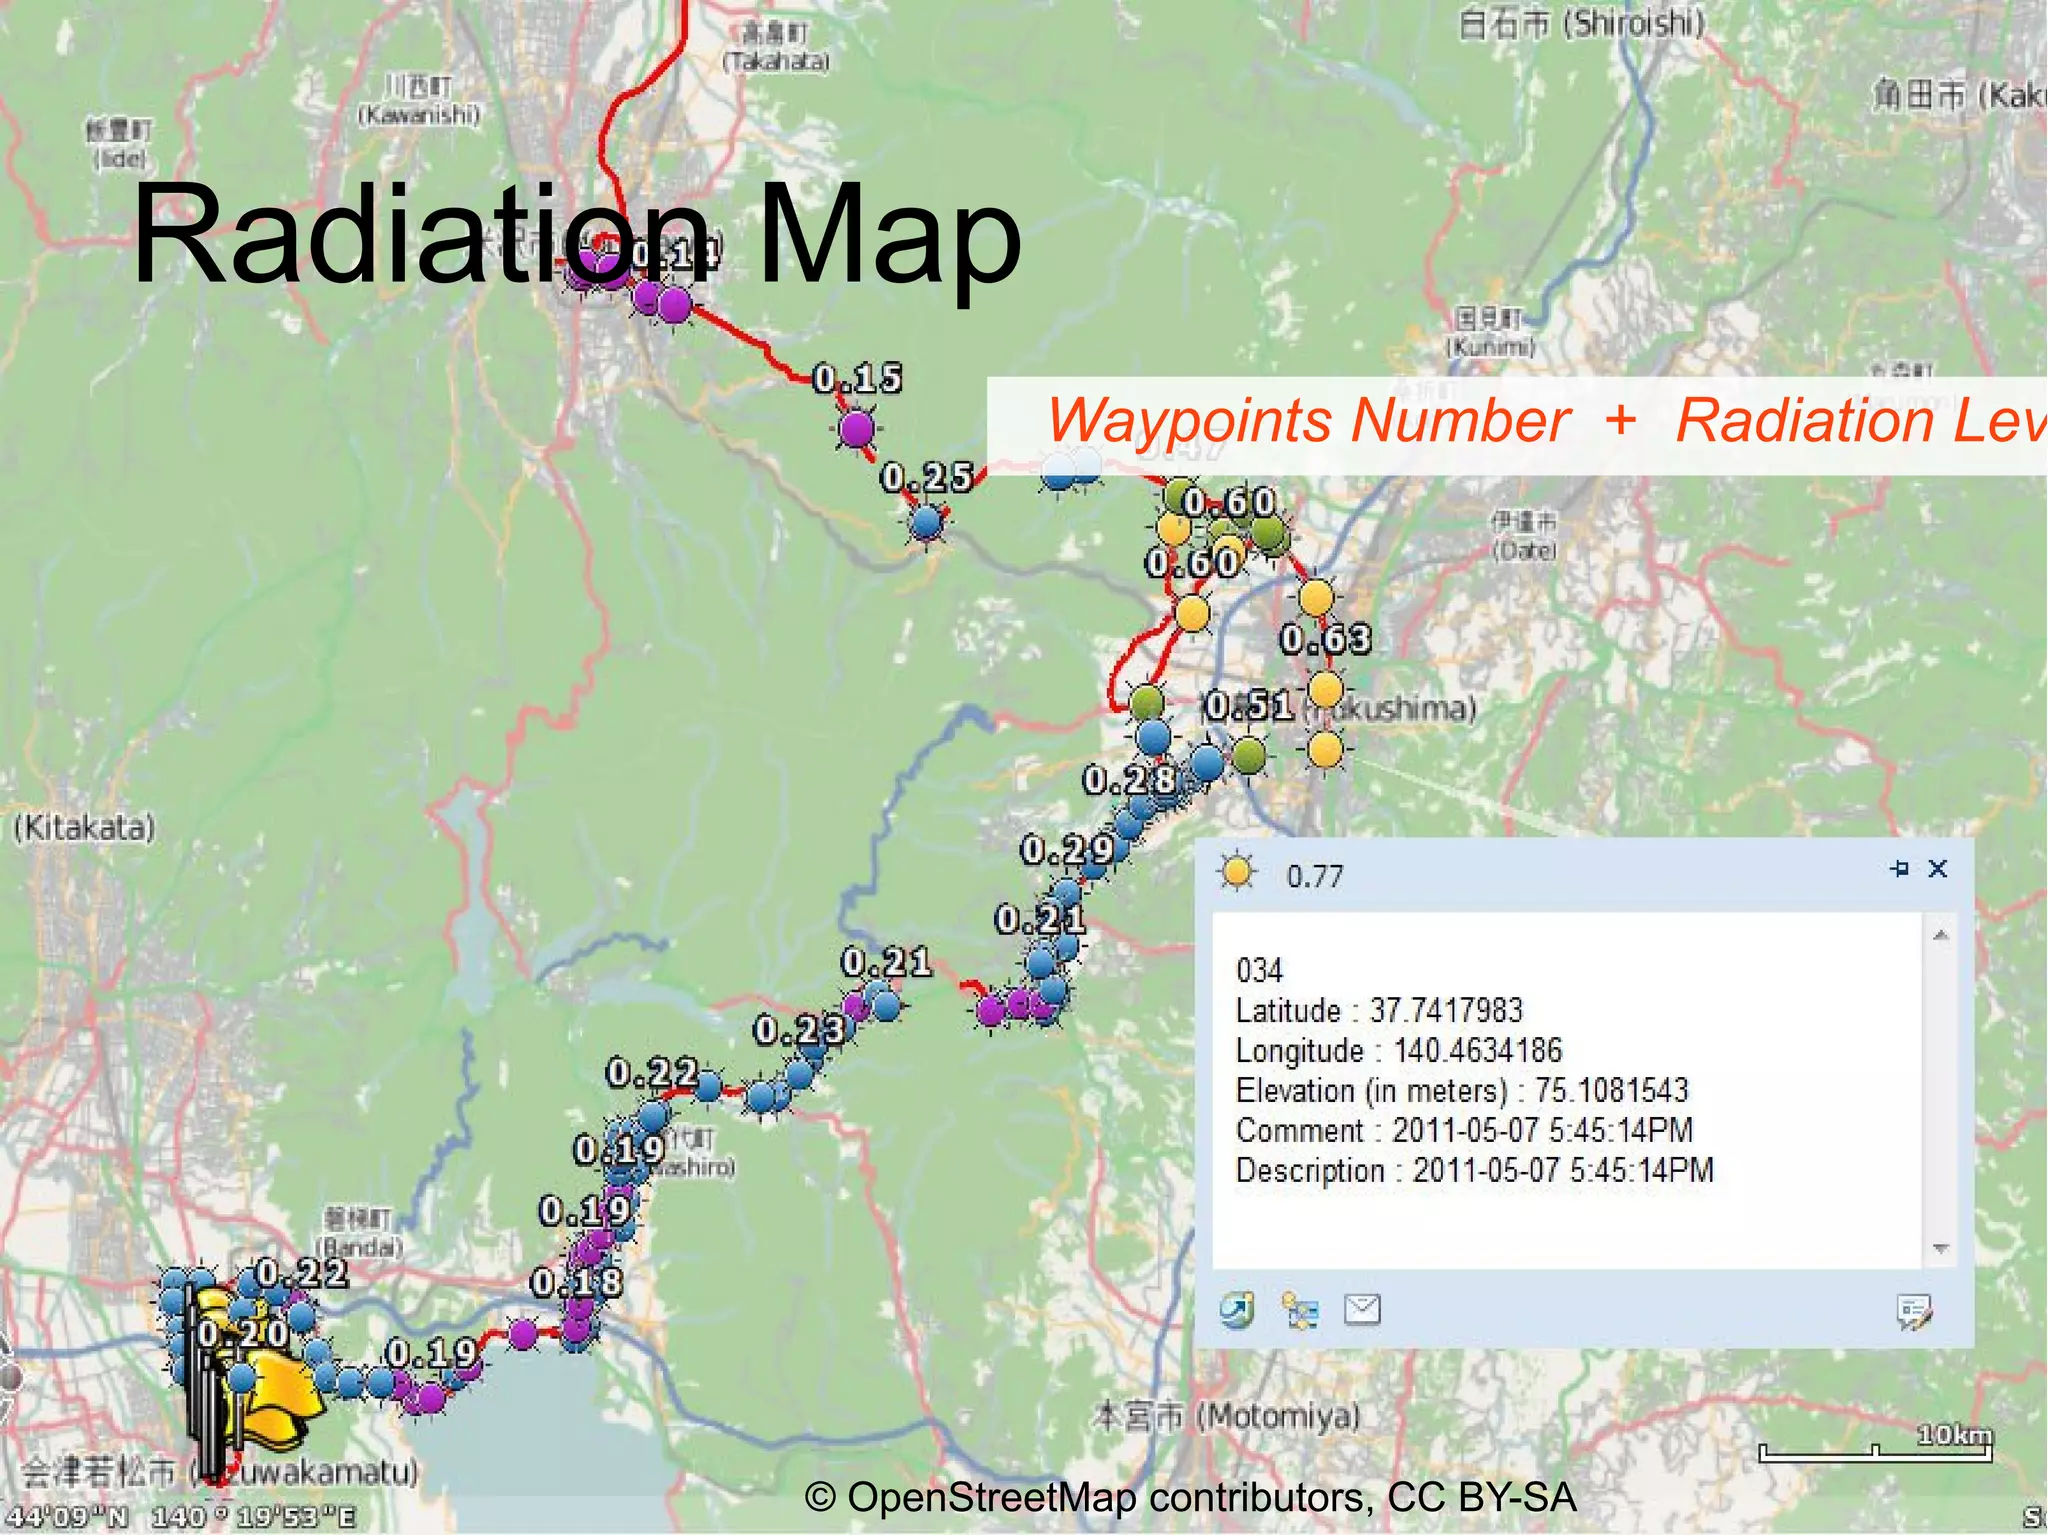
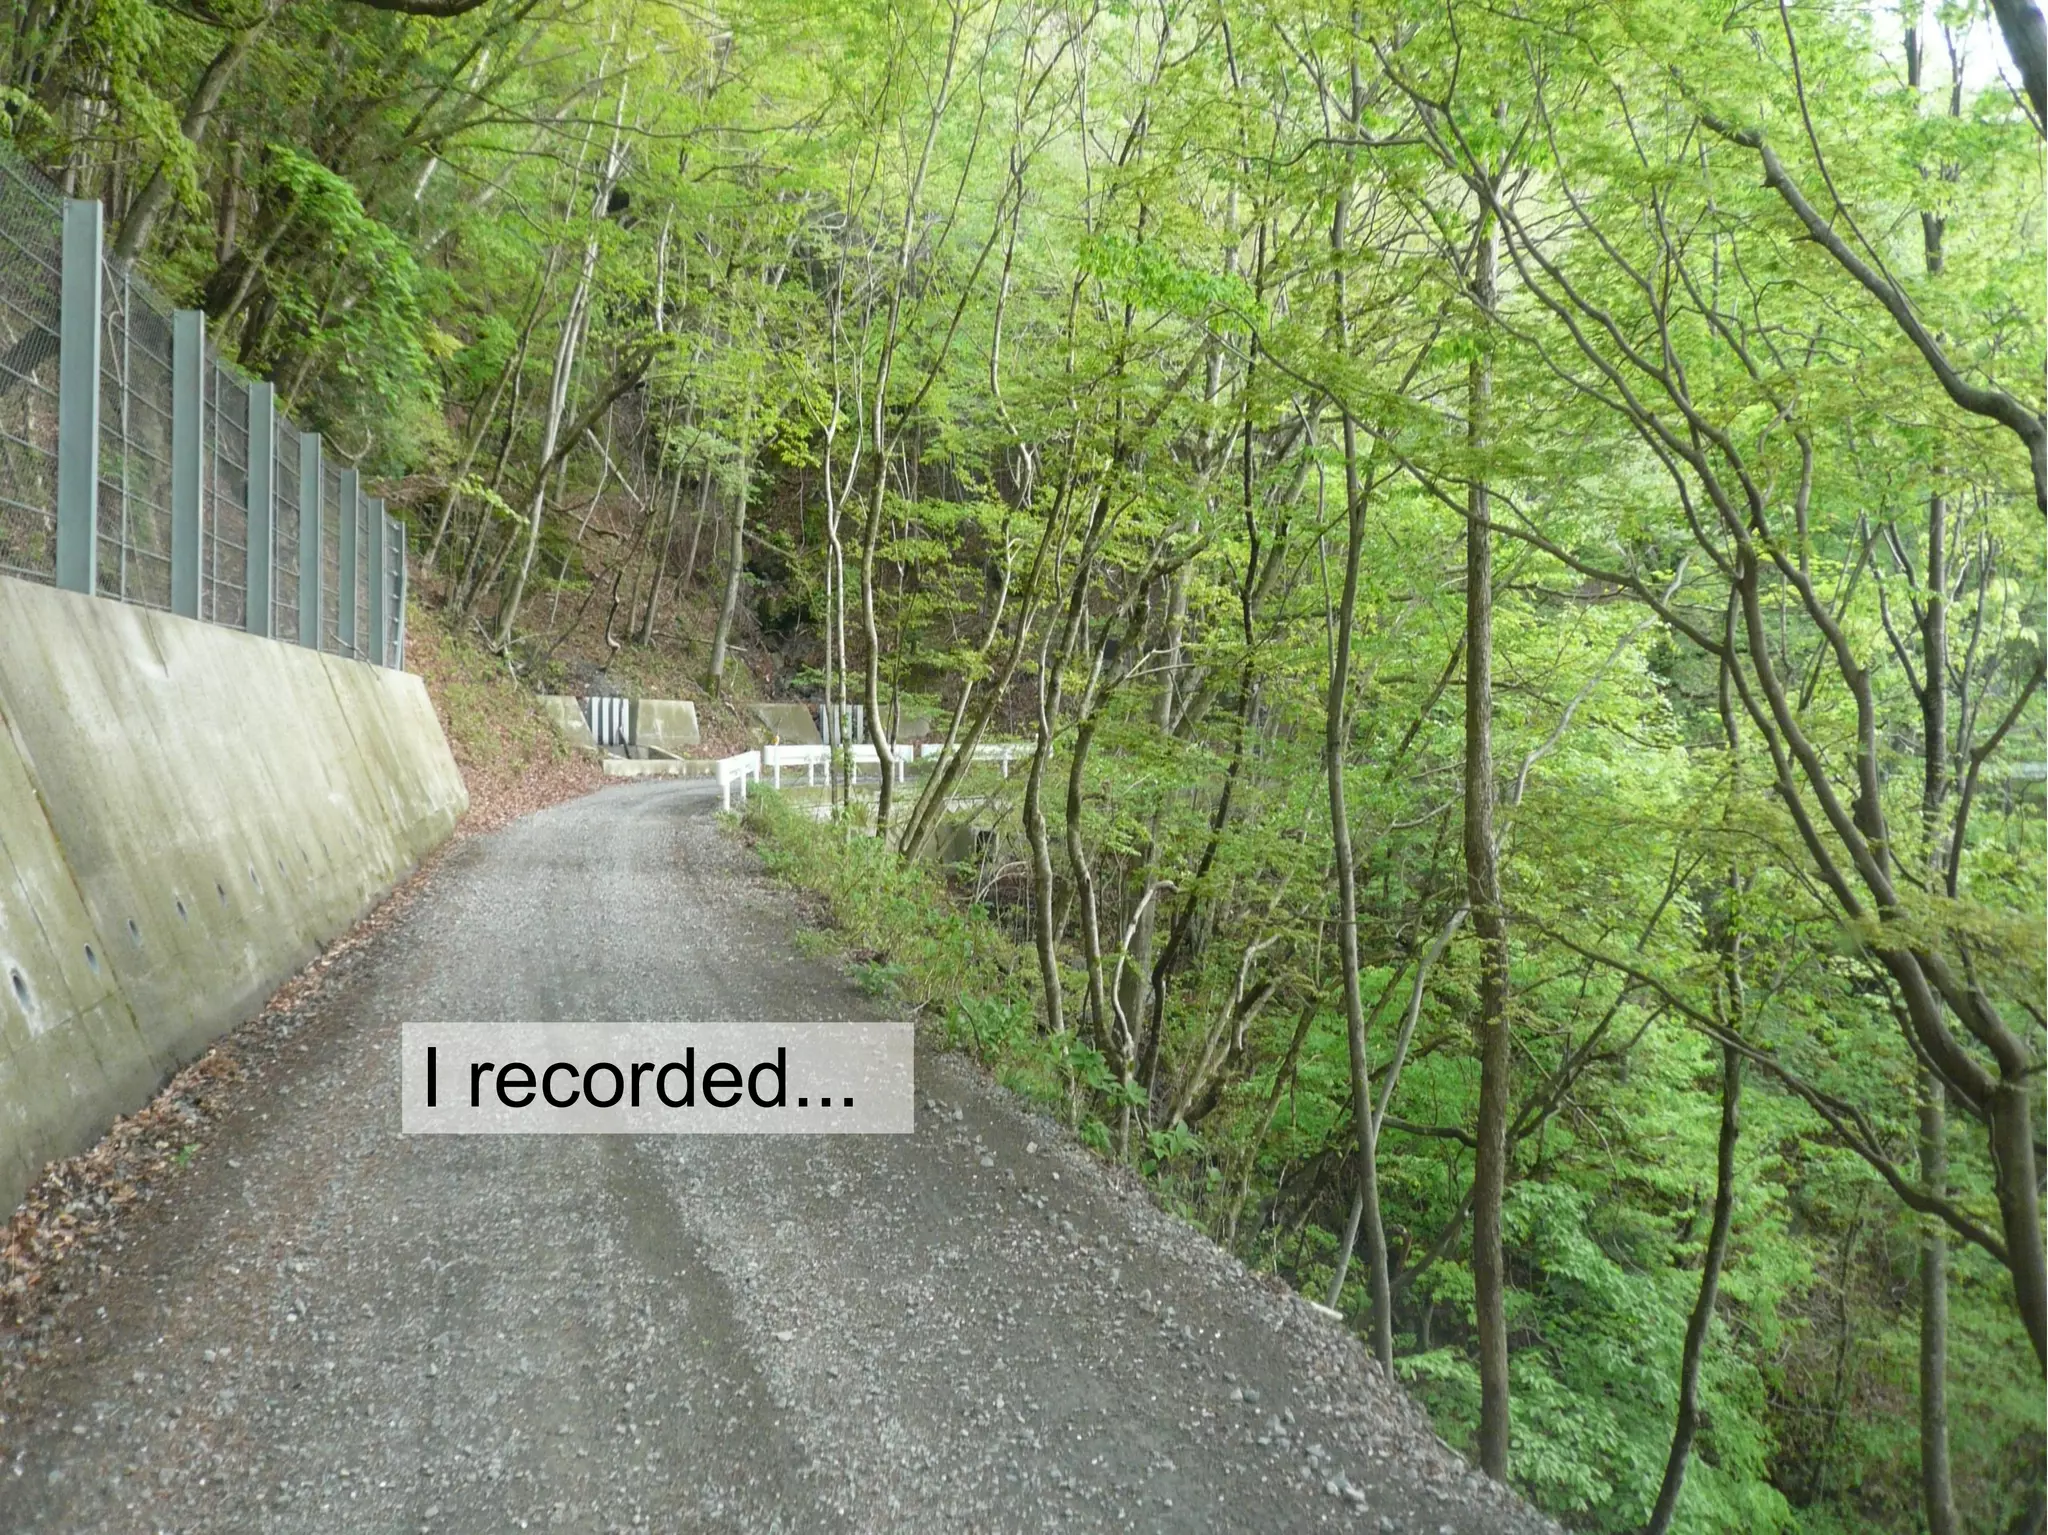
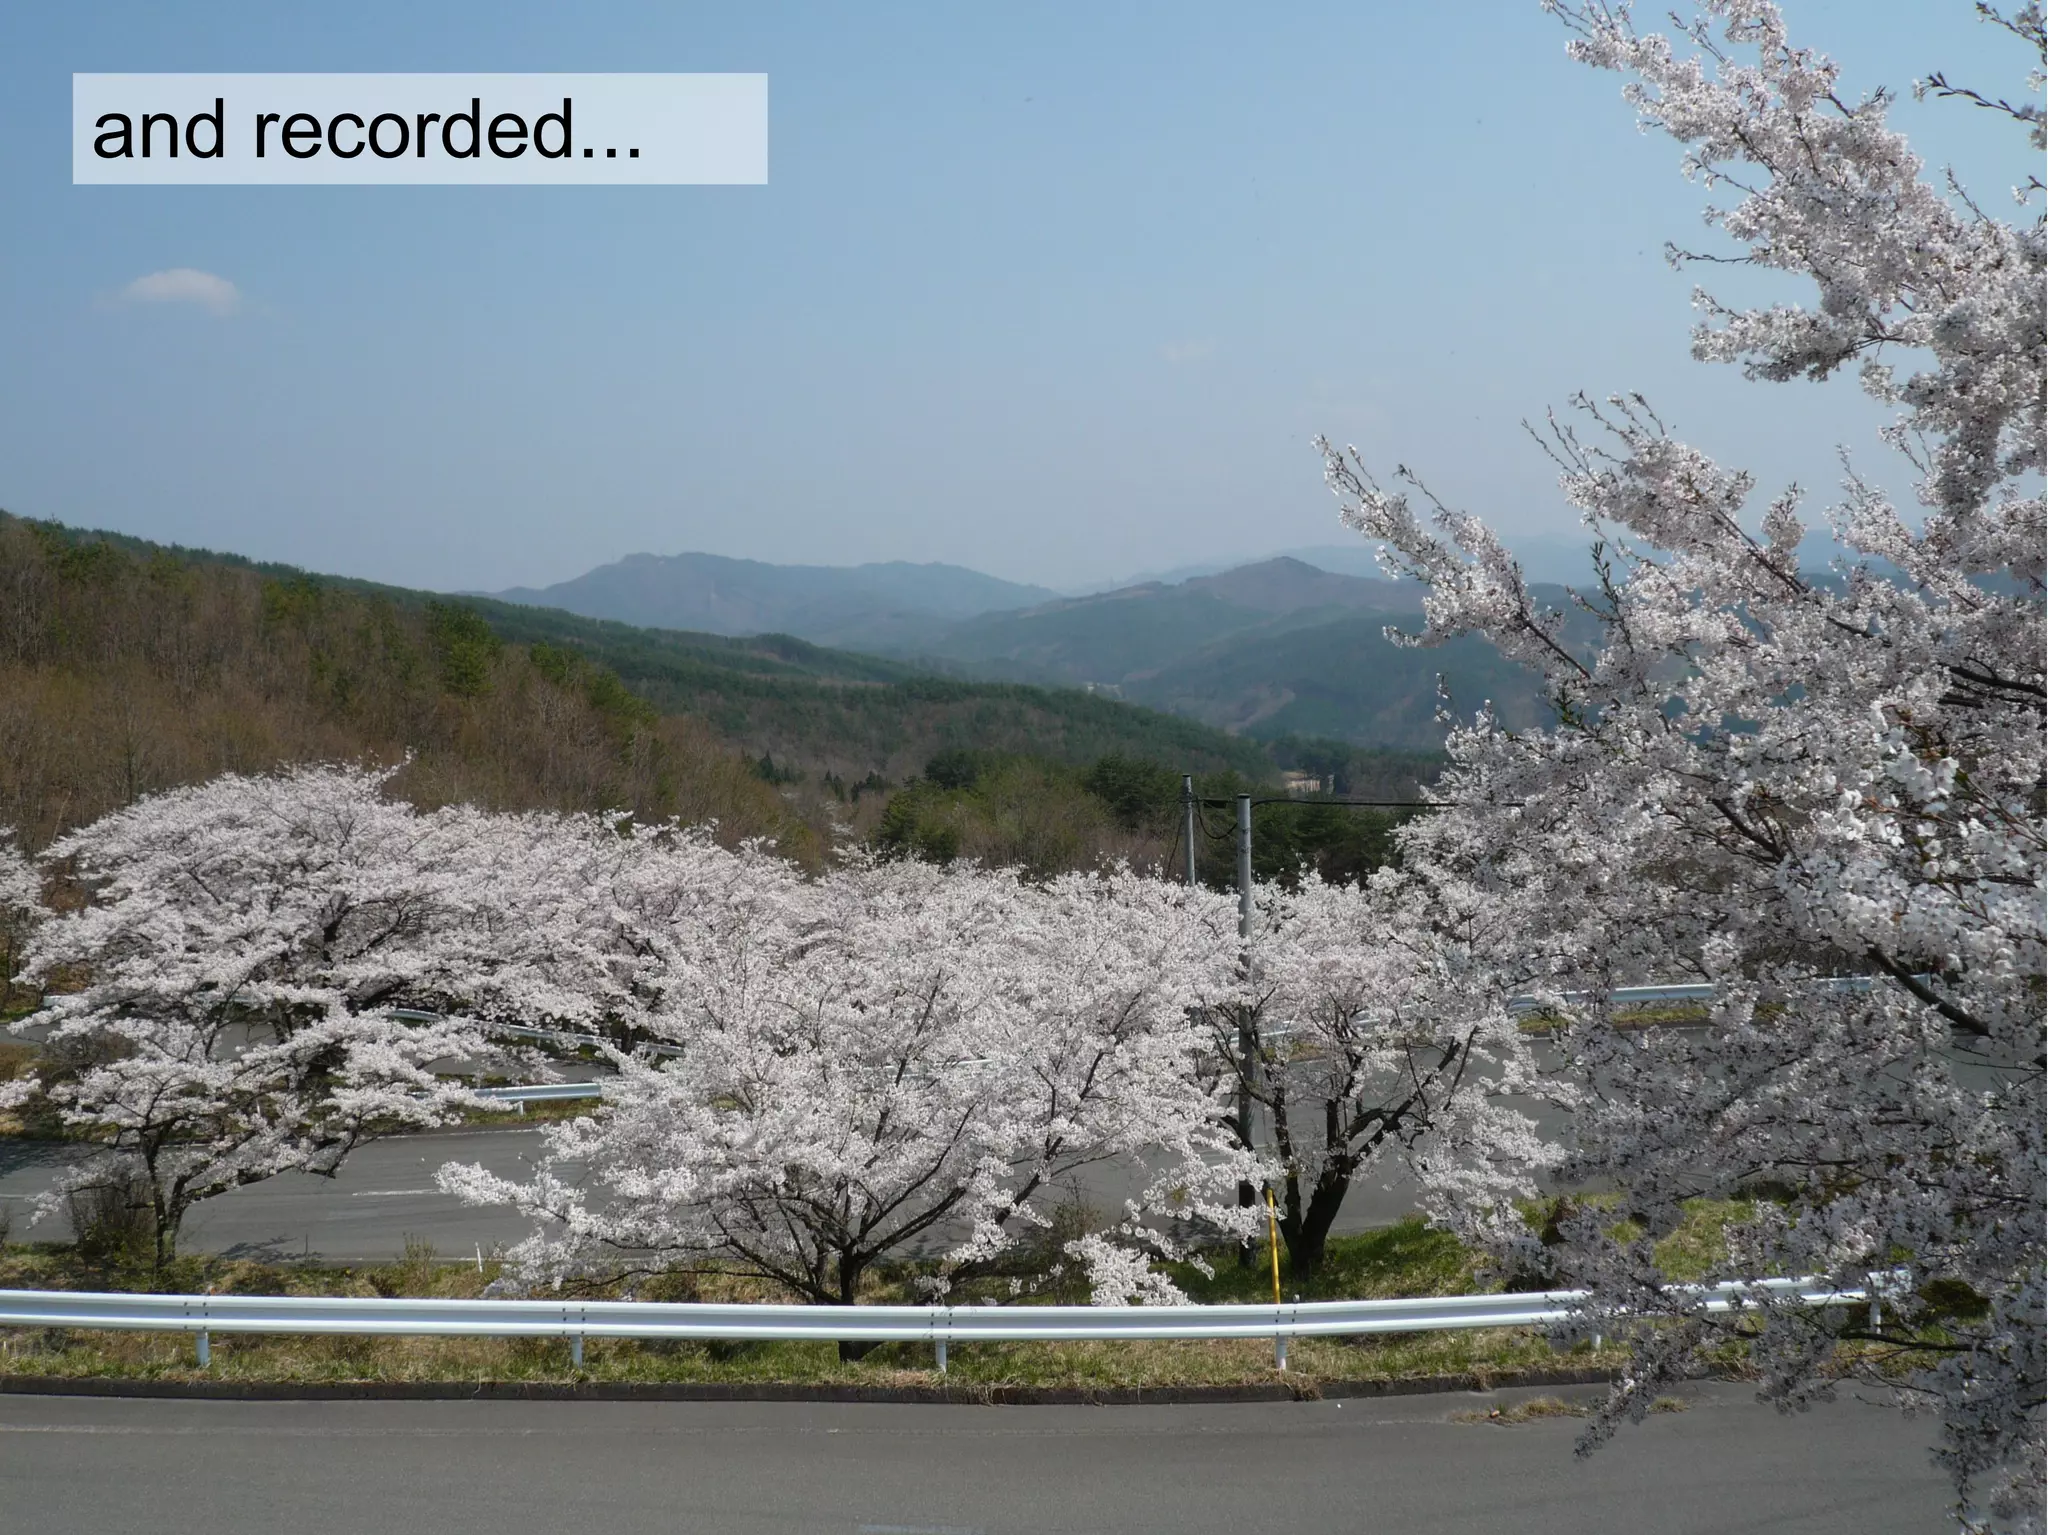
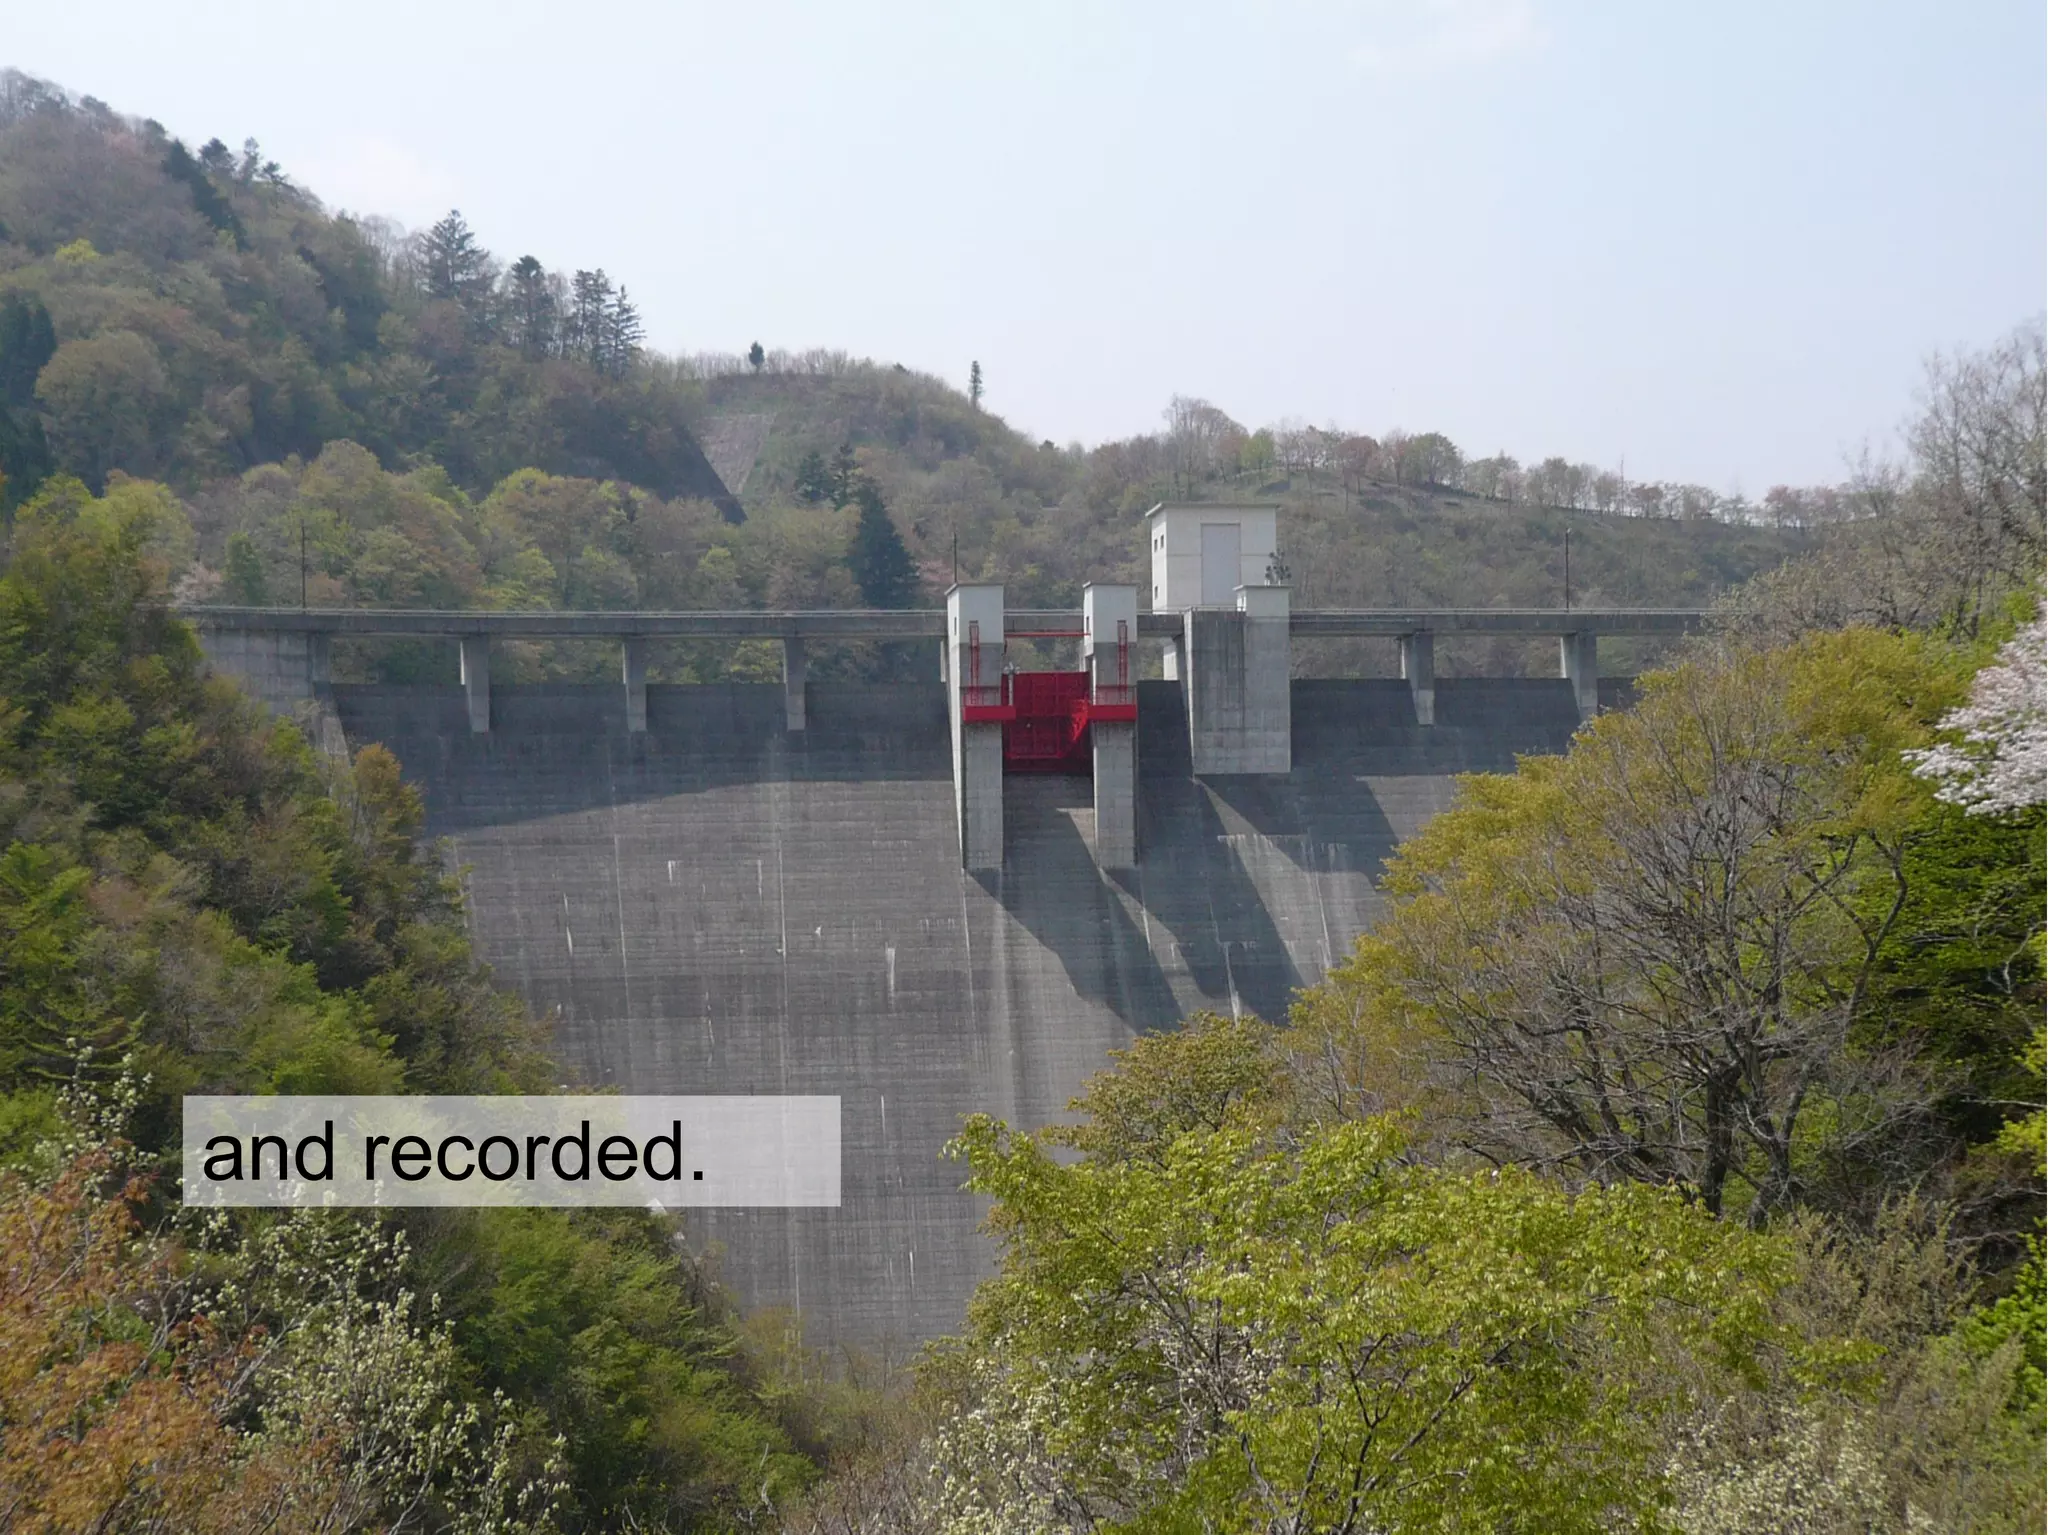
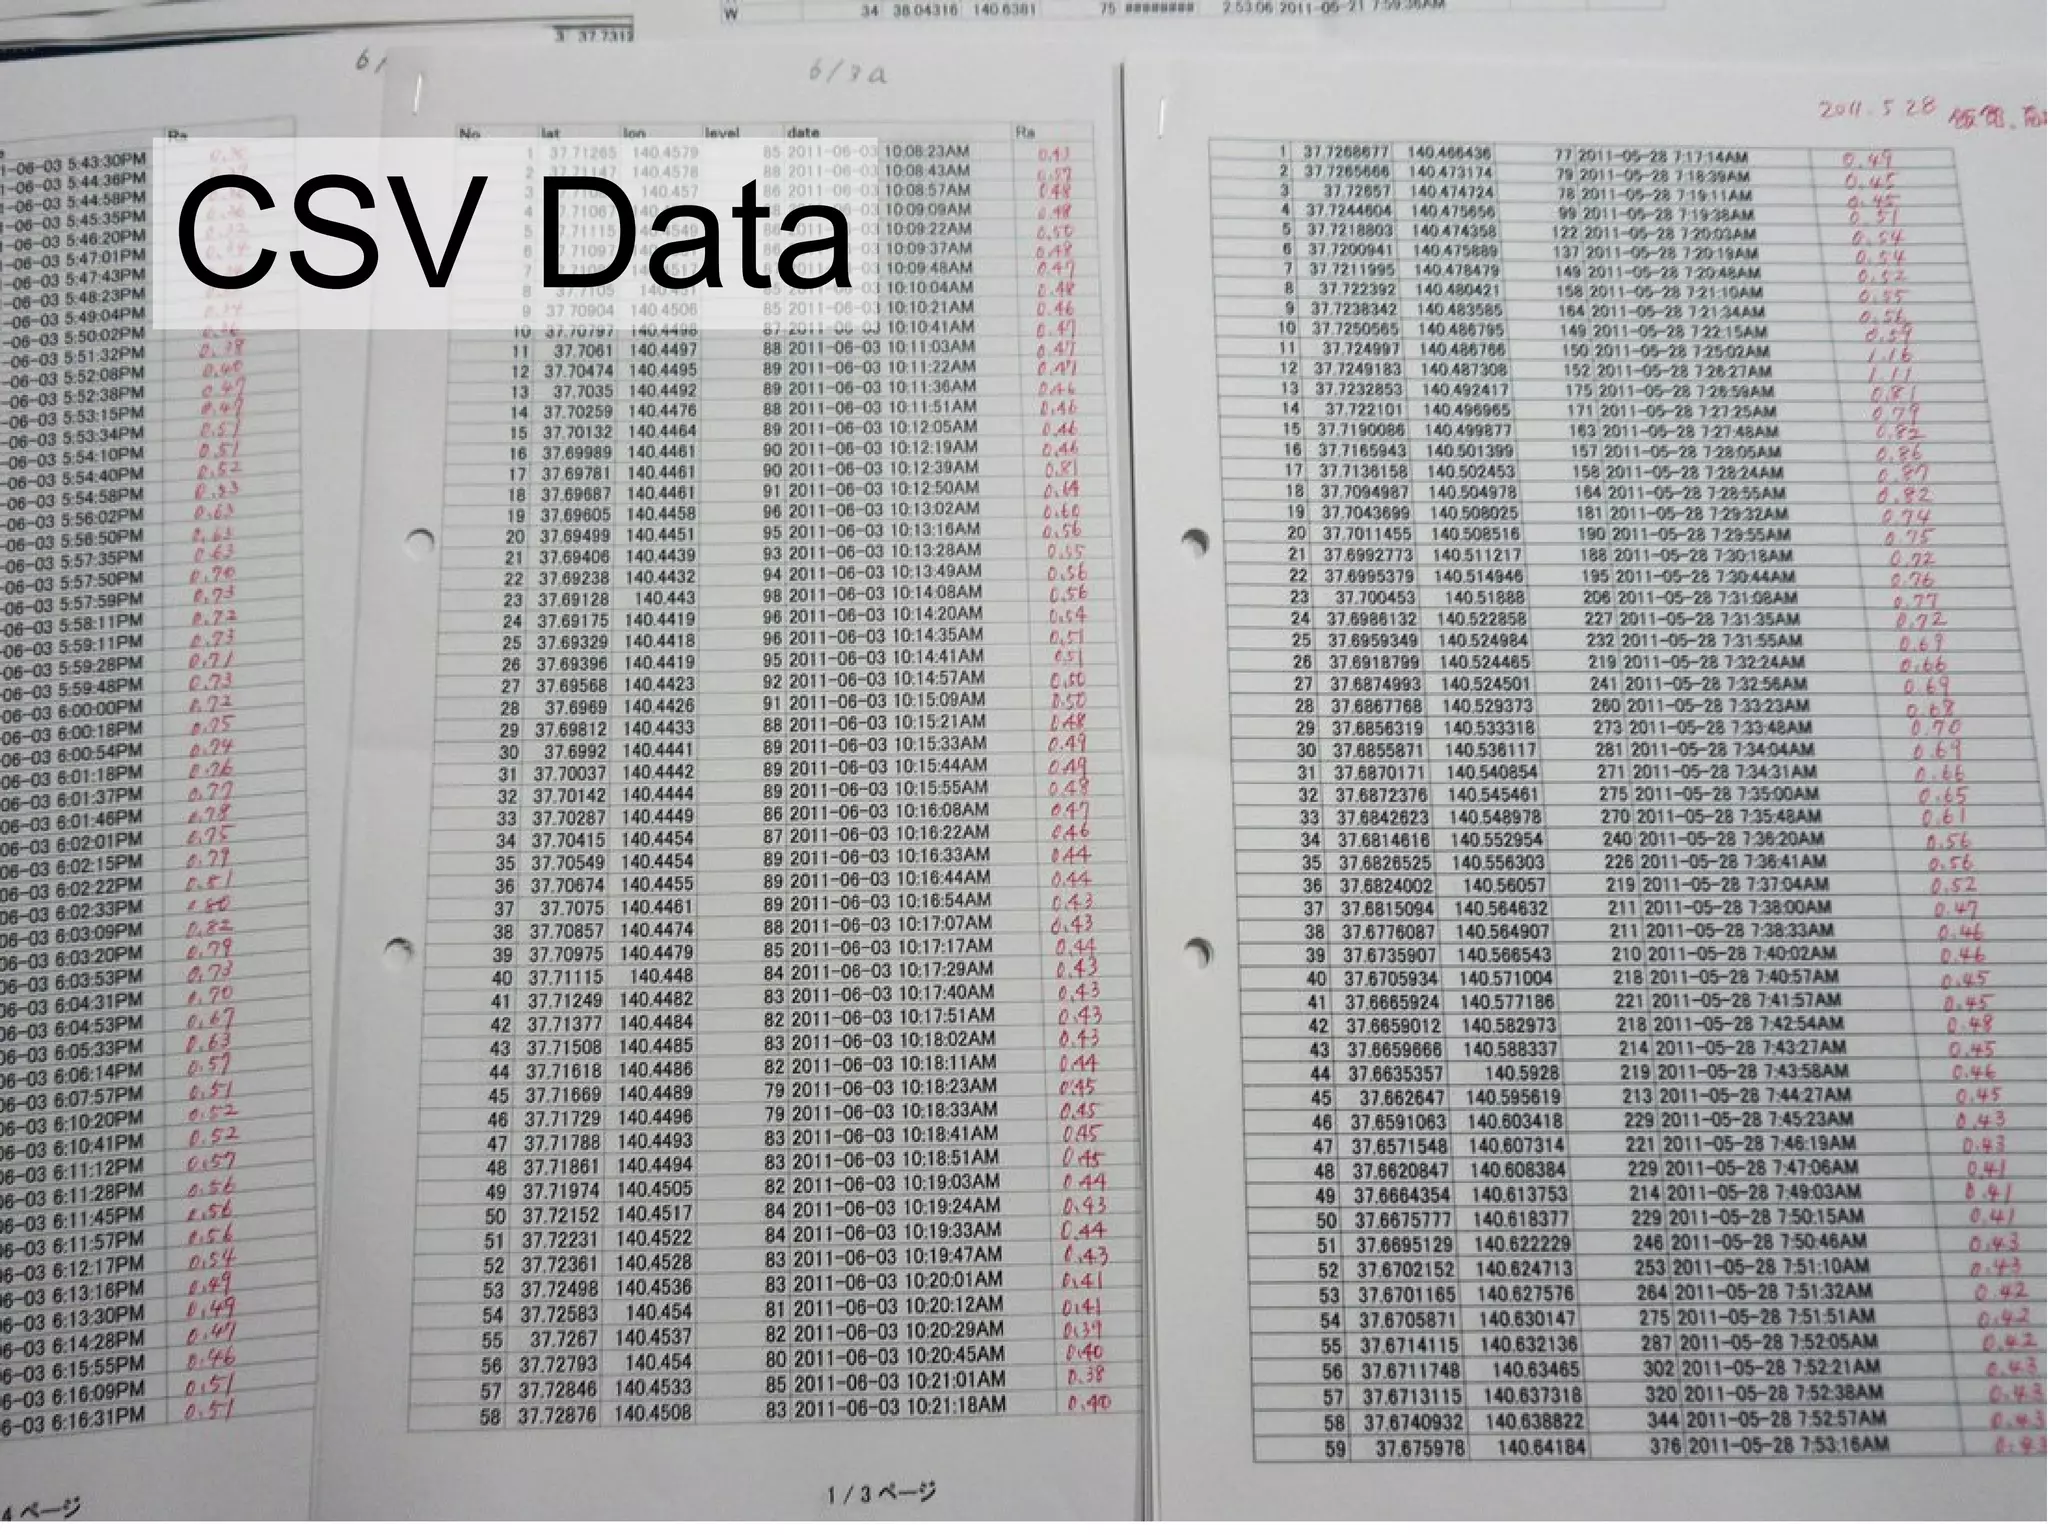
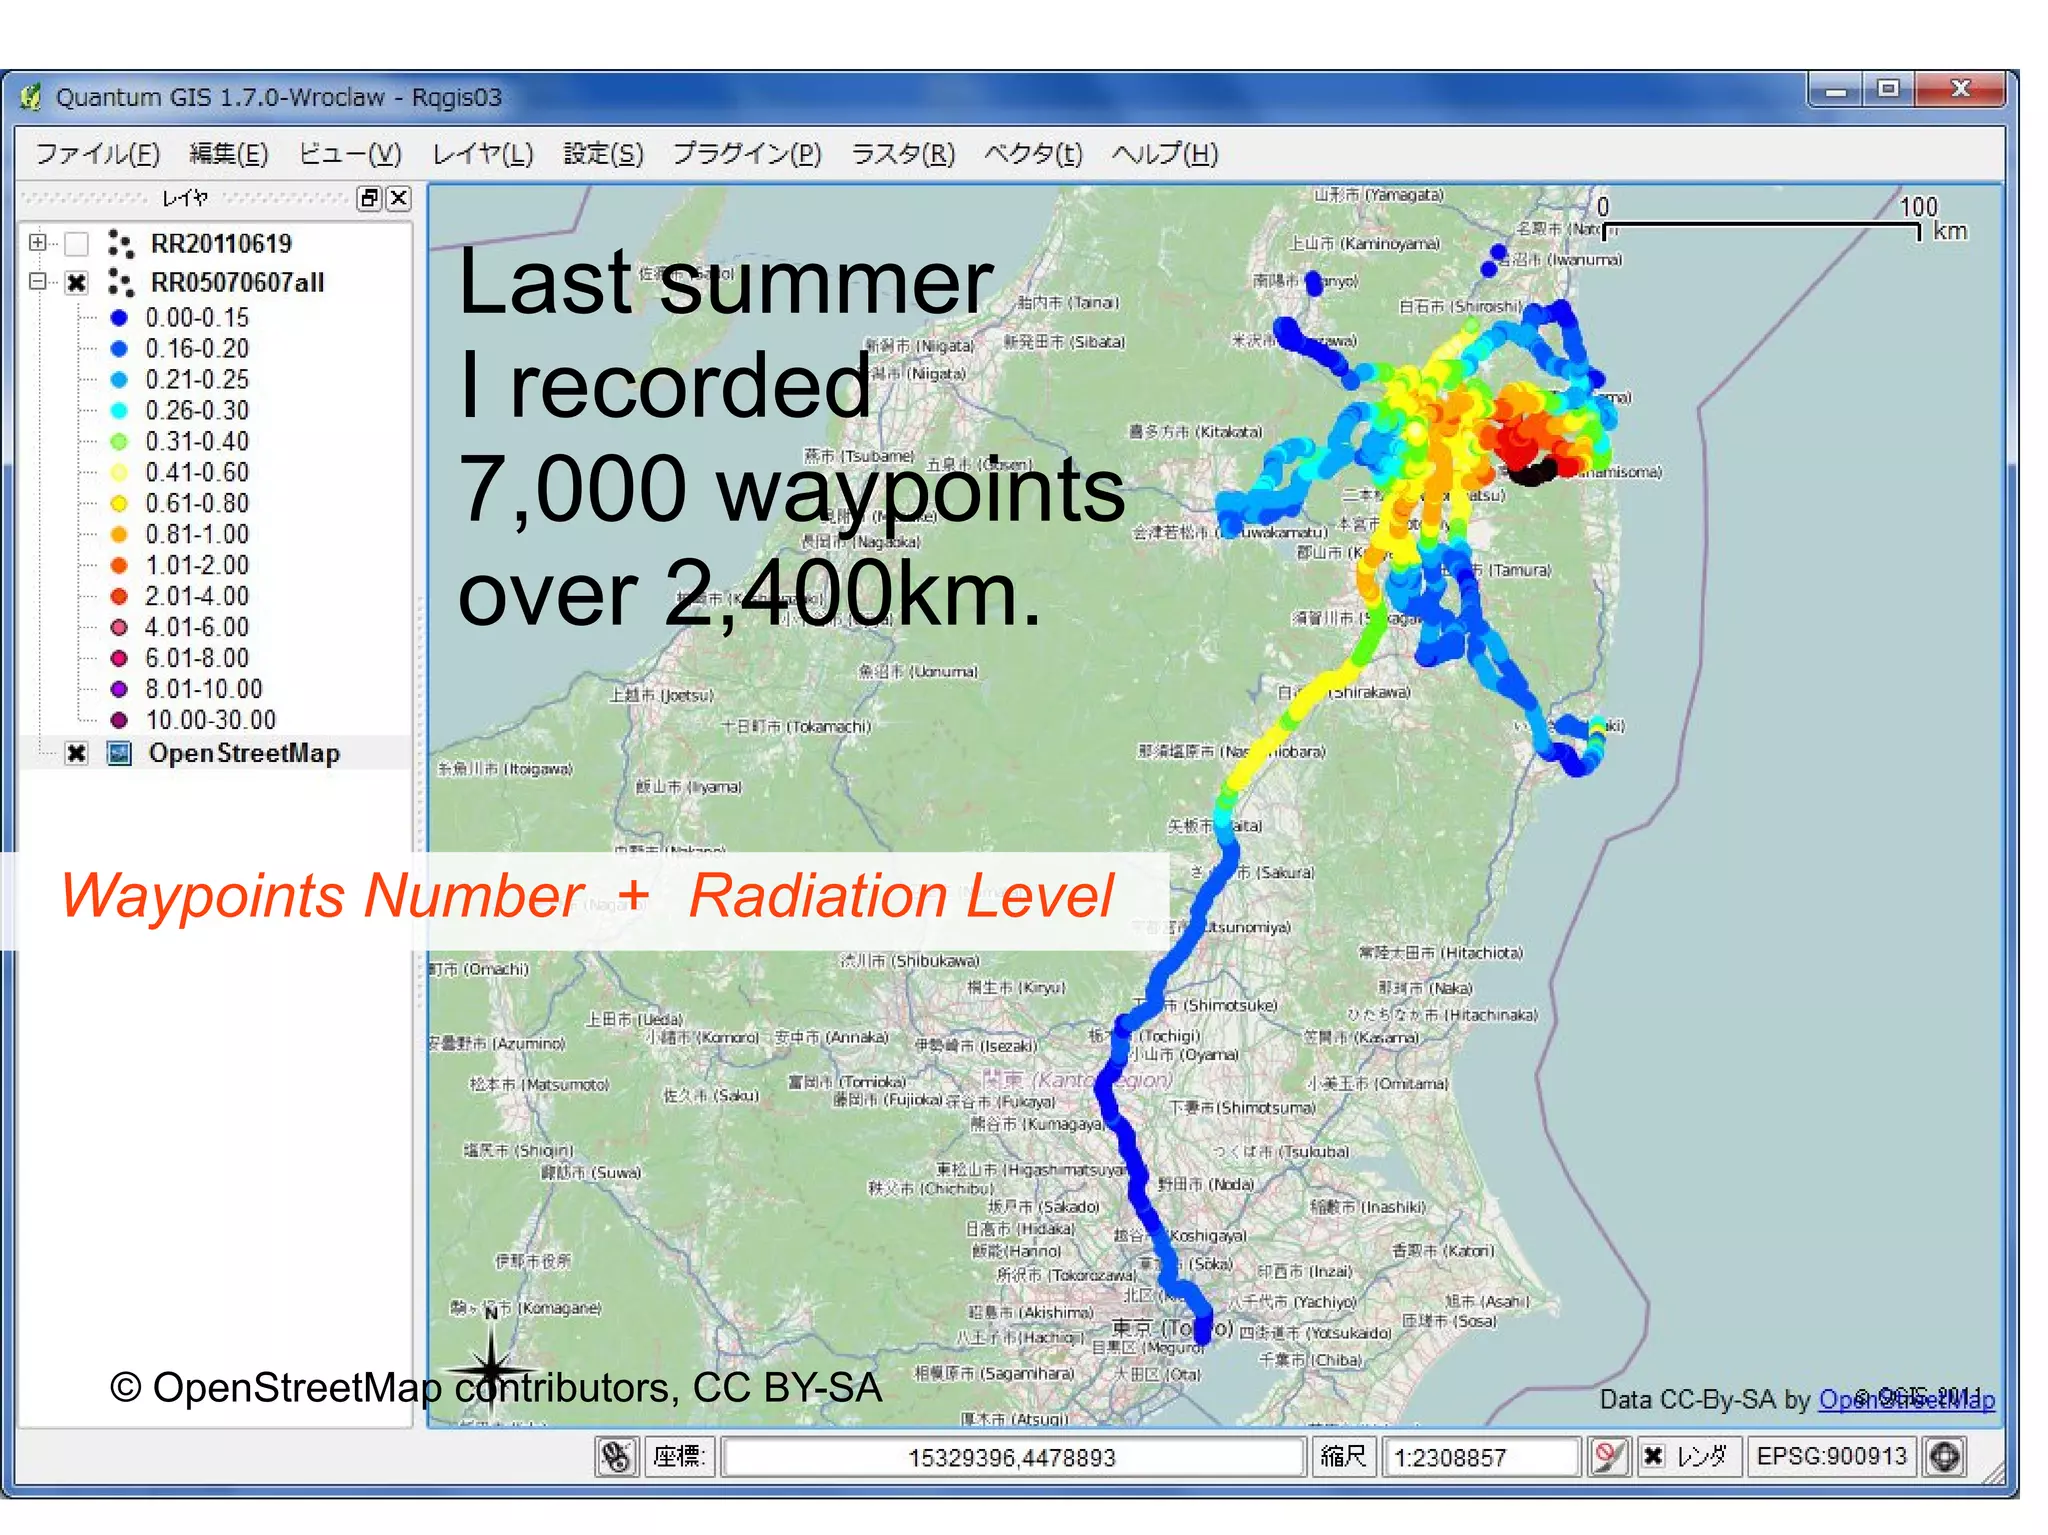
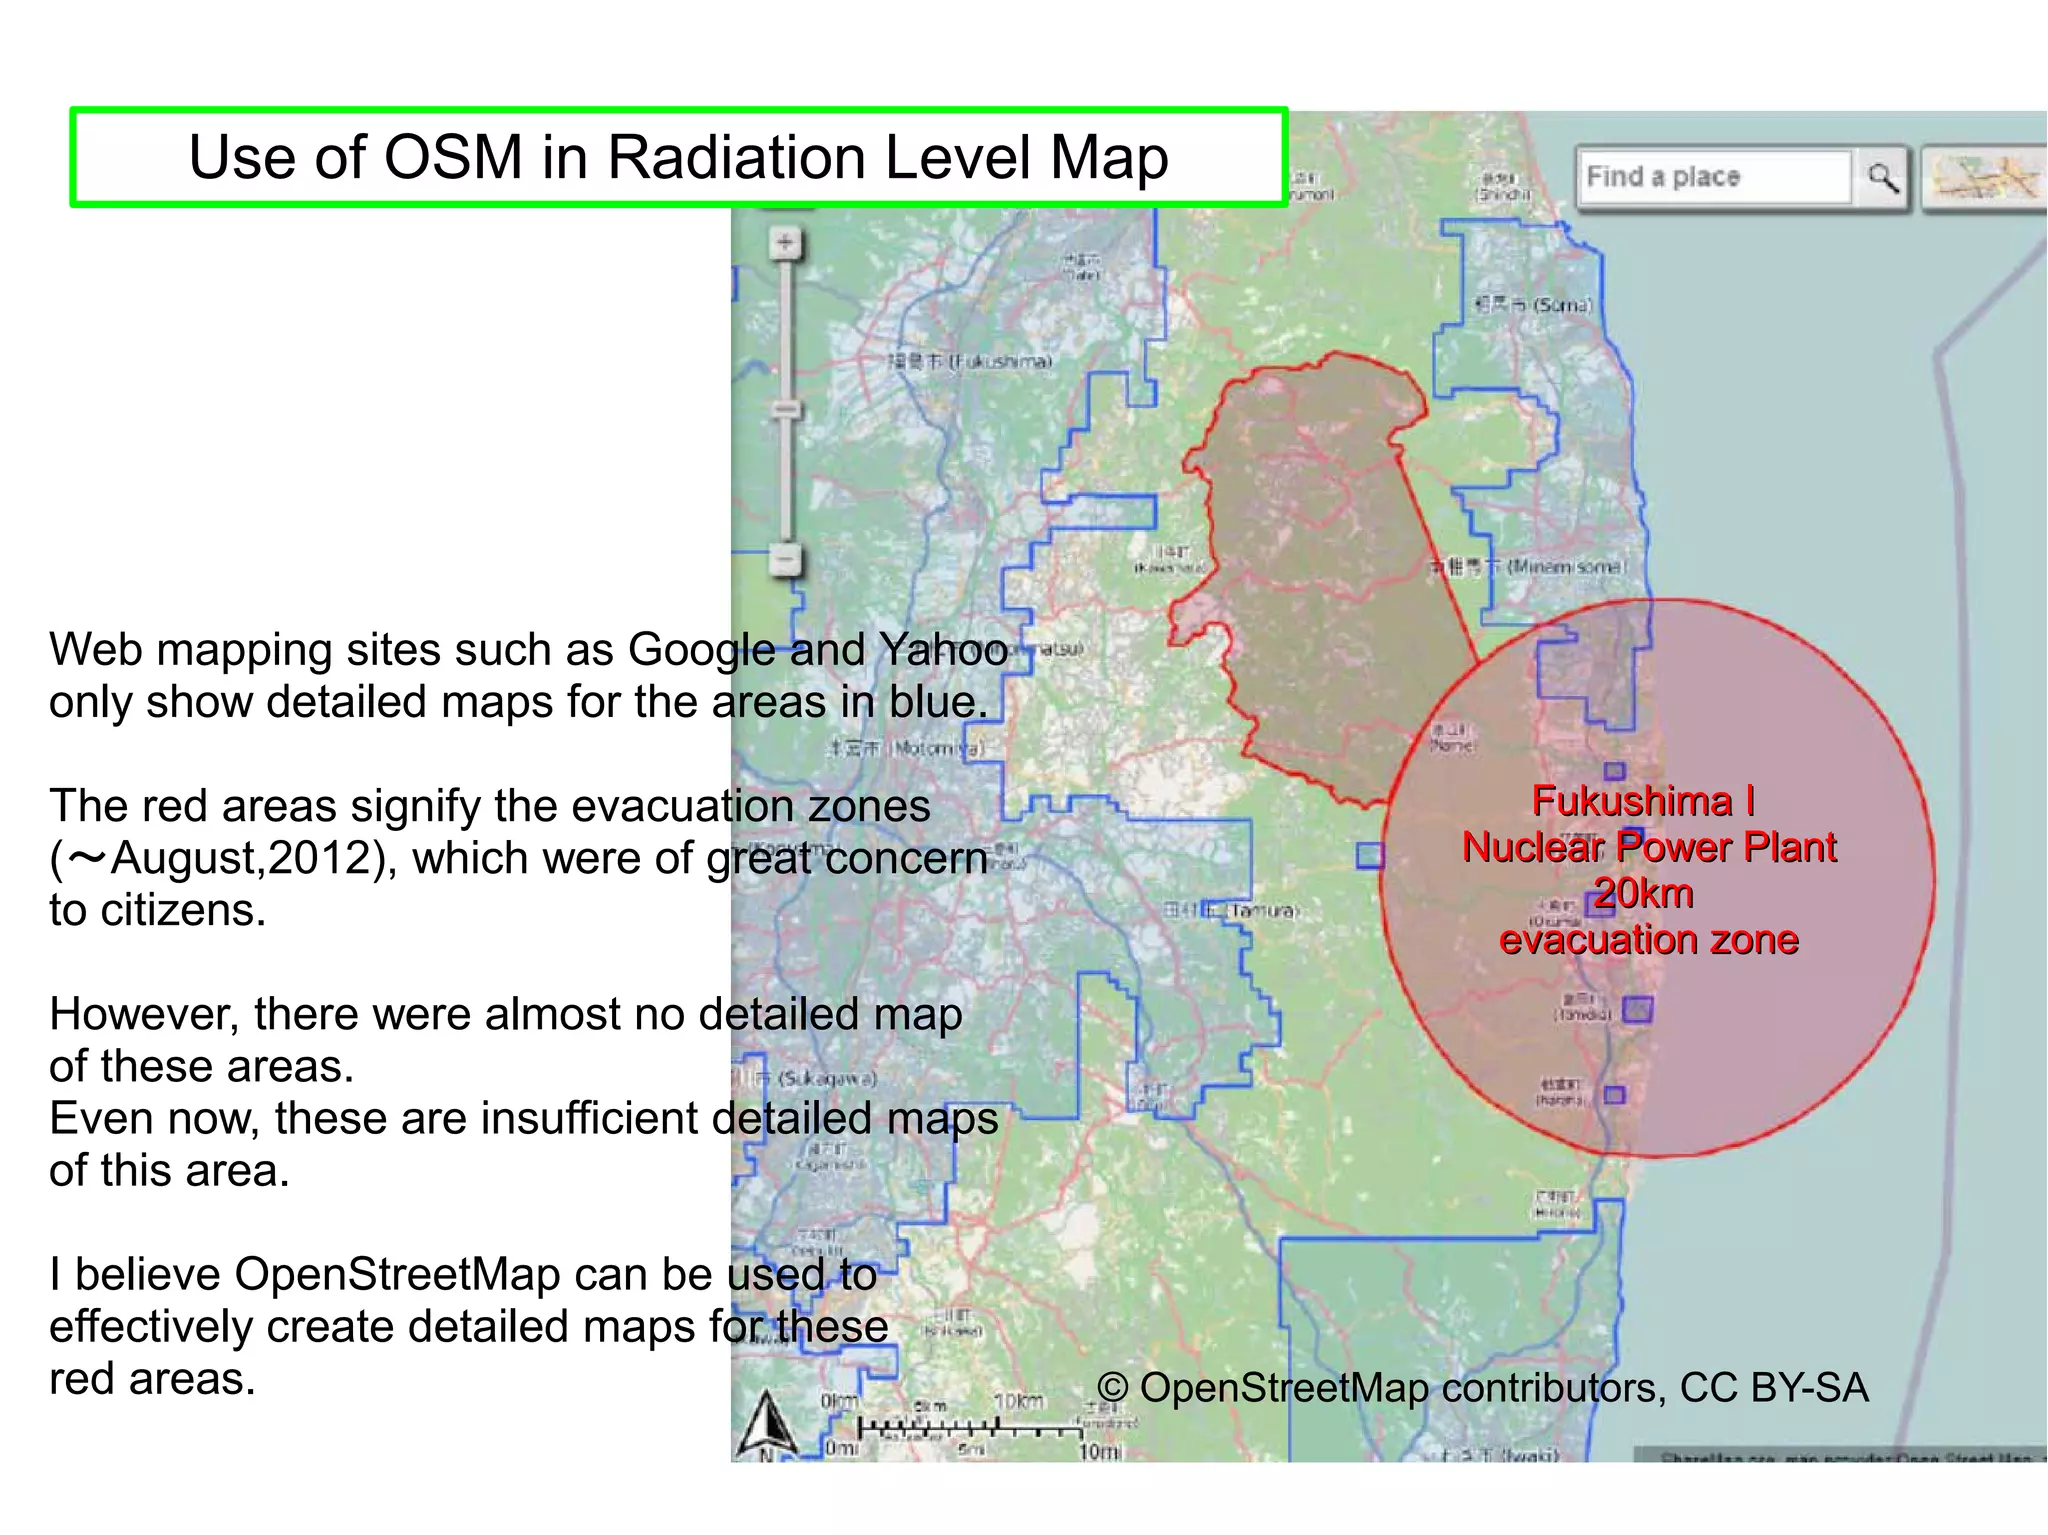
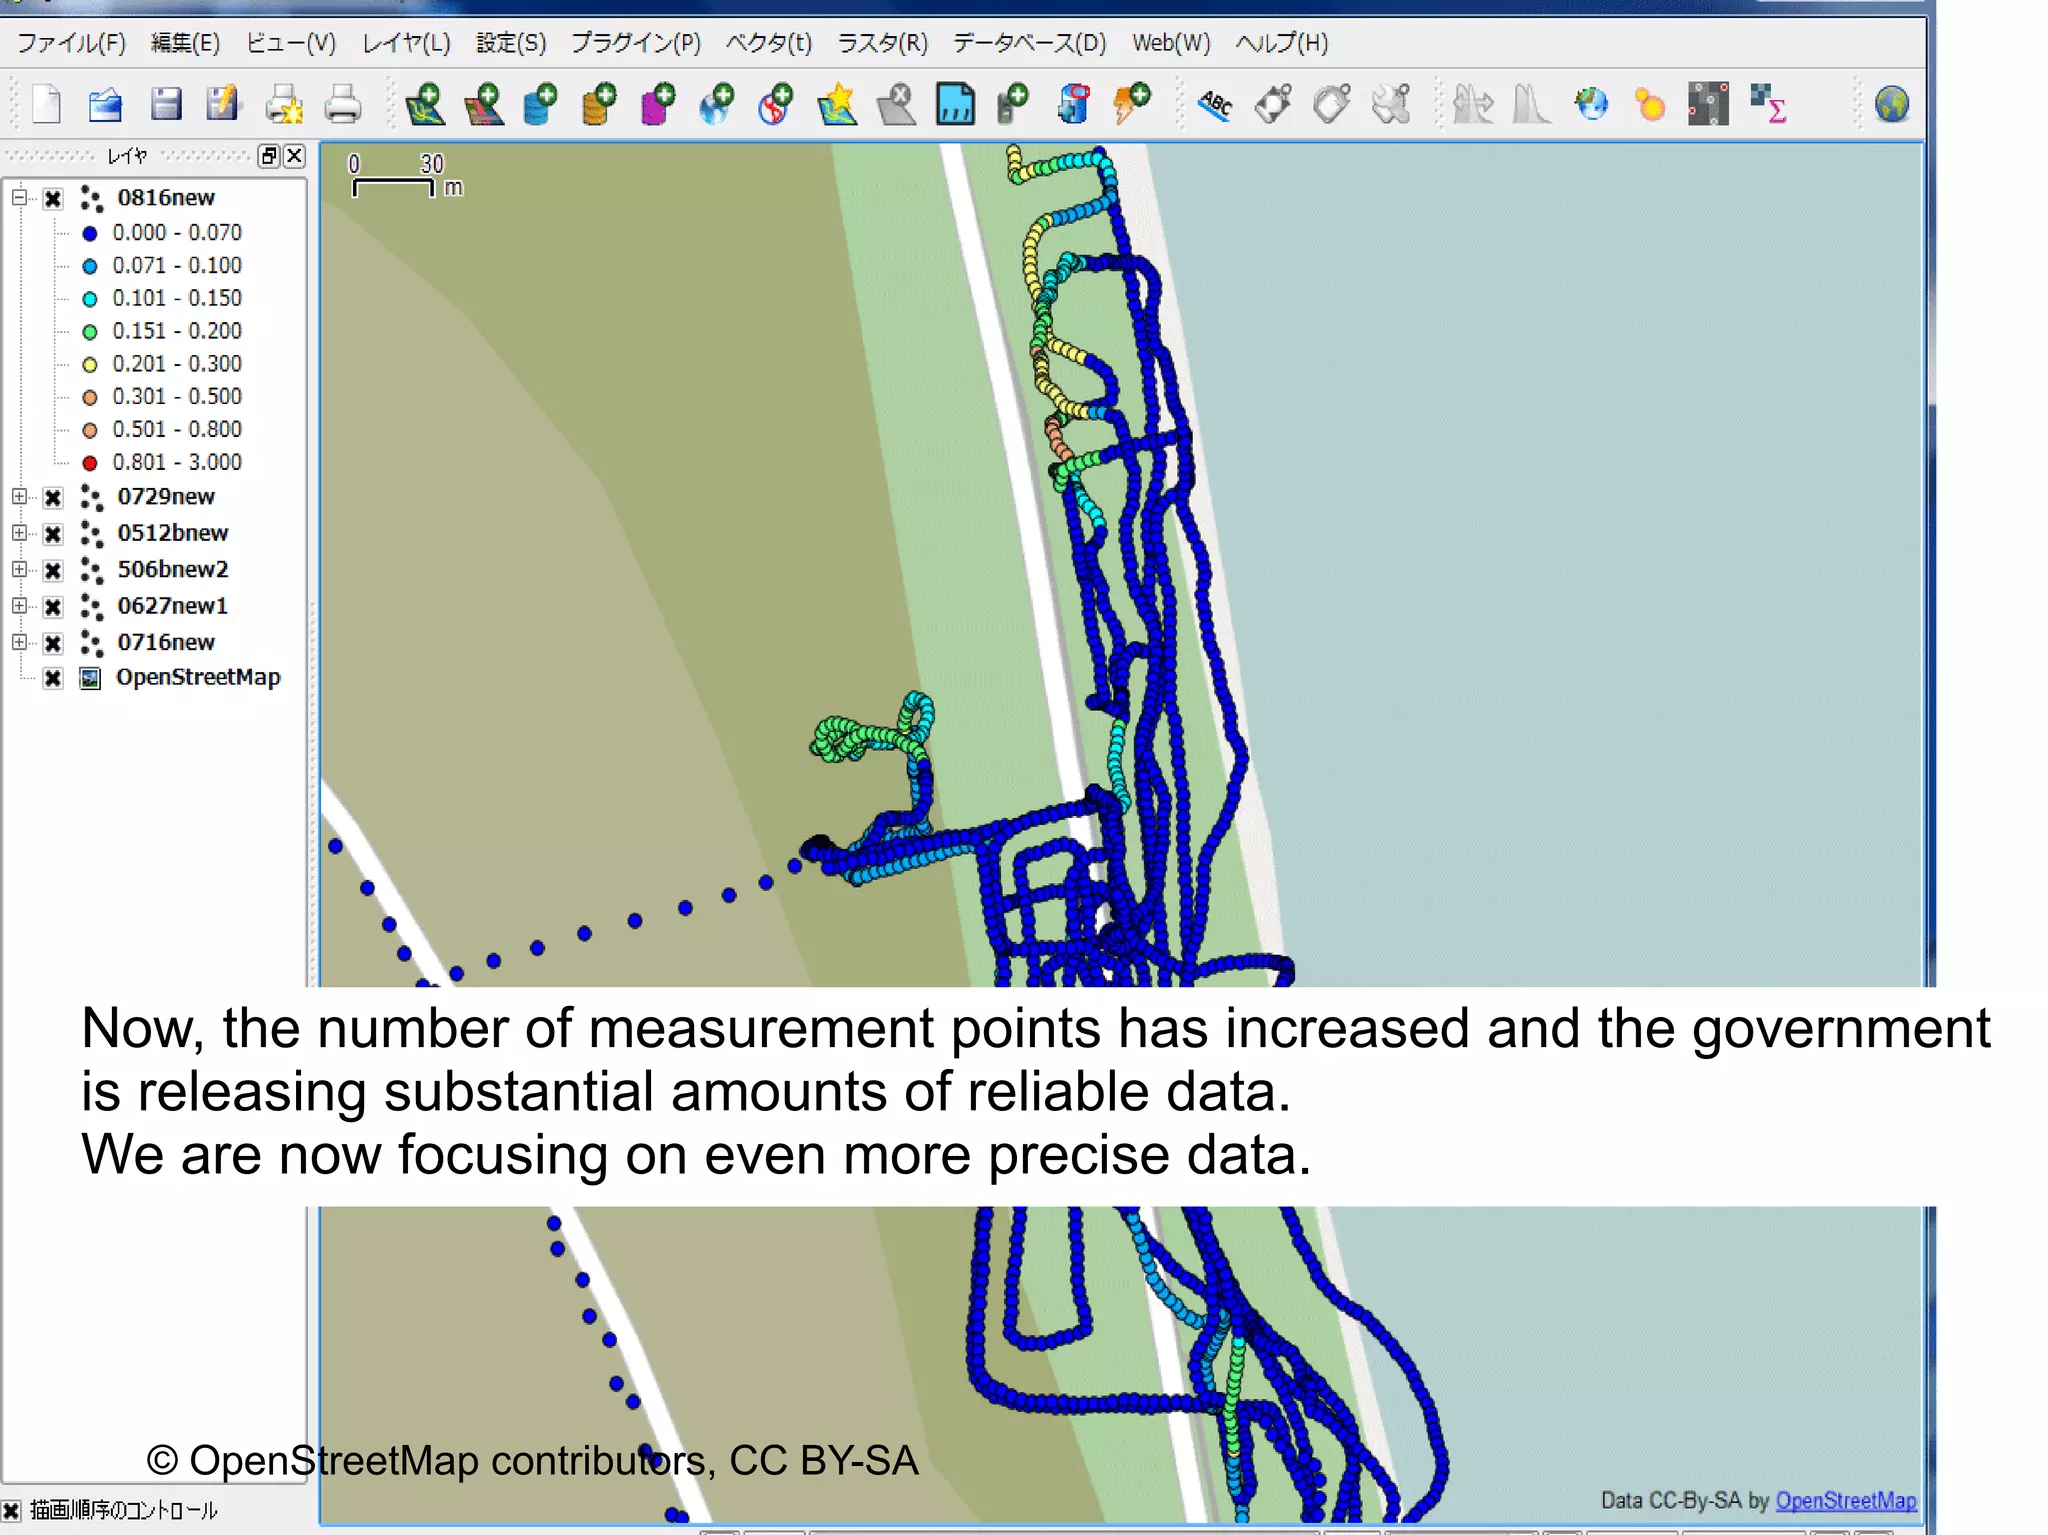
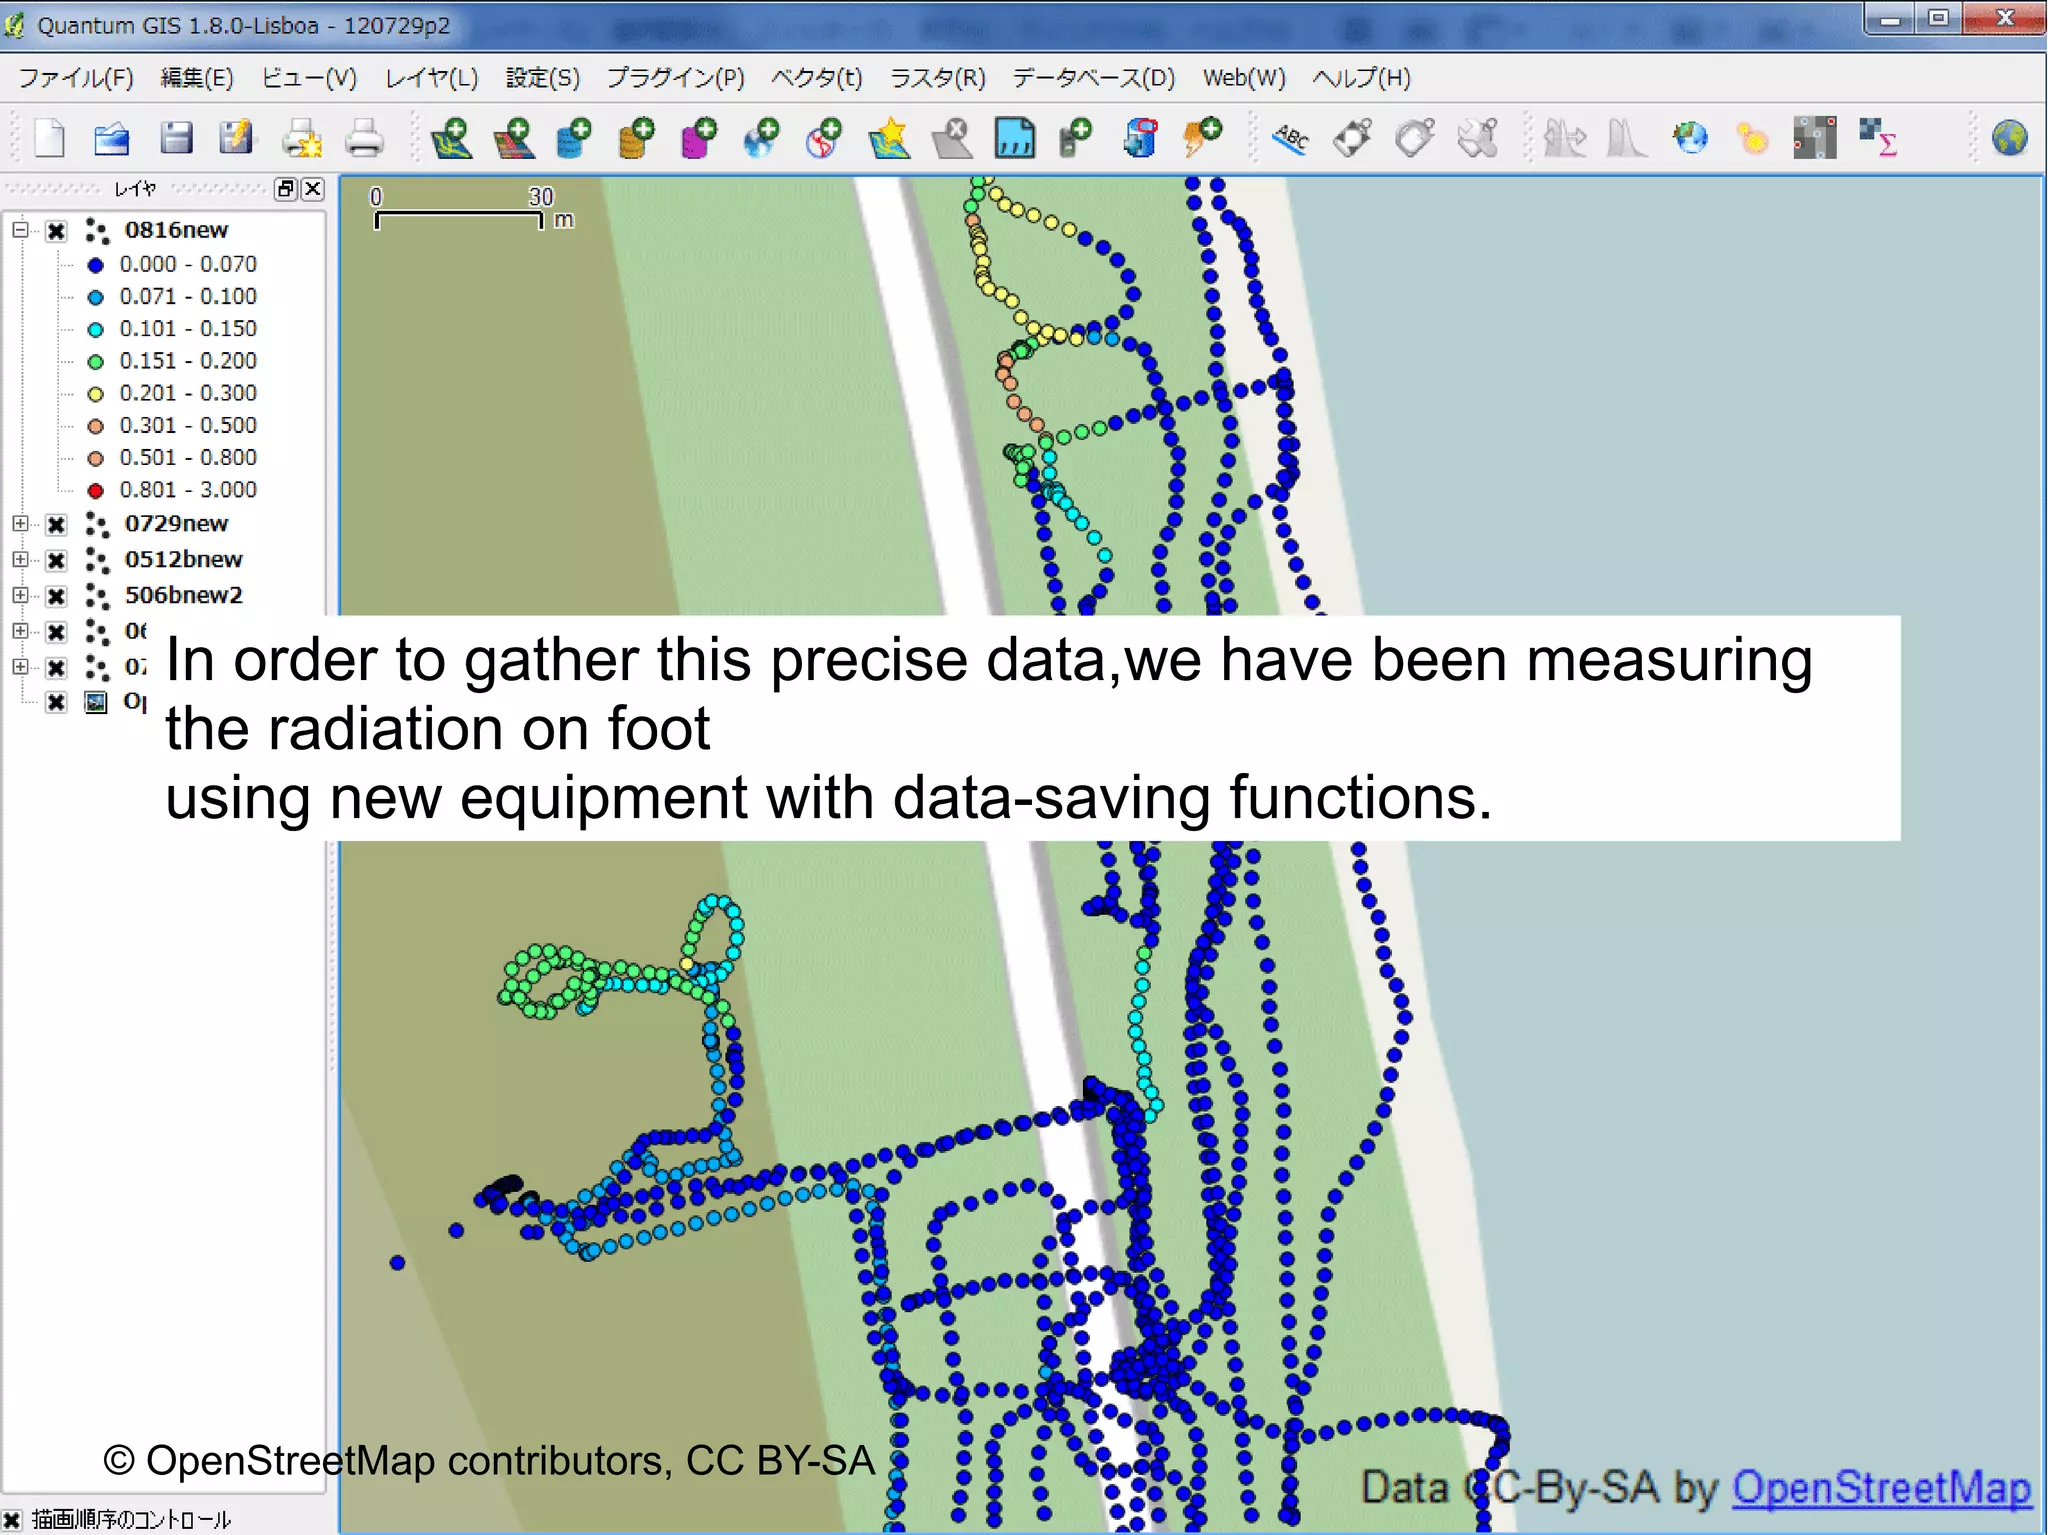
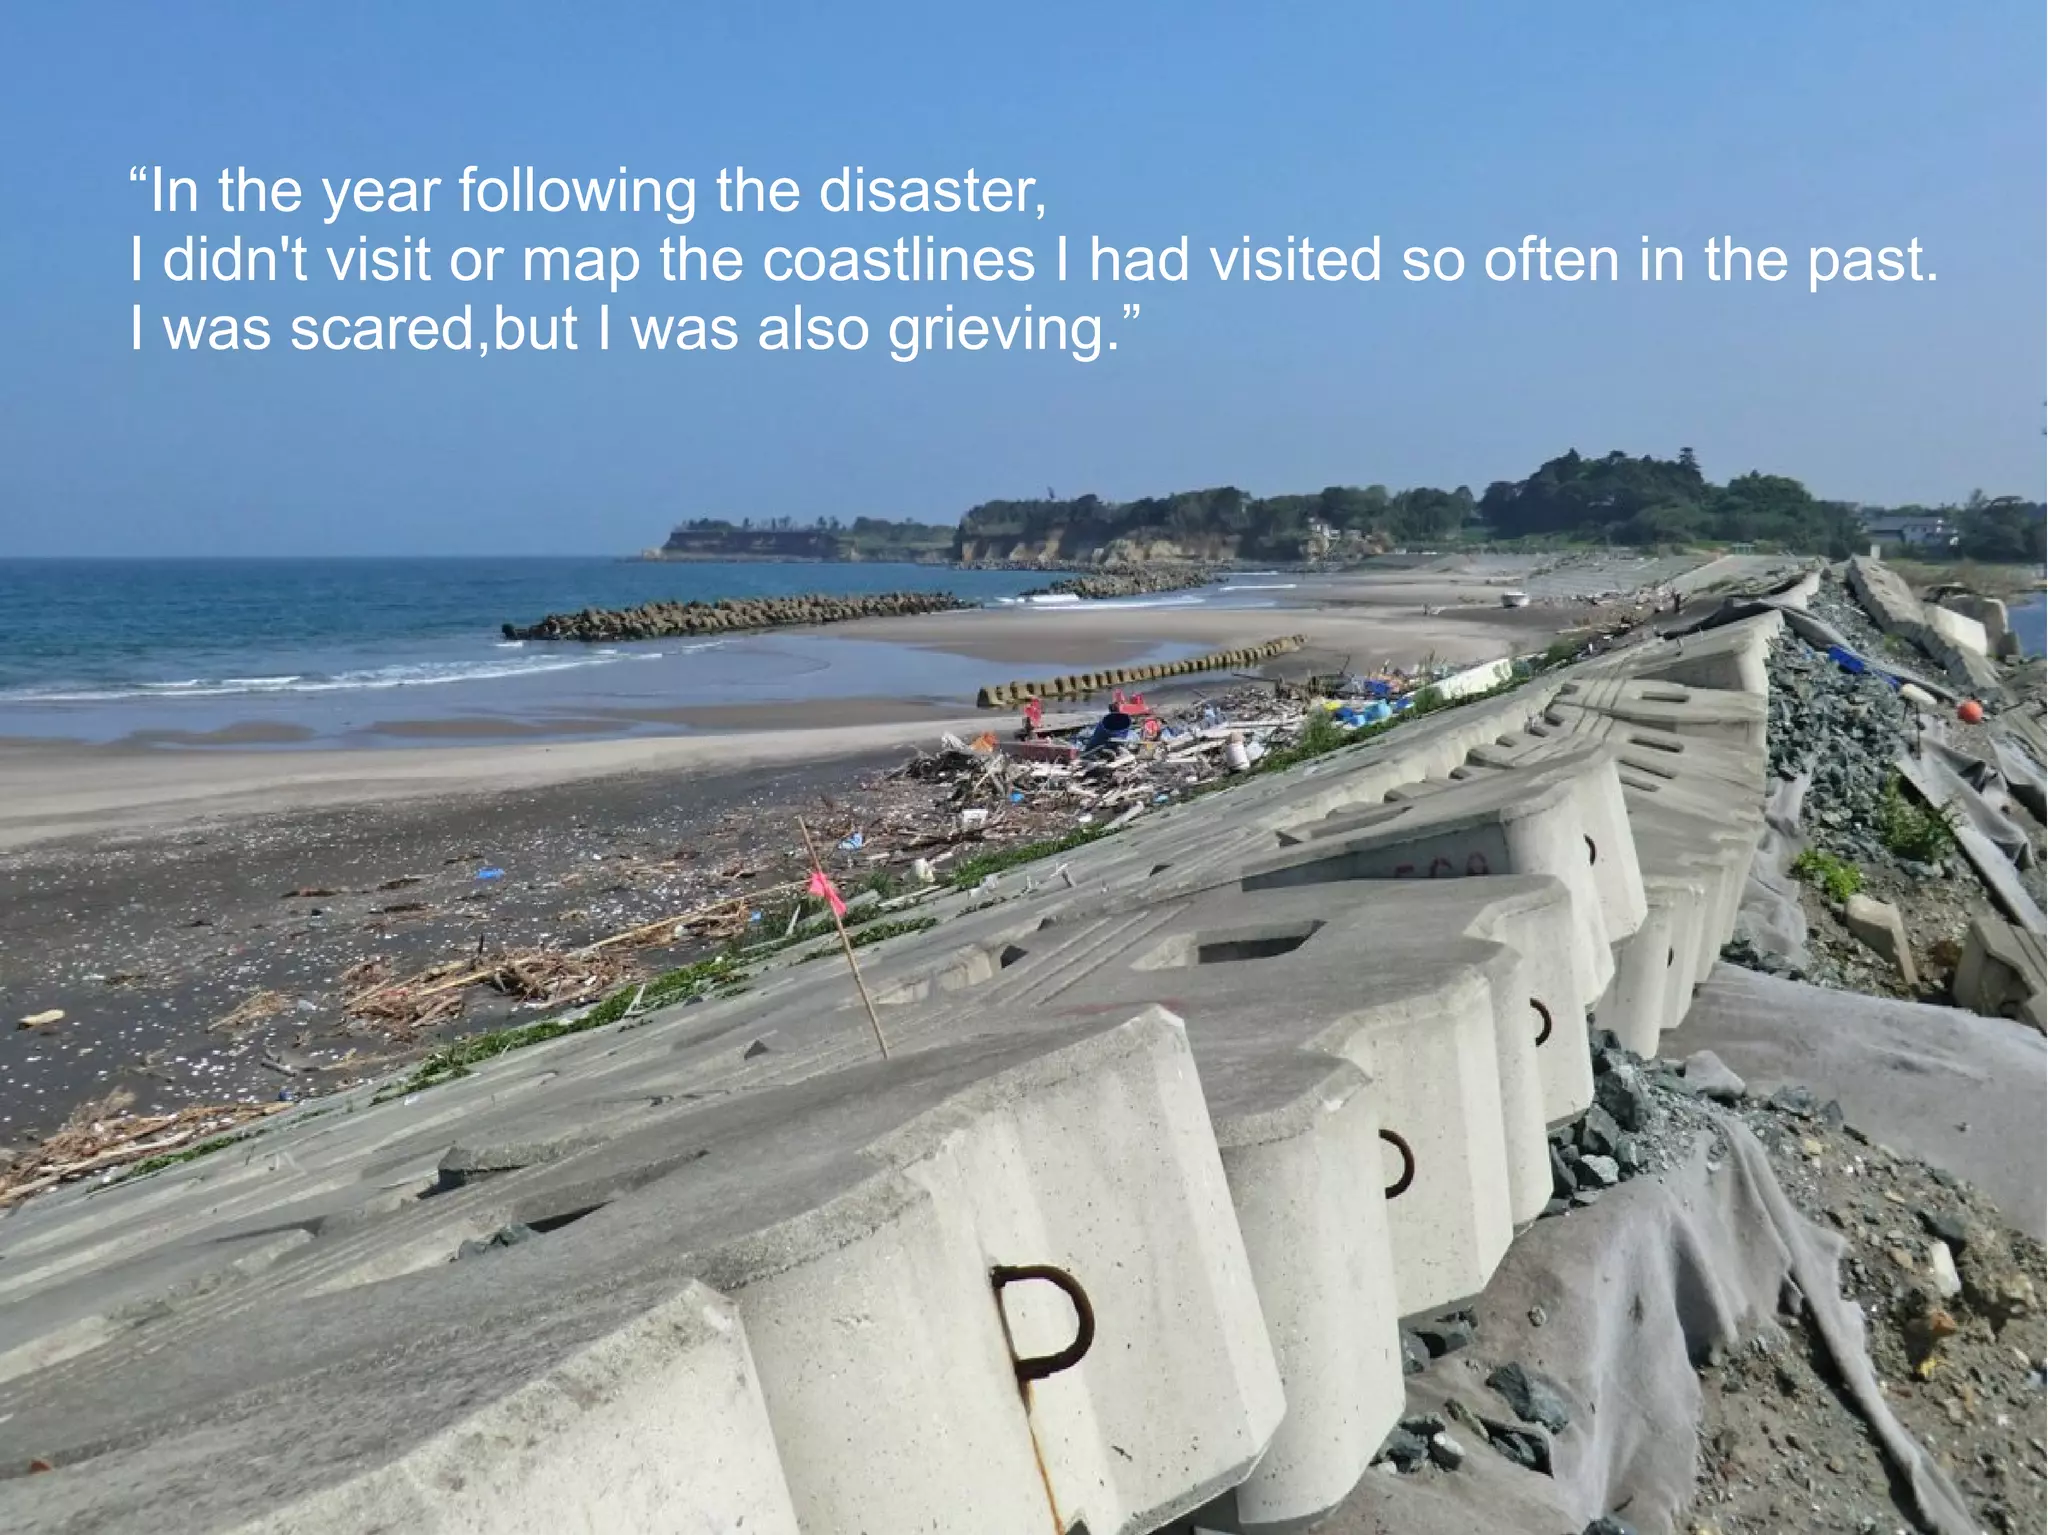
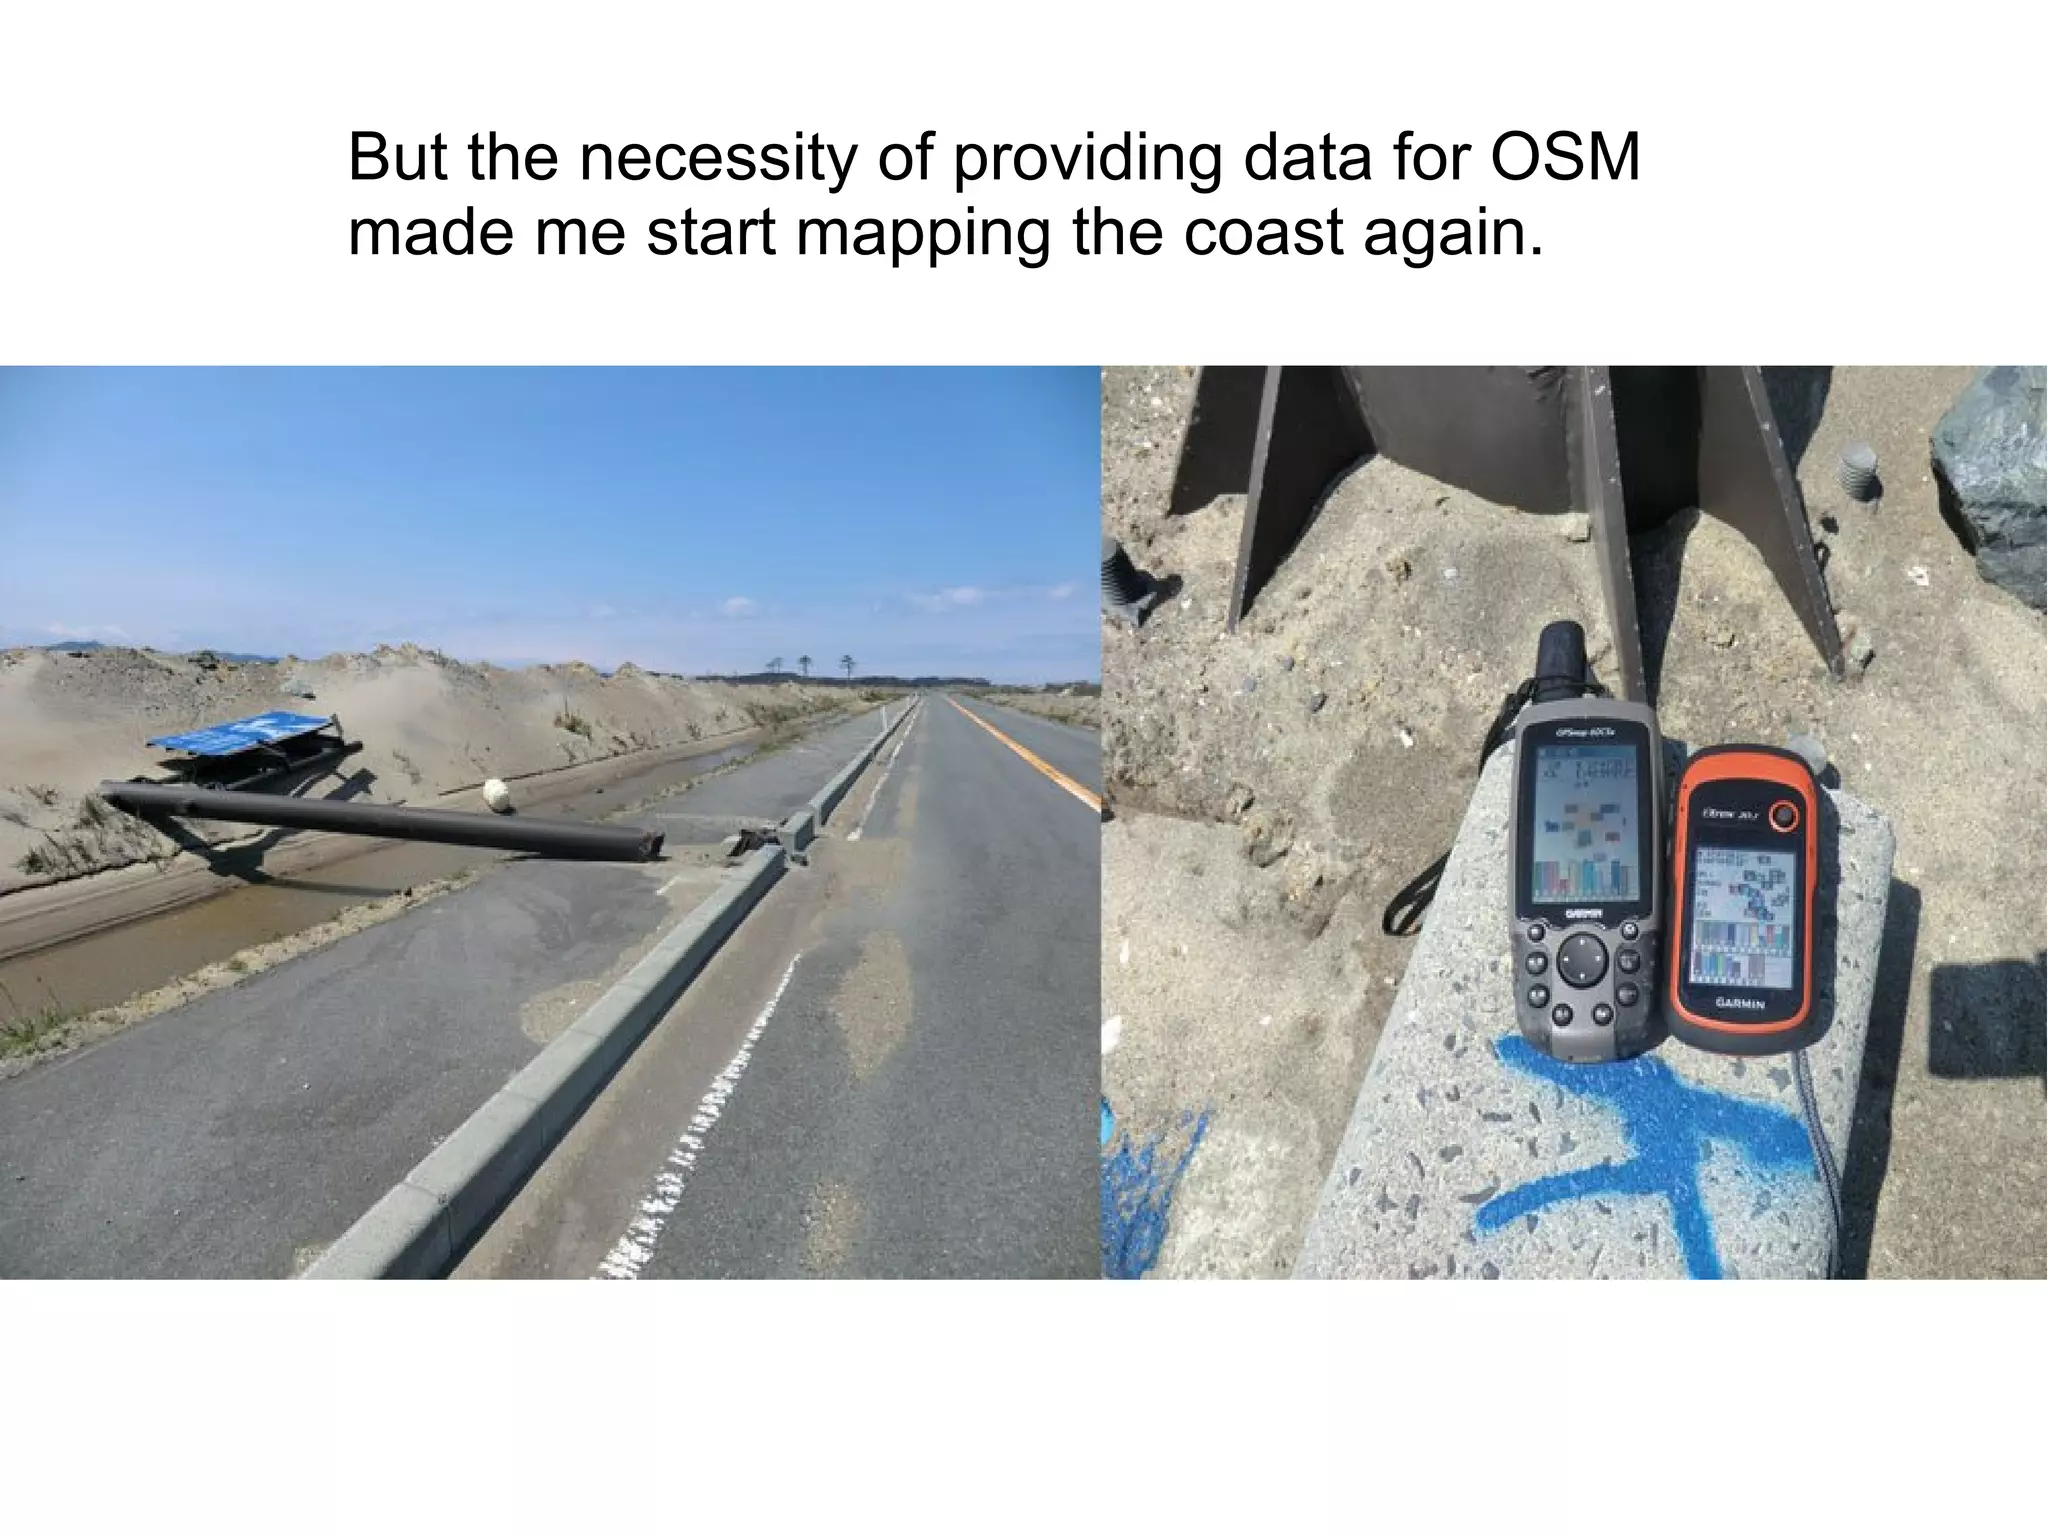
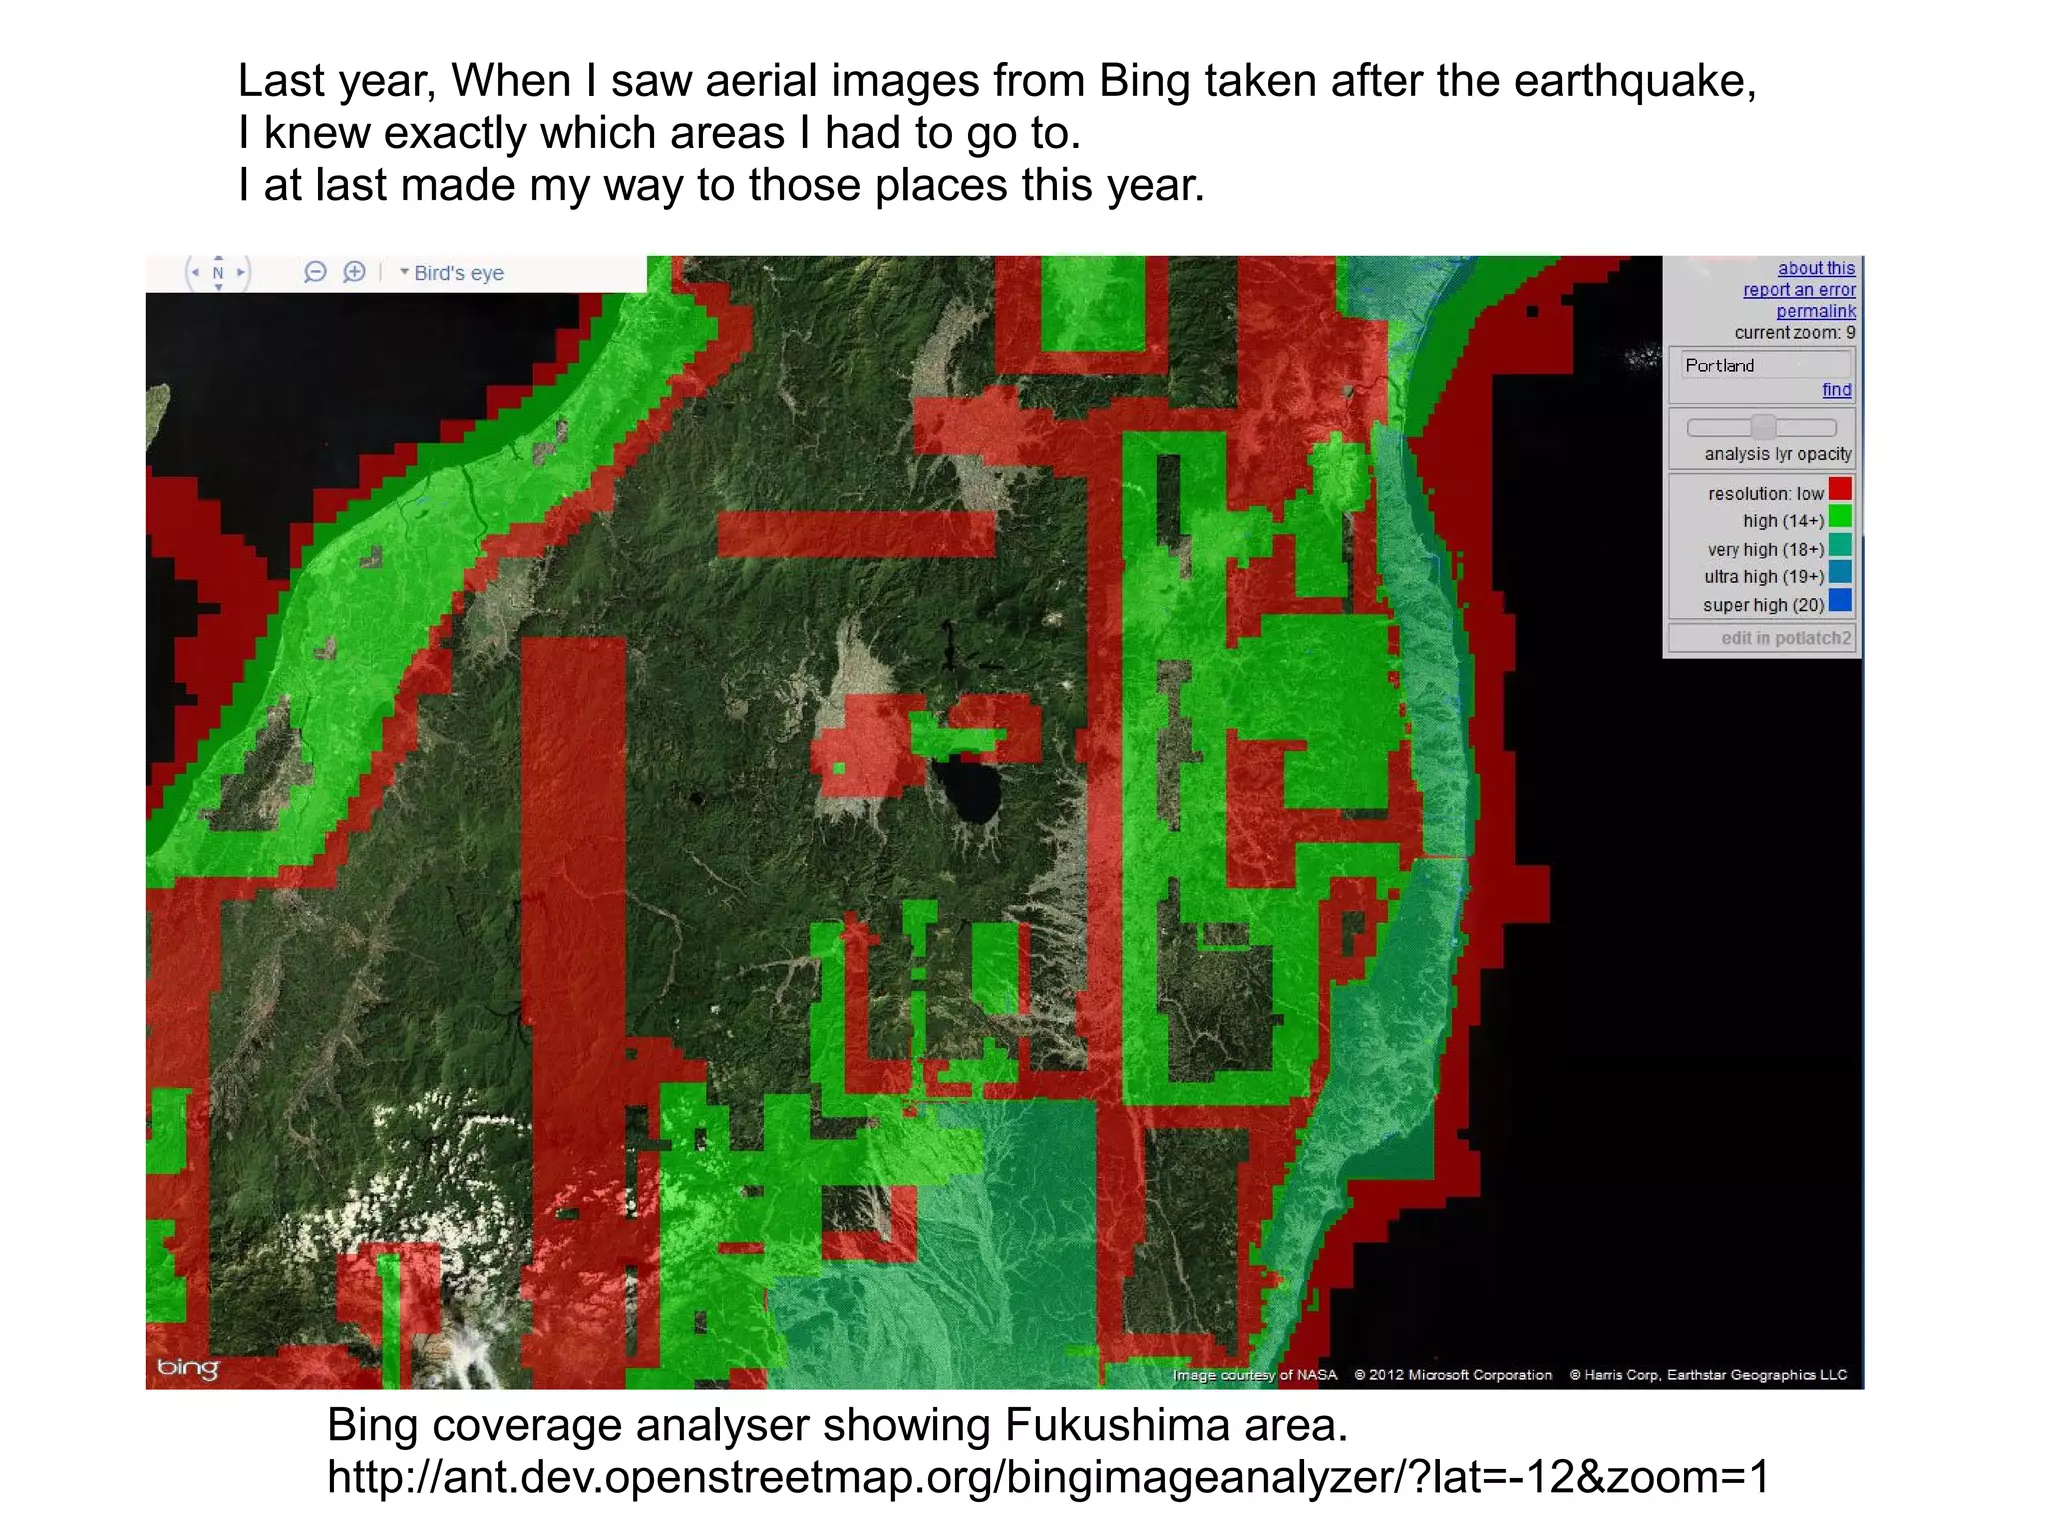
Fukushima mapping
Before and after the disaster


   Ikiya              State of the Map 2012
                       Tokyo,Japan,September 2012
Self-introduction


I'm Ikiya.
I live in Fukushima, Japan.
I map Fukushima and East Japan.
I've mapped Asia, the Middle East, Haiti, Christchurch, and other countris.
Sorry, my English is not so fluent.


 'Where did you contribute to OpenStreetMap? ' http://yosmhm.neis-one.org/?ikiya
Chapter 1


          The Nature of Fukushima
                    and
         Mapping Before the Disaster


Dawn on the beach.    Photo : Before the disaster / Soma city,Fukushima
Japan
    I live in Fukushima city.
    Fukushima is 250kms north of Tokyo.


               Fukushima

             Tokyo

                    © OpenStreetMap contributors, CC BY-SA
Fukushima city


About 2,000,000 people
live in the Fukushima area.


               © OpenStreetMap contributors, CC BY-SA
This is Fukushima City.


Fukushima City is the prefectural capital.
 280,000 people live in Fukushima City.
I love Fukushima's nature and coastlines.


Photo : Before the disaster / Soma city,Fukushima
The morning sun.
The coastline area was inhabited by many people.
Fukushima Prefecture is rich in green and nature.


           Photo : Before the disaster / Soma city,Fukushima
Sunset.
I loved to visit in every season.
These are my GPS Logs in the Fukushima area.


 © OpenStreetMap contributors, CC BY-SA
We map towns in Fukushima.


Photo : Fukushima city
We map highways in Fukushima.


Photo : Before the disaster / Soma city,Fukushima
We map Fukushima coastlines.


Photo : Before the disaster / Soma city,Fukushima
The Fukushima coastline is 130km long.


We mapped the Fukushima coastline
       before the Disaster.
                                    130km


           These are
         mapping GPS logs.
Chapter 2

   Tohoku, Japan
Earthquake, Tsunami
Last March,
   a huge earthquake and tsunami
hit the region,causing major damage.
  A nuclear accident also occurred.


                        Fukushima
These photos were taken from the same spot.


      (Before the disaster)


       (After the disaster)


                       You can see the remains of the yellow center line
                            and the foot path in the bottom picture
These photos were taken from the same spot.


  (Before the disaster)


    (After the disaster)


                           The vast pine forest was washed away in the tsunami.
After the disaster
Japan had a lot of support from around the world.

Thank you very much
       for all your kind support.


 Photo : After the disaster / Iwaki city,Fukushima
A lot of mappers edited the Tohoku, Japan OSM
             after the earthquake.


http://wiki.openstreetmap.org/wiki/2011_Sendai_earthquake_and_tsunami
I am deeply grateful for all the support
that has come from other regions.


                             Tsunami damage area
                              Sendai City, Miyagi
Thank you so much
  for contributing.


I have always been interested in crisis mapping.
However becoming a disaster victim myself
has made me realise that I can only do so much
as “a Mapper”.


 http://www.itoworld.com/static/openstreetmap_tools/osm_mapper.html
I think Tsunamis are not mere waves .
They are “Giant Walls of Pressure”.


Photo : After the disaster / Iwaki city,Fukushima
The tsunami destroyed everything
and the receding wave carried
much of the debris out to sea.


Photo : After the disaster / Iwaki city,Fukushima
This is some of the debris
                           that has been collected.


Photo : After the disaster / Iwaki city,Fukushima
This sea side camping ground was washed away.
This area I spent several years mapping has all
               but disappeared.
   All houses,highways were washed away.
These GPS logs are full of memories and people's lives
                    before the disaster.
I hope they can be used as the region rebuilds in the future.
Chapter 3

Mapping after the disaster
These are mapping GPS logs
      after the disaster.


                                            Fukushima I
                                         Nuclear Power Plant
                                               20km
                                          evacuation zone


© OpenStreetMap contributors, CC BY-SA
In the year following the disaster,
          I didn't visit or map the coastlines I had visited so often in the past.
          I was scared, but I was also grieving.


Photo : After the disaster / Iwaki city,Fukushima
It was not until this year that I could at last
set foot on the now-deserted coast.
Drawing maps brings back memorise of those places.
Movement of the Earth's crust
     in the Earthuake
A survey by GSI(Geospatial Information Authority of Japan)
                           has revealed that land in the Tohoku region moved
                           to the south-east in the earthquake.

                           Ishinomaki City in Miyagi Prefecture moved up to
                           5.3meters.


Geospatial Information Authority of Japan(GSI)
http://www.gsi.go.jp/chibankansi/chikakukansi_tohoku2.html
”平成23年(2011年)東北地方太平洋沖地震に伴う地殻変動について”国土地理院 平成23年3月19日発表
I compared data taken on my handheld GPS
before the earthquake to that taken after the earthquake
      to determine if the earth's crust had moved.
  The GPS model used was the same in both cases.
I compared data two places.


                                         6km-long
                                         Breakwater


                                             Circular stage
                                             on the beach


© OpenStreetMap contributors, CC BY-SA
Comparison at the southern tip of the Breakwater
       4m

                                   May 2012 logs
                                                   Comparison of GPS logs taken
                                                   before and after the earthquake
                                                   show an eastward movement of
                                                   approximately 4m.
                       Sep 2008 logs
'Restroom buildings'


                          'Restroom buildings'


                                                   Logs of taken from
                                                   the restroom buildings
                                                   also appear to show movement.
Comparison at the Circular stage on the beach
3m

                        Comparison of GPS logs taken
                        before and after the earthquake
                        show an eastward movement of
                        approximately 3m.


                   3m
Although comparison of data taken by a commercial GPS
and the handheld GPS showed the data
from the latter to be less accurate,
I realised it was possible to
confirm the movement of the earth's crust
with a handheld GPS under the right circumstances.
Chapter 4


Nuclear Disaster
A nuclear accident followed the earthquake and tsunami.
Many mappers mapped the Fukushima nuclear power plant.
Following the accident citizens were not made aware
             of the distribution of radiation.


     After the accident, measurement and release
   of radiation data by the government was too slow.


Photo : After the disaster / Iwaki city,Fukushima
About one month after the accident
I decided to map the radiation levels in Fukushima
               as a private citizen.


                              Radiation Mapping
First,
I set several waypoints on my GPS
and recorded the levels with a Geiger Counter.
Radiation Level Memos


              Waypoints Number + Radiation Level
Radiation Map
                    Waypoints Number + Radiation Lev


         © OpenStreetMap contributors, CC BY-SA
Next,
I thought that in order to widen the mapping area,
I used a GPS ,Geiger Counter and IC recorder
and mapped with my car. (Voice mapping)
I recorded waypoints and radiation levels by voice.
I recorded...
and recorded...
and recorded.
CSV Data
Last summer
                  I recorded
                  7,000 waypoints
                  over 2,400km.


Waypoints Number + Radiation Level


 © OpenStreetMap contributors, CC BY-SA
Which part of this map draws your attention?


© OpenStreetMap contributors, CC BY-SA
Which part of this map draws your attention?


             Yonezawa City


Many of you would answer “The red area”.
The area that draws my attention is this blue area over Yonezawa.
To my relief, this showed that area within 20km of Fukushima City
was not contaminated in the accident.
The focus of society has been on the hotspots.
However, I think we should focus more on which areas are safe.
© OpenStreetMap contributors, CC BY-SA
Use of OSM in Radiation Level Map


Web mapping sites such as Google and Yahoo
only show detailed maps for the areas in blue.

The red areas signify the evacuation zones                           Fukushima I
(~August,2012), which were of great concern                       Nuclear Power Plant
to citizens.                                                            20km
                                                                   evacuation zone
However, there were almost no detailed map
of these areas.
Even now, these are insufficient detailed maps
of this area.

I believe OpenStreetMap can be used to
effectively create detailed maps for these
red areas.                                       © OpenStreetMap contributors, CC BY-SA
Now, the number of measurement points has increased and the government
is releasing substantial amounts of reliable data.
We are now focusing on even more precise data.


  © OpenStreetMap contributors, CC BY-SA
In order to gather this precise data,we have been measuring
  the radiation on foot
  using new equipment with data-saving functions.


© OpenStreetMap contributors, CC BY-SA
Chapter 5

Thank you for OSM.
“In the year following the disaster,
I didn't visit or map the coastlines I had visited so often in the past.
I was scared,but I was also grieving.”
But the necessity of providing data for OSM
made me start mapping the coast again.
Last year, When I saw aerial images from Bing taken after the earthquake,
I knew exactly which areas I had to go to.
I at last made my way to those places this year.


    Bing coverage analyser showing Fukushima area.
    http://ant.dev.openstreetmap.org/bingimageanalyzer/?lat=-12&zoom=1
From this experience, I realized that
   OSM teaches us many things
    and gives us many things.

        Thank you for OSM.
Thank you !


      State of the Map 2012
      Tokyo,Japan,September 2012

Fukushima mapping Before and after the disaster

  • 1.
    Fukushima mapping Before andafter the disaster Ikiya State of the Map 2012 Tokyo,Japan,September 2012
  • 2.
    Self-introduction I'm Ikiya. I livein Fukushima, Japan. I map Fukushima and East Japan. I've mapped Asia, the Middle East, Haiti, Christchurch, and other countris. Sorry, my English is not so fluent. 'Where did you contribute to OpenStreetMap? ' http://yosmhm.neis-one.org/?ikiya
  • 3.
    Chapter 1 The Nature of Fukushima and Mapping Before the Disaster Dawn on the beach. Photo : Before the disaster / Soma city,Fukushima
  • 4.
    Japan I live in Fukushima city. Fukushima is 250kms north of Tokyo. Fukushima Tokyo © OpenStreetMap contributors, CC BY-SA
  • 5.
    Fukushima city About 2,000,000people live in the Fukushima area. © OpenStreetMap contributors, CC BY-SA
  • 6.
    This is FukushimaCity. Fukushima City is the prefectural capital. 280,000 people live in Fukushima City.
  • 7.
    I love Fukushima'snature and coastlines. Photo : Before the disaster / Soma city,Fukushima
  • 8.
  • 9.
    The coastline areawas inhabited by many people.
  • 10.
    Fukushima Prefecture isrich in green and nature. Photo : Before the disaster / Soma city,Fukushima
  • 11.
  • 12.
    I loved tovisit in every season.
  • 13.
    These are myGPS Logs in the Fukushima area.
  • 14.
    These are myGPS Logs in the Fukushima area. © OpenStreetMap contributors, CC BY-SA
  • 15.
    We map townsin Fukushima. Photo : Fukushima city
  • 16.
    We map highwaysin Fukushima. Photo : Before the disaster / Soma city,Fukushima
  • 17.
    We map Fukushimacoastlines. Photo : Before the disaster / Soma city,Fukushima
  • 18.
    The Fukushima coastlineis 130km long. We mapped the Fukushima coastline before the Disaster. 130km These are mapping GPS logs.
  • 19.
    Chapter 2 Tohoku, Japan Earthquake, Tsunami
  • 20.
    Last March, a huge earthquake and tsunami hit the region,causing major damage. A nuclear accident also occurred. Fukushima
  • 21.
    These photos weretaken from the same spot. (Before the disaster) (After the disaster) You can see the remains of the yellow center line and the foot path in the bottom picture
  • 22.
    These photos weretaken from the same spot. (Before the disaster) (After the disaster) The vast pine forest was washed away in the tsunami.
  • 23.
    After the disaster Japanhad a lot of support from around the world. Thank you very much for all your kind support. Photo : After the disaster / Iwaki city,Fukushima
  • 24.
    A lot ofmappers edited the Tohoku, Japan OSM after the earthquake. http://wiki.openstreetmap.org/wiki/2011_Sendai_earthquake_and_tsunami
  • 25.
    I am deeplygrateful for all the support that has come from other regions. Tsunami damage area Sendai City, Miyagi
  • 26.
    Thank you somuch for contributing. I have always been interested in crisis mapping. However becoming a disaster victim myself has made me realise that I can only do so much as “a Mapper”. http://www.itoworld.com/static/openstreetmap_tools/osm_mapper.html
  • 27.
    I think Tsunamisare not mere waves . They are “Giant Walls of Pressure”. Photo : After the disaster / Iwaki city,Fukushima
  • 28.
    The tsunami destroyedeverything and the receding wave carried much of the debris out to sea. Photo : After the disaster / Iwaki city,Fukushima
  • 29.
    This is someof the debris that has been collected. Photo : After the disaster / Iwaki city,Fukushima
  • 30.
    This sea sidecamping ground was washed away.
  • 31.
    This area Ispent several years mapping has all but disappeared. All houses,highways were washed away.
  • 32.
    These GPS logsare full of memories and people's lives before the disaster. I hope they can be used as the region rebuilds in the future.
  • 33.
  • 34.
    These are mappingGPS logs after the disaster. Fukushima I Nuclear Power Plant 20km evacuation zone © OpenStreetMap contributors, CC BY-SA
  • 35.
    In the yearfollowing the disaster, I didn't visit or map the coastlines I had visited so often in the past. I was scared, but I was also grieving. Photo : After the disaster / Iwaki city,Fukushima
  • 36.
    It was notuntil this year that I could at last set foot on the now-deserted coast. Drawing maps brings back memorise of those places.
  • 37.
    Movement of theEarth's crust in the Earthuake
  • 38.
    A survey byGSI(Geospatial Information Authority of Japan) has revealed that land in the Tohoku region moved to the south-east in the earthquake. Ishinomaki City in Miyagi Prefecture moved up to 5.3meters. Geospatial Information Authority of Japan(GSI) http://www.gsi.go.jp/chibankansi/chikakukansi_tohoku2.html ”平成23年(2011年)東北地方太平洋沖地震に伴う地殻変動について”国土地理院 平成23年3月19日発表
  • 39.
    I compared datataken on my handheld GPS before the earthquake to that taken after the earthquake to determine if the earth's crust had moved. The GPS model used was the same in both cases.
  • 40.
    I compared datatwo places. 6km-long Breakwater Circular stage on the beach © OpenStreetMap contributors, CC BY-SA
  • 41.
    Comparison at thesouthern tip of the Breakwater 4m May 2012 logs Comparison of GPS logs taken before and after the earthquake show an eastward movement of approximately 4m. Sep 2008 logs 'Restroom buildings' 'Restroom buildings' Logs of taken from the restroom buildings also appear to show movement.
  • 42.
    Comparison at theCircular stage on the beach 3m Comparison of GPS logs taken before and after the earthquake show an eastward movement of approximately 3m. 3m
  • 43.
    Although comparison ofdata taken by a commercial GPS and the handheld GPS showed the data from the latter to be less accurate, I realised it was possible to confirm the movement of the earth's crust with a handheld GPS under the right circumstances.
  • 44.
  • 45.
    A nuclear accidentfollowed the earthquake and tsunami. Many mappers mapped the Fukushima nuclear power plant.
  • 46.
    Following the accidentcitizens were not made aware of the distribution of radiation. After the accident, measurement and release of radiation data by the government was too slow. Photo : After the disaster / Iwaki city,Fukushima
  • 47.
    About one monthafter the accident I decided to map the radiation levels in Fukushima as a private citizen. Radiation Mapping
  • 48.
    First, I set severalwaypoints on my GPS and recorded the levels with a Geiger Counter.
  • 49.
    Radiation Level Memos Waypoints Number + Radiation Level
  • 50.
    Radiation Map Waypoints Number + Radiation Lev © OpenStreetMap contributors, CC BY-SA
  • 51.
    Next, I thought thatin order to widen the mapping area, I used a GPS ,Geiger Counter and IC recorder and mapped with my car. (Voice mapping)
  • 52.
    I recorded waypointsand radiation levels by voice.
  • 53.
  • 54.
  • 55.
  • 56.
  • 57.
    Last summer I recorded 7,000 waypoints over 2,400km. Waypoints Number + Radiation Level © OpenStreetMap contributors, CC BY-SA
  • 58.
    Which part ofthis map draws your attention? © OpenStreetMap contributors, CC BY-SA
  • 59.
    Which part ofthis map draws your attention? Yonezawa City Many of you would answer “The red area”. The area that draws my attention is this blue area over Yonezawa. To my relief, this showed that area within 20km of Fukushima City was not contaminated in the accident. The focus of society has been on the hotspots. However, I think we should focus more on which areas are safe.
  • 60.
  • 61.
    Use of OSMin Radiation Level Map Web mapping sites such as Google and Yahoo only show detailed maps for the areas in blue. The red areas signify the evacuation zones Fukushima I (~August,2012), which were of great concern Nuclear Power Plant to citizens. 20km evacuation zone However, there were almost no detailed map of these areas. Even now, these are insufficient detailed maps of this area. I believe OpenStreetMap can be used to effectively create detailed maps for these red areas. © OpenStreetMap contributors, CC BY-SA
  • 62.
    Now, the numberof measurement points has increased and the government is releasing substantial amounts of reliable data. We are now focusing on even more precise data. © OpenStreetMap contributors, CC BY-SA
  • 63.
    In order togather this precise data,we have been measuring the radiation on foot using new equipment with data-saving functions. © OpenStreetMap contributors, CC BY-SA
  • 64.
  • 65.
    “In the yearfollowing the disaster, I didn't visit or map the coastlines I had visited so often in the past. I was scared,but I was also grieving.”
  • 66.
    But the necessityof providing data for OSM made me start mapping the coast again.
  • 67.
    Last year, WhenI saw aerial images from Bing taken after the earthquake, I knew exactly which areas I had to go to. I at last made my way to those places this year. Bing coverage analyser showing Fukushima area. http://ant.dev.openstreetmap.org/bingimageanalyzer/?lat=-12&zoom=1
  • 68.
    From this experience,I realized that OSM teaches us many things and gives us many things. Thank you for OSM.
  • 69.
    Thank you ! State of the Map 2012 Tokyo,Japan,September 2012