finalPresentation
•Download as PPT, PDF•
0 likes•91 views
The document describes the development of a model to predict wildfire risk in California. It uses climatological data like temperature, precipitation, and humidity, as well as land cover data, as inputs to the model. Two models are created, one with equal weighting of all factors and one that weights land cover higher. The results of the second model better match actual 2014 wildfires in northern California but miss fires in southern California, suggesting room for improvement in the model formula. Overall, the model effectively predicts wildfires in western California but inaccuracies remain.
Report
Share
Report
Share
Recommended
Climate-Energy Nexus: Risk, Resiliency, and Recourse - Adam Schlosser
These slides were part of a presentation by MIT's Deputy Director for Science Research, Adam Schlosser, at the Together in Climate Action: Northeastern North American Policy Summit.
You can see more presentations and listen to interviews with the presenters at ClimateX.mit.edu
Climate Summit for the ABC Network
The document profiles Zachary Labe, a climate scientist at Colorado State University who studies Arctic climate change and communicates his research through simple, bold data visualizations. His work focuses on distinguishing climate signals from weather noise, placing current weather events in the context of long-term climate trends. He aims to use diverse voices and real-time climate data to tell stories about climate change impacts and the need for climate resilience and social justice.
Steve's presentation at ICCC 2009(Stephen Mc Intyre)
This document discusses criticisms of claims that the 1990s were the warmest decade and 1998 the warmest year of the millennium based on temperature reconstructions. It notes that minor variations in data versions and proxies can yield opposite results. It also discusses criticisms of the "hockey stick" temperature graph that was featured prominently in IPCC reports and disputes that multiple independent studies all found late 20th century warming, noting many used common proxies. The document questions whether key proxies like bristlecones have been robustly updated and whether simple statistical models apply to complex trees.
Arctic climate change through the lens of data visualization
The document discusses climate change in the Arctic through data visualization. It notes that Arctic temperatures are rising more than 3 times faster than the global average. Sea ice extent is declining at a rate of nearly 0.8 million km2 per decade. Future projections show continued sea ice loss and Arctic warming, which could influence weather patterns in mid-latitudes through impacts on jet streams and storm tracks. Improved understanding of these connections and their dependence on factors like the quasi-biennial oscillation could help constrain predictions. Data visualization is presented as an important tool for communicating climate science.
poster
This document summarizes a student research project that aims to predict climate change in South Texas using data from the CMIP5 climate model. The student analyzed temperature data from the past 50 years and 34 climate models to determine which models best fit observed temperatures. Statistical analysis found the data was normally distributed and showed a significant warming trend over the past 30 years but not the full 50 years. Decision trees identified the best fitting models but the ensemble accuracy was low. Future research will apply additional data mining techniques like random forests to create a more reliable model for predicting regional climate change.
Hurricanes and Global Warming- Dr. Kerry Emanuel
Dr. Kerry Emanuel explains how Global Warming increased the power of hurricanes. Hurricane Katrina is discussed, with the conclusion that Katrina probably would not have had the power to break the New Orleans levees in a pre-Global Warming world. April 2009 webinar presented by the Southern Allicance for Clean Energy (http://www.cleanenergy.org/) and the Gulf Restoration Network (http://healthygulf.org/) SlideCast by John Atkeison of the Alliance for Affordable Energy. There is a very small amount of phone noise.
Fire Poster
This document summarizes the use of ArcMap and FARSITE software to model a 2010 wildfire in Kentucky's Red River Gorge under both historical conditions with rain and a hypothetical scenario without rain. Key inputs to FARSITE included landscape data from LANDFIRE on aspect, elevation, slope, canopy cover and fuel models. Weather data from Kentucky Mesonet was also used. The historical simulation showed fire stagnation during a rain event, while the no-rain scenario resulted in faster fire spread over a larger 2.12 square mile area compared to 0.62 square miles with rain. While the model has limitations, it demonstrates that larger fires are possible in the future if hotter and drier conditions occur in the Daniel Bo
Communicating Arctic climate change through data-driven stories
Guest lecture for “Applications in Climate & Society” at Columbia University in New York City, NY (remote presentation)
Follow the steps of a meteorologist
This document outlines the steps a meteorologist takes to analyze weather data and make forecasts. It discusses collecting data on temperature, pressure, and solar radiation from weather stations. The document then describes performing statistical analysis on this data, including calculating averages, dispersion, and the correlation coefficient between parameters. Finally, it mentions discussing conclusions with classmates after processing and analyzing the meteorological measurements.
Observations and climate model projections of Arctic climate change
The document summarizes observations of Arctic climate change and projections from climate models. It finds that the Arctic is warming twice as fast as the global average due to a process known as polar amplification. Satellite data shows sea ice extent and thickness have sharply declined in recent decades. Climate models project further sea ice loss and amplified warming in the Arctic under high emissions scenarios. This could impact weather patterns in mid-latitudes through changes to jet streams and storm tracks. Improved observations and modeling are needed to reduce uncertainty about future impacts.
Clim-final
This document discusses using maximum likelihood estimation to fit a generalized extreme value distribution to annual maximum precipitation data from Burke Garden, VA for two time periods. The results show similar location, scale, and shape parameter estimates for both periods, indicating no significant change in the distribution of extreme precipitation events over time.
Meteorologist
1) A meteorologist studies factors that influence weather conditions such as temperature, atmospheric pressure, and solar radiation. They record data from weather stations to analyze weather patterns.
2) The document discusses analyzing temperature, pressure, and solar radiation data from the last 5 years to identify patterns between variables and compare winter and summer seasons.
3) Students will create scatter plots of the relationships between variables and calculate correlation coefficients to determine how strongly the variables are related. They will then discuss their conclusions with classmates.
Integrating Climate Data Into Forecasting Hydrologic Inflow - Laura Blaylock ...
This document discusses integrating climate data into water supply forecasting. It notes the uncertainty in water planning due to climate variation, population growth, and limited hydrologic records. It then describes how the Tarrant Regional Water District collaborates with Hydros Consulting to use NASA climate reanalysis data from MERRA-2 to develop predictors correlated to climate indices like the Arctic Oscillation, North Atlantic Oscillation, and El Niño Southern Oscillation. These predictors are used to generate probability distributions of future climate states and simulate 100 hydrologic traces in RiverWare to forecast reservoir elevations and inform operations planning.
CLIM Undergraduate Workshop: Applications in Climate Context - Michael Wehner...
CLIM Undergraduate Workshop: Applications in Climate Context - Michael Wehner...The Statistical and Applied Mathematical Sciences Institute
Climate statisticians analyze observational climate data and model simulations to detect trends, attribute causes, and quantify uncertainties. They use statistical methods like linear regression to attribute observed warming to human and natural factors. They also use extreme value theory to describe rare weather events and project how these extremes may change with continued warming. A key task is quantifying various sources of uncertainty in climate projections, like different model sensitivities and emissions scenarios.Capstone Poster Design 4-23
The document summarizes a research project investigating the possible relationship between Lake Michigan ice cover in winter and stronger storms in spring. The researchers selected years with high and low ice coverage to analyze winter lake temperatures and spring storm reports. They found that years with more ice had colder lake temperatures and earlier/shorter severe storm seasons than years with less ice. However, the total number of storms was not significantly different between high and low ice years. The results suggest ice cover shifts the timing but not the overall frequency of spring storms near Lake Michigan.
CLIM Undergraduate Workshop: How was this Made?: Making Dirty Data into Somet...
CLIM Undergraduate Workshop: How was this Made?: Making Dirty Data into Somet...The Statistical and Applied Mathematical Sciences Institute
This document describes how rainfall estimates are created from raw radar data at the National Centers for Environmental Information (NCEI). It explains that multiple radars are combined and merged to get nationwide coverage with 2 minute resolution on a standardized grid. Raw radar returns are cleaned of contamination from birds and other sources. The vertical radar scans are integrated into a single rainfall estimate. The final product provides a consistent, high quality rainfall estimate compared to the original radar data which had poorer spatial and temporal resolution and quality issues.The Willowbrook Project
The Willowbrook Project analyzed tree ring widths from ring porous tree species in Willowbrook Park to determine their sensitivities to temperature, precipitation, and drought severity over time. Tree ring measurements were compared to local climate data from 1895 to the present. Statistical analysis revealed that tree growth increased in cooler, wetter conditions and was negatively correlated with drought severity in previous years. The project concluded that the trees are sensitive to temperature, precipitation, and drought, with optimal growth occurring in cooler, wetter conditions.
Presentation of Four Centennial-long Global Gridded Datasets of the Standardi...
Presentation of Four Centennial-long Global Gridded Datasets of the Standardi...Agriculture Journal IJOEAR
Abstract— In this article four global gridded datasets of the Standardized Precipitation Index (SPI) are presented. They are computed from four different data sources: UDEL/GEOG/CCR v3.02, GPCC/ v7.0, NOAA-CIRES 20CR v2c and ECMWF ERA-20C each covering more than a century-long period. The SPI is calculated for the most frequently used time windows of 1, 3, 6, and 12 months. UDEL/GEOG/CCR v3.02 and GPCC/ v7.0 are used in the highest native resolution of 0.5×0.5° whilst NOAA-CIRES 20CR v2c and ECMWF ERA-20C are interpolated at 1.5×1.5° and 0.5×0.5° correspondingly. In contrast to some other indices, for example the popular Palmer Drought Severity Index (PDSI), SPI has significant advantages such as simplicity, suitability on variable time scales and robustness rooted in a solid theoretical development. SPI has been selected by the World Meteorological Organization (WMO) as a key indicator for monitoring drought ('Lincoln declaration'). As a result, drought monitoring centres worldwide are effectively exploiting this index and the National Meteorological and Hydrological Services (NMHSs) are encouraged to use it for monitoring meteorological droughts. These facts and the strong conviction of the authors that the free exchange of data and software services are а basis of effective scientific collaboration, are the main motivators to provide these datasets free of charge at ftp://xeo.cfd.meteo.bg/SPI/. The paper briefly presents some possible applications of the SPI data, revealing its suitability for various objective long-term drought studies at any geographical location.Lammi2011
This document discusses modeling species distributions based on interactions between climate and habitat. It summarizes a study that used distribution data from 12 habitat types and 3 climate variables to model how two butterfly species' habitat use changes with climate. The study found that adding coniferous forest reduced one species' presence in some areas but improved it in others. For another species, adding grassland habitat improved its presence while adding bare ground reduced it. The study also showed how this species' distribution changed with increasing growing degree days. It concludes that improving marginal habitat or weather conditions could help species at their range margins.
Improving scientific graphics of climate (change) data
Creating visuals of data is a critical part of our jobs as scientists. We use figures for journal publications, presentations, posters, and science communication. This week we'll discuss a framework for making better figures, particularly in the climate sciences. I will also give examples of what not to do, and how we can improve these figures moving forward. e
flooding-fore-mapping
The document discusses a proof of concept project completed by Pixalytics Ltd in association with the Environment Agency to improve operational flood mapping using Sentinel-1 satellite data. It summarizes a presentation given at the ESA Living Planets Symposium on an automatic SAR-based flood mapping algorithm. The project aims to develop their own flood mapping product later this year, though recent forecasts of potential flooding in August may require speeding up development.
Optimization and Statistical Learning in Geophysical Applications
The sea surface temperature (SST) anomalies are believed to be the most important factor of the forced atmospheric circulation, which causes temperature anomalies (i.e., anomalously warm/cold winter). We present two independent methods for predicting temperature over 2 meters(T2M) from SST. The first method uses a statistical learning algorithm based on maximum correlation analysis; the second method relies on algorithmic differentiation of the climate model: estimation of T2M sensitivity to SST.
NOAA and NASA Launch New Polar Satellite for Next-Gen Weather Forecasting
The National Oceanic and Atmospheric Administration (NOAA) will transform the way we observe the earth’s climate and weather events following the launch of the Joint Polar Satellite System (JPSS-1). Launched by NASA for NOAA’s National Weather Service, the new satellite system will provide meteorologists and climate change researchers with more accurate weather predictions and a variety of high-definition observations of Earth.
3.3 Climate data and projections
This document summarizes a presentation on climate data and projections focusing on limiting global warming to less than 2 degrees Celsius. It discusses the work of GERICS (the Climate Service Center Germany) in developing solutions for regional climate modeling, impacts analysis, and climate adaptation toolkits. Key points covered include:
- GERICS' interdisciplinary approach to regional climate modeling, impacts assessment, and stakeholder engagement.
- The development of adaptation toolkits for cities, companies, and other sectors to facilitate climate risk assessment and planning.
- An overview of the presentation, covering topics like climate modeling techniques, accessing climate projections data, and visualizing and analyzing climate information.
Week3pres sample
This document provides instructions for a 3rd grade solar system project, requiring students to research one planet and fill out a chart with its name, distance from the sun, number of moons, average temperature, length of year, size, atmosphere, and gravity. It lists the information needed and directs students to a website to research their assigned planet and record the data in the provided chart.
Math in the News: 5/2/11
In this issue of Math in the News we look at the wildfires in Texas. Why are they so prevalent this year? How can mathematical models help in predicting the path of a fire?
Decadal warming slowdown predictions by an artificial neural network
1. An artificial neural network was developed to predict slowdowns in the rate of decadal global warming by analyzing patterns in ocean heat content anomalies.
2. The neural network found that transitions in the phase of the Interdecadal Pacific Oscillation often preceded warming slowdowns in climate model simulations.
3. Using explainable AI techniques, researchers determined the neural network was leveraging tropical patterns of ocean heat content to make its predictions of when decadal warming rates might slowdown.
The Pan-Arctic Impacts of Thinning Sea Ice
The Arctic is rapidly changing. However, long-term observations of trends in Arctic sea-ice thickness are still quite limited. In this presentation, Zachary will discuss the different methods (satellite instruments and climate model simulations) of observing sea-ice thickness in order to understand changes in the recent Arctic amplification era. He will also highlight the far-reaching environmental and societal impacts from a thinning Arctic sea-ice cover.
Modeling Count-based Raster Data with ArcGIS and R
This presentation outlines the conceptual framework for building regression models of event counts where the unit of analysis is small. It explains how ArcGIS for Desktop can be used to build raster data sets that are modeled as generalized linear models within the open source R package.
SAS Data Mining - Crime Modeling
This document summarizes a crime analysis project conducted by a university team. The team analyzed multiple data sets to build models predicting crime rates based on factors like population, weather, daylight hours, and economic indicators. They created binary, numeric, and crime ratio models and found the crime ratio model was most statistically significant. The team's analyses found crime rates generally increased with daylight savings time and increased slightly with higher temperatures. Their best model could predict monthly crime totals by city for most crime types except rare crimes like homicide and sexual assault.
More Related Content
What's hot
Follow the steps of a meteorologist
This document outlines the steps a meteorologist takes to analyze weather data and make forecasts. It discusses collecting data on temperature, pressure, and solar radiation from weather stations. The document then describes performing statistical analysis on this data, including calculating averages, dispersion, and the correlation coefficient between parameters. Finally, it mentions discussing conclusions with classmates after processing and analyzing the meteorological measurements.
Observations and climate model projections of Arctic climate change
The document summarizes observations of Arctic climate change and projections from climate models. It finds that the Arctic is warming twice as fast as the global average due to a process known as polar amplification. Satellite data shows sea ice extent and thickness have sharply declined in recent decades. Climate models project further sea ice loss and amplified warming in the Arctic under high emissions scenarios. This could impact weather patterns in mid-latitudes through changes to jet streams and storm tracks. Improved observations and modeling are needed to reduce uncertainty about future impacts.
Clim-final
This document discusses using maximum likelihood estimation to fit a generalized extreme value distribution to annual maximum precipitation data from Burke Garden, VA for two time periods. The results show similar location, scale, and shape parameter estimates for both periods, indicating no significant change in the distribution of extreme precipitation events over time.
Meteorologist
1) A meteorologist studies factors that influence weather conditions such as temperature, atmospheric pressure, and solar radiation. They record data from weather stations to analyze weather patterns.
2) The document discusses analyzing temperature, pressure, and solar radiation data from the last 5 years to identify patterns between variables and compare winter and summer seasons.
3) Students will create scatter plots of the relationships between variables and calculate correlation coefficients to determine how strongly the variables are related. They will then discuss their conclusions with classmates.
Integrating Climate Data Into Forecasting Hydrologic Inflow - Laura Blaylock ...
This document discusses integrating climate data into water supply forecasting. It notes the uncertainty in water planning due to climate variation, population growth, and limited hydrologic records. It then describes how the Tarrant Regional Water District collaborates with Hydros Consulting to use NASA climate reanalysis data from MERRA-2 to develop predictors correlated to climate indices like the Arctic Oscillation, North Atlantic Oscillation, and El Niño Southern Oscillation. These predictors are used to generate probability distributions of future climate states and simulate 100 hydrologic traces in RiverWare to forecast reservoir elevations and inform operations planning.
CLIM Undergraduate Workshop: Applications in Climate Context - Michael Wehner...
CLIM Undergraduate Workshop: Applications in Climate Context - Michael Wehner...The Statistical and Applied Mathematical Sciences Institute
Climate statisticians analyze observational climate data and model simulations to detect trends, attribute causes, and quantify uncertainties. They use statistical methods like linear regression to attribute observed warming to human and natural factors. They also use extreme value theory to describe rare weather events and project how these extremes may change with continued warming. A key task is quantifying various sources of uncertainty in climate projections, like different model sensitivities and emissions scenarios.Capstone Poster Design 4-23
The document summarizes a research project investigating the possible relationship between Lake Michigan ice cover in winter and stronger storms in spring. The researchers selected years with high and low ice coverage to analyze winter lake temperatures and spring storm reports. They found that years with more ice had colder lake temperatures and earlier/shorter severe storm seasons than years with less ice. However, the total number of storms was not significantly different between high and low ice years. The results suggest ice cover shifts the timing but not the overall frequency of spring storms near Lake Michigan.
CLIM Undergraduate Workshop: How was this Made?: Making Dirty Data into Somet...
CLIM Undergraduate Workshop: How was this Made?: Making Dirty Data into Somet...The Statistical and Applied Mathematical Sciences Institute
This document describes how rainfall estimates are created from raw radar data at the National Centers for Environmental Information (NCEI). It explains that multiple radars are combined and merged to get nationwide coverage with 2 minute resolution on a standardized grid. Raw radar returns are cleaned of contamination from birds and other sources. The vertical radar scans are integrated into a single rainfall estimate. The final product provides a consistent, high quality rainfall estimate compared to the original radar data which had poorer spatial and temporal resolution and quality issues.The Willowbrook Project
The Willowbrook Project analyzed tree ring widths from ring porous tree species in Willowbrook Park to determine their sensitivities to temperature, precipitation, and drought severity over time. Tree ring measurements were compared to local climate data from 1895 to the present. Statistical analysis revealed that tree growth increased in cooler, wetter conditions and was negatively correlated with drought severity in previous years. The project concluded that the trees are sensitive to temperature, precipitation, and drought, with optimal growth occurring in cooler, wetter conditions.
Presentation of Four Centennial-long Global Gridded Datasets of the Standardi...
Presentation of Four Centennial-long Global Gridded Datasets of the Standardi...Agriculture Journal IJOEAR
Abstract— In this article four global gridded datasets of the Standardized Precipitation Index (SPI) are presented. They are computed from four different data sources: UDEL/GEOG/CCR v3.02, GPCC/ v7.0, NOAA-CIRES 20CR v2c and ECMWF ERA-20C each covering more than a century-long period. The SPI is calculated for the most frequently used time windows of 1, 3, 6, and 12 months. UDEL/GEOG/CCR v3.02 and GPCC/ v7.0 are used in the highest native resolution of 0.5×0.5° whilst NOAA-CIRES 20CR v2c and ECMWF ERA-20C are interpolated at 1.5×1.5° and 0.5×0.5° correspondingly. In contrast to some other indices, for example the popular Palmer Drought Severity Index (PDSI), SPI has significant advantages such as simplicity, suitability on variable time scales and robustness rooted in a solid theoretical development. SPI has been selected by the World Meteorological Organization (WMO) as a key indicator for monitoring drought ('Lincoln declaration'). As a result, drought monitoring centres worldwide are effectively exploiting this index and the National Meteorological and Hydrological Services (NMHSs) are encouraged to use it for monitoring meteorological droughts. These facts and the strong conviction of the authors that the free exchange of data and software services are а basis of effective scientific collaboration, are the main motivators to provide these datasets free of charge at ftp://xeo.cfd.meteo.bg/SPI/. The paper briefly presents some possible applications of the SPI data, revealing its suitability for various objective long-term drought studies at any geographical location.Lammi2011
This document discusses modeling species distributions based on interactions between climate and habitat. It summarizes a study that used distribution data from 12 habitat types and 3 climate variables to model how two butterfly species' habitat use changes with climate. The study found that adding coniferous forest reduced one species' presence in some areas but improved it in others. For another species, adding grassland habitat improved its presence while adding bare ground reduced it. The study also showed how this species' distribution changed with increasing growing degree days. It concludes that improving marginal habitat or weather conditions could help species at their range margins.
Improving scientific graphics of climate (change) data
Creating visuals of data is a critical part of our jobs as scientists. We use figures for journal publications, presentations, posters, and science communication. This week we'll discuss a framework for making better figures, particularly in the climate sciences. I will also give examples of what not to do, and how we can improve these figures moving forward. e
flooding-fore-mapping
The document discusses a proof of concept project completed by Pixalytics Ltd in association with the Environment Agency to improve operational flood mapping using Sentinel-1 satellite data. It summarizes a presentation given at the ESA Living Planets Symposium on an automatic SAR-based flood mapping algorithm. The project aims to develop their own flood mapping product later this year, though recent forecasts of potential flooding in August may require speeding up development.
Optimization and Statistical Learning in Geophysical Applications
The sea surface temperature (SST) anomalies are believed to be the most important factor of the forced atmospheric circulation, which causes temperature anomalies (i.e., anomalously warm/cold winter). We present two independent methods for predicting temperature over 2 meters(T2M) from SST. The first method uses a statistical learning algorithm based on maximum correlation analysis; the second method relies on algorithmic differentiation of the climate model: estimation of T2M sensitivity to SST.
NOAA and NASA Launch New Polar Satellite for Next-Gen Weather Forecasting
The National Oceanic and Atmospheric Administration (NOAA) will transform the way we observe the earth’s climate and weather events following the launch of the Joint Polar Satellite System (JPSS-1). Launched by NASA for NOAA’s National Weather Service, the new satellite system will provide meteorologists and climate change researchers with more accurate weather predictions and a variety of high-definition observations of Earth.
3.3 Climate data and projections
This document summarizes a presentation on climate data and projections focusing on limiting global warming to less than 2 degrees Celsius. It discusses the work of GERICS (the Climate Service Center Germany) in developing solutions for regional climate modeling, impacts analysis, and climate adaptation toolkits. Key points covered include:
- GERICS' interdisciplinary approach to regional climate modeling, impacts assessment, and stakeholder engagement.
- The development of adaptation toolkits for cities, companies, and other sectors to facilitate climate risk assessment and planning.
- An overview of the presentation, covering topics like climate modeling techniques, accessing climate projections data, and visualizing and analyzing climate information.
Week3pres sample
This document provides instructions for a 3rd grade solar system project, requiring students to research one planet and fill out a chart with its name, distance from the sun, number of moons, average temperature, length of year, size, atmosphere, and gravity. It lists the information needed and directs students to a website to research their assigned planet and record the data in the provided chart.
Math in the News: 5/2/11
In this issue of Math in the News we look at the wildfires in Texas. Why are they so prevalent this year? How can mathematical models help in predicting the path of a fire?
Decadal warming slowdown predictions by an artificial neural network
1. An artificial neural network was developed to predict slowdowns in the rate of decadal global warming by analyzing patterns in ocean heat content anomalies.
2. The neural network found that transitions in the phase of the Interdecadal Pacific Oscillation often preceded warming slowdowns in climate model simulations.
3. Using explainable AI techniques, researchers determined the neural network was leveraging tropical patterns of ocean heat content to make its predictions of when decadal warming rates might slowdown.
The Pan-Arctic Impacts of Thinning Sea Ice
The Arctic is rapidly changing. However, long-term observations of trends in Arctic sea-ice thickness are still quite limited. In this presentation, Zachary will discuss the different methods (satellite instruments and climate model simulations) of observing sea-ice thickness in order to understand changes in the recent Arctic amplification era. He will also highlight the far-reaching environmental and societal impacts from a thinning Arctic sea-ice cover.
What's hot (20)
Observations and climate model projections of Arctic climate change
Observations and climate model projections of Arctic climate change
Integrating Climate Data Into Forecasting Hydrologic Inflow - Laura Blaylock ...
Integrating Climate Data Into Forecasting Hydrologic Inflow - Laura Blaylock ...
CLIM Undergraduate Workshop: Applications in Climate Context - Michael Wehner...
CLIM Undergraduate Workshop: Applications in Climate Context - Michael Wehner...
CLIM Undergraduate Workshop: How was this Made?: Making Dirty Data into Somet...
CLIM Undergraduate Workshop: How was this Made?: Making Dirty Data into Somet...
Presentation of Four Centennial-long Global Gridded Datasets of the Standardi...
Presentation of Four Centennial-long Global Gridded Datasets of the Standardi...
Improving scientific graphics of climate (change) data
Improving scientific graphics of climate (change) data
Optimization and Statistical Learning in Geophysical Applications
Optimization and Statistical Learning in Geophysical Applications
NOAA and NASA Launch New Polar Satellite for Next-Gen Weather Forecasting
NOAA and NASA Launch New Polar Satellite for Next-Gen Weather Forecasting
Decadal warming slowdown predictions by an artificial neural network
Decadal warming slowdown predictions by an artificial neural network
Viewers also liked
Modeling Count-based Raster Data with ArcGIS and R
This presentation outlines the conceptual framework for building regression models of event counts where the unit of analysis is small. It explains how ArcGIS for Desktop can be used to build raster data sets that are modeled as generalized linear models within the open source R package.
SAS Data Mining - Crime Modeling
This document summarizes a crime analysis project conducted by a university team. The team analyzed multiple data sets to build models predicting crime rates based on factors like population, weather, daylight hours, and economic indicators. They created binary, numeric, and crime ratio models and found the crime ratio model was most statistically significant. The team's analyses found crime rates generally increased with daylight savings time and increased slightly with higher temperatures. Their best model could predict monthly crime totals by city for most crime types except rare crimes like homicide and sexual assault.
2011 NIJ Crime Mapping Conference - Data Mining and Risk Forecasting in Web-b...
- Azavea is a software company based in Philadelphia that develops web-based crime analysis, early warning, and risk forecasting tools to help police departments like analyzing crime data.
- Their HunchLab software aims to automate time-intensive data analysis tasks and provide predictive analytics capabilities to help forecast crime patterns and risks.
- Two key features of HunchLab are near repeat pattern analysis, which quantifies the increased risk of similar crimes nearby in space and time after an initial crime, and load forecasting, which predicts expected crime counts based on historical seasonal and trend patterns.
10 Steps to Optimize Your Crime Analysis
As we develop our crime analysis software, HunchLab, we are always on the look out for ways of examining and improving data quality as well as new academic research that shows promise to enhance crime analysis.
In this one-hour webinar, we first explain some of the ways we examine data quality when we utilize historic incident datasets for research and analysis and how you can use these techniques in your department. Then, we walk through a series of analytic techniques and practices that can help your department improve your crime analysis processes.
Crime Analysis & Prediction System
Crime Analysis & Prediction System is a system to analyze & detect crime hotspots & predict crime.
It collects data from various data sources - crime data from OpenData sites, US census data, social media, traffic & weather data etc.
It leverages Microsoft's Azure Cloud and on premise technologies for back-end processing & desktop based visualization tools.
Using Data Mining Techniques to Analyze Crime Pattern
Our proposed model will be able to extract crime patterns by using association rule mining and clustering to classify crime records on the basis of the values of crime attributes.
Viewers also liked (6)
Modeling Count-based Raster Data with ArcGIS and R
Modeling Count-based Raster Data with ArcGIS and R
2011 NIJ Crime Mapping Conference - Data Mining and Risk Forecasting in Web-b...
2011 NIJ Crime Mapping Conference - Data Mining and Risk Forecasting in Web-b...
Using Data Mining Techniques to Analyze Crime Pattern
Using Data Mining Techniques to Analyze Crime Pattern
Similar to finalPresentation
Avoid ws2 d1_31_fire
1. The document analyzes how climate change may impact forest fire risk globally based on meteorological factors.
2. It finds that increased temperatures are the primary driver of increased forest fire danger projected by climate models, followed by decreased relative humidity which is also influenced by higher temperatures.
3. The analysis projects increased forest fire risk over most regions by 2080 according to various climate change scenarios, with the largest increases in Europe, Amazonia, and parts of North America and East Asia, though increases are lower under a mitigation scenario.
Avoid ws2 d1_31_fire
1. The document analyzes how climate change may impact forest fire risk globally based on meteorological factors.
2. It finds that increased temperatures are the primary driver of increased fire danger projections, followed by decreased humidity which is also influenced by higher temperatures.
3. Using climate models and fire weather indices, it projects increases in fire danger over most regions by 2080 under non-mitigation scenarios, with the largest increases in Europe, Amazonia, and parts of North America and East Asia. Lower but still significant increases are seen under a mitigation scenario.
Ambee Historical Wildfire Data Everything You Need To Know
Exciting news! Ambee is proud to announce the availability of Ambee's extensive historical fire data, spanning over 6 years, for the entire North American Region. Easily access 6+ years of Ambee’s historical wildfire data today. If you require data for a longer time period, all you need to do is contact us..!
Abstract Master Thesis
This thesis analyzes changes in meteorological extremes in South Bavaria, Germany in the context of recent climate change. Six indices for temperature, precipitation and wind extremes are analyzed using data from three weather stations over at least 60 years. Temperature extremes are defined as daily events above the 90th percentile, while precipitation extremes use the 95th percentile. Trend analysis and return levels based on the Generalized Pareto Distribution are used to analyze changes in frequency and intensity of extremes over time. Results show significant increases in temperature extremes in frequency and intensity, with warmer winters. Precipitation extremes show more variability with no significant trends. Wind speed data is also highly variable with no significant trends detected. Temperature data is more reliable than precipitation
Biogeography Critique #1
The document summarizes a study that examines how climate change will impact forest disturbances in the United States through 2100. It used two general circulation models with different climate change scenarios to predict increases in the frequency, severity, and variability of disturbances like fires, droughts, insect outbreaks, introduced species, hurricanes, and ice storms. The results indicated that all of these disturbances would negatively impact forests through loss of vegetation, disrupted processes, reduced carbon storage, and decreased diversity. While the study lacked empirical data, it made a compelling case through advanced models and informed arguments that more research is needed to predict and prepare for these exacerbated disturbances under climate change.
A Defense of Jim Hansen's Climate Conclusions
Dan Miller, an engineer and venture capitalist focused on non-polluting energy technologies, blogs on climate at ClimatePlace.org and helped NASA climate scientist James E. Hansen prepare his recent New York Times Op-Ed article, “Game Over for the Climate.” Miller complained about the Dot Earth post in which the climate scientists Martin Hoerling and Kerry Emanuel separately criticized aspects of Hansen’s piece and was offered a chance to write the following “Your Dot” post.
Faivre_et_al-2016-Ecosphere-2
This document summarizes a study that analyzed the spatial patterns and environmental controls on burned area for two different wildfire regimes in Southern California from 1960-2009. The study used multiple modeling techniques to analyze the relationship between burned area and human and environmental predictor variables for Santa Ana fires and non-Santa Ana fires separately. The models explained 38-63% of spatial variance for Santa Ana fires and 21-48% for non-Santa Ana fires. Key findings were that Santa Ana fires were best predicted by weather variables like wind and humidity, while non-Santa Ana fires were best predicted by vegetation, road access, and distance to housing variables.
Ac.els cdn.com s0169204613002120-1-s2.0-s0169204613002120-main
This document summarizes a study that used microclimate modeling to investigate the impact of urban form and landscaping on afternoon temperatures in Phoenix, Arizona neighborhoods. Five representative neighborhood designs were modeled using the ENVI-met software. Results showed that dense urban forms can create local "cool islands" in mid-afternoon by providing shade. Spatial temperature variations were strongly related to solar radiation and local shading patterns. The study suggests the "Local Climate Zone" concept can be useful for integrating local climate knowledge into urban planning and design.
An Expanded Critique of Some Climate Conclusions
The document summarizes Martin P. Hoerling's response to criticisms of claims made in a New York Times Op-Ed by James E. Hansen regarding the impacts of climate change. Hoerling takes issue with several specific assertions made by Hansen, arguing they are contrary to peer-reviewed literature and climate change assessments. He provides analysis and references to studies to support his counterarguments. The overall summary is that the certainty expressed in Hansen's claims is not supported by the current scientific understanding of regional climate change projections and uncertainties.
UndergradResearch
This document summarizes an experiment that analyzed the relationship between annual increases in carbon dioxide levels in Mauna Loa, Hawaii from 1959-2011 and the frequency of major hurricanes in the Pacific Ocean from 1992-2009. The experiment found a negative correlation between the two variables, which did not support the hypothesis that higher carbon dioxide levels would increase hurricane frequency. Methodology included formatting data sets into a spreadsheet, graphing the variables, and determining the correlation coefficient and coefficient of determination to analyze the strength of the relationship between carbon dioxide increases and hurricane frequency.
Climate Change and Vegetation
1. The document examines research on the effects of climate change on annual vegetation production in dry ecosystems in Israel.
2. Five climate change scenarios were tested, and the results showed the ecosystems were resilient to changes in rainfall and temperature but less resilient to changes in the timing of the growing season.
3. Delays to the beginning of the growing season caused the largest decreases in annual vegetation production, indicating changes in rainfall distribution may be more impactful than changes in total rainfall.
Running head accident and casual factor events1accident and ca.docx
Running head: accident and casual factor events 1
accident and casual factor events 7Accident and Casual Factor Events
Wesley D. Herron
Waldorf University
Accident And Causal Factor Events
The causal factor and events chart describe a graphical and written description for the time sequence of events contributing the various events related to an accident. The construction of the causal factor and events factor chart helps investigators to conduct an in-depth research and identifying the root cause of accidents. The following are charts showing the various elements involved in event charting:
· Condition- This refers to the distinct state that facilitates event occurrence. a condition may be weather, equipment status, the health status of an employee as well as any other factor affecting an event
· Event-Refers to the point in time described by the occurrence of specific actions.
· Accident- describesthe action, state and even condition where a system is not meeting one or more of its design objectives (Oakley, 2012). This includes real accidents and also near misses. This is the main focus of the analysis or even the evaluation.
· Primary event line- These are the main sequences of occurrence that resulted in the accidents. The primary event line gives the basic nature of an occurrence in a logical progression. However, it does not provide the contributing causes, and it often contains the accident but does not essentially end with an accident event. the primary event line comprises of both conditions and events
· Primary events and conditions- the conditions and events described make up the primary event line.
· Secondary event lines. These are a series of occurrences that lead to primary conditions and events. Secondary event lines enhance the development of the primary event line to show all the facilitating elements of an event. Causal factors are often found in secondary event lines, and they have both the events and conditions.
· Secondary events and conditions- these are conditions and events that make up the secondary event line.
Causal factors
These are key conditions and events that when eliminated could have prevented or reduced an accident and its effects (Oakley, 2012). Causal factors include equipment failure, human error and they include activities such as initiating event for an accident, failed safeguards, and having reasonable safeguards that were not provided.
Items of note
These are undesirable events, and conditions that have been identified in an analysis and they have to be addressed or corrected. However, the events did not contribute to the focus of the accident, and they are shown as separate boxes specifically outside the event chain.
Events and accidents are examined to identify the causes of their event and to decide the moves that must be made to avoid a repeat. It is basic that the accident investigators profoundly investigate into both the events and the conditions ...
Contributors to the frequency of intense climate disasters in asia pacific co...
The frequency of intense natural disasters increased notably from the 1970s to the 2000s. Around half of these events happen in Asia and Pacific Area. Intense hydrometeorological disasters and climatological disasters accounted for most of the worldwide increase in natural disasters.The Springer.com Open Access Science and Media website publish a new paper about disaster prevention and climate action. This pubblication is an indipendent evalutaion at the Asian Development Bank.
diurnal temperature range trend over North Carolina and the associated mechan...
diurnal temperature range trend over North Carolina and the associated mechan...Sayem Zaman, Ph.D, PE.
This study seeks to investigate the variability and presence of trends in the diurnal surface air temperature range
(DTR) over North Carolina (NC) for the period 1950–2009. The significance trend test and the magnitude of trends were determined using the non-parametric Mann–Kendall test and the Theil–Sen approach, respectively.
Statewide significant trends (p b 0.05) of decreasing DTR were found in all seasons and annually during the analysis period. The highest (lowest) temporal DTR trends of magnitude −0.19 (−0.031) °C/decade were found in summer (winter). Potential mechanisms for the presence/absence of trends in DTR have been highlighted. Historical
data sets of the three main moisture components (precipitation, total cloud cover (TCC), and soil moisture) and
the two major atmospheric circulation modes (North Atlantic Oscillation and Southern Oscillation) were used for
correlation analysis. The DTRs were found to be negatively correlated with the precipitation, TCC, and soil moisture across the state for all the seasons and annual basis. It appears that the moisture components related better to the DTR than to the atmospheric circulation modes.
Stephan harrison
This document discusses global patterns of moraine-dammed glacial lake outburst floods (GLOFs) and the challenges of attributing them to climate change. It notes that while temperatures are rising in mountain regions worldwide, the recorded number of GLOFs has fallen with no clear trend in magnitude. Attributing GLOFs to anthropogenic global warming is difficult due to issues modeling small-scale mountain processes and a lack of complete global data on GLOF events over time. The development of improved models at appropriate scales and a more robust global GLOF inventory are needed to better understand the relationship between climate and these extreme geomorphic events.
Interrelation between Climate Change and Lightning and its Impacts on Power S...
Climate change is expected to increase lightning activity, posing risks to the power sector. A warmer climate could lead to fewer but more intense thunderstorms, increasing flash floods, wildfires, and damage to power infrastructure from lightning strikes. This would likely cause more blackouts. As lightning activity rises with climate change, utilities must invest in strategies to adapt operations and strengthen transmission infrastructure to manage these new risks. Developing accurate climate and lightning databases could help utilities better forecast hazards and mitigate impacts on the power grid.
Climate change prediction erring on the side of least drama (gec, 11.2012). L...
Climate change prediction erring on the side of least drama (gec, 11.2012). L...Ecologistas en Accion
Climate change prediction erring on the side of least drama (gec, 11.2012). Lecturas recomendadas Ferran Puig V. Climate change australia
This document summarizes a study that explores the impact of future climate change on forest and grassland fire risk in Australia. The study uses a regional climate model at high resolution, driven by data from a global climate model, to simulate climate conditions for present day as well as 2050 and 2100 under relatively high and low emissions scenarios. The results consistently show an increase in fire risk across Australia due to warming and reduced humidity. The probability of extreme fire risk is projected to increase by around 25% in 2050 and more substantially by 2100 under high emissions. This suggests climate change will likely require increased investment in fire management to maintain current levels of fire impacts.
Human and natural_influences_on_the_changing_thermal_structure_of_the_atmosphere
This document analyzes human and natural influences on changing atmospheric temperature patterns based on climate model simulations and satellite observations. The key findings are:
1) Both climate model simulations including human factors and satellite data show widespread tropospheric warming and stratospheric cooling over the past several decades.
2) These temperature changes are unlikely to be due to internal variability or natural external factors alone, based on comparisons to model runs with only natural forcings.
3) The observed temperature pattern matches that expected from increased greenhouse gases more closely than patterns from alternative forcings, providing evidence of a human influence on atmospheric temperatures.
Публікація іноземного студента
Thermal energy use was studied in three Swedish greenhouses over different time periods. Greenhouse A used 793 MJ/m2 annually for tomatoes. Greenhouse B used 1529 MJ/m2 for tomatoes and 873 MJ/m2 for ornamental plants. Wind speed had a positive correlation with thermal energy use, with a 50% reduction in wind speed potentially decreasing energy use by 4-10%. Thermal energy use at 15-20°C outdoor temperatures was similar to use at 10-15°C in one greenhouse, suggesting dehumidification drives energy use above assumptions based solely on temperature.
Similar to finalPresentation (20)
Ambee Historical Wildfire Data Everything You Need To Know
Ambee Historical Wildfire Data Everything You Need To Know
Ac.els cdn.com s0169204613002120-1-s2.0-s0169204613002120-main
Ac.els cdn.com s0169204613002120-1-s2.0-s0169204613002120-main
Running head accident and casual factor events1accident and ca.docx
Running head accident and casual factor events1accident and ca.docx
Contributors to the frequency of intense climate disasters in asia pacific co...
Contributors to the frequency of intense climate disasters in asia pacific co...
diurnal temperature range trend over North Carolina and the associated mechan...
diurnal temperature range trend over North Carolina and the associated mechan...
Interrelation between Climate Change and Lightning and its Impacts on Power S...
Interrelation between Climate Change and Lightning and its Impacts on Power S...
Climate change prediction erring on the side of least drama (gec, 11.2012). L...
Climate change prediction erring on the side of least drama (gec, 11.2012). L...
Human and natural_influences_on_the_changing_thermal_structure_of_the_atmosphere
Human and natural_influences_on_the_changing_thermal_structure_of_the_atmosphere
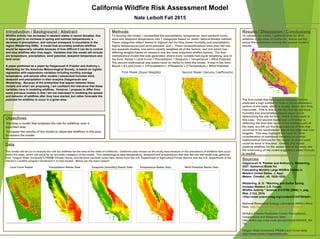
finalPresentation
- 1. Nate Leibolt Fall 2015 Introduction / Background / Abstract Wildfire activity has increased in western states in recent decades, due in large part to an increase in spring and summer temperatures, a decrease in precipitation, and reduced snowpack in mountains in the region (Westerling 2006). A model that accurately predicts wildfires would be especially valuable because of how difficult it can be to control and stop wildfires after they begin. Variables that this model will include are temperature, precipitation, wind potential, dewpoint temperature and land cover. A paper published as a paper by Haiganoush K Preisler and Anthony L Westerling for the American Meteorological Society, is based on logistic regression with explanatory variables including monthly average temperature, and several other models I researched included wind, dewpoint and precipitation in their analysis (Haiganoush and Westerling). Because of the similarities that appear between these models and what I am proposing, I am confident the relevance that these variables have in modeling wildfires. However, I propose to differ from some previous models in that I am not interested in modeling the spread and behavior of wildfires after they have started, but rather forecasts the potential for wildfires to occur in a given area. California Wildfire Risk Assessment Model Data This model will be run to analyze the risk for wildfires for the area of the state of California. California was chosen as the study area because of the prevalence of wildfires that occur within the state, which will allow for an accurate validation of the model. The climatological data (temperature, dewpoint and precipitation) that was fed into the model was gathered from Oregon State University’s PRISM Climate Group, and the land use/land cover data comes from the U.S. Department of Agriculture Forest Service and the U.S. Department of the Interior’s Landfire program (Anderson’s 13 fuel model). Below are the input rasters: Land Cover Raster Precipitation Raster Data Dewpoint (Humidity) Raster Data Temperature Raster Data Wind Potential Raster Data Objectives •Develop a model that analyzes the risk for wildfires over a specified area •Compare the results of the model to observed wildfires in the area to assess the model. Results / Discussion / Conclusions To validate the model, I gathered data for 2014 wildfires in the state of California. Below are the actual fire perimeters overtop the second model’s results: The first model that had equally weighted factors predicted a high number of fires in the southeastern portion of the state, which is mostly desert, and thus, inaccurate. This is due to the fact that temperature, humidity and precipitation played equal role in determining the site for fires, which is inaccuate in this case. The second model was a bit better in reflecting the fires that occur in the northern part of the state, but left out the large expanse of fires that occurred in the southwester part of the state near Los Angeles. This may highlight the need for more consideration of additional variables or a better mathematical formula for the model, so future work could be done in this area. Overall, this model predicts wildfires for the wester part of the state, but the innacuracy of the model suggests a better formula is needed. Methods To develop the model, I reclassified the precipitation, temperature, land use/land cover, wind and dewpoint temperature into 7 categories based on Jenks’ Natural Breaks method. These categories reflect lowest to highest risk for fires (lower humidity and precipitation, higher temperatures and wind potential, and ). These reclassifications were then fed into two separate models, one which equally weighted all of the factors, and one which has differing weights based on research into the most important wildfire factors. The first mathematical model that was generated, where every variable had equal weighting, was in the form: Result = Land Cover + Precipitation + Dewpoint + Temperature + Wind Potential. The second mathmatical was based more on reality to hone the model. It was in the form: Result = 5*Land Cover + 2*Precipitation + 2*Dewpoint + 2*Temperature + Wind Potential First Model (Equal Weights) Second Model (Varying Coefficients) Sources Haiganoush K. Preisler and Anthony L. Westerling, 2007: Statistical Model for Forecasting Monthly Large Wildfire Events in Western United States. J. Appl. Meteor. Climatol., 46, 1020–1030. Westerling, A. G. "Warming and Earlier Spring Increase Western U.S. Forest Wildfire Activity." Science 313.5789 (2006): n. pag. Web. 8 Oct. 2015. <http://www.sciencemag.org/content/313/5789/940>. National Renewable Energy Laboratory (NREL) Wind Data: http://www.nrel.gov/gis/data_wind.html NOAA’s Climate Prediction Center Precipitation, Temperature and Dewpoint Data: http://www.cpc.ncep.noaa.gov/products/GIS/GIS_DA TA/ Oregon State University PRISM Land Cover data: http://www.prism.oregonstate.edu