SlideShare a Scribd company logo
i
A TIME SERIES ANALYSIS OF DIABETES CASES IN RWANDA FOR THE
PERIOD 2006-2015: A CASE STUDY OF KIREHE HOSPITAL
BY
KAYITARE ERICK
13/U/6395/EVE
SUPERVISOR: ASS.PROFESSOR L.K. ATUHAIRE
A DISSERTATION SUBMITTED TO THE SCHOOL OF STATISTICS AND
PLANNING IN PARTIAL FULFILMENT OF THE REQUIREMENTS FOR THE
AWARD OF DEGREE OF BACHELOR OF SCIENCE IN QUANTITATIVE
ECONOMICS OF MAKERERE UNIVERSITY KAMPALA
JUNE 2016
i
DECLARATION
I, KAYITARE ERICK, declare that this work is original and has never been presented to any
institution of higher learning or organization by any person for the award of any qualification.
Signature ……………………… Date …. /…./…….
KAYITARE ERICK
Student
Signature ………………………. Date …. /…../…….
ASS.PROF. L.K. ATUHAIRE
Supervisor
ii
DEDICATION
I dedicate this piece of work to my mother Kayitesi and my grandmother Mukangira who are
both victims of Type II diabetes mellitus.
iii
ACKNOWLEDGEMENTS
My Lord and God! You are worthy to receive glory, honour, and power. For you created all
things. Had it not been for your Grace, this report would not be a success.
Boundless and ecstatic thanks to many who in one way or the other assisted in the preparation
of this report. First and foremost, to Bushayija’s family, Safi’s family and lesavant family for
their unstinting encouragement, support and cheer-leading. This journey has been an
interesting one, many mountains and valleys, which in turn have made me a better and strong
person.
Many thanks to my supervisor Assoc.Prof. L.K. Atuhaire, a senior lecturer at the SSP for his
outstanding tireless dedication of time since the beginning of this research to its completion.
Every time I went to his office, my whole brain could function at its best because I was
always challenged by his questions. Honestly, if it were not for his constructive criticisms,
comments and corrections, this research would have been impossible. I take this wonderful
opportunity to thank the SSP teaching staff for the knowledge they have been giving me way
back in 2013 to date. Heartfelt thanks go to the dean of SSP-Assoc.Prof.Robert Wamala for
igniting my love for data analysis, today am a proud teacher of the same subject.
In a special way, I am really grateful to Kirehe hospital especially Mr.Cyprien who helped
me to get all the data I needed for this research project. I highly believe that this research will
be of much help to the same hospital.
A vote of thanks to my dearest friends, fellow gallant makererians, crème de la crème, the
entire RAW discussion group for the cooperation and teamwork we had for three years.
Whenever I was around Wadada Robert, Okello Milton, Sanoni Isabirye, Brigitte, Amanda
and others, my fear of the hard course units like stochastic modelling would vanish
immediately, because these great people always had the right information.
Finally, I want to thank everyone who has been with me for this undergraduate course,
indirectly or directly. I must say, am humbled for having met you, in one way or the other, we
helped each other, supported each other, strangers became brothers and sisters while others
followed in the steps of Adam and Eve, all this made life at MUK interesting.
About learning, this is what my role model Jim Rohn said: “Learning is the beginning of
wealth. Learning is the beginning of health. Learning is the beginning of spirituality.
Searching and learning is where the miracle process all begins.”
iv
ABSTRACT
This study of Time series analysis of diabetes mellitus was carried out in Kirehe hospital
which is located in Eastern Rwanda, Kirehe district. The main objective of the study was to
carry out a time series of diabetes mellitus in Rwanda.
In this study, secondary data was collected from the Hospital’s data records on diabetes
mellitus with respect to age, sex, age groups and type of diabetes. Data collected was
thereafter entered, analysed using Ms-Excel and Stata and tests of hypotheses by the use of
Daniels test test at 95% confidence level were done to determine whether there was a trend in
both types of diabetes, also trend testing was done on both male patients and female patients.
Finally trends were fitted to forecast diabetes mellitus cases for the next 10 years.
The results from the study revealed that the year 2013 had the highest number of diabetes
cases, 33 patients which accounted for 18.33%. Results also revealed that Type II diabetes
mellitus was the most common type of diabetes with 97.22% prevalence levels for the period
2006-2015. The most affected age group was that of 35 years of age and above which
accounted for 83.89% of the overall diabetes mellitus incidence.
This research revealed that diabetes mellitus cases for females or the series was trended with
95% confidence level. The researcher also failed to reject the null hypothesis that diabetes
mellitus occurrence for males is not trended, he therefore concluded with 95% confidence
that the data was trended, in the same vein, type II diabetes mellitus cases were found to be
trended. Surprisingly, type I diabetes mellitus cases showed signs of stationarity with 95%
confidence level.
The researcher found out that both type I and type II diabetes mellitus were estimated to be
increasing over the next 10 years. By 2025, the former was estimated to be 2049 cases while
the latter was estimated to be 2011 cases.
The researcher made four recommendations namely; priority should be preventive care,
where physical exercises and diet should be among top priorities in order to avoid this deadly
non-communicable disease. Second, the researcher went ahead to call for attention on type I
diabetes mellitus which was found to be increasing at an increasing rate especially among the
young people.
Further still, much attention and support is needed to people aged 35 and above. This is
because, results revealed that 80% diabetes cases were among those aged 35 years and above.
Lastly, the researcher recommended Ministry of health and the government of Rwanda in
general to put up measures against diabetes mellitus by targeting females first since they are
the most affected gender.
v
LIST OF ABBREVIATIONS
DM: Diabetes Mellitus
MoH: Ministry of Health
MUK: Makerere University Kampala
NCD: Non-communicable disease
SSP: School of Statistics and Planning
T1D: Type I diabetes
T2D: Type II diabetes
WHO: World Health Organization
vi
TABLE OF CONTENTS
DECLARATION........................................................................................................................i
DEDICATION...........................................................................................................................ii
ACKNOWLEDGEMENTS..................................................................................................... iii
ABSTRACT..............................................................................................................................iv
LIST OF ACRONYMS .............................................................................................................v
TABLE OF CONTENTS..........................................................................................................vi
LIST OF TABLES.....................................................................................................................x
LIST OF FIGURES ..................................................................................................................xi
CHAPTER ONE: INTRODUCTION....................................................................................1
1.1BACKGROUND TO THE STUDY.....................................................................................1
1.2. PROBLEM STATEMENT.................................................................................................2
1.3. OBJECTIVES OF THE STUDY........................................................................................3
1.3.1. Major objective...................................................................................................................3
1.3.2. Specific objectives………………………………………………………………………3
1.4. HYPOTHESES...................................................................................................................3
1.5. SCOPE AND COVERAGE OF THE STUDY ..................................................................4
1.6. SIGNIFICANCE OF THE STUDY....................................................................................4
CHAPTER TWO: LITERATURE REVIEW.......................................................................5
2.0. Introduction.........................................................................................................................5
2.1. Definition and facts about diabetes mellitus.......................................................................5
2.2. Epidemiology of diabetes mellitus......................................................................................5
2.3. Prevalence of diabetes mellitus...........................................................................................6
CHAPTER THREE: METHODOLOGY .............................................................................8
3.0. Introduction.........................................................................................................................8
3.1. Study population.................................................................................................................8
3.2.Nature and source of data ....................................................................................................8
3.3. Data collection procedure ...................................................................................................8
3.4. Data analysis procedure ......................................................................................................8
3.4.1. Descriptive statistics ......................................................................................................9
3.4.2. Bivariate analysis...........................................................................................................9
vii
3.5. Analysis of Diabetes mellitus cases...................................................................................9
3.5.1. Analysis of diabetes mellitus cases for females............................................................9
3.5.2. Analysis of diabetes mellitus cases for males.............................................................10
3.5.3. Analysis of type II diabetes cases ...............................................................................10
3.5.3.1. Trend fitting for Type II Diabetes and forecast ......................................................11
3.5.3.2. Estimation of the Type II Diabetes trend model.....................................................12
3.5.4. Analysis of type I diabetes cases .................................................................................10
3.5.4.1. Trend fitting for Type I Diabetes and forecast........................................................11
3.5.4.2. Estimation of the Type I Diabetes trend model ......................................................11
3.6. Challenges faced ...............................................................................................................12
CHAPTER FOUR..................................................................................................................13
PRESENTATION, ANALYSIS AND INTERPRETATION OF FINDINGS .................13
4.0. Introduction.......................................................................................................................13
4.1. Descriptive statistics of diabetes mellitus.........................................................................13
4.1.1. Diabetes mellitus by Type .........................................................................................14
4.1.2. Diabetes cases with respect to Age............................................................................14
4.2. Bivariate Analysis of diabetes mellitus.............................................................................15
4.2.1. Diabetes type in relation to sex..................................................................................15
4.2.2. Diabetes type in relation to age groups......................................................................15
4.3. Hypothesis testing.............................................................................................................16
4.3.1. Research hypothesis one............................................................................................16
4.3.2. Research hypothesis two............................................................................................17
4.3.3. Research hypothesis three..........................................................................................18
4.3.3. Research hypothesis four...........................................................................................19
4.4. Fitting Trends and forecasting for diabetes mellitus.........................................................19
4.4.1.1. Trend fitting for Type I diabetes.............................................................................19
4.4.1.2. Forecast for Type I diabetes mellitus......................................................................21
4.4.2.1. Trend fitting for Type II diabetes............................................................................21
4.4.2.2. Forecast for Type II diabetes ..................................................................................23
CHAPTER FIVE ...................................................................................................................24
SUMMARY, CONCLUSIONS AND RECOMMENDATIONS .......................................24
5.0. Introduction.......................................................................................................................24
5.1. SUMMARY AND CONCLUSIONS ...............................................................................24
5.1.1. Type I diabetes mellitus.............................................................................................24
5.1.2. Type II diabetes mellitus............................................................................................25
viii
5.2. RECOMMENDATIONS..................................................................................................25
APPENDIX: DATA COLLECTED FROM KIREHE HOSPITAL........................................26
REFERENCES ........................................................................................................................31
ix
x
LIST OF TABLES
Table 4. 1: Diabetes mellitus distribution by type ...................................................................14
Table 4. 2: Percentage distribution of diabetes mellitus by age ..............................................14
Table 4.3: Cross tabulation of sex by type of diabetes: Chi-square.........................................15
Table 4. 4: Cross tabulation of age groups by type of diabetes: Chi-square ...........................15
Table 4 .5: Female Diabetes mellitus cases (yt) in Kirehe hospital .........................................16
Table 4 .6: Male Diabetes mellitus cases (yt) in Kirehe hospital.............................................17
Table 4. 7: Type II Diabetes mellitus cases (yt) in Kirehe hospital.........................................18
Table 4. 8: Type I Diabetes mellitus cases (yt) in Kirehe hospital ..........................................19
Table 4 .9: Table used to fit the trend for Type I diabetes.......................................................20
Table 4 .10: Forecasting for Type I diabetes mellitus for the years 2016-2025 ......................21
Table 4. 11: Table used to fit the trend for Type II diabetes ...................................................22
Table 4 .12: Forecasting for Type I diabetes mellitus for the years 2016-2025 ......................23
xi
LIST OF FIGURES
Figure 4 .1: Diabetes mellitus cases for the period 2006-2015................................................13
Figure 4. 2: Trend of Type I diabetes cases in Kirehe hospital (2006-2015) ..........................20
Figure 4. 3: Trend of type II diabetes cases for the period 2006-2015....................................22
1
CHAPTER ONE: INTRODUCTION
1.1. BACKGROUND TO THE STUDY
Around 1990’s, many people were suffering from diabetes without knowing, it was worse
when doctors told someone that they had failed to diagnose the problem. Such innocent
people resorted to herbal medicine while others went as far as consulting witch doctors.
However, around early 2000’s, the truth came to surface and it was none other than the
deadly diabetes mellitus-as scientists call it. Measures were put across in order to avoid
getting this disease. People started to be diet-conscious; less sugar was taken and for the first
time, edible salt and cooking oil could be measured carefully before cooking. In general, it
was an awakening moment.
Diabetes mellitus is one of the most common non-communicable diseases globally. It is said
to be the fourth or fifth leading cause of death in most developed countries and is epidemic in
many developing and newly industrialized nations. Many complications from diabetes
include stroke, amputations, peripheral neuropathy, foot ulcer, cataracts and albuminuria.
Diabetes is regarded as one of the most challenging health problems in the 21st century
(International Diabetes Federation, 2003).
Diabetes mellitus is basically of two types: Type I diabetes or Insulin Dependent Diabetes
Mellitus (IDDM) or juvenile diabetes and Type II diabetes or Non-Insulin-Dependent
Diabetes Mellitus (NIDDM) or adult onset diabetes. Type I diabetes, is primarily a disease of
the pancreas. It results when the pancreas produces insufficient amounts of insulin to meet
the body’s needs. A Type I diabetic patient needs daily injections of insulin to live, hence the
name IDDM. It develops most often in children and young adults, but the disorder can appear
at any age. Type II diabetes, is a disease of insulin function and it is the most common form.
Subjects with this type present with measurable quantities of insulin in the blood, and
sometimes, as in obesity, the insulin levels are relatively high. This insulin is however
ineffective because of the insensitivity of target tissues to its action. About 90 to 95 percent
of people with diabetes have Type II diabetes. This form of diabetes usually develops in
adults over the age of 40 and is most common among adults over age55. About 80 percent of
people with Type II diabetes are overweight. Type II diabetes is often part of a metabolic
syndrome that includes obesity, elevated blood pressure, and high levels of blood lipids.
Unfortunately, as more children and adolescents become overweight, Type II diabetes is
becoming more common in young people (International Diabetes Federation [IDF], 2001).
2
Diabetes mellitus is widespread throughout the world. In 1985, the World Health
Organization noted that diabetes mellitus affects more than 30 million people worldwide
(WHO, 1985). In many countries, it is now the leading cause of death, disability and high
health care costs. It is noted that approximately 177 million people are now diagnosed with
diabetes worldwide and around 4 million deaths every year are attributable to its
complications (WHO, 2000). Rwanda is one of the 32 countries of the International Diabetes
Federation Africa (IDF AFR) region. 387 million people have diabetes in the world and more
than 22 million people in the AFR region; by 2035 this figure will almost double. There were
299,100 cases of Diabetes in Rwanda in 2014 (Gishoma, 2014).
This non-communicable disease did not spare my family. Currently, many family members
have this disease—six in total, including my lovely mother. I believe that all problems have
solutions; it may take many years or centuries, but if we keep searching for the solution, we
will eventually find it. As a quantitative economics student, I want to be part of the team
looking for the solution to this problem-by providing the necessary quantitative data in order
to make informed decisions.
1.2. PROBLEM STATEMENT
Diabetes mellitus is a growing problem worldwide with rising prevalence rates, including in
sub-Saharan Africa. The global rise in type 2 diabetes is occurring fastest in developing
countries. This is all compounded by the fact that as many as 50% of people with diabetes are
yet to be diagnosed (International Diabetes Federation, 2003).
Alemu (2009) points out that the burden of non-communicable diseases is increasing rapidly.
He argues that such diseases have a high cost of management and yet they can be prevented
and controlled using simple and cost effective means by targeting their risk factors.
In Rwanda, Non-communicable diseases (NCDs)—probably accounting for about 25% of the
national burden of disease—have yet to be addressed in a strategic and systematic way. These
diseases include cardiovascular disease, cancer, epilepsy, pulmonary disease, and diabetes,
among others. These are global diseases and yet, more often than not, NCDs are thought to be
problems of middle- and high-income countries. In such countries, risk factors for NCDs
include obesity, tobacco use, and other factors termed poor lifestyle choices. However, in
Rwanda and other developing countries, this is not the case. NCDs are instead linked to
3
malnutrition, infection, congenital abnormalities, and toxic environments. All of these factors
are ultimately exacerbated by poverty (World Health Organization, 2008).
A number of interventions are available to control the complications of diabetes mellitus,
these include insulin therapy, dietary restrictions and physical exercises. However, no study
has been conducted to address the problem of time series model which can help the
Government and other concerned parties to make the necessary planning as far as diabetes
mellitus is concerned. This study addresses this problem.
1.3. OBJECTIVES
1.3.1. Major objective
The main objective of this study is to carry out a time series analysis of diabetes cases in
Rwanda.
1.3.2. Specific objectives
i. To estimate a time series model on the number of diabetes cases for type I
diabetes.
ii. To estimate a time series model on the number of diabetes cases for type II
diabetes.
iii. To fit trends and carry out forecasts for diabetes cases in the next 10 years.
iv. To make a trend analysis of diabetic cases for males.
v. To make a trend analysis of diabetic cases for females.
1.4. HYPOTHESES
i. Diabetes mellitus occurrence for females is trended.
ii. Diabetes mellitus occurrence for males is trended.
iii. The type two diabetes time series is trended.
iv. The type one diabetes time series is trended.
4
1.5. SCOPE AND COVERAGE OF THE STUDY
The study will cover Type 1 and type 2 diabetes cases that were registered at Kirehe hospital
for the period January 2006 to December 2015. The study will go beyond descriptive analysis
to a time series analysis of Annual registration of Diabetes cases by various variables like
gender, age, and type of diabetes.
1.6. SIGNIFICANCE OF THE STUDY
Diabetes mellitus is a multi-system disorder. Its complications can involve any organ in the
body. Some of these complications include visual impairment, cardiovascular disease, limb
and brain damage, impotence, kidney failure, urinary tract and stroke. Because of its chronic
nature, the severity of its complications and the means required to control them, diabetes is a
costly disease, not only for the affected individual and his/her family, but also for the health
authorities.
The study will be of much relevance to the Government and Medical society at large who
will use the model predictions to know how they can plan for the treatment, control and
prevention of the disease and how much money the Government and its development partners
will spend in future. The findings will help academicians, especially those interested in non-
communicable diseases. It will furthermore be of use to the Ministry of Health of Rwanda
which will be able to identify the most affected categories.
5
CHAPTER TWO: LITERATURE REVIEW
2.0. Introduction
This chapter presents a review of the literature related to the study. Most of the literature
presented here, concentrates on the epidemiology of diabetes mellitus, its control measures
and various prevalence rates across the world.
2.1. Definition and facts about diabetes mellitus
Diabetes mellitus is a growing public health affecting people worldwide both in developing
and developed countries, and poses a major socio-economic challenge. A chronic metabolic
disorder of multiple aetiologies is assuming epidemic proportions worldwide. It is also a
complex disorder with profound consequences both acute and chronic. Genetic and
environmental factors play a role in the development of the disease. The cells of the body
cannot metabolise sugar properly due to a total or relative lack of insulin. The body then
breaks down its own fat, protein, and glycogen to produce sugar resulting in high sugar levels
in the blood with excess by products called ketones being produced by the liver. Diabetes
causes disease in many organ systems, the severity of which may be related to how long the
disease has been present and how well it has been controlled. The term diabetes mellitus
describes a metabolic disorder of multiple aetiology characterised by chronic hyperglycaemia
with disturbances of carbohydrate, fat, and protein metabolism resulting from defects in
insulin secretion, insulin action or both (World Health Organization, 1999).
2.2. Epidemiology of diabetes mellitus
It is estimated that 366 million people had DM in 2011; by 2030 this would have risen to 552
million. The number of people with type 2 DM is increasing in every country with 80% of
people with DM living in low- and middle-income countries. DM caused 4.6 million deaths
in 2011.It is estimated that 439 million people would have type 2 DM by the year 2030.The
6
incidence of type 2 DM varies substantially from one geographical region to the other as a
result of environmental and lifestyle risk factors (Diabetic Atlas, 2011).
Literature search has shown that there are few data available on the prevalence of type 2 DM
in Africa as a whole. Studies examining data trends within Africa point to evidence of a
dramatic increase in prevalence in both rural and urban setting, and affecting both gender
equally (www.medscape.com).
According to information from Diabetes Care, the majority of the DM burden in Africa
appears to be type 2 DM, with less than 10% of DM cases being type 1 DM.
A 2011 Centre for Disease Control and Prevention (CDC) report estimates that DM affects
about 25.8 million people in the US (7.8% of the population) in 2010 with 90% to 95% of
them being type 2 DM (Diabetes fact sheet, 2011).
It is predicted that the prevalence of DM in adults of which type 2 DM is becoming
prominent will increase in the next two decades and much of the increase will occur in
developing countries where the majority of patients are aged between 45 and 64 years.It is
projected that the latter will equal or even exceed the former in developing nations, thus
culminating in a double burden as a result of the current trend of transition from
communicable to non-communicable diseases (Global burden of chronic diseases, 2004).
2.3. Prevalence of diabetes mellitus
The prevalence of diabetes has increased worldwide, including in Africa, where the greatest
proportional increase (90%) in the number of diabetes cases is projected to occur by 2030.
Type 2 diabetes (T2D) represents more than 90% of diabetes cases in Africa. The surge in
T2D in Africa has been primarily attributed to environmental factors due to nutrition
transition and urbanization that bring about lifestyle changes; however, current understanding
of the pathophysiology of T2D in populations within Africa remains elusive. From
observations among other populations around the world, it is obvious that T2D has a strong
genetic component, as evidenced by a high concordance rate (70%) in monozygotic twins and
the over 40% risk of having T2D for an offspring of a T2D patient. Unlike simple monogenic
diseases, the pathophysiology of T2D involves most of the time an interaction of several
common genetic risk factors of low penetrance with environmental factors. Hitherto, the vast
majority of T2D-related risk alleles have been identified through genome-wide association
studies, mostly conducted in European Descendants and Asian populations (Diabetes
Research and Clinical Practice, 2014).
7
The excess global mortality attributable to diabetes in the year 2000 was estimated to be 2.9
million deaths, equivalent to 5.2% of all deaths. Excess mortality attributable to diabetes
accounted for 2-3 % of deaths in poorest countries (Diabetes care, 2005).
Diabetes is a serious illness with multiple complications and premature mortality accounting
for at least 10 % of total health care expenditure in many countries. Diabetes is often
perceived as a disease of affluent countries. A serious chronic disease which leads to a
substantial reduction in life expectancy, decreased quality of life and increased costs of care
(O’Connor, 2009).
Most African studies are hospital based and give data on patients that visit the hospital only.
Type 1 diabetes has been estimated to affect approximately 19000 people in the world’s
poorest countries but there is lack of good data on the disease prevalence in developing
countries and in particular in sub-Saharan Africa. The present increase in the rate of both type
2 diabetes mellitus and type 1 diabetes mellitus indicate the great and urgent need for more
epidemiological surveys in sub-Saharan Africa. Such a need is dictated by the prevalence of
undiagnosed diabetes mellitus. (Diabetes Care, 2005).
8
CHAPTER THREE: METHODOLOGY
3.0. Introduction
This section shows in detail the road map of this research project, it includes the study
population, the nature and source of data, the way data was recorded, analysed and presented,
finally it ends with anticipated challenges.
3.1. Study population
The population studied was Kirehe district where Kirehe Hospital is located. The community
is majorly rural where the main occupation is agriculture.
3.2. Nature and source of data
The data collected was purely secondary in nature. It was collected from Kirehe Hospital’s
data records for the period 2006-2015. The Hospital is situated in Kirehe district, Eastern
Rwanda. The data collected was on annual basis.
3.3. Data collection procedure
The data on diabetes mellitus for the period 2006-2015, was collected on the following
variables;
1. Sex
2. Age
3. Type of diabetes
4. Year
3.4. Data analysis procedure
Data will be analysed starting with descriptive statistics, then bivariate analysis followed by
model estimation for type I diabetes, type II diabetes then for gender.
9
3.4.1. Descriptive statistics
Descriptive statistics will be used to describe basic features of the data under study, in this
case data on diabetes mellitus cases at Kirehe hospital. Variables such as age, sex and type of
diabetes will be analysed.
3.4.2. Bivariate analysis
Bivariate analysis is the simultaneous analysis of two variables. It explores the concept of
relationship between two variables, whether there exists an association and the strength of
this association, or whether there are differences between two variables and the significance
of these differences.
3.4.3. Analysis of Diabetes mellitus cases
3.4.3.1. Analysis of diabetes mellitus cases for females
To analyse diabetes mellitus cases for females, the test of hypotheses was done using Daniels
test. This non-parametric test is based upon the spearman’s coefficient.
Hypotheses
Ho: Diabetes mellitus occurrence for females is not trended
Ha: Diabetes mellitus occurrence for females is trended
Level of significance α = 0.05
Test statistic
 1
6
1 2
2



nn
dt
sr
Where dt = t – rank (yt)
t: order number of years
yt: Diabetes cases for females
rs: rank correlation coefficient
n: number of observations
10
3.4.3.2. Analysis of diabetes mellitus cases for males
To analyse diabetes mellitus cases for males, the test of hypotheses was done using Daniels
test. This non-parametric test is based upon the spearman’s coefficient.
Hypotheses
Ho: Diabetes mellitus occurrence for males is not trended
Ha: Diabetes mellitus occurrence for males is trended
Level of significance α = 0.05
Test statistic
 1
6
1 2
2



nn
dt
sr
Where yt : Diabetes cases for males.
3.5.1.1. Analysis of type II diabetes cases
To analyse type II diabetes mellitus cases, the test of hypotheses was done using Daniels test.
This non-parametric test is based upon the spearman’s coefficient.
Hypotheses
Ho: Type II Diabetes mellitus occurrence is not trended
Ha: Type II Diabetes mellitus occurrence is trended
Level of significance α = 0.05
Test statistic
 1
6
1 2
2



nn
dt
sr
Where yt: Type II diabetes cases
3.5.1.2. Analysis of type I diabetes cases
To analyse type I diabetes mellitus cases, the test of hypotheses was done using Daniels test.
This non-parametric test is based upon the spearman’s coefficient.
Hypotheses
Ho: Type I Diabetes mellitus occurrence is not trended
Ha: Type I Diabetes mellitus occurrence is trended
Level of significance α = 0.05
11
Test statistic
 1
6
1 2
2



nn
dt
sr
Where yt: Type II diabetes cases
3.5.1.3. Trend fitting for Type I Diabetes and forecast
A trend will be fitted for T1D cases which will be used to make forecast for the next 10 years.
A regression least square method will be used to fit the trend.
Үb = α + βTt + et
Where α: a constant independent of time changes
β: effect of changes in time t
et: error term
Yb: T1D cases which is the dependent variable
Tt: Time in years which is the independent variable
3.5.1.4. Trend fitting for Type II Diabetes and forecast
A trend will be fitted for Type I Diabetes cases which will be used to make forecast for the
next 10 years. A regression least square method will be used to fit the trend.
Үa = α + βTt + et
Where α: a constant independent of time changes
β: effect of changes in time t
et: error term
Ya: T2D cases which is the dependent variable
Tt: Time in years which is the independent variable
3.5.1.5. Estimation of the Type I Diabetes trend model
Estimation of the trend model will be done as follows:
Db = a + bTt
12
Where

























2
TT
YYTT
t
Bt
b
TY ba


For t= 1, 2,…, n
Db: estimated trend for T1D cases.
After fitting the above trend, forecast of T1D for the next 10 years will be done.
3.5.1.6. Estimation of the Type II Diabetes trend model
Estimation of the trend model will be done as follows:
Da = a + bTt
Where Da: estimated trend for T2D cases.
After fitting the above trend, forecast of T2D for the next 10 years will be done.
3.6. Challenges faced
The following challenges were encountered by the researcher while carrying out this research
project:
I. Writing such a project required data, however this data was confidential. Therefore
getting this secondary data about diabetes cases was not easy.
II. Time was another constraint as far as carrying out this research is concerned. Writing
at the same time studying several course units was not an easy one.
III. Limited resources needed to carry out this research, for instance transport fee to
Kirehe hospital was a tug of war.
13
CHAPTER FOUR
PRESENTATION, ANALYSIS AND INTERPRETATION OF FINDINGS
4.0. Introduction
In this chapter, data is presented, analysed and interpreted. Results are presented in various
tables and graphs for visual analysis and descriptive statistics. Poisson heterogeneity statistic
was used to carry out hypothesis testing for the study hypotheses stated in chapter one, from
which interpretations are made.
4.1. Descriptive statistics of diabetes mellitus
Figure 4 1: Diabetes mellitus cases for the period 2006-2015
From the above figure, the year 2013 indicates the highest number of diabetes mellitus cases
that were reported at Kirehe hospital, with a total number of 33 diabetes cases. This is
followed by 2012 with a total number of 29 diabetes cases reported. The least number of
diabetes cases reported at Kirehe hospital was in 2006 where 1 case was reported. The graph
further indicates that, diabetes mellitus cases increase over time, though the increase is not
steady. This is because from 2006 to 2013, diabetes reported cases are seen to be increasing,
however beyond 2013, there is a decrease in diabetes mellitus cases.
1
4
11
14
19 19
29
33
26
24
0
10203040
2006 2008 2010 2012 2014
Years
Source: Compiled by the Researcher
DIABETES MELLITUS CASES FOR THE PERIOD 2006-2015
14
4.1.1. Diabetes mellitus by Type
Table 4 1: Diabetes mellitus distribution by type
Type Frequency Percentage
Type I 5 2.78
Type II 175 97.22
Total 180 100
Source: Compiled by the Researcher
Table 4.0 above shows the distribution of diabetes by type as reported in Kirehe hospital.
According to the results, the majority of the patients (97.22%) had Type II diabetes mellitus
while the remaining patients (2.78%) had Type I diabetes.
4.1.2. Diabetes cases with respect to Age
Table 4 2: Percentage distribution of diabetes mellitus by age
Age groups Frequency Percentage
Below 14 2 1.1
14-35 27 15.00
Above 35 151 83.89
Total 180 100
Source: Compiled by the Researcher
From the table 4.1 above, majority of diabetes mellitus cases for the period 2006-2015 in
Kirehe hospital (83.89%) were above 35 years of age, followed by the youth (15%) then
lastly by those below 14 years of age (1.1%).
15
4.2. Bivariate Analysis of diabetes mellitus
4.2.1. Diabetes type in relation to sex
Table 4 3: Cross tabulation of sex by type of diabetes: Chi-square
Sex Type
Type I Type II
Total
Female 4 91
4.21 95.79
80.00 52.00
95
100.00
52.78
Male 1 84
1.18 98.82
20.00 48.00
85
100.00
47.22
Total 5 175
2.78 97.22
100.00 100.00
180
100.00
100.00
Pearson chi2(1) = 1.53
Pr = 0.216
Fisher’s exact = 0.372
From the table 4.2 above, there is a significant evidence of relationship between sex and type
of diabetes (p < 0.05).
4.2.2. Diabetes type in relation to age groups
Table 4 4: Cross tabulation of age groups by type of diabetes: Chi-square
Age groups Type
Type I Type II
Total
Below 14 2 0
100.00 0.00
40.00 0.00
2
100.00
1.11
14-35 3 24
11.11 88.89
60.00 13.71
27
100.00
15.00
Above 35 0 151
0.00 100.00
0.00 86.29
151
100.00
83.89
Total 5 175
2.78 97.22
100.00 100.00
180
100.00
100.00
Fisher’s exact = 0.372
From table 4.3 above, there is a significant evidence of relationship between age groups and
type of diabetes (p < 0.05).
16
4.3. Hypothesis testing
In testing hypotheses, the Daniels test statistic was used. The rs of Daniels test was calculated
and then compared with 0.05 as the p-value. If the computed r was greater than the tabulated
rα/2, the researcher rejected the null hypothesis and if the value of the computed r was found
to be less or equal to the tabulated rα/2, the researcher failed to reject the null hypothesis.
4.3.1. Research hypothesis one
HO: Diabetes mellitus for females is not trended
Ha: Diabetes mellitus for females is trended
Calculation;
Table 4 5: Female Diabetes mellitus cases (yt) in Kirehe hospital
T yt Rank of yt dt dt
2
1 1 1 0 0
2 2 2 0 0
3 6 3.5 -0.5 0.25
4 6 3.5 1.5 2.25
5 10 6 -1 1
6 10 6 0 0
7 19 10 -3 9
8 13 8 0 0
9 18 9 0 0
10 10 6 4 16
∑dt
2
28.5
 1
6
1 2
2



nn
dt
sr =  
8273.0
110010
5.28*6
1 


r0.025 = 0.648
Since the computed rcalculated = 0.8273>0.648, the null hypothesis was rejected. The researcher
therefore, concluded that diabetes for females is trended.
17
4.3.2. Research hypothesis two
HO: Diabetes mellitus for males is trended
Ha: Diabetes mellitus for males is not trended
Calculation;
Table 4 6: Male Diabetes mellitus cases (yt) in Kirehe hospital
T yt Rank of yt dt dt
2
1 0 1 0 0
2 2 2 0 0
3 5 3 0 0
4 8 4.5 -0.5 0.25
5 9 6.5 -1.5 2.25
6 9 6.5 -0.5 0.25
7 10 8 -1 1
8 20 10 -2 4
9 8 4.5 4.5 20.25
10 14 9 1 1
∑dt
2
29
 1
6
1 2
2



nn
dt
sr =
  82424.0
11010
29*6
1 2



r0.025 = 0.648
From the above calculations, rcalculated = 0.82424 > 0.648, the null hypothesis was rejected,
thus male diabetes mellitus cases are trended.
18
4.3.3. Research hypothesis three
HO: Type II diabetes time series is not trended
Ha: Type II diabetes time series is trended
Calculation;
Table 4 7: Type II Diabetes mellitus cases (yt) in Kirehe hospital
T yt Rank of yt dt dt
2
1 1 1 0 0
2 4 2 0 0
3 11 3 0 0
4 14 4 0 0
5 18 5 0 0
6 19 6 0 0
7 28 9 -2 4
8 33 10 -2 4
9 26 8 1 1
10 21 7 3 9
∑dt
2
18
 1
6
1 2
2



nn
dt
sr =
  89091.0
11010
18*6
1 2



r0.025 = 0.648
From the above calculations, rcalculated = 0.89091>0.648, the null hypothesis was rejected, thus
type II diabetes mellitus cases are trended.
19
4.3.3. Research hypothesis four
HO: Type I diabetes time series is not trended
Ha: Type I diabetes time series is trended
Calculation;
Table 4 8: Type I Diabetes mellitus cases (yt) in Kirehe hospital
T yt Rank of yt dt dt
2
1 0 4 -3 9
2 0 4 -2 4
3 0 4 -1 1
4 0 4 0 0
5 1 8.5 -3.5 12.25
6 0 4 2 4
7 1 8.5 -1.5 2.25
8 0 4 4 16
9 0 4 5 25
10 3 10 0 0
∑dt
2
73.5
 1
6
1 2
2



nn
dt
sr =
  5545.0
11010
5.73*6
1 2



r0.025 = 0.648
From the above calculations, rtabulated = 0.5545 <0.648, the null hypothesis was accepted, thus
type I diabetes mellitus cases are not trended therefore showing support for stationarity.
4.4. Fitting Trends and forecasting for diabetes mellitus
Least square regression method was used in fitting the required trends.
4.4.1. Trend fitting for Type I diabetes
Before fitting the trend for Type I diabetes, a plot of Type I diabetes cases was done to
determine the nature of the trend as shown in figure 4.3. The figure predicts that there is an
upward trend of type I diabetes mellitus from the year 2012 to 2015.
20
Figure 4 2: Trend of Type I diabetes cases in Kirehe hospital (2006-2015)
Estimation of the trend
Db = a + bTt
Table 4.9: Table used to fit the trend for Type I diabetes
Db Coefficient T P>|t|
T 2 2.31 0.260
Constant 2009 1211.47 1987.929
Source: Developed from STATA by the researcher
R2
= 0.8421 (obtained from STATA)
The model results showed that the coefficient of determination R2
= 0.8421, this indicates a
very good fit of the model.
The trend below was then fitted using results from table 4.4
Db = 2009 + 2Tt
1
1.5
2
2.5
3
2006 2008 2010 2012 2014 2016
year
Source: Compiled by the Researcher
Trend of Type I diabetes mellitus cases for the period 2006-2015
21
From the above fitted trend, it is evident that there is a positive relationship between Type I
diabetes mellitus and time since the coefficient b = 2 is positive. This means that as the time
T increases, Type I diabetes cases also increase by the factor 2. The constant a = 2009 means
that at time T = 0, Type I diabetes cases were about 2009.
4.4.1.1. Forecast for Type I diabetes mellitus
Forecast for the next 10 years was done using the fitted trend. The results are as follows.
Table 4.10: Forecasting for Type I diabetes mellitus for the years 2016-2025
Year (Time) No. of type I cases
2016 2031
2017 2033
2018 2035
2019 2037
2020 2039
2021 2041
2022 2043
2023 2045
2024 2047
2025 2049
Source: Compiled by the Researcher
From the above table, type I diabetes cases are estimated to be increasing over the next 10
years. By 2025, Type I diabetes cases are estimated to be approximately 2,049.
4.4.2. Trend fitting for Type II diabetes
Before fitting the trend for Type II diabetes, a plot of Type II diabetes cases was done to
determine the nature of the trend as shown in figure 4.4. The figure predicts that there is an
upward trend of type I diabetes mellitus from the year 2006 to 2013.
22
Figure 4. 3: Trend of type II diabetes cases for the period 2006-2015
Estimation of the trend
Da = a + bTt
Table 4. 11: Table used to fit the trend for Type II diabetes
Da Coefficient T P>|t|
T .2572636 5.02 0.001
Constant 2005.998 1956.45 0.000
Source: Developed from STATA by the researcher
0
10203040
2006 2008 2010 2012 2014 2016
year
Source: Compiled by the Researcher
Trend of Type II diabetes mellitus cases for the period 2006-2015
23
R2
= 0.7593 (From STATA)
From the results, the coefficient of determination R2
= 0.7593, shows a good fit the sample
observation.
The results also show that the p-values of the constant (0.001) and the independent variable
(0.001) are significant at 0.05.
The estimated trend for Type II diabetes is therefore stated below;
Da = 2005.998 + 0.2573Tt
From the above estimated Type II diabetes trend, it means that there is a positive relationship
between Type II diabetes and time. The increase in time T increases Type II diabetes cases by
.2573 and the constant means that at T=0, Type II diabetes cases were about 2006 cases.
4.4.2.1. Forecast for Type II diabetes
Forecast for the next 10 years was done using the fitted trend. The results are as follows.
Table 4.12: Forecasting for Type I diabetes mellitus for the years 2016-2025
Year (Time) No. of type I cases
2016 2008.828
2017 2009.086
2018 2009.343
2019 2009.6
2020 2009.858
2021 2010.115
2022 2010.372
2023 2010.629
2024 2010.887
2025 2011.144
Source: Compiled by the Researcher
From Table 4.11, the number of type II diabetes cases is estimated to be about 2011.144 by
the year 2025.
24
CHAPTER FIVE
SUMMARY, CONCLUSIONS AND RECOMMENDATIONS
5.0. Introduction
This chapter covers the summary, it further includes the conclusions based on the findings
from the study and presents the appropriate recommendations.
5.1. SUMMARY AND CONCLUSIONS
Findings from this research have highlighted a number of issues concerning diabetes mellitus
particularly type I and type II.
5.1.1. Type I diabetes mellitus
It was found out that Type I diabetes mellitus has been increasing over the past 10 years.
Results show that in 2005, Type I diabetes cases reported at Kirehe hospital were 1 as
compared to 2015 where 3 cases were reported.
The researcher found out that type I diabetes is prevalent in females as compared to males.
Results from the study showed that type I diabetes cases reported to Kirehe hospital were
80% for females as compared to 20% for males. This means that females are highly affected
by this non-communicable disease.
The researcher also found out that there is a statistical evidence of relationship between age
groups and type of diabetes. Those above 35 years of age accounted for 83.89% of all
diabetes cases which is more than the rest of the age groups.
The researcher found out that Type I diabetes mellitus occurrence is mainly among teenagers
and type I diabetes cases were 2.78% of the 185 cases of diabetes in Kirehe hospital for the
period 2006-2015.
When forecast for type I diabetes was done, results showed that by 2025, type I diabetes
cases in Kirehe hospital will be 2049.
25
5.1.2. Type II diabetes mellitus
Findings from the study showed that Type II diabetes was the main type of diabetes which
patients who went to Kirehe hospital suffered, that is 97.22%.
From 2006 to 2013, type II diabetes was increasing at an increasing rate, where in 2006; there
was 1 case while in 2013, there were 33 cases.
The researcher found out that type II diabetes was affecting females more than males, that is
52% of the total cases were female patients
Forecast for the next 10 years was done and results showed that by 2025, type II diabetes
cases in Kirehe hospital will be 2011.
5.2. RECOMMENDATIONS
The government of Rwanda should be given credit for finally giving non-communicable
diseases the attention they deserve-particularly the 4th
leading cause of death in the world,
which is the deadly diabetes mellitus.
However a lot has to be done as regards this disease. The following suggestions depending on
the findings have been recommended:
i. Many government policies have put much emphasis on treatment of diabetes
by providing the test strips, insulin to mention but a few. Nevertheless,
preventive care should be number one priority. People should be sensitised on
the importance of diet, the benefits of physical fitness and the side effects of
too much sugar in the body.
ii. Type II diabetes has been given much attention, results show that Type I
diabetes deserve attention too, since it attacks the young who are a big asset to
the country in terms of their productivity.
iii. Above 80% of diabetes patients are above 35 years of age. This is a threat
because majority are the bread winners of their families. Therefore the
government needs to do whatever it takes to curb down the increasing trend of
diabetes. One suggestion is to have a national weekly 2 hours’ time as the
sports time, this will make obese and fat people lose weight.
iv. Results of this research revealed that females are the most affected compared
to the males. Ministry of health therefore is advised to put up measures which
target females first. For example, providing free diabetes testing to all females.
26
APPENDIX: DATA COLLECTED FROM KIREHE HOSPITAL
sex age Year weight Type
female 54 2013 94 Type II
male 46 2010 63 Type II
male 76 2007 85 Type II
female 68 2007 76 Type II
male 69 2009 56 Type II
female 5 2010 Type I
male 66 2008 65 Type II
male 46 2009 60 Type II
male 57 2010 61 Type II
female 63 2009 51 Type II
female 85 2008 56 Type II
male 62 2008 70 Type II
female 56 2010 58 Type II
female 59 2008 42 Type II
female 51 2008 84 Type II
female 48 2010 54 Type II
male 42 2009 83 Type II
male 55 2008 67 Type II
female 38 2007 70 Type II
female 61 2008 62 Type II
female 75 2009 55 Type II
female 56 2009 48 Type II
male 28 2008 40 Type II
male 66 2009 74 Type II
female 29 2009 69 Type II
male 54 2010 89 Type II
female 53 2009 70 Type II
male 52 2009 53 Type II
male 63 2010 80 Type II
female 55 2010 66 Type II
female 42 2008 42 Type II
male 60 2009 108 Type II
male 60 2007 73 Type II
female 58 2010 56 Type II
male 79 2008 62 Type II
male 38 2009 63 Type II
male 51 2009 69 Type II
female 54 2008 66 Type II
female 25 2010 68 Type I
male 67 2010 72 Type II
27
female 66 2010 62 Type II
male 59 2010 72 Type II
female 42 2010 80 Type II
male 47 2010 68 Type II
male 54 2011 60 Type II
female 86 2011 44 Type II
male 51 2014 82 Type II
female 47 2011 65 Type II
male 34 2011 52 Type II
male 68 2011 59 Type II
female 71 2011 93 Type II
female 61 2011 90 Type II
male 73 2011 73 Type II
male 42 2011 66 Type II
male 66 2010 51 Type II
female 57 2011 69 Type II
female 63 2011 86 Type II
female 47 2011 51 Type II
male 53 2011 71 Type II
male 47 2011 62 Type II
female 48 2009 84 Type II
female 62 2012 90 Type II
female 74 2012 40 Type II
female 52 2012 82 Type II
female 74 2012 70 Type II
male 26 2012 61 Type II
female 54 2010 72 Type II
female 32 2011 82 Type II
female 71 2011 40 Type II
female 61 2012 54 Type II
female 54 2012 72 Type II
female 21 2012 60 Type I
male 60 2012 63 Type II
male 22 2012 54 Type I
female 67 2006 93 Type II
female 81 2012 41 Type II
female 43 2012 87 Type II
female 74 2012 39 Type II
female 74 2012 59 Type II
female 47 2012 64 Type II
female 39 2012 85 Type II
male 71 2012 52 Type II
female 46 2012 65 Type II
male 46 2012 Type II
male 66 2012 99 Type II
28
female 51 2012 78 Type II
female 63 2012 78 Type II
female 79 2012 43 Type II
female 68 2012 69 Type II
male 43 2012 63 Type II
male 31 2012 52 Type II
male 18 2012 47 Type I
male 47 2012 75 Type II
female 67 2013 63 Type II
male 56 2013 77 Type II
female 64 2013 74 Type II
female 24 2012 55 Type I
male 74 2013 58 Type II
male 53 2013 68 Type II
male 38 2013 58 Type II
female 38 2013 54 Type II
male 39 2013 63 Type II
male 35 2011 60 Type II
female 62 2013 55 Type II
female 24 2013 58 Type I
male 43 2013 Type II
male 55 2013 58 Type II
male 42 2013 48 Type II
female 36 2013 61 Type II
male 64 2013 Type II
female 64 2013 80 Type II
male 56 2013 87 Type II
male 55 2013 72 Type II
female 54 2013 60 Type II
female 56 2013 56 Type II
male 43 2013 95 Type II
male 38 2013 57 Type II
male 34 2013 59 Type II
male 55 2013 52 Type II
male 63 2013 45 Type II
female 47 2013 63 Type II
male 55 2013 76 Type II
female 29 2013 60 Type II
female 56 2013 52 Type II
male 62 2013 65 Type II
male 37 2013 114 Type II
female 57 2014 65 Type II
male 60 2013 Type II
female 45 2014 78 Type II
male 59 2014 62 Type II
29
male 46 2014 72 Type II
female 38 2014 73 Type II
female 43 2014 57 Type II
female 35 2014 Type II
male 81 2014 65 Type II
male 56 2014 63 Type II
female 54 2014 55 Type II
female 58 2014 76 Type II
male 77 2014 80 Type II
female 48 2014 64 Type II
female 45 2014 67 Type II
female 54 2014 64 Type II
male 29 2014 55 Type II
female 48 2014 62 Type II
male 58 2014 Type II
female 56 2014 51 Type II
female 42 2014 58 Type II
male 49 2010 66 Type II
female 57 2014 59 Type II
female 67 2014 69 Type II
female 34 2014 66 Type II
female 37 2014 78 Type II
female 52 2011 45 Type II
female 25 2014 75 Type I
male 34 2015 76 Type II
female 37 2015 76 Type II
male 46 2015 48 Type II
male 25 2015 74 Type I
male 19 2015 48 Type I
female 49 2010 68 Type II
male 38 2011 61 Type II
male 69 2015 53 Type II
female 16 2015 42 Type I
female 39 2015 90 Type II
male 59 2015 55 Type II
male 52 2015 71 Type II
male 31 2015 78 Type II
female 54 2015 58 Type II
female 38 2015 54 Type II
female 42 2015 49 Type II
male 57 2015 Type II
male 46 2015 60 Type II
male 52 2015 85 Type II
female 19 2015 52 Type I
male 71 2015 84 Type II
30
female 48 2015 51 Type II
male 47 2015 61 Type II
female 15 2015 42 Type I
female 11 2015 34 Type I
male 19 2015 52 Type I
31
REFERENCES
Alemu, S., Dessie, A. and Seid, E., (2009): Insulin-requiring diabetes in rural Ethiopia:
should we reopen the case for malnutrition-related diabetes?Diabetologia, Volume 52,
pp1842-pp1845.
Beran, D., Yudkin, J.S., and Courten, M. (2005): Access to care for patients with insulin
requiring diabetes in developing countries: case studies of Mozambique and Zambia.
Diabetes Care, Volume 28, pp2136-pp2140.
Crispin, G. (2014): Diabetes care in Rwanda: Against all odds. Diabetes Voice, Volume
1, pp13-pp16.
Connor, H. and Boulton, A. J. M. (1989). Diabetes in Practice, Chichester: Wiley
Diabetes UK (2004): Website. www.diabetes.org
International Diabetes federation (2011): Global burden of diabetes. Diabetic atlas. 5th
edition, Brussels.
Kennedy, Peter. (2003): A guide to econometrics, Cambridge: MIT Press
Mauch, J.E., and Park, N. (2003): Guide to the successful thesis and dissertation: A
handbook for students and faculty. 5th edition. New York: Marcel Dekker.
Mbanya, J.C. (2014): The burden of type 2 diabetes mellitus in the African diaspora.
www.medscape.com
International Diabetes Federation (2003). Diabetes Atlas, 2nd edition, Brussels.
Gujjarati, D.N. (2008): Basic econometrics, 5th edition, Singapore: McGraw Hill
King, H., Aubert, R.E., and Herman, W.H. (2000): Global burden of diabetes: 1995-2025
prevalence, numerical estimates and projections. Diabetes Care, Volume 21, pp1414–
pp1431.
O’Connor, P.J., Crain, A.L., Rush, W.A., Hanson, A.M., Fisher, L.R., Kluznik, J.C.
(2009): Does diabetes double the risk of depression? Ann Fam Med, Volume 7, pp328-
pp335.
32
Otim, et al (1998): Guidelines for Non Communicable diseases at district level. Kampala:
MOH.
Peer, N., Kengne, A.P., Motala, A.A., Mbanya, J.C. (2014). Diabetes in the Africa region:
2013 update for the IDF diabetes Atlas. Diabetes Research Clinical Practice, Volume 103,
pp197–pp205.
Tuomilehto, J. (2001): Prevention of type 2 diabetes mellitus by changes in lifestyle
among subjects with impaired glucose tolerance. The New England journal of medicine,
Volume 344, pp1343-pp1350.
WHO (2012): Global status report on non-communicable diseases. Geneva: WHO.
WHO (2012): Global Health Estimates: Deaths by Cause, Age, Sex and Country, 2000-
2012. Geneva: WHO.

More Related Content

Viewers also liked

Baby Dental Care FAQ
Baby Dental Care FAQBaby Dental Care FAQ
Baby Dental Care FAQmcleandds
 
Curating and Sharing Relevant Content
Curating and Sharing Relevant ContentCurating and Sharing Relevant Content
Curating and Sharing Relevant ContentAdam Robinson, MBA
 
Jorge Guevara Trabajo Final-administracion y gestion publica-m roggero
Jorge Guevara Trabajo Final-administracion y gestion publica-m roggeroJorge Guevara Trabajo Final-administracion y gestion publica-m roggero
Jorge Guevara Trabajo Final-administracion y gestion publica-m roggeroJorge Guevara
 
Olivier Lavau-Wira's Guide to Raising Daughters
Olivier Lavau-Wira's Guide to Raising DaughtersOlivier Lavau-Wira's Guide to Raising Daughters
Olivier Lavau-Wira's Guide to Raising DaughtersOlivier Lavau-Wira
 
Reforma e concessão do estádio Magalhães Pinto
Reforma e concessão do estádio Magalhães PintoReforma e concessão do estádio Magalhães Pinto
Reforma e concessão do estádio Magalhães PintoMateus Generoso
 
Universidad del cauca (2)
Universidad del cauca (2)Universidad del cauca (2)
Universidad del cauca (2)dianitaosorio
 
眾包制的想像
眾包制的想像眾包制的想像
眾包制的想像edious
 
UTE Dificultades de aprendizaje Mayo 2016
UTE Dificultades de aprendizaje Mayo 2016UTE Dificultades de aprendizaje Mayo 2016
UTE Dificultades de aprendizaje Mayo 2016Elizabeth Romero
 

Viewers also liked (12)

Disney
DisneyDisney
Disney
 
Baby Dental Care FAQ
Baby Dental Care FAQBaby Dental Care FAQ
Baby Dental Care FAQ
 
Curating and Sharing Relevant Content
Curating and Sharing Relevant ContentCurating and Sharing Relevant Content
Curating and Sharing Relevant Content
 
Mayo clinic
Mayo clinicMayo clinic
Mayo clinic
 
Jorge Guevara Trabajo Final-administracion y gestion publica-m roggero
Jorge Guevara Trabajo Final-administracion y gestion publica-m roggeroJorge Guevara Trabajo Final-administracion y gestion publica-m roggero
Jorge Guevara Trabajo Final-administracion y gestion publica-m roggero
 
Sudhakar_Resume
Sudhakar_ResumeSudhakar_Resume
Sudhakar_Resume
 
Olivier Lavau-Wira's Guide to Raising Daughters
Olivier Lavau-Wira's Guide to Raising DaughtersOlivier Lavau-Wira's Guide to Raising Daughters
Olivier Lavau-Wira's Guide to Raising Daughters
 
Reforma e concessão do estádio Magalhães Pinto
Reforma e concessão do estádio Magalhães PintoReforma e concessão do estádio Magalhães Pinto
Reforma e concessão do estádio Magalhães Pinto
 
Udaan
UdaanUdaan
Udaan
 
Universidad del cauca (2)
Universidad del cauca (2)Universidad del cauca (2)
Universidad del cauca (2)
 
眾包制的想像
眾包制的想像眾包制的想像
眾包制的想像
 
UTE Dificultades de aprendizaje Mayo 2016
UTE Dificultades de aprendizaje Mayo 2016UTE Dificultades de aprendizaje Mayo 2016
UTE Dificultades de aprendizaje Mayo 2016
 

Similar to Final work

Effects of Implementation HIV and AIDs policy in Higher Learning Institutions...
Effects of Implementation HIV and AIDs policy in Higher Learning Institutions...Effects of Implementation HIV and AIDs policy in Higher Learning Institutions...
Effects of Implementation HIV and AIDs policy in Higher Learning Institutions...Gabriel Lubale
 
Maths survey
Maths surveyMaths survey
Maths surveyxennechau
 
Maths survey (assignment 2)
Maths survey (assignment 2)Maths survey (assignment 2)
Maths survey (assignment 2)Shze Hwa Lee
 
Public awareness of diabetes mellitus in klang district, selangor
Public awareness of diabetes mellitus in klang district, selangorPublic awareness of diabetes mellitus in klang district, selangor
Public awareness of diabetes mellitus in klang district, selangorpharmaindexing
 
Factors Hindering Adolescents from Utilizing Reproductive Health Services in ...
Factors Hindering Adolescents from Utilizing Reproductive Health Services in ...Factors Hindering Adolescents from Utilizing Reproductive Health Services in ...
Factors Hindering Adolescents from Utilizing Reproductive Health Services in ...PUBLISHERJOURNAL
 
statistical research report
statistical research reportstatistical research report
statistical research reportsalim msalilwa
 
statistical research report
statistical research reportstatistical research report
statistical research reportsalim msalilwa
 
Presentation1.pptx
Presentation1.pptxPresentation1.pptx
Presentation1.pptxAbdikani12
 
research proposal final
research proposal  finalresearch proposal  final
research proposal finalRabia Bashir
 
An analysis of uptake in hiv voluntary counselling and testing services case ...
An analysis of uptake in hiv voluntary counselling and testing services case ...An analysis of uptake in hiv voluntary counselling and testing services case ...
An analysis of uptake in hiv voluntary counselling and testing services case ...Alexander Decker
 
A study of lifestyle of women in breast cancer in kailash cancer hospital and...
A study of lifestyle of women in breast cancer in kailash cancer hospital and...A study of lifestyle of women in breast cancer in kailash cancer hospital and...
A study of lifestyle of women in breast cancer in kailash cancer hospital and...Samit Shah
 
NHS International Health Links – what difference can we make? (the Lusaka-Bri...
NHS International Health Links – what difference can we make? (the Lusaka-Bri...NHS International Health Links – what difference can we make? (the Lusaka-Bri...
NHS International Health Links – what difference can we make? (the Lusaka-Bri...Institute of Development Studies
 
Mathematics statistics report
Mathematics statistics reportMathematics statistics report
Mathematics statistics reportWei Shuen Loh
 
School based rh program evaluation report the case of hawassa
School based rh program evaluation report the case of hawassaSchool based rh program evaluation report the case of hawassa
School based rh program evaluation report the case of hawassaFikru Tessema
 
Mathematics statistic report
Mathematics statistic reportMathematics statistic report
Mathematics statistic reportChong Teo
 
Stats diabetes report
Stats diabetes reportStats diabetes report
Stats diabetes reportShaunGor
 
Adolescent Pregnancy & Maternal Morbidity in Bangladesh
Adolescent Pregnancy & Maternal Morbidity in Bangladesh Adolescent Pregnancy & Maternal Morbidity in Bangladesh
Adolescent Pregnancy & Maternal Morbidity in Bangladesh Dr. Syeda Zerin Imam, BDS, MPH
 

Similar to Final work (20)

Effects of Implementation HIV and AIDs policy in Higher Learning Institutions...
Effects of Implementation HIV and AIDs policy in Higher Learning Institutions...Effects of Implementation HIV and AIDs policy in Higher Learning Institutions...
Effects of Implementation HIV and AIDs policy in Higher Learning Institutions...
 
Maths survey
Maths surveyMaths survey
Maths survey
 
Maths survey
Maths surveyMaths survey
Maths survey
 
Maths survey (assignment 2)
Maths survey (assignment 2)Maths survey (assignment 2)
Maths survey (assignment 2)
 
Public awareness of diabetes mellitus in klang district, selangor
Public awareness of diabetes mellitus in klang district, selangorPublic awareness of diabetes mellitus in klang district, selangor
Public awareness of diabetes mellitus in klang district, selangor
 
Factors Hindering Adolescents from Utilizing Reproductive Health Services in ...
Factors Hindering Adolescents from Utilizing Reproductive Health Services in ...Factors Hindering Adolescents from Utilizing Reproductive Health Services in ...
Factors Hindering Adolescents from Utilizing Reproductive Health Services in ...
 
10.1007 s10447 011-9143-3
10.1007 s10447 011-9143-310.1007 s10447 011-9143-3
10.1007 s10447 011-9143-3
 
statistical research report
statistical research reportstatistical research report
statistical research report
 
statistical research report
statistical research reportstatistical research report
statistical research report
 
Presentation1.pptx
Presentation1.pptxPresentation1.pptx
Presentation1.pptx
 
research Proposal
research Proposalresearch Proposal
research Proposal
 
research proposal final
research proposal  finalresearch proposal  final
research proposal final
 
An analysis of uptake in hiv voluntary counselling and testing services case ...
An analysis of uptake in hiv voluntary counselling and testing services case ...An analysis of uptake in hiv voluntary counselling and testing services case ...
An analysis of uptake in hiv voluntary counselling and testing services case ...
 
A study of lifestyle of women in breast cancer in kailash cancer hospital and...
A study of lifestyle of women in breast cancer in kailash cancer hospital and...A study of lifestyle of women in breast cancer in kailash cancer hospital and...
A study of lifestyle of women in breast cancer in kailash cancer hospital and...
 
NHS International Health Links – what difference can we make? (the Lusaka-Bri...
NHS International Health Links – what difference can we make? (the Lusaka-Bri...NHS International Health Links – what difference can we make? (the Lusaka-Bri...
NHS International Health Links – what difference can we make? (the Lusaka-Bri...
 
Mathematics statistics report
Mathematics statistics reportMathematics statistics report
Mathematics statistics report
 
School based rh program evaluation report the case of hawassa
School based rh program evaluation report the case of hawassaSchool based rh program evaluation report the case of hawassa
School based rh program evaluation report the case of hawassa
 
Mathematics statistic report
Mathematics statistic reportMathematics statistic report
Mathematics statistic report
 
Stats diabetes report
Stats diabetes reportStats diabetes report
Stats diabetes report
 
Adolescent Pregnancy & Maternal Morbidity in Bangladesh
Adolescent Pregnancy & Maternal Morbidity in Bangladesh Adolescent Pregnancy & Maternal Morbidity in Bangladesh
Adolescent Pregnancy & Maternal Morbidity in Bangladesh
 

Final work

  • 1. i A TIME SERIES ANALYSIS OF DIABETES CASES IN RWANDA FOR THE PERIOD 2006-2015: A CASE STUDY OF KIREHE HOSPITAL BY KAYITARE ERICK 13/U/6395/EVE SUPERVISOR: ASS.PROFESSOR L.K. ATUHAIRE A DISSERTATION SUBMITTED TO THE SCHOOL OF STATISTICS AND PLANNING IN PARTIAL FULFILMENT OF THE REQUIREMENTS FOR THE AWARD OF DEGREE OF BACHELOR OF SCIENCE IN QUANTITATIVE ECONOMICS OF MAKERERE UNIVERSITY KAMPALA JUNE 2016
  • 2. i DECLARATION I, KAYITARE ERICK, declare that this work is original and has never been presented to any institution of higher learning or organization by any person for the award of any qualification. Signature ……………………… Date …. /…./……. KAYITARE ERICK Student Signature ………………………. Date …. /…../……. ASS.PROF. L.K. ATUHAIRE Supervisor
  • 3. ii DEDICATION I dedicate this piece of work to my mother Kayitesi and my grandmother Mukangira who are both victims of Type II diabetes mellitus.
  • 4. iii ACKNOWLEDGEMENTS My Lord and God! You are worthy to receive glory, honour, and power. For you created all things. Had it not been for your Grace, this report would not be a success. Boundless and ecstatic thanks to many who in one way or the other assisted in the preparation of this report. First and foremost, to Bushayija’s family, Safi’s family and lesavant family for their unstinting encouragement, support and cheer-leading. This journey has been an interesting one, many mountains and valleys, which in turn have made me a better and strong person. Many thanks to my supervisor Assoc.Prof. L.K. Atuhaire, a senior lecturer at the SSP for his outstanding tireless dedication of time since the beginning of this research to its completion. Every time I went to his office, my whole brain could function at its best because I was always challenged by his questions. Honestly, if it were not for his constructive criticisms, comments and corrections, this research would have been impossible. I take this wonderful opportunity to thank the SSP teaching staff for the knowledge they have been giving me way back in 2013 to date. Heartfelt thanks go to the dean of SSP-Assoc.Prof.Robert Wamala for igniting my love for data analysis, today am a proud teacher of the same subject. In a special way, I am really grateful to Kirehe hospital especially Mr.Cyprien who helped me to get all the data I needed for this research project. I highly believe that this research will be of much help to the same hospital. A vote of thanks to my dearest friends, fellow gallant makererians, crème de la crème, the entire RAW discussion group for the cooperation and teamwork we had for three years. Whenever I was around Wadada Robert, Okello Milton, Sanoni Isabirye, Brigitte, Amanda and others, my fear of the hard course units like stochastic modelling would vanish immediately, because these great people always had the right information. Finally, I want to thank everyone who has been with me for this undergraduate course, indirectly or directly. I must say, am humbled for having met you, in one way or the other, we helped each other, supported each other, strangers became brothers and sisters while others followed in the steps of Adam and Eve, all this made life at MUK interesting. About learning, this is what my role model Jim Rohn said: “Learning is the beginning of wealth. Learning is the beginning of health. Learning is the beginning of spirituality. Searching and learning is where the miracle process all begins.”
  • 5. iv ABSTRACT This study of Time series analysis of diabetes mellitus was carried out in Kirehe hospital which is located in Eastern Rwanda, Kirehe district. The main objective of the study was to carry out a time series of diabetes mellitus in Rwanda. In this study, secondary data was collected from the Hospital’s data records on diabetes mellitus with respect to age, sex, age groups and type of diabetes. Data collected was thereafter entered, analysed using Ms-Excel and Stata and tests of hypotheses by the use of Daniels test test at 95% confidence level were done to determine whether there was a trend in both types of diabetes, also trend testing was done on both male patients and female patients. Finally trends were fitted to forecast diabetes mellitus cases for the next 10 years. The results from the study revealed that the year 2013 had the highest number of diabetes cases, 33 patients which accounted for 18.33%. Results also revealed that Type II diabetes mellitus was the most common type of diabetes with 97.22% prevalence levels for the period 2006-2015. The most affected age group was that of 35 years of age and above which accounted for 83.89% of the overall diabetes mellitus incidence. This research revealed that diabetes mellitus cases for females or the series was trended with 95% confidence level. The researcher also failed to reject the null hypothesis that diabetes mellitus occurrence for males is not trended, he therefore concluded with 95% confidence that the data was trended, in the same vein, type II diabetes mellitus cases were found to be trended. Surprisingly, type I diabetes mellitus cases showed signs of stationarity with 95% confidence level. The researcher found out that both type I and type II diabetes mellitus were estimated to be increasing over the next 10 years. By 2025, the former was estimated to be 2049 cases while the latter was estimated to be 2011 cases. The researcher made four recommendations namely; priority should be preventive care, where physical exercises and diet should be among top priorities in order to avoid this deadly non-communicable disease. Second, the researcher went ahead to call for attention on type I diabetes mellitus which was found to be increasing at an increasing rate especially among the young people. Further still, much attention and support is needed to people aged 35 and above. This is because, results revealed that 80% diabetes cases were among those aged 35 years and above. Lastly, the researcher recommended Ministry of health and the government of Rwanda in general to put up measures against diabetes mellitus by targeting females first since they are the most affected gender.
  • 6. v LIST OF ABBREVIATIONS DM: Diabetes Mellitus MoH: Ministry of Health MUK: Makerere University Kampala NCD: Non-communicable disease SSP: School of Statistics and Planning T1D: Type I diabetes T2D: Type II diabetes WHO: World Health Organization
  • 7. vi TABLE OF CONTENTS DECLARATION........................................................................................................................i DEDICATION...........................................................................................................................ii ACKNOWLEDGEMENTS..................................................................................................... iii ABSTRACT..............................................................................................................................iv LIST OF ACRONYMS .............................................................................................................v TABLE OF CONTENTS..........................................................................................................vi LIST OF TABLES.....................................................................................................................x LIST OF FIGURES ..................................................................................................................xi CHAPTER ONE: INTRODUCTION....................................................................................1 1.1BACKGROUND TO THE STUDY.....................................................................................1 1.2. PROBLEM STATEMENT.................................................................................................2 1.3. OBJECTIVES OF THE STUDY........................................................................................3 1.3.1. Major objective...................................................................................................................3 1.3.2. Specific objectives………………………………………………………………………3 1.4. HYPOTHESES...................................................................................................................3 1.5. SCOPE AND COVERAGE OF THE STUDY ..................................................................4 1.6. SIGNIFICANCE OF THE STUDY....................................................................................4 CHAPTER TWO: LITERATURE REVIEW.......................................................................5 2.0. Introduction.........................................................................................................................5 2.1. Definition and facts about diabetes mellitus.......................................................................5 2.2. Epidemiology of diabetes mellitus......................................................................................5 2.3. Prevalence of diabetes mellitus...........................................................................................6 CHAPTER THREE: METHODOLOGY .............................................................................8 3.0. Introduction.........................................................................................................................8 3.1. Study population.................................................................................................................8 3.2.Nature and source of data ....................................................................................................8 3.3. Data collection procedure ...................................................................................................8 3.4. Data analysis procedure ......................................................................................................8 3.4.1. Descriptive statistics ......................................................................................................9 3.4.2. Bivariate analysis...........................................................................................................9
  • 8. vii 3.5. Analysis of Diabetes mellitus cases...................................................................................9 3.5.1. Analysis of diabetes mellitus cases for females............................................................9 3.5.2. Analysis of diabetes mellitus cases for males.............................................................10 3.5.3. Analysis of type II diabetes cases ...............................................................................10 3.5.3.1. Trend fitting for Type II Diabetes and forecast ......................................................11 3.5.3.2. Estimation of the Type II Diabetes trend model.....................................................12 3.5.4. Analysis of type I diabetes cases .................................................................................10 3.5.4.1. Trend fitting for Type I Diabetes and forecast........................................................11 3.5.4.2. Estimation of the Type I Diabetes trend model ......................................................11 3.6. Challenges faced ...............................................................................................................12 CHAPTER FOUR..................................................................................................................13 PRESENTATION, ANALYSIS AND INTERPRETATION OF FINDINGS .................13 4.0. Introduction.......................................................................................................................13 4.1. Descriptive statistics of diabetes mellitus.........................................................................13 4.1.1. Diabetes mellitus by Type .........................................................................................14 4.1.2. Diabetes cases with respect to Age............................................................................14 4.2. Bivariate Analysis of diabetes mellitus.............................................................................15 4.2.1. Diabetes type in relation to sex..................................................................................15 4.2.2. Diabetes type in relation to age groups......................................................................15 4.3. Hypothesis testing.............................................................................................................16 4.3.1. Research hypothesis one............................................................................................16 4.3.2. Research hypothesis two............................................................................................17 4.3.3. Research hypothesis three..........................................................................................18 4.3.3. Research hypothesis four...........................................................................................19 4.4. Fitting Trends and forecasting for diabetes mellitus.........................................................19 4.4.1.1. Trend fitting for Type I diabetes.............................................................................19 4.4.1.2. Forecast for Type I diabetes mellitus......................................................................21 4.4.2.1. Trend fitting for Type II diabetes............................................................................21 4.4.2.2. Forecast for Type II diabetes ..................................................................................23 CHAPTER FIVE ...................................................................................................................24 SUMMARY, CONCLUSIONS AND RECOMMENDATIONS .......................................24 5.0. Introduction.......................................................................................................................24 5.1. SUMMARY AND CONCLUSIONS ...............................................................................24 5.1.1. Type I diabetes mellitus.............................................................................................24 5.1.2. Type II diabetes mellitus............................................................................................25
  • 9. viii 5.2. RECOMMENDATIONS..................................................................................................25 APPENDIX: DATA COLLECTED FROM KIREHE HOSPITAL........................................26 REFERENCES ........................................................................................................................31
  • 10. ix
  • 11. x LIST OF TABLES Table 4. 1: Diabetes mellitus distribution by type ...................................................................14 Table 4. 2: Percentage distribution of diabetes mellitus by age ..............................................14 Table 4.3: Cross tabulation of sex by type of diabetes: Chi-square.........................................15 Table 4. 4: Cross tabulation of age groups by type of diabetes: Chi-square ...........................15 Table 4 .5: Female Diabetes mellitus cases (yt) in Kirehe hospital .........................................16 Table 4 .6: Male Diabetes mellitus cases (yt) in Kirehe hospital.............................................17 Table 4. 7: Type II Diabetes mellitus cases (yt) in Kirehe hospital.........................................18 Table 4. 8: Type I Diabetes mellitus cases (yt) in Kirehe hospital ..........................................19 Table 4 .9: Table used to fit the trend for Type I diabetes.......................................................20 Table 4 .10: Forecasting for Type I diabetes mellitus for the years 2016-2025 ......................21 Table 4. 11: Table used to fit the trend for Type II diabetes ...................................................22 Table 4 .12: Forecasting for Type I diabetes mellitus for the years 2016-2025 ......................23
  • 12. xi LIST OF FIGURES Figure 4 .1: Diabetes mellitus cases for the period 2006-2015................................................13 Figure 4. 2: Trend of Type I diabetes cases in Kirehe hospital (2006-2015) ..........................20 Figure 4. 3: Trend of type II diabetes cases for the period 2006-2015....................................22
  • 13. 1 CHAPTER ONE: INTRODUCTION 1.1. BACKGROUND TO THE STUDY Around 1990’s, many people were suffering from diabetes without knowing, it was worse when doctors told someone that they had failed to diagnose the problem. Such innocent people resorted to herbal medicine while others went as far as consulting witch doctors. However, around early 2000’s, the truth came to surface and it was none other than the deadly diabetes mellitus-as scientists call it. Measures were put across in order to avoid getting this disease. People started to be diet-conscious; less sugar was taken and for the first time, edible salt and cooking oil could be measured carefully before cooking. In general, it was an awakening moment. Diabetes mellitus is one of the most common non-communicable diseases globally. It is said to be the fourth or fifth leading cause of death in most developed countries and is epidemic in many developing and newly industrialized nations. Many complications from diabetes include stroke, amputations, peripheral neuropathy, foot ulcer, cataracts and albuminuria. Diabetes is regarded as one of the most challenging health problems in the 21st century (International Diabetes Federation, 2003). Diabetes mellitus is basically of two types: Type I diabetes or Insulin Dependent Diabetes Mellitus (IDDM) or juvenile diabetes and Type II diabetes or Non-Insulin-Dependent Diabetes Mellitus (NIDDM) or adult onset diabetes. Type I diabetes, is primarily a disease of the pancreas. It results when the pancreas produces insufficient amounts of insulin to meet the body’s needs. A Type I diabetic patient needs daily injections of insulin to live, hence the name IDDM. It develops most often in children and young adults, but the disorder can appear at any age. Type II diabetes, is a disease of insulin function and it is the most common form. Subjects with this type present with measurable quantities of insulin in the blood, and sometimes, as in obesity, the insulin levels are relatively high. This insulin is however ineffective because of the insensitivity of target tissues to its action. About 90 to 95 percent of people with diabetes have Type II diabetes. This form of diabetes usually develops in adults over the age of 40 and is most common among adults over age55. About 80 percent of people with Type II diabetes are overweight. Type II diabetes is often part of a metabolic syndrome that includes obesity, elevated blood pressure, and high levels of blood lipids. Unfortunately, as more children and adolescents become overweight, Type II diabetes is becoming more common in young people (International Diabetes Federation [IDF], 2001).
  • 14. 2 Diabetes mellitus is widespread throughout the world. In 1985, the World Health Organization noted that diabetes mellitus affects more than 30 million people worldwide (WHO, 1985). In many countries, it is now the leading cause of death, disability and high health care costs. It is noted that approximately 177 million people are now diagnosed with diabetes worldwide and around 4 million deaths every year are attributable to its complications (WHO, 2000). Rwanda is one of the 32 countries of the International Diabetes Federation Africa (IDF AFR) region. 387 million people have diabetes in the world and more than 22 million people in the AFR region; by 2035 this figure will almost double. There were 299,100 cases of Diabetes in Rwanda in 2014 (Gishoma, 2014). This non-communicable disease did not spare my family. Currently, many family members have this disease—six in total, including my lovely mother. I believe that all problems have solutions; it may take many years or centuries, but if we keep searching for the solution, we will eventually find it. As a quantitative economics student, I want to be part of the team looking for the solution to this problem-by providing the necessary quantitative data in order to make informed decisions. 1.2. PROBLEM STATEMENT Diabetes mellitus is a growing problem worldwide with rising prevalence rates, including in sub-Saharan Africa. The global rise in type 2 diabetes is occurring fastest in developing countries. This is all compounded by the fact that as many as 50% of people with diabetes are yet to be diagnosed (International Diabetes Federation, 2003). Alemu (2009) points out that the burden of non-communicable diseases is increasing rapidly. He argues that such diseases have a high cost of management and yet they can be prevented and controlled using simple and cost effective means by targeting their risk factors. In Rwanda, Non-communicable diseases (NCDs)—probably accounting for about 25% of the national burden of disease—have yet to be addressed in a strategic and systematic way. These diseases include cardiovascular disease, cancer, epilepsy, pulmonary disease, and diabetes, among others. These are global diseases and yet, more often than not, NCDs are thought to be problems of middle- and high-income countries. In such countries, risk factors for NCDs include obesity, tobacco use, and other factors termed poor lifestyle choices. However, in Rwanda and other developing countries, this is not the case. NCDs are instead linked to
  • 15. 3 malnutrition, infection, congenital abnormalities, and toxic environments. All of these factors are ultimately exacerbated by poverty (World Health Organization, 2008). A number of interventions are available to control the complications of diabetes mellitus, these include insulin therapy, dietary restrictions and physical exercises. However, no study has been conducted to address the problem of time series model which can help the Government and other concerned parties to make the necessary planning as far as diabetes mellitus is concerned. This study addresses this problem. 1.3. OBJECTIVES 1.3.1. Major objective The main objective of this study is to carry out a time series analysis of diabetes cases in Rwanda. 1.3.2. Specific objectives i. To estimate a time series model on the number of diabetes cases for type I diabetes. ii. To estimate a time series model on the number of diabetes cases for type II diabetes. iii. To fit trends and carry out forecasts for diabetes cases in the next 10 years. iv. To make a trend analysis of diabetic cases for males. v. To make a trend analysis of diabetic cases for females. 1.4. HYPOTHESES i. Diabetes mellitus occurrence for females is trended. ii. Diabetes mellitus occurrence for males is trended. iii. The type two diabetes time series is trended. iv. The type one diabetes time series is trended.
  • 16. 4 1.5. SCOPE AND COVERAGE OF THE STUDY The study will cover Type 1 and type 2 diabetes cases that were registered at Kirehe hospital for the period January 2006 to December 2015. The study will go beyond descriptive analysis to a time series analysis of Annual registration of Diabetes cases by various variables like gender, age, and type of diabetes. 1.6. SIGNIFICANCE OF THE STUDY Diabetes mellitus is a multi-system disorder. Its complications can involve any organ in the body. Some of these complications include visual impairment, cardiovascular disease, limb and brain damage, impotence, kidney failure, urinary tract and stroke. Because of its chronic nature, the severity of its complications and the means required to control them, diabetes is a costly disease, not only for the affected individual and his/her family, but also for the health authorities. The study will be of much relevance to the Government and Medical society at large who will use the model predictions to know how they can plan for the treatment, control and prevention of the disease and how much money the Government and its development partners will spend in future. The findings will help academicians, especially those interested in non- communicable diseases. It will furthermore be of use to the Ministry of Health of Rwanda which will be able to identify the most affected categories.
  • 17. 5 CHAPTER TWO: LITERATURE REVIEW 2.0. Introduction This chapter presents a review of the literature related to the study. Most of the literature presented here, concentrates on the epidemiology of diabetes mellitus, its control measures and various prevalence rates across the world. 2.1. Definition and facts about diabetes mellitus Diabetes mellitus is a growing public health affecting people worldwide both in developing and developed countries, and poses a major socio-economic challenge. A chronic metabolic disorder of multiple aetiologies is assuming epidemic proportions worldwide. It is also a complex disorder with profound consequences both acute and chronic. Genetic and environmental factors play a role in the development of the disease. The cells of the body cannot metabolise sugar properly due to a total or relative lack of insulin. The body then breaks down its own fat, protein, and glycogen to produce sugar resulting in high sugar levels in the blood with excess by products called ketones being produced by the liver. Diabetes causes disease in many organ systems, the severity of which may be related to how long the disease has been present and how well it has been controlled. The term diabetes mellitus describes a metabolic disorder of multiple aetiology characterised by chronic hyperglycaemia with disturbances of carbohydrate, fat, and protein metabolism resulting from defects in insulin secretion, insulin action or both (World Health Organization, 1999). 2.2. Epidemiology of diabetes mellitus It is estimated that 366 million people had DM in 2011; by 2030 this would have risen to 552 million. The number of people with type 2 DM is increasing in every country with 80% of people with DM living in low- and middle-income countries. DM caused 4.6 million deaths in 2011.It is estimated that 439 million people would have type 2 DM by the year 2030.The
  • 18. 6 incidence of type 2 DM varies substantially from one geographical region to the other as a result of environmental and lifestyle risk factors (Diabetic Atlas, 2011). Literature search has shown that there are few data available on the prevalence of type 2 DM in Africa as a whole. Studies examining data trends within Africa point to evidence of a dramatic increase in prevalence in both rural and urban setting, and affecting both gender equally (www.medscape.com). According to information from Diabetes Care, the majority of the DM burden in Africa appears to be type 2 DM, with less than 10% of DM cases being type 1 DM. A 2011 Centre for Disease Control and Prevention (CDC) report estimates that DM affects about 25.8 million people in the US (7.8% of the population) in 2010 with 90% to 95% of them being type 2 DM (Diabetes fact sheet, 2011). It is predicted that the prevalence of DM in adults of which type 2 DM is becoming prominent will increase in the next two decades and much of the increase will occur in developing countries where the majority of patients are aged between 45 and 64 years.It is projected that the latter will equal or even exceed the former in developing nations, thus culminating in a double burden as a result of the current trend of transition from communicable to non-communicable diseases (Global burden of chronic diseases, 2004). 2.3. Prevalence of diabetes mellitus The prevalence of diabetes has increased worldwide, including in Africa, where the greatest proportional increase (90%) in the number of diabetes cases is projected to occur by 2030. Type 2 diabetes (T2D) represents more than 90% of diabetes cases in Africa. The surge in T2D in Africa has been primarily attributed to environmental factors due to nutrition transition and urbanization that bring about lifestyle changes; however, current understanding of the pathophysiology of T2D in populations within Africa remains elusive. From observations among other populations around the world, it is obvious that T2D has a strong genetic component, as evidenced by a high concordance rate (70%) in monozygotic twins and the over 40% risk of having T2D for an offspring of a T2D patient. Unlike simple monogenic diseases, the pathophysiology of T2D involves most of the time an interaction of several common genetic risk factors of low penetrance with environmental factors. Hitherto, the vast majority of T2D-related risk alleles have been identified through genome-wide association studies, mostly conducted in European Descendants and Asian populations (Diabetes Research and Clinical Practice, 2014).
  • 19. 7 The excess global mortality attributable to diabetes in the year 2000 was estimated to be 2.9 million deaths, equivalent to 5.2% of all deaths. Excess mortality attributable to diabetes accounted for 2-3 % of deaths in poorest countries (Diabetes care, 2005). Diabetes is a serious illness with multiple complications and premature mortality accounting for at least 10 % of total health care expenditure in many countries. Diabetes is often perceived as a disease of affluent countries. A serious chronic disease which leads to a substantial reduction in life expectancy, decreased quality of life and increased costs of care (O’Connor, 2009). Most African studies are hospital based and give data on patients that visit the hospital only. Type 1 diabetes has been estimated to affect approximately 19000 people in the world’s poorest countries but there is lack of good data on the disease prevalence in developing countries and in particular in sub-Saharan Africa. The present increase in the rate of both type 2 diabetes mellitus and type 1 diabetes mellitus indicate the great and urgent need for more epidemiological surveys in sub-Saharan Africa. Such a need is dictated by the prevalence of undiagnosed diabetes mellitus. (Diabetes Care, 2005).
  • 20. 8 CHAPTER THREE: METHODOLOGY 3.0. Introduction This section shows in detail the road map of this research project, it includes the study population, the nature and source of data, the way data was recorded, analysed and presented, finally it ends with anticipated challenges. 3.1. Study population The population studied was Kirehe district where Kirehe Hospital is located. The community is majorly rural where the main occupation is agriculture. 3.2. Nature and source of data The data collected was purely secondary in nature. It was collected from Kirehe Hospital’s data records for the period 2006-2015. The Hospital is situated in Kirehe district, Eastern Rwanda. The data collected was on annual basis. 3.3. Data collection procedure The data on diabetes mellitus for the period 2006-2015, was collected on the following variables; 1. Sex 2. Age 3. Type of diabetes 4. Year 3.4. Data analysis procedure Data will be analysed starting with descriptive statistics, then bivariate analysis followed by model estimation for type I diabetes, type II diabetes then for gender.
  • 21. 9 3.4.1. Descriptive statistics Descriptive statistics will be used to describe basic features of the data under study, in this case data on diabetes mellitus cases at Kirehe hospital. Variables such as age, sex and type of diabetes will be analysed. 3.4.2. Bivariate analysis Bivariate analysis is the simultaneous analysis of two variables. It explores the concept of relationship between two variables, whether there exists an association and the strength of this association, or whether there are differences between two variables and the significance of these differences. 3.4.3. Analysis of Diabetes mellitus cases 3.4.3.1. Analysis of diabetes mellitus cases for females To analyse diabetes mellitus cases for females, the test of hypotheses was done using Daniels test. This non-parametric test is based upon the spearman’s coefficient. Hypotheses Ho: Diabetes mellitus occurrence for females is not trended Ha: Diabetes mellitus occurrence for females is trended Level of significance α = 0.05 Test statistic  1 6 1 2 2    nn dt sr Where dt = t – rank (yt) t: order number of years yt: Diabetes cases for females rs: rank correlation coefficient n: number of observations
  • 22. 10 3.4.3.2. Analysis of diabetes mellitus cases for males To analyse diabetes mellitus cases for males, the test of hypotheses was done using Daniels test. This non-parametric test is based upon the spearman’s coefficient. Hypotheses Ho: Diabetes mellitus occurrence for males is not trended Ha: Diabetes mellitus occurrence for males is trended Level of significance α = 0.05 Test statistic  1 6 1 2 2    nn dt sr Where yt : Diabetes cases for males. 3.5.1.1. Analysis of type II diabetes cases To analyse type II diabetes mellitus cases, the test of hypotheses was done using Daniels test. This non-parametric test is based upon the spearman’s coefficient. Hypotheses Ho: Type II Diabetes mellitus occurrence is not trended Ha: Type II Diabetes mellitus occurrence is trended Level of significance α = 0.05 Test statistic  1 6 1 2 2    nn dt sr Where yt: Type II diabetes cases 3.5.1.2. Analysis of type I diabetes cases To analyse type I diabetes mellitus cases, the test of hypotheses was done using Daniels test. This non-parametric test is based upon the spearman’s coefficient. Hypotheses Ho: Type I Diabetes mellitus occurrence is not trended Ha: Type I Diabetes mellitus occurrence is trended Level of significance α = 0.05
  • 23. 11 Test statistic  1 6 1 2 2    nn dt sr Where yt: Type II diabetes cases 3.5.1.3. Trend fitting for Type I Diabetes and forecast A trend will be fitted for T1D cases which will be used to make forecast for the next 10 years. A regression least square method will be used to fit the trend. Үb = α + βTt + et Where α: a constant independent of time changes β: effect of changes in time t et: error term Yb: T1D cases which is the dependent variable Tt: Time in years which is the independent variable 3.5.1.4. Trend fitting for Type II Diabetes and forecast A trend will be fitted for Type I Diabetes cases which will be used to make forecast for the next 10 years. A regression least square method will be used to fit the trend. Үa = α + βTt + et Where α: a constant independent of time changes β: effect of changes in time t et: error term Ya: T2D cases which is the dependent variable Tt: Time in years which is the independent variable 3.5.1.5. Estimation of the Type I Diabetes trend model Estimation of the trend model will be done as follows: Db = a + bTt
  • 24. 12 Where                          2 TT YYTT t Bt b TY ba   For t= 1, 2,…, n Db: estimated trend for T1D cases. After fitting the above trend, forecast of T1D for the next 10 years will be done. 3.5.1.6. Estimation of the Type II Diabetes trend model Estimation of the trend model will be done as follows: Da = a + bTt Where Da: estimated trend for T2D cases. After fitting the above trend, forecast of T2D for the next 10 years will be done. 3.6. Challenges faced The following challenges were encountered by the researcher while carrying out this research project: I. Writing such a project required data, however this data was confidential. Therefore getting this secondary data about diabetes cases was not easy. II. Time was another constraint as far as carrying out this research is concerned. Writing at the same time studying several course units was not an easy one. III. Limited resources needed to carry out this research, for instance transport fee to Kirehe hospital was a tug of war.
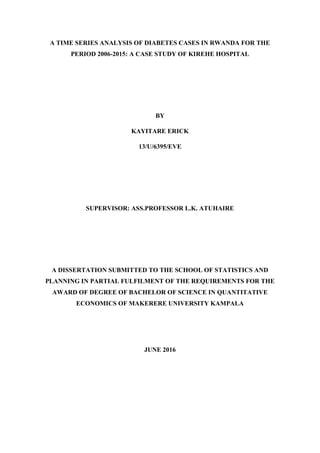
  • 25. 13 CHAPTER FOUR PRESENTATION, ANALYSIS AND INTERPRETATION OF FINDINGS 4.0. Introduction In this chapter, data is presented, analysed and interpreted. Results are presented in various tables and graphs for visual analysis and descriptive statistics. Poisson heterogeneity statistic was used to carry out hypothesis testing for the study hypotheses stated in chapter one, from which interpretations are made. 4.1. Descriptive statistics of diabetes mellitus Figure 4 1: Diabetes mellitus cases for the period 2006-2015 From the above figure, the year 2013 indicates the highest number of diabetes mellitus cases that were reported at Kirehe hospital, with a total number of 33 diabetes cases. This is followed by 2012 with a total number of 29 diabetes cases reported. The least number of diabetes cases reported at Kirehe hospital was in 2006 where 1 case was reported. The graph further indicates that, diabetes mellitus cases increase over time, though the increase is not steady. This is because from 2006 to 2013, diabetes reported cases are seen to be increasing, however beyond 2013, there is a decrease in diabetes mellitus cases. 1 4 11 14 19 19 29 33 26 24 0 10203040 2006 2008 2010 2012 2014 Years Source: Compiled by the Researcher DIABETES MELLITUS CASES FOR THE PERIOD 2006-2015
  • 26. 14 4.1.1. Diabetes mellitus by Type Table 4 1: Diabetes mellitus distribution by type Type Frequency Percentage Type I 5 2.78 Type II 175 97.22 Total 180 100 Source: Compiled by the Researcher Table 4.0 above shows the distribution of diabetes by type as reported in Kirehe hospital. According to the results, the majority of the patients (97.22%) had Type II diabetes mellitus while the remaining patients (2.78%) had Type I diabetes. 4.1.2. Diabetes cases with respect to Age Table 4 2: Percentage distribution of diabetes mellitus by age Age groups Frequency Percentage Below 14 2 1.1 14-35 27 15.00 Above 35 151 83.89 Total 180 100 Source: Compiled by the Researcher From the table 4.1 above, majority of diabetes mellitus cases for the period 2006-2015 in Kirehe hospital (83.89%) were above 35 years of age, followed by the youth (15%) then lastly by those below 14 years of age (1.1%).
  • 27. 15 4.2. Bivariate Analysis of diabetes mellitus 4.2.1. Diabetes type in relation to sex Table 4 3: Cross tabulation of sex by type of diabetes: Chi-square Sex Type Type I Type II Total Female 4 91 4.21 95.79 80.00 52.00 95 100.00 52.78 Male 1 84 1.18 98.82 20.00 48.00 85 100.00 47.22 Total 5 175 2.78 97.22 100.00 100.00 180 100.00 100.00 Pearson chi2(1) = 1.53 Pr = 0.216 Fisher’s exact = 0.372 From the table 4.2 above, there is a significant evidence of relationship between sex and type of diabetes (p < 0.05). 4.2.2. Diabetes type in relation to age groups Table 4 4: Cross tabulation of age groups by type of diabetes: Chi-square Age groups Type Type I Type II Total Below 14 2 0 100.00 0.00 40.00 0.00 2 100.00 1.11 14-35 3 24 11.11 88.89 60.00 13.71 27 100.00 15.00 Above 35 0 151 0.00 100.00 0.00 86.29 151 100.00 83.89 Total 5 175 2.78 97.22 100.00 100.00 180 100.00 100.00 Fisher’s exact = 0.372 From table 4.3 above, there is a significant evidence of relationship between age groups and type of diabetes (p < 0.05).
  • 28. 16 4.3. Hypothesis testing In testing hypotheses, the Daniels test statistic was used. The rs of Daniels test was calculated and then compared with 0.05 as the p-value. If the computed r was greater than the tabulated rα/2, the researcher rejected the null hypothesis and if the value of the computed r was found to be less or equal to the tabulated rα/2, the researcher failed to reject the null hypothesis. 4.3.1. Research hypothesis one HO: Diabetes mellitus for females is not trended Ha: Diabetes mellitus for females is trended Calculation; Table 4 5: Female Diabetes mellitus cases (yt) in Kirehe hospital T yt Rank of yt dt dt 2 1 1 1 0 0 2 2 2 0 0 3 6 3.5 -0.5 0.25 4 6 3.5 1.5 2.25 5 10 6 -1 1 6 10 6 0 0 7 19 10 -3 9 8 13 8 0 0 9 18 9 0 0 10 10 6 4 16 ∑dt 2 28.5  1 6 1 2 2    nn dt sr =   8273.0 110010 5.28*6 1    r0.025 = 0.648 Since the computed rcalculated = 0.8273>0.648, the null hypothesis was rejected. The researcher therefore, concluded that diabetes for females is trended.
  • 29. 17 4.3.2. Research hypothesis two HO: Diabetes mellitus for males is trended Ha: Diabetes mellitus for males is not trended Calculation; Table 4 6: Male Diabetes mellitus cases (yt) in Kirehe hospital T yt Rank of yt dt dt 2 1 0 1 0 0 2 2 2 0 0 3 5 3 0 0 4 8 4.5 -0.5 0.25 5 9 6.5 -1.5 2.25 6 9 6.5 -0.5 0.25 7 10 8 -1 1 8 20 10 -2 4 9 8 4.5 4.5 20.25 10 14 9 1 1 ∑dt 2 29  1 6 1 2 2    nn dt sr =   82424.0 11010 29*6 1 2    r0.025 = 0.648 From the above calculations, rcalculated = 0.82424 > 0.648, the null hypothesis was rejected, thus male diabetes mellitus cases are trended.
  • 30. 18 4.3.3. Research hypothesis three HO: Type II diabetes time series is not trended Ha: Type II diabetes time series is trended Calculation; Table 4 7: Type II Diabetes mellitus cases (yt) in Kirehe hospital T yt Rank of yt dt dt 2 1 1 1 0 0 2 4 2 0 0 3 11 3 0 0 4 14 4 0 0 5 18 5 0 0 6 19 6 0 0 7 28 9 -2 4 8 33 10 -2 4 9 26 8 1 1 10 21 7 3 9 ∑dt 2 18  1 6 1 2 2    nn dt sr =   89091.0 11010 18*6 1 2    r0.025 = 0.648 From the above calculations, rcalculated = 0.89091>0.648, the null hypothesis was rejected, thus type II diabetes mellitus cases are trended.
  • 31. 19 4.3.3. Research hypothesis four HO: Type I diabetes time series is not trended Ha: Type I diabetes time series is trended Calculation; Table 4 8: Type I Diabetes mellitus cases (yt) in Kirehe hospital T yt Rank of yt dt dt 2 1 0 4 -3 9 2 0 4 -2 4 3 0 4 -1 1 4 0 4 0 0 5 1 8.5 -3.5 12.25 6 0 4 2 4 7 1 8.5 -1.5 2.25 8 0 4 4 16 9 0 4 5 25 10 3 10 0 0 ∑dt 2 73.5  1 6 1 2 2    nn dt sr =   5545.0 11010 5.73*6 1 2    r0.025 = 0.648 From the above calculations, rtabulated = 0.5545 <0.648, the null hypothesis was accepted, thus type I diabetes mellitus cases are not trended therefore showing support for stationarity. 4.4. Fitting Trends and forecasting for diabetes mellitus Least square regression method was used in fitting the required trends. 4.4.1. Trend fitting for Type I diabetes Before fitting the trend for Type I diabetes, a plot of Type I diabetes cases was done to determine the nature of the trend as shown in figure 4.3. The figure predicts that there is an upward trend of type I diabetes mellitus from the year 2012 to 2015.
  • 32. 20 Figure 4 2: Trend of Type I diabetes cases in Kirehe hospital (2006-2015) Estimation of the trend Db = a + bTt Table 4.9: Table used to fit the trend for Type I diabetes Db Coefficient T P>|t| T 2 2.31 0.260 Constant 2009 1211.47 1987.929 Source: Developed from STATA by the researcher R2 = 0.8421 (obtained from STATA) The model results showed that the coefficient of determination R2 = 0.8421, this indicates a very good fit of the model. The trend below was then fitted using results from table 4.4 Db = 2009 + 2Tt 1 1.5 2 2.5 3 2006 2008 2010 2012 2014 2016 year Source: Compiled by the Researcher Trend of Type I diabetes mellitus cases for the period 2006-2015
  • 33. 21 From the above fitted trend, it is evident that there is a positive relationship between Type I diabetes mellitus and time since the coefficient b = 2 is positive. This means that as the time T increases, Type I diabetes cases also increase by the factor 2. The constant a = 2009 means that at time T = 0, Type I diabetes cases were about 2009. 4.4.1.1. Forecast for Type I diabetes mellitus Forecast for the next 10 years was done using the fitted trend. The results are as follows. Table 4.10: Forecasting for Type I diabetes mellitus for the years 2016-2025 Year (Time) No. of type I cases 2016 2031 2017 2033 2018 2035 2019 2037 2020 2039 2021 2041 2022 2043 2023 2045 2024 2047 2025 2049 Source: Compiled by the Researcher From the above table, type I diabetes cases are estimated to be increasing over the next 10 years. By 2025, Type I diabetes cases are estimated to be approximately 2,049. 4.4.2. Trend fitting for Type II diabetes Before fitting the trend for Type II diabetes, a plot of Type II diabetes cases was done to determine the nature of the trend as shown in figure 4.4. The figure predicts that there is an upward trend of type I diabetes mellitus from the year 2006 to 2013.
  • 34. 22 Figure 4. 3: Trend of type II diabetes cases for the period 2006-2015 Estimation of the trend Da = a + bTt Table 4. 11: Table used to fit the trend for Type II diabetes Da Coefficient T P>|t| T .2572636 5.02 0.001 Constant 2005.998 1956.45 0.000 Source: Developed from STATA by the researcher 0 10203040 2006 2008 2010 2012 2014 2016 year Source: Compiled by the Researcher Trend of Type II diabetes mellitus cases for the period 2006-2015
  • 35. 23 R2 = 0.7593 (From STATA) From the results, the coefficient of determination R2 = 0.7593, shows a good fit the sample observation. The results also show that the p-values of the constant (0.001) and the independent variable (0.001) are significant at 0.05. The estimated trend for Type II diabetes is therefore stated below; Da = 2005.998 + 0.2573Tt From the above estimated Type II diabetes trend, it means that there is a positive relationship between Type II diabetes and time. The increase in time T increases Type II diabetes cases by .2573 and the constant means that at T=0, Type II diabetes cases were about 2006 cases. 4.4.2.1. Forecast for Type II diabetes Forecast for the next 10 years was done using the fitted trend. The results are as follows. Table 4.12: Forecasting for Type I diabetes mellitus for the years 2016-2025 Year (Time) No. of type I cases 2016 2008.828 2017 2009.086 2018 2009.343 2019 2009.6 2020 2009.858 2021 2010.115 2022 2010.372 2023 2010.629 2024 2010.887 2025 2011.144 Source: Compiled by the Researcher From Table 4.11, the number of type II diabetes cases is estimated to be about 2011.144 by the year 2025.
  • 36. 24 CHAPTER FIVE SUMMARY, CONCLUSIONS AND RECOMMENDATIONS 5.0. Introduction This chapter covers the summary, it further includes the conclusions based on the findings from the study and presents the appropriate recommendations. 5.1. SUMMARY AND CONCLUSIONS Findings from this research have highlighted a number of issues concerning diabetes mellitus particularly type I and type II. 5.1.1. Type I diabetes mellitus It was found out that Type I diabetes mellitus has been increasing over the past 10 years. Results show that in 2005, Type I diabetes cases reported at Kirehe hospital were 1 as compared to 2015 where 3 cases were reported. The researcher found out that type I diabetes is prevalent in females as compared to males. Results from the study showed that type I diabetes cases reported to Kirehe hospital were 80% for females as compared to 20% for males. This means that females are highly affected by this non-communicable disease. The researcher also found out that there is a statistical evidence of relationship between age groups and type of diabetes. Those above 35 years of age accounted for 83.89% of all diabetes cases which is more than the rest of the age groups. The researcher found out that Type I diabetes mellitus occurrence is mainly among teenagers and type I diabetes cases were 2.78% of the 185 cases of diabetes in Kirehe hospital for the period 2006-2015. When forecast for type I diabetes was done, results showed that by 2025, type I diabetes cases in Kirehe hospital will be 2049.
  • 37. 25 5.1.2. Type II diabetes mellitus Findings from the study showed that Type II diabetes was the main type of diabetes which patients who went to Kirehe hospital suffered, that is 97.22%. From 2006 to 2013, type II diabetes was increasing at an increasing rate, where in 2006; there was 1 case while in 2013, there were 33 cases. The researcher found out that type II diabetes was affecting females more than males, that is 52% of the total cases were female patients Forecast for the next 10 years was done and results showed that by 2025, type II diabetes cases in Kirehe hospital will be 2011. 5.2. RECOMMENDATIONS The government of Rwanda should be given credit for finally giving non-communicable diseases the attention they deserve-particularly the 4th leading cause of death in the world, which is the deadly diabetes mellitus. However a lot has to be done as regards this disease. The following suggestions depending on the findings have been recommended: i. Many government policies have put much emphasis on treatment of diabetes by providing the test strips, insulin to mention but a few. Nevertheless, preventive care should be number one priority. People should be sensitised on the importance of diet, the benefits of physical fitness and the side effects of too much sugar in the body. ii. Type II diabetes has been given much attention, results show that Type I diabetes deserve attention too, since it attacks the young who are a big asset to the country in terms of their productivity. iii. Above 80% of diabetes patients are above 35 years of age. This is a threat because majority are the bread winners of their families. Therefore the government needs to do whatever it takes to curb down the increasing trend of diabetes. One suggestion is to have a national weekly 2 hours’ time as the sports time, this will make obese and fat people lose weight. iv. Results of this research revealed that females are the most affected compared to the males. Ministry of health therefore is advised to put up measures which target females first. For example, providing free diabetes testing to all females.
  • 38. 26 APPENDIX: DATA COLLECTED FROM KIREHE HOSPITAL sex age Year weight Type female 54 2013 94 Type II male 46 2010 63 Type II male 76 2007 85 Type II female 68 2007 76 Type II male 69 2009 56 Type II female 5 2010 Type I male 66 2008 65 Type II male 46 2009 60 Type II male 57 2010 61 Type II female 63 2009 51 Type II female 85 2008 56 Type II male 62 2008 70 Type II female 56 2010 58 Type II female 59 2008 42 Type II female 51 2008 84 Type II female 48 2010 54 Type II male 42 2009 83 Type II male 55 2008 67 Type II female 38 2007 70 Type II female 61 2008 62 Type II female 75 2009 55 Type II female 56 2009 48 Type II male 28 2008 40 Type II male 66 2009 74 Type II female 29 2009 69 Type II male 54 2010 89 Type II female 53 2009 70 Type II male 52 2009 53 Type II male 63 2010 80 Type II female 55 2010 66 Type II female 42 2008 42 Type II male 60 2009 108 Type II male 60 2007 73 Type II female 58 2010 56 Type II male 79 2008 62 Type II male 38 2009 63 Type II male 51 2009 69 Type II female 54 2008 66 Type II female 25 2010 68 Type I male 67 2010 72 Type II
  • 39. 27 female 66 2010 62 Type II male 59 2010 72 Type II female 42 2010 80 Type II male 47 2010 68 Type II male 54 2011 60 Type II female 86 2011 44 Type II male 51 2014 82 Type II female 47 2011 65 Type II male 34 2011 52 Type II male 68 2011 59 Type II female 71 2011 93 Type II female 61 2011 90 Type II male 73 2011 73 Type II male 42 2011 66 Type II male 66 2010 51 Type II female 57 2011 69 Type II female 63 2011 86 Type II female 47 2011 51 Type II male 53 2011 71 Type II male 47 2011 62 Type II female 48 2009 84 Type II female 62 2012 90 Type II female 74 2012 40 Type II female 52 2012 82 Type II female 74 2012 70 Type II male 26 2012 61 Type II female 54 2010 72 Type II female 32 2011 82 Type II female 71 2011 40 Type II female 61 2012 54 Type II female 54 2012 72 Type II female 21 2012 60 Type I male 60 2012 63 Type II male 22 2012 54 Type I female 67 2006 93 Type II female 81 2012 41 Type II female 43 2012 87 Type II female 74 2012 39 Type II female 74 2012 59 Type II female 47 2012 64 Type II female 39 2012 85 Type II male 71 2012 52 Type II female 46 2012 65 Type II male 46 2012 Type II male 66 2012 99 Type II
  • 40. 28 female 51 2012 78 Type II female 63 2012 78 Type II female 79 2012 43 Type II female 68 2012 69 Type II male 43 2012 63 Type II male 31 2012 52 Type II male 18 2012 47 Type I male 47 2012 75 Type II female 67 2013 63 Type II male 56 2013 77 Type II female 64 2013 74 Type II female 24 2012 55 Type I male 74 2013 58 Type II male 53 2013 68 Type II male 38 2013 58 Type II female 38 2013 54 Type II male 39 2013 63 Type II male 35 2011 60 Type II female 62 2013 55 Type II female 24 2013 58 Type I male 43 2013 Type II male 55 2013 58 Type II male 42 2013 48 Type II female 36 2013 61 Type II male 64 2013 Type II female 64 2013 80 Type II male 56 2013 87 Type II male 55 2013 72 Type II female 54 2013 60 Type II female 56 2013 56 Type II male 43 2013 95 Type II male 38 2013 57 Type II male 34 2013 59 Type II male 55 2013 52 Type II male 63 2013 45 Type II female 47 2013 63 Type II male 55 2013 76 Type II female 29 2013 60 Type II female 56 2013 52 Type II male 62 2013 65 Type II male 37 2013 114 Type II female 57 2014 65 Type II male 60 2013 Type II female 45 2014 78 Type II male 59 2014 62 Type II
  • 41. 29 male 46 2014 72 Type II female 38 2014 73 Type II female 43 2014 57 Type II female 35 2014 Type II male 81 2014 65 Type II male 56 2014 63 Type II female 54 2014 55 Type II female 58 2014 76 Type II male 77 2014 80 Type II female 48 2014 64 Type II female 45 2014 67 Type II female 54 2014 64 Type II male 29 2014 55 Type II female 48 2014 62 Type II male 58 2014 Type II female 56 2014 51 Type II female 42 2014 58 Type II male 49 2010 66 Type II female 57 2014 59 Type II female 67 2014 69 Type II female 34 2014 66 Type II female 37 2014 78 Type II female 52 2011 45 Type II female 25 2014 75 Type I male 34 2015 76 Type II female 37 2015 76 Type II male 46 2015 48 Type II male 25 2015 74 Type I male 19 2015 48 Type I female 49 2010 68 Type II male 38 2011 61 Type II male 69 2015 53 Type II female 16 2015 42 Type I female 39 2015 90 Type II male 59 2015 55 Type II male 52 2015 71 Type II male 31 2015 78 Type II female 54 2015 58 Type II female 38 2015 54 Type II female 42 2015 49 Type II male 57 2015 Type II male 46 2015 60 Type II male 52 2015 85 Type II female 19 2015 52 Type I male 71 2015 84 Type II
  • 42. 30 female 48 2015 51 Type II male 47 2015 61 Type II female 15 2015 42 Type I female 11 2015 34 Type I male 19 2015 52 Type I
  • 43. 31 REFERENCES Alemu, S., Dessie, A. and Seid, E., (2009): Insulin-requiring diabetes in rural Ethiopia: should we reopen the case for malnutrition-related diabetes?Diabetologia, Volume 52, pp1842-pp1845. Beran, D., Yudkin, J.S., and Courten, M. (2005): Access to care for patients with insulin requiring diabetes in developing countries: case studies of Mozambique and Zambia. Diabetes Care, Volume 28, pp2136-pp2140. Crispin, G. (2014): Diabetes care in Rwanda: Against all odds. Diabetes Voice, Volume 1, pp13-pp16. Connor, H. and Boulton, A. J. M. (1989). Diabetes in Practice, Chichester: Wiley Diabetes UK (2004): Website. www.diabetes.org International Diabetes federation (2011): Global burden of diabetes. Diabetic atlas. 5th edition, Brussels. Kennedy, Peter. (2003): A guide to econometrics, Cambridge: MIT Press Mauch, J.E., and Park, N. (2003): Guide to the successful thesis and dissertation: A handbook for students and faculty. 5th edition. New York: Marcel Dekker. Mbanya, J.C. (2014): The burden of type 2 diabetes mellitus in the African diaspora. www.medscape.com International Diabetes Federation (2003). Diabetes Atlas, 2nd edition, Brussels. Gujjarati, D.N. (2008): Basic econometrics, 5th edition, Singapore: McGraw Hill King, H., Aubert, R.E., and Herman, W.H. (2000): Global burden of diabetes: 1995-2025 prevalence, numerical estimates and projections. Diabetes Care, Volume 21, pp1414– pp1431. O’Connor, P.J., Crain, A.L., Rush, W.A., Hanson, A.M., Fisher, L.R., Kluznik, J.C. (2009): Does diabetes double the risk of depression? Ann Fam Med, Volume 7, pp328- pp335.
  • 44. 32 Otim, et al (1998): Guidelines for Non Communicable diseases at district level. Kampala: MOH. Peer, N., Kengne, A.P., Motala, A.A., Mbanya, J.C. (2014). Diabetes in the Africa region: 2013 update for the IDF diabetes Atlas. Diabetes Research Clinical Practice, Volume 103, pp197–pp205. Tuomilehto, J. (2001): Prevention of type 2 diabetes mellitus by changes in lifestyle among subjects with impaired glucose tolerance. The New England journal of medicine, Volume 344, pp1343-pp1350. WHO (2012): Global status report on non-communicable diseases. Geneva: WHO. WHO (2012): Global Health Estimates: Deaths by Cause, Age, Sex and Country, 2000- 2012. Geneva: WHO.