SlideShare a Scribd company logo
1 of 9
Download to read offline
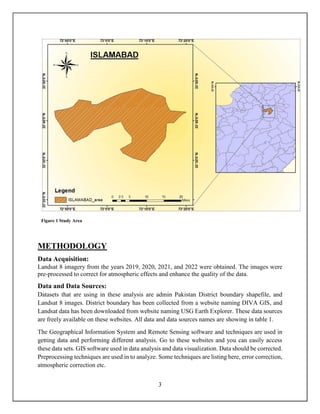
1
2
TITTLE
NDVI Time Series Analysis on Islamabad City Using Landsat 8
Imagery (2019-2022)
EXECUTIVE SUMMARY
The NDVI (Normalized Difference Vegetation Index) Time Series Analysis project on Islamabad
City utilizing Landsat 8 imagery spanning from 2019 to 2022 aimed to assess the temporal changes
in vegetation health and land cover dynamics. The study employed advanced GIS techniques to
derive meaningful insights into the city's environmental conditions over the specified period.
INTRODUCTION
Background:
The project focused on Islamabad City, the capital of Pakistan, using Landsat 8 satellite imagery.
Landsat 8 provides high-resolution multispectral data, allowing for accurate NDVI calculations,
which serve as a proxy for vegetation health.
Objectives:
 Analyze NDVI trends to identify changes in vegetation over the years.
 Assess the impact of urbanization on green spaces.
 Provide valuable information for urban planning and environmental management.
STUDY AREA
The latitudinal and longitudinal extent of the study area naming ISLAMABAD, Pakistan is defined
as 33.6844°N and 73.0479°E. The total area of the selected study area is 906 km2 and Elevation is
507 m. According to provisional results of the 2022 World Population Prospects 2023 is 1,232,000.
3
Figure 1 Study Area
METHODOLOGY
Data Acquisition:
Landsat 8 imagery from the years 2019, 2020, 2021, and 2022 were obtained. The images were
pre-processed to correct for atmospheric effects and enhance the quality of the data.
Data and Data Sources:
Datasets that are using in these analysis are admin Pakistan District boundary shapefile, and
Landsat 8 images. District boundary has been collected from a website naming DIVA GIS, and
Landsat data has been downloaded from website naming USG Earth Explorer. These data sources
are freely available on these websites. All data and data sources names are showing in table 1.
The Geographical Information System and Remote Sensing software and techniques are used in
getting data and performing different analysis. Go to these websites and you can easily access
these data sets. GIS software used in data analysis and data visualization. Data should be corrected.
Preprocessing techniques are used in to analyze. Some techniques are listing here, error correction,
atmospheric correction etc.
4
Table 1 showing data and data sources
Datasets Data Sources
Pakistan District Boundary Shapefile DIVA GIS
Landsat 8 Imagery USGS
Creation of File Geodatabase:
File geodatabase is a vital key factor for any GIS project. We can save project analysis in file
geodatabase and can easily share these files in one folder to anyone without losing any data. For
this go to arctoolbox and right click on any folder in which you want to add gdb so go to new and
click on file geodatabase.
Figure 2. GDB Creation
5
NDVI Calculation:
The NDVI values were calculated using the formula:
NDVI=NIR-RED/NIR+RED
Where NIR is the Near-Infrared band, and Red is the Red band from Landsat 8.
Figure 3. NDVI Calculation
RESULTS
Temporal NDVI Trends:
The analysis revealed fluctuations in NDVI values over the study period, indicating seasonal
variations and potential impacts on vegetation health.
Land Cover Changes:
Land cover changes, particularly in urban areas, were identified through the analysis, shedding
light on the encroachment on green spaces and potential environmental concerns.
6
Figure 4. NDVI 2019
Figure 5. NDVI 2020
7
Figure 7. NDVI 2021
Figure 8. NDVI 2022
8
DISCUSSION
Urbanization Impact:
The project highlighted the influence of urbanization on vegetation cover, providing insights for
sustainable urban development practices. In this time series project we can identify due to more
urbanization in these four years vegetation health has been decrease with the passage of time. In
2019 the vegetation low and highest values are -0.13 to 0.50. In 2020 these values decrease from
0.08 to 0.43 due to more urbanization pattern. But in 2021 there is no urbanization has been
made so value of vegetation has been increased. But in 2022 again value of vegetation has been
decrease from -0.01 to 0.4. So, by this analysis we can better understand that variation from 2019
to 2022 in vegetation due to urbanization pattern.
Seasonal Dynamics:
Understanding seasonal NDVI variations contributes to better planning for agricultural activities
and ecosystem management. We can see seasonal variation in NDVI values that indicate that the
vegetation has been decrease from 2019 to 2022 seasonally.
Years High Values Low Values
2019 0.506078 -0.135192
2020 0.437593 -0.0813397
2021 0.505116 -0.14829
2022 0.405116 -0.014829
NDVI Time Series Analysis
-0.2
-0.1
0
0.1
0.2
0.3
0.4
0.5
0.6
2018.5 2019 2019.5 2020 2020.5 2021 2021.5 2022 2022.5
NDVI TIME SERIES ANALYSIS
High Valuse Low Valuse
9
Conclusion:
The NDVI time series analysis on Islamabad City using Landsat 8 imagery has yielded vital
insights into the dynamic relationship between vegetation health and urbanization from 2019 to
2022. The study highlights the sensitivity of vegetation to seasonal variations, providing essential
information for agricultural planning and climate change adaptation. Urbanization's discernible
impact on green spaces, identified through land cover change analysis, emphasizes the need for
strategic urban planning to balance development with environmental conservation. The project's
outcomes have significant implications for sustainable development, urging policymakers to
prioritize the preservation and expansion of green areas for the well-being of residents and the
creation of a resilient urban environment. The results also underscore the importance of regular
NDVI monitoring for adaptive management, enabling timely interventions in areas requiring
attention. While this project focused on NDVI analysis, future research should adopt holistic
approaches, incorporating additional environmental parameters for a more comprehensive
understanding of Islamabad's ecosystem dynamics. In conclusion, this study provides a
foundational resource for informed decision-making, advocating for a harmonious coexistence
between urban expansion and the preservation of Islamabad's vital green spaces.

More Related Content

Similar to Final report-2.pdf

Identification and Monitoring the Change of Land Use Pattern Using Remote Sen...
Identification and Monitoring the Change of Land Use Pattern Using Remote Sen...Identification and Monitoring the Change of Land Use Pattern Using Remote Sen...
Identification and Monitoring the Change of Land Use Pattern Using Remote Sen...
IOSR Journals
 

Similar to Final report-2.pdf (20)

Application of gis in urban planning
Application of gis in urban planningApplication of gis in urban planning
Application of gis in urban planning
 
GIS Application Used in Urban Planning In India
GIS Application Used in Urban Planning In IndiaGIS Application Used in Urban Planning In India
GIS Application Used in Urban Planning In India
 
International Online Conference on ‘ Geospatial Technology in Sustainable Env...
International Online Conference on ‘ Geospatial Technology in Sustainable Env...International Online Conference on ‘ Geospatial Technology in Sustainable Env...
International Online Conference on ‘ Geospatial Technology in Sustainable Env...
 
Environment Impact Assessment Using Remote Sensing
Environment Impact Assessment Using Remote SensingEnvironment Impact Assessment Using Remote Sensing
Environment Impact Assessment Using Remote Sensing
 
Application Of GIS In Environmental Engineering
Application Of GIS In Environmental EngineeringApplication Of GIS In Environmental Engineering
Application Of GIS In Environmental Engineering
 
IRJET- Review on Drought Risk Assessment by using Remote Sensing and GIS
IRJET-  	  Review on Drought Risk Assessment by using Remote Sensing and GISIRJET-  	  Review on Drought Risk Assessment by using Remote Sensing and GIS
IRJET- Review on Drought Risk Assessment by using Remote Sensing and GIS
 
IRJET - Normalized Difference Vegetation Index (NDVI) based Land Cover Cl...
IRJET -  	  Normalized Difference Vegetation Index (NDVI) based Land Cover Cl...IRJET -  	  Normalized Difference Vegetation Index (NDVI) based Land Cover Cl...
IRJET - Normalized Difference Vegetation Index (NDVI) based Land Cover Cl...
 
SAHIL NAIKWADE.pptx
SAHIL NAIKWADE.pptxSAHIL NAIKWADE.pptx
SAHIL NAIKWADE.pptx
 
Analysis of Land Use Land Cover Change and Relative Growth in Social Amenitie...
Analysis of Land Use Land Cover Change and Relative Growth in Social Amenitie...Analysis of Land Use Land Cover Change and Relative Growth in Social Amenitie...
Analysis of Land Use Land Cover Change and Relative Growth in Social Amenitie...
 
Urban Development Scenarios and Probability Mapping for Greater Dublin Region...
Urban Development Scenarios and Probability Mapping for Greater Dublin Region...Urban Development Scenarios and Probability Mapping for Greater Dublin Region...
Urban Development Scenarios and Probability Mapping for Greater Dublin Region...
 
Proposal for Slum Rehabilitation in Rajiv Nagar: A Case Study Of Nashik
Proposal for Slum Rehabilitation in Rajiv Nagar: A Case Study Of NashikProposal for Slum Rehabilitation in Rajiv Nagar: A Case Study Of Nashik
Proposal for Slum Rehabilitation in Rajiv Nagar: A Case Study Of Nashik
 
Remote sensing and geographic information systems technics for spatial-based...
Remote sensing and geographic information systems technics  for spatial-based...Remote sensing and geographic information systems technics  for spatial-based...
Remote sensing and geographic information systems technics for spatial-based...
 
A multi-scale Urban Analysis Using Remote Sensing and GIS
A multi-scale Urban Analysis Using Remote Sensing and GISA multi-scale Urban Analysis Using Remote Sensing and GIS
A multi-scale Urban Analysis Using Remote Sensing and GIS
 
Identification and Monitoring the Change of Land Use Pattern Using Remote Sen...
Identification and Monitoring the Change of Land Use Pattern Using Remote Sen...Identification and Monitoring the Change of Land Use Pattern Using Remote Sen...
Identification and Monitoring the Change of Land Use Pattern Using Remote Sen...
 
Nhst 11 surat, Application of RS & GIS in urban waste management
Nhst 11 surat,  Application of RS  & GIS in urban waste managementNhst 11 surat,  Application of RS  & GIS in urban waste management
Nhst 11 surat, Application of RS & GIS in urban waste management
 
Gis
GisGis
Gis
 
GIS aided Urban Planning for preparation of Micro-Level Plan of Channenahalli...
GIS aided Urban Planning for preparation of Micro-Level Plan of Channenahalli...GIS aided Urban Planning for preparation of Micro-Level Plan of Channenahalli...
GIS aided Urban Planning for preparation of Micro-Level Plan of Channenahalli...
 
STUDY OF WATER MANAGEMENT SYSTEM USING GEOGRAPHIC INFORMATION SYSTEM
STUDY OF WATER MANAGEMENT SYSTEM USING GEOGRAPHIC INFORMATION SYSTEMSTUDY OF WATER MANAGEMENT SYSTEM USING GEOGRAPHIC INFORMATION SYSTEM
STUDY OF WATER MANAGEMENT SYSTEM USING GEOGRAPHIC INFORMATION SYSTEM
 
Fyp presentation
Fyp presentationFyp presentation
Fyp presentation
 
Assignment agus
Assignment agusAssignment agus
Assignment agus
 

Recently uploaded

electrical installation and maintenance.
electrical installation and maintenance.electrical installation and maintenance.
electrical installation and maintenance.
benjamincojr
 
Maher Othman Interior Design Portfolio..
Maher Othman Interior Design Portfolio..Maher Othman Interior Design Portfolio..
Maher Othman Interior Design Portfolio..
MaherOthman7
 

Recently uploaded (20)

litvinenko_Henry_Intrusion_Hong-Kong_2024.pdf
litvinenko_Henry_Intrusion_Hong-Kong_2024.pdflitvinenko_Henry_Intrusion_Hong-Kong_2024.pdf
litvinenko_Henry_Intrusion_Hong-Kong_2024.pdf
 
Insurance management system project report.pdf
Insurance management system project report.pdfInsurance management system project report.pdf
Insurance management system project report.pdf
 
Instruct Nirmaana 24-Smart and Lean Construction Through Technology.pdf
Instruct Nirmaana 24-Smart and Lean Construction Through Technology.pdfInstruct Nirmaana 24-Smart and Lean Construction Through Technology.pdf
Instruct Nirmaana 24-Smart and Lean Construction Through Technology.pdf
 
Interfacing Analog to Digital Data Converters ee3404.pdf
Interfacing Analog to Digital Data Converters ee3404.pdfInterfacing Analog to Digital Data Converters ee3404.pdf
Interfacing Analog to Digital Data Converters ee3404.pdf
 
engineering chemistry power point presentation
engineering chemistry  power point presentationengineering chemistry  power point presentation
engineering chemistry power point presentation
 
analog-vs-digital-communication (concept of analog and digital).pptx
analog-vs-digital-communication (concept of analog and digital).pptxanalog-vs-digital-communication (concept of analog and digital).pptx
analog-vs-digital-communication (concept of analog and digital).pptx
 
electrical installation and maintenance.
electrical installation and maintenance.electrical installation and maintenance.
electrical installation and maintenance.
 
Developing a smart system for infant incubators using the internet of things ...
Developing a smart system for infant incubators using the internet of things ...Developing a smart system for infant incubators using the internet of things ...
Developing a smart system for infant incubators using the internet of things ...
 
SLIDESHARE PPT-DECISION MAKING METHODS.pptx
SLIDESHARE PPT-DECISION MAKING METHODS.pptxSLIDESHARE PPT-DECISION MAKING METHODS.pptx
SLIDESHARE PPT-DECISION MAKING METHODS.pptx
 
Fuzzy logic method-based stress detector with blood pressure and body tempera...
Fuzzy logic method-based stress detector with blood pressure and body tempera...Fuzzy logic method-based stress detector with blood pressure and body tempera...
Fuzzy logic method-based stress detector with blood pressure and body tempera...
 
NO1 Best Powerful Vashikaran Specialist Baba Vashikaran Specialist For Love V...
NO1 Best Powerful Vashikaran Specialist Baba Vashikaran Specialist For Love V...NO1 Best Powerful Vashikaran Specialist Baba Vashikaran Specialist For Love V...
NO1 Best Powerful Vashikaran Specialist Baba Vashikaran Specialist For Love V...
 
Maher Othman Interior Design Portfolio..
Maher Othman Interior Design Portfolio..Maher Othman Interior Design Portfolio..
Maher Othman Interior Design Portfolio..
 
5G and 6G refer to generations of mobile network technology, each representin...
5G and 6G refer to generations of mobile network technology, each representin...5G and 6G refer to generations of mobile network technology, each representin...
5G and 6G refer to generations of mobile network technology, each representin...
 
Adsorption (mass transfer operations 2) ppt
Adsorption (mass transfer operations 2) pptAdsorption (mass transfer operations 2) ppt
Adsorption (mass transfer operations 2) ppt
 
Working Principle of Echo Sounder and Doppler Effect.pdf
Working Principle of Echo Sounder and Doppler Effect.pdfWorking Principle of Echo Sounder and Doppler Effect.pdf
Working Principle of Echo Sounder and Doppler Effect.pdf
 
Worksharing and 3D Modeling with Revit.pptx
Worksharing and 3D Modeling with Revit.pptxWorksharing and 3D Modeling with Revit.pptx
Worksharing and 3D Modeling with Revit.pptx
 
Software Engineering Practical File Front Pages.pdf
Software Engineering Practical File Front Pages.pdfSoftware Engineering Practical File Front Pages.pdf
Software Engineering Practical File Front Pages.pdf
 
Circuit Breakers for Engineering Students
Circuit Breakers for Engineering StudentsCircuit Breakers for Engineering Students
Circuit Breakers for Engineering Students
 
Basics of Relay for Engineering Students
Basics of Relay for Engineering StudentsBasics of Relay for Engineering Students
Basics of Relay for Engineering Students
 
CLOUD COMPUTING SERVICES - Cloud Reference Modal
CLOUD COMPUTING SERVICES - Cloud Reference ModalCLOUD COMPUTING SERVICES - Cloud Reference Modal
CLOUD COMPUTING SERVICES - Cloud Reference Modal
 

Final report-2.pdf

  • 1. 1
  • 2. 2 TITTLE NDVI Time Series Analysis on Islamabad City Using Landsat 8 Imagery (2019-2022) EXECUTIVE SUMMARY The NDVI (Normalized Difference Vegetation Index) Time Series Analysis project on Islamabad City utilizing Landsat 8 imagery spanning from 2019 to 2022 aimed to assess the temporal changes in vegetation health and land cover dynamics. The study employed advanced GIS techniques to derive meaningful insights into the city's environmental conditions over the specified period. INTRODUCTION Background: The project focused on Islamabad City, the capital of Pakistan, using Landsat 8 satellite imagery. Landsat 8 provides high-resolution multispectral data, allowing for accurate NDVI calculations, which serve as a proxy for vegetation health. Objectives:  Analyze NDVI trends to identify changes in vegetation over the years.  Assess the impact of urbanization on green spaces.  Provide valuable information for urban planning and environmental management. STUDY AREA The latitudinal and longitudinal extent of the study area naming ISLAMABAD, Pakistan is defined as 33.6844°N and 73.0479°E. The total area of the selected study area is 906 km2 and Elevation is 507 m. According to provisional results of the 2022 World Population Prospects 2023 is 1,232,000.
  • 3. 3 Figure 1 Study Area METHODOLOGY Data Acquisition: Landsat 8 imagery from the years 2019, 2020, 2021, and 2022 were obtained. The images were pre-processed to correct for atmospheric effects and enhance the quality of the data. Data and Data Sources: Datasets that are using in these analysis are admin Pakistan District boundary shapefile, and Landsat 8 images. District boundary has been collected from a website naming DIVA GIS, and Landsat data has been downloaded from website naming USG Earth Explorer. These data sources are freely available on these websites. All data and data sources names are showing in table 1. The Geographical Information System and Remote Sensing software and techniques are used in getting data and performing different analysis. Go to these websites and you can easily access these data sets. GIS software used in data analysis and data visualization. Data should be corrected. Preprocessing techniques are used in to analyze. Some techniques are listing here, error correction, atmospheric correction etc.
  • 4. 4 Table 1 showing data and data sources Datasets Data Sources Pakistan District Boundary Shapefile DIVA GIS Landsat 8 Imagery USGS Creation of File Geodatabase: File geodatabase is a vital key factor for any GIS project. We can save project analysis in file geodatabase and can easily share these files in one folder to anyone without losing any data. For this go to arctoolbox and right click on any folder in which you want to add gdb so go to new and click on file geodatabase. Figure 2. GDB Creation
  • 5. 5 NDVI Calculation: The NDVI values were calculated using the formula: NDVI=NIR-RED/NIR+RED Where NIR is the Near-Infrared band, and Red is the Red band from Landsat 8. Figure 3. NDVI Calculation RESULTS Temporal NDVI Trends: The analysis revealed fluctuations in NDVI values over the study period, indicating seasonal variations and potential impacts on vegetation health. Land Cover Changes: Land cover changes, particularly in urban areas, were identified through the analysis, shedding light on the encroachment on green spaces and potential environmental concerns.
  • 6. 6 Figure 4. NDVI 2019 Figure 5. NDVI 2020
  • 7. 7 Figure 7. NDVI 2021 Figure 8. NDVI 2022
  • 8. 8 DISCUSSION Urbanization Impact: The project highlighted the influence of urbanization on vegetation cover, providing insights for sustainable urban development practices. In this time series project we can identify due to more urbanization in these four years vegetation health has been decrease with the passage of time. In 2019 the vegetation low and highest values are -0.13 to 0.50. In 2020 these values decrease from 0.08 to 0.43 due to more urbanization pattern. But in 2021 there is no urbanization has been made so value of vegetation has been increased. But in 2022 again value of vegetation has been decrease from -0.01 to 0.4. So, by this analysis we can better understand that variation from 2019 to 2022 in vegetation due to urbanization pattern. Seasonal Dynamics: Understanding seasonal NDVI variations contributes to better planning for agricultural activities and ecosystem management. We can see seasonal variation in NDVI values that indicate that the vegetation has been decrease from 2019 to 2022 seasonally. Years High Values Low Values 2019 0.506078 -0.135192 2020 0.437593 -0.0813397 2021 0.505116 -0.14829 2022 0.405116 -0.014829 NDVI Time Series Analysis -0.2 -0.1 0 0.1 0.2 0.3 0.4 0.5 0.6 2018.5 2019 2019.5 2020 2020.5 2021 2021.5 2022 2022.5 NDVI TIME SERIES ANALYSIS High Valuse Low Valuse
  • 9. 9 Conclusion: The NDVI time series analysis on Islamabad City using Landsat 8 imagery has yielded vital insights into the dynamic relationship between vegetation health and urbanization from 2019 to 2022. The study highlights the sensitivity of vegetation to seasonal variations, providing essential information for agricultural planning and climate change adaptation. Urbanization's discernible impact on green spaces, identified through land cover change analysis, emphasizes the need for strategic urban planning to balance development with environmental conservation. The project's outcomes have significant implications for sustainable development, urging policymakers to prioritize the preservation and expansion of green areas for the well-being of residents and the creation of a resilient urban environment. The results also underscore the importance of regular NDVI monitoring for adaptive management, enabling timely interventions in areas requiring attention. While this project focused on NDVI analysis, future research should adopt holistic approaches, incorporating additional environmental parameters for a more comprehensive understanding of Islamabad's ecosystem dynamics. In conclusion, this study provides a foundational resource for informed decision-making, advocating for a harmonious coexistence between urban expansion and the preservation of Islamabad's vital green spaces.