Download to read offline

![13
5. Discussion
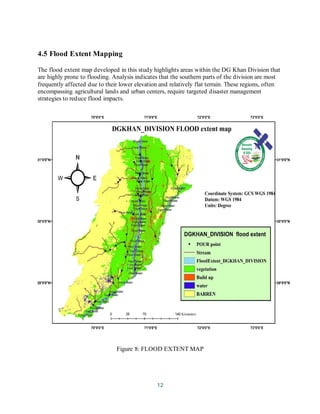
The flood extent analysis provides crucial insights into the areas most at risk of flooding in the
DG Khan Division. Implementing effective disaster management strategies is essential to
mitigate the impacts of flooding, protect lives, and reduce economic losses
6. Conclusion
This study successfully mapped the flood extents in the DG Khan Division and proposed
comprehensive disaster management strategies to mitigate flood impacts. By integrating GIS
technology, the study provides a robust framework for understanding flood dynamics and
enhancing preparedness and response mechanisms. The findings offer valuable insights for
policymakers and planners to improve flood management practices. Future research should focus
on incorporating real-time data and advanced modeling techniques to further refine flood
prediction and management capabilities.
References
[1] Abbas, A., Bhatti, A. S., Ullah, S., Ullah, W., Waseem, M., Zhao, C., et al. (2023). Projection
of precipitationextremesoverSouthAsiafrom CMIP6 GCMs. Journal of Arid Land, 15, 274–
296. doi:10.1007/s40333-023-0050-3
[2] Abbas, A., Ullah, S., Ullah, W., Waseem, M., Dou, X., Zhao, C., et al. (2022). Evaluation and
projection of precipitation in Pakistan using the coupled model intercomparison project
phase 6 model simulations. International Journal of Climatology, 42, 6665–6684.
doi:10.1002/joc.7602
[3] Ahmad, I., Tang, D., Wang, T., Wang, M., & Wagan, B. (2015). Precipitation trends over time
using Mann-Kendall and Spearman’s rho tests in Swat River Basin, Pakistan. Advances in
Meteorology, 2015, 1–15. doi:10.1155/2015/431860
[4] Ahmad, I., Zhang, F., Liu, J., Anjum, M. N., Zaman, M., Tayyab, M., et al. (2018). A linear bi-
level multi-objective program for optimal allocation of water resources. PLOS ONE, 13,
e0192294. doi:10.1371/journal.pone.0192294
[5] Ali, K., Bajracharya, R. M., & Koirala, H. (2016). A review of flood risk assessment.
International Journal of Environment, Agriculture and Biotechnology, 1, 1065–1077.
doi:10.22161/ijeab/1.4.62](https://image.slidesharecdn.com/floodextentdgkhandivisionbakhatali-241221180743-73d0f2e3/85/flood-extent-DGKHAN_DIVISION-bakhat-ali-pdf-13-320.jpg)
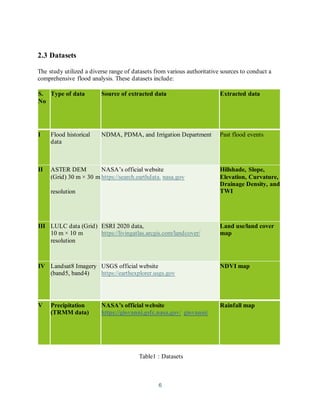
This document presents a GIS-based study aimed at analyzing flood extent and developing disaster management strategies for the DG Khan division in Punjab, Pakistan. It highlights the region's vulnerability to flooding due to its geographical and climatic conditions and proposes effective flood management strategies based on detailed GIS analysis of flood behavior. The findings aim to enhance preparedness and response mechanisms, providing valuable insights for policymakers to improve flood management practices.