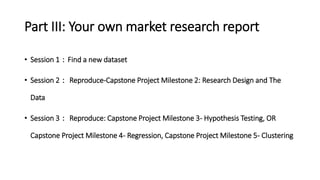
Final Presentation Slides
Draft
STATISTICAL MEASUREMENTS, ANALYSIS & RESEARCH
Jackson Mao
Net ID: sm9555
2020.12.01
Self-Introduction
I am Shihao Mao also go by Jackson, So after receiving
my undergraduate degree from W.P. Carey School
Business School of Arizona State University, I start my
internship at IDG Capital, learning and accumulating
experience in venture capital, mergers and acquisitions
and other projects.(During this period, those investment
projects I participate were mainly Internet companies in
the consumer finance field, mergers and acquisitions
loans for real estate companies, and learning theories of
financial leverage.). After that, I participated in the IPO
projects of two Electronic Chip companies and investing
in a freight logistics platform company which is expected
to be listed on the SSE STAR MARKET (Sci-Tech
innovation board) in 2021 ZTF Securities Co., Ltd. In
addition, I also have some basic understanding and
participation in consumer finance, auto finance(Chery
Automobile mixed reform), and biodegradable plastic
bag production fields.
B.S. in Entrepreneurship |W. P. Carey Business
School of Arizona State University
LinkedIn:
https://www.linkedin.com/in/%E4%B8%96%E8%B1%AA-
%E6%AF%9B-780a6010a/
GitHub Repo Link: https://github.com/Msh-
Jackson/NYU_Integrated_Marketing
Kaggle Notebook Link: https://www.kaggle.com/shihaomao
Part II:Summary
What I learned from this class is statistical analysis used in marketing
which including the sampling techniques, marketing test design and
analysis. Among them, what I have benefited most is the sample size
estimation and test evaluation through learning and how to connect
with modeling/joint analysis, and ranking correlation, etc. These
contents will be the real life daily work that if I participate market
department or doing marketing job in the future.
In my personal perspective, my biggest improvement is when I use
Kaggle and Github to conduct sample size estimation and test
evaluation. In this process, I can find data sources. In addition, I have
also learned the logic of these models.
Part III: Your own market research report
• Session 1:Find a new dataset
• Session 2: Reproduce-Capstone Project Milestone 2: Research Design and The
Data
• Session 3: Reproduce: Capstone Project Milestone 3- Hypothesis Testing, OR
Capstone Project Milestone 4- Regression, Capstone Project Milestone 5- Clustering
Session 1:Find a new dataset
Data source:
https://www.kaggle.com/ranja7/vehicle-insurance-customer-data
Context :
The socio-economic data of the customer with details about the insured
vehicle is the data content. Data contains both categorical and numeric
variables. The customer lifetime value based on historical data has also
been provided which is essential in understanding the customer purchase
behavior.
Vehicle Insurance Customer
Data VIC :5106
Total Claims and Vehicle Class
This is the customer data and its
vehicle insurance policy. This
provides us with detailed
information about the customer
and its vehicle insurance, which
can be subdivided to subdivide
similar customers.
VIC:VIC
Reproduce: Capstone Project Milestone 3-
Hypothesis
URL of GitHub Report:
https://colab.research.google.com/drive/1Y2q-ZWvUuwSDy-
N8Q2M0DDPzatRM6rWG#scrollTo=3G7BH6yqxh31
Data source:
https://www.kaggle.com/ranja7/vehicle-insurance-customer-data
One Sample T-test
I use the One Sample T-test to test the mean of the “Months Since Last Claim” since I want to verify my guessing
on the mean of Months Since Last Claim.
Null Hypothesis: The mean of balance is 30.
Result: The p-value<0.05. We conclude that at the significant level 0.05. We can reject the null hypothesis that
the mean of balance equals to 30.
Two Sample T-test
1. I use the Two Sample T-test to test the if the mean
balance of people who have Gender and mean
Income of those who do not have loan are the
same.
2. Null Hypothesis: The mean Income of people who
have Gender and mean Income of those who do
not have Gender are equal.
3. Result: The p-value>0.05. So that is not significant,
and so it reject the null hypothesis that the mean
balance of two groups are equal.
One-Way ANOVA
• I use the One Way ANOVA to test the if the
mean Income of people with different jobs
are the equal or not.
• Null Hypothesis: The mean Income of
people with different Education are equal.
• Result: The p-value<0.05. We conclude that
at the significant level 0.05. We can reject
the null hypothesis that the mean Income of
people with different Education are not equal.
Power Analysis and Final Remarks
• We want to find the appropriate sample size of the research, so we set Cohen d,
power and alpha to do the power analysis
• Result: For a Cohen d effect size of 0.1, a power of 0.8, and a p-value of 0.05, we
need a sample size of 1571.
conclusion
According to the One-sample-T-test test, my hypothesis is that the number of months since
the last claim is 30 months, but my P-Value is less than 0.05 so I need more time and I
rejected the null hypothesis.
According to the Two-sample-T-test test, I set that the income of customers of different
genders is also different, and my P-Value is greater than 0.05, so my hypothesis can be
agreed, and for One-Way ANOVA, I I chose different education levels to define different
income variables, and my P-value is less than 0.05, so my assumption of different incomes
for people with different education levels is acceptable.
Part VI: Appendix (include your revised and
polished version of previous submissions)
•Capstone Project Milestone 2: Research Design and The Data
•Capstone Project Milestone 3: Hypothesis Testing
•Capstone Project Milestone 4: Regression
•Capstone Project Milestone 5: Clustering
Capstone Project Milestone 2: Research
Design and The Data
In essence, UMA allows counterparties to digitize and
automate any real-world financial derivatives(such
as futures, contracts for difference(CFD) or total
return swaps)。 It can also create self-fulfilling
derivative contracts based on digital assets just like
other cryptocurrencies。 Traditional financial
markets have high barriers to entry in the form of
regulations and regulatory requirements, which
often prevents individuals from participating.
Prospective traders and investors often find it ult to
participate in markets outside their local financial
system。 This prevents the emergence of truly
inclusive global financial markets. The purpose of
analyzing the highest value of the transaction is to
maximize the benefits for customers in short-term
transactions, and to achieve the highest possible
predictable evaluation of benefits so that customers
can trade at the peak.
Abstract:
Page 1 Executive Summary
Bank Marketing Data
• https://data.world/data-society/bank-marketing-data
Data source for value
• https://stats.oecd.org/index.aspx?queryid=33940#
URL of My Github repo
• https://github.com/MshJackson/NYU_Integrated_Marketing/blob/main/%
E2%80%9CJackson%E2%80%9D%E7%9A%84%E5%89%AF%E6%9C%AC.ipyn
b
Capstone Project Milestone 3: Hypothesis Testing
Capstone Project Milestone 3: Hypothesis
Testing
Summary
Our data is obtained from these two websites respectively
showing the EU G20 market data and direct marketing
activities with Portuguese banking institutions.
At the same time, market data can compare two or more
quarters to clarify the quarterly trend.
Paired T-Test
Conclusion:
As my data concluded that the
numbers for the 2018 and 2019
quarters are different, the epidemic
still affected GDP and because it was a
negative number, it increased in the
second year.
• Why you choose this test?
Countries Tested twice in the same dial country
• What is the null hypothesis?
2018Q2 lower than 2019Q2
Conclusion: Because the normal appears to equal False so I choose corr(Method=“Pearson ”)
• Why you choose this test?
Date normal distribute being no outliers, so we choose Pearson
• What is the null hypothesis?
2018Q2/2019Q2 are not correlated
Conclusion:
Since the P value is less than 0.5, the with null assumption is still rejected.
Conclusion: For the degree of freedom of 0.783, effect size of 0.3, a power of 0.80, and a type I error of 0.05,
we need a sample size of 81.
Conclusion: For a 0.27 cohen d effect size, a power of 0.80, and a type I error of 0.05, we need a sample
size of 1571 (for each group).
Final Remark
Limitation and Improvement:
The paired test is used to identify and describe various tests of mean
differences. They have functional limitations. Short-term contingency
and overlap of repeated data in repeated tests cannot be obtained
when comparing more than two quarters. Therefore, I believe that the
paired test does not satisfy the completeness of all interval analysis and
better tolerance, so short-term samples cannot be obtained, and short-
term growth trends will not be able to obtain a complete analysis and
conclusions suitable for short-term.
Capstone Project Milestone
4: Regression
Executive Summary
The Data come from Kaggle
• URL: https://www.kaggle.com/c/customer-churn-prediction-2020
In this reports I use Logit Model to analyze probability of
success.
In our analyze X includes Voice message, day calls, and
night call
P is Probability of success
Results appears precision is high through the whole test
and total day calls has greatest increase on churn.
Logit Regression Result
The three X elements within this result appears only the vmail message is less than 0.05 which is
0.000(significant), and the rest two which (day calls and night calls are not significant influence on
the number of churns which can not reject the null hypothesis )
Odds ratio
The total day calls has greatest influence
which increase the day calls would
increase 1.000907 units odds ratio of
churn
In the picture it appears:
• Total day calls
• Numbers of voice mail messages
• Total night calls
evaluate the result
The accuracy rate is 0.87 The precision is high
base on the test result.
Capstone Project Milestone
5: Customer Segmentation
Executive Summary
• Kaggle Notebook URL:
https://www.kaggle.com/shihaomao/customer-segmentation-
sm9555
• Data Set:https://www.kaggle.com/sunshineluyaozhang/customer-
segementation-lz2520
• The country I choose is Germanyto build a RFM clustering and choose
the best set of customers which the company should target. And the
Metric I use is Calinski_Harabasz, base on the result appears the best
K is 4, therefor is first “Cluster_Id ”I select 2, and for“Cluster_Labels”
the selection is also 2.
K-Means Clustering
The best K is 4
K-Means Clustering
By the RFM criteria, we should choose the customer clusters with a lower recency, a higher frequency and amount. From
the K-means clustering results, we can see that customers with Cluster Labels=2 best fit the criteria.
Lowest recency is 2 Highest frequency is 2 Highest amount is 2
K-Means Clustering
We can see that we k-Means
Clustering returns 3 target customer.
Hierarchical Clustering
Visualize Tree by Linkage Methods
Single Linkage Complete Linkage Average Linkage
visualize Cluster Id vs Frequency
By the RFM criteria, we should choose the customer clusters
with a lower recency, a higher
frequency and amount. From the K-means clustering results,
we can see that customers with
Cluster_Labels=1 best fit the criteria.
Recency (Low) Frequency (High)
Amount (High)
We can see that Hierarchical Clustering returns 2 target customer
for customer cluster 2, which is a much smaller group than the
one that K-Means Clustering return.

Final presentation

  • 1.
    Final Presentation Slides Draft STATISTICALMEASUREMENTS, ANALYSIS & RESEARCH Jackson Mao Net ID: sm9555 2020.12.01
  • 2.
    Self-Introduction I am ShihaoMao also go by Jackson, So after receiving my undergraduate degree from W.P. Carey School Business School of Arizona State University, I start my internship at IDG Capital, learning and accumulating experience in venture capital, mergers and acquisitions and other projects.(During this period, those investment projects I participate were mainly Internet companies in the consumer finance field, mergers and acquisitions loans for real estate companies, and learning theories of financial leverage.). After that, I participated in the IPO projects of two Electronic Chip companies and investing in a freight logistics platform company which is expected to be listed on the SSE STAR MARKET (Sci-Tech innovation board) in 2021 ZTF Securities Co., Ltd. In addition, I also have some basic understanding and participation in consumer finance, auto finance(Chery Automobile mixed reform), and biodegradable plastic bag production fields. B.S. in Entrepreneurship |W. P. Carey Business School of Arizona State University LinkedIn: https://www.linkedin.com/in/%E4%B8%96%E8%B1%AA- %E6%AF%9B-780a6010a/ GitHub Repo Link: https://github.com/Msh- Jackson/NYU_Integrated_Marketing Kaggle Notebook Link: https://www.kaggle.com/shihaomao
  • 3.
    Part II:Summary What Ilearned from this class is statistical analysis used in marketing which including the sampling techniques, marketing test design and analysis. Among them, what I have benefited most is the sample size estimation and test evaluation through learning and how to connect with modeling/joint analysis, and ranking correlation, etc. These contents will be the real life daily work that if I participate market department or doing marketing job in the future. In my personal perspective, my biggest improvement is when I use Kaggle and Github to conduct sample size estimation and test evaluation. In this process, I can find data sources. In addition, I have also learned the logic of these models.
  • 4.
    Part III: Yourown market research report • Session 1:Find a new dataset • Session 2: Reproduce-Capstone Project Milestone 2: Research Design and The Data • Session 3: Reproduce: Capstone Project Milestone 3- Hypothesis Testing, OR Capstone Project Milestone 4- Regression, Capstone Project Milestone 5- Clustering
  • 5.
    Session 1:Find anew dataset Data source: https://www.kaggle.com/ranja7/vehicle-insurance-customer-data Context : The socio-economic data of the customer with details about the insured vehicle is the data content. Data contains both categorical and numeric variables. The customer lifetime value based on historical data has also been provided which is essential in understanding the customer purchase behavior.
  • 6.
    Vehicle Insurance Customer DataVIC :5106 Total Claims and Vehicle Class This is the customer data and its vehicle insurance policy. This provides us with detailed information about the customer and its vehicle insurance, which can be subdivided to subdivide similar customers. VIC:VIC
  • 7.
    Reproduce: Capstone ProjectMilestone 3- Hypothesis URL of GitHub Report: https://colab.research.google.com/drive/1Y2q-ZWvUuwSDy- N8Q2M0DDPzatRM6rWG#scrollTo=3G7BH6yqxh31 Data source: https://www.kaggle.com/ranja7/vehicle-insurance-customer-data
  • 8.
    One Sample T-test Iuse the One Sample T-test to test the mean of the “Months Since Last Claim” since I want to verify my guessing on the mean of Months Since Last Claim. Null Hypothesis: The mean of balance is 30. Result: The p-value<0.05. We conclude that at the significant level 0.05. We can reject the null hypothesis that the mean of balance equals to 30.
  • 9.
    Two Sample T-test 1.I use the Two Sample T-test to test the if the mean balance of people who have Gender and mean Income of those who do not have loan are the same. 2. Null Hypothesis: The mean Income of people who have Gender and mean Income of those who do not have Gender are equal. 3. Result: The p-value>0.05. So that is not significant, and so it reject the null hypothesis that the mean balance of two groups are equal.
  • 10.
    One-Way ANOVA • Iuse the One Way ANOVA to test the if the mean Income of people with different jobs are the equal or not. • Null Hypothesis: The mean Income of people with different Education are equal. • Result: The p-value<0.05. We conclude that at the significant level 0.05. We can reject the null hypothesis that the mean Income of people with different Education are not equal.
  • 11.
    Power Analysis andFinal Remarks • We want to find the appropriate sample size of the research, so we set Cohen d, power and alpha to do the power analysis • Result: For a Cohen d effect size of 0.1, a power of 0.8, and a p-value of 0.05, we need a sample size of 1571.
  • 12.
    conclusion According to theOne-sample-T-test test, my hypothesis is that the number of months since the last claim is 30 months, but my P-Value is less than 0.05 so I need more time and I rejected the null hypothesis. According to the Two-sample-T-test test, I set that the income of customers of different genders is also different, and my P-Value is greater than 0.05, so my hypothesis can be agreed, and for One-Way ANOVA, I I chose different education levels to define different income variables, and my P-value is less than 0.05, so my assumption of different incomes for people with different education levels is acceptable.
  • 13.
    Part VI: Appendix(include your revised and polished version of previous submissions) •Capstone Project Milestone 2: Research Design and The Data •Capstone Project Milestone 3: Hypothesis Testing •Capstone Project Milestone 4: Regression •Capstone Project Milestone 5: Clustering
  • 14.
    Capstone Project Milestone2: Research Design and The Data In essence, UMA allows counterparties to digitize and automate any real-world financial derivatives(such as futures, contracts for difference(CFD) or total return swaps)。 It can also create self-fulfilling derivative contracts based on digital assets just like other cryptocurrencies。 Traditional financial markets have high barriers to entry in the form of regulations and regulatory requirements, which often prevents individuals from participating. Prospective traders and investors often find it ult to participate in markets outside their local financial system。 This prevents the emergence of truly inclusive global financial markets. The purpose of analyzing the highest value of the transaction is to maximize the benefits for customers in short-term transactions, and to achieve the highest possible predictable evaluation of benefits so that customers can trade at the peak. Abstract:
  • 15.
    Page 1 ExecutiveSummary Bank Marketing Data • https://data.world/data-society/bank-marketing-data Data source for value • https://stats.oecd.org/index.aspx?queryid=33940# URL of My Github repo • https://github.com/MshJackson/NYU_Integrated_Marketing/blob/main/% E2%80%9CJackson%E2%80%9D%E7%9A%84%E5%89%AF%E6%9C%AC.ipyn b Capstone Project Milestone 3: Hypothesis Testing Capstone Project Milestone 3: Hypothesis Testing
  • 16.
    Summary Our data isobtained from these two websites respectively showing the EU G20 market data and direct marketing activities with Portuguese banking institutions. At the same time, market data can compare two or more quarters to clarify the quarterly trend.
  • 17.
    Paired T-Test Conclusion: As mydata concluded that the numbers for the 2018 and 2019 quarters are different, the epidemic still affected GDP and because it was a negative number, it increased in the second year. • Why you choose this test? Countries Tested twice in the same dial country • What is the null hypothesis? 2018Q2 lower than 2019Q2
  • 18.
    Conclusion: Because thenormal appears to equal False so I choose corr(Method=“Pearson ”) • Why you choose this test? Date normal distribute being no outliers, so we choose Pearson • What is the null hypothesis? 2018Q2/2019Q2 are not correlated
  • 19.
    Conclusion: Since the Pvalue is less than 0.5, the with null assumption is still rejected.
  • 20.
    Conclusion: For thedegree of freedom of 0.783, effect size of 0.3, a power of 0.80, and a type I error of 0.05, we need a sample size of 81.
  • 21.
    Conclusion: For a0.27 cohen d effect size, a power of 0.80, and a type I error of 0.05, we need a sample size of 1571 (for each group).
  • 22.
    Final Remark Limitation andImprovement: The paired test is used to identify and describe various tests of mean differences. They have functional limitations. Short-term contingency and overlap of repeated data in repeated tests cannot be obtained when comparing more than two quarters. Therefore, I believe that the paired test does not satisfy the completeness of all interval analysis and better tolerance, so short-term samples cannot be obtained, and short- term growth trends will not be able to obtain a complete analysis and conclusions suitable for short-term.
  • 23.
  • 24.
    Executive Summary The Datacome from Kaggle • URL: https://www.kaggle.com/c/customer-churn-prediction-2020 In this reports I use Logit Model to analyze probability of success. In our analyze X includes Voice message, day calls, and night call P is Probability of success Results appears precision is high through the whole test and total day calls has greatest increase on churn.
  • 25.
    Logit Regression Result Thethree X elements within this result appears only the vmail message is less than 0.05 which is 0.000(significant), and the rest two which (day calls and night calls are not significant influence on the number of churns which can not reject the null hypothesis )
  • 26.
    Odds ratio The totalday calls has greatest influence which increase the day calls would increase 1.000907 units odds ratio of churn In the picture it appears: • Total day calls • Numbers of voice mail messages • Total night calls
  • 27.
    evaluate the result Theaccuracy rate is 0.87 The precision is high base on the test result.
  • 28.
    Capstone Project Milestone 5:Customer Segmentation
  • 29.
    Executive Summary • KaggleNotebook URL: https://www.kaggle.com/shihaomao/customer-segmentation- sm9555 • Data Set:https://www.kaggle.com/sunshineluyaozhang/customer- segementation-lz2520 • The country I choose is Germanyto build a RFM clustering and choose the best set of customers which the company should target. And the Metric I use is Calinski_Harabasz, base on the result appears the best K is 4, therefor is first “Cluster_Id ”I select 2, and for“Cluster_Labels” the selection is also 2.
  • 30.
  • 31.
    K-Means Clustering By theRFM criteria, we should choose the customer clusters with a lower recency, a higher frequency and amount. From the K-means clustering results, we can see that customers with Cluster Labels=2 best fit the criteria. Lowest recency is 2 Highest frequency is 2 Highest amount is 2
  • 32.
    K-Means Clustering We cansee that we k-Means Clustering returns 3 target customer.
  • 33.
    Hierarchical Clustering Visualize Treeby Linkage Methods Single Linkage Complete Linkage Average Linkage
  • 34.
    visualize Cluster Idvs Frequency By the RFM criteria, we should choose the customer clusters with a lower recency, a higher frequency and amount. From the K-means clustering results, we can see that customers with Cluster_Labels=1 best fit the criteria. Recency (Low) Frequency (High) Amount (High) We can see that Hierarchical Clustering returns 2 target customer for customer cluster 2, which is a much smaller group than the one that K-Means Clustering return.