Oliver Gong presents a market research report on consumer spending at XYZ Supermarket. The report includes:
- An analysis of consumer spending scores by age group using XYZ's customer data, which found spending was highest among 30-35 year olds and lowest among 19-29 year olds.
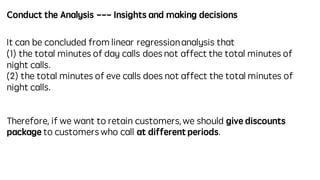
- A linear regression analysis showing that age affects spending score but annual income does not.
- Recommendations that XYZ segment customers by age group and develop targeted marketing strategies to increase spending among key groups.
- Notes that obtaining more customer data could make the results more reliable.