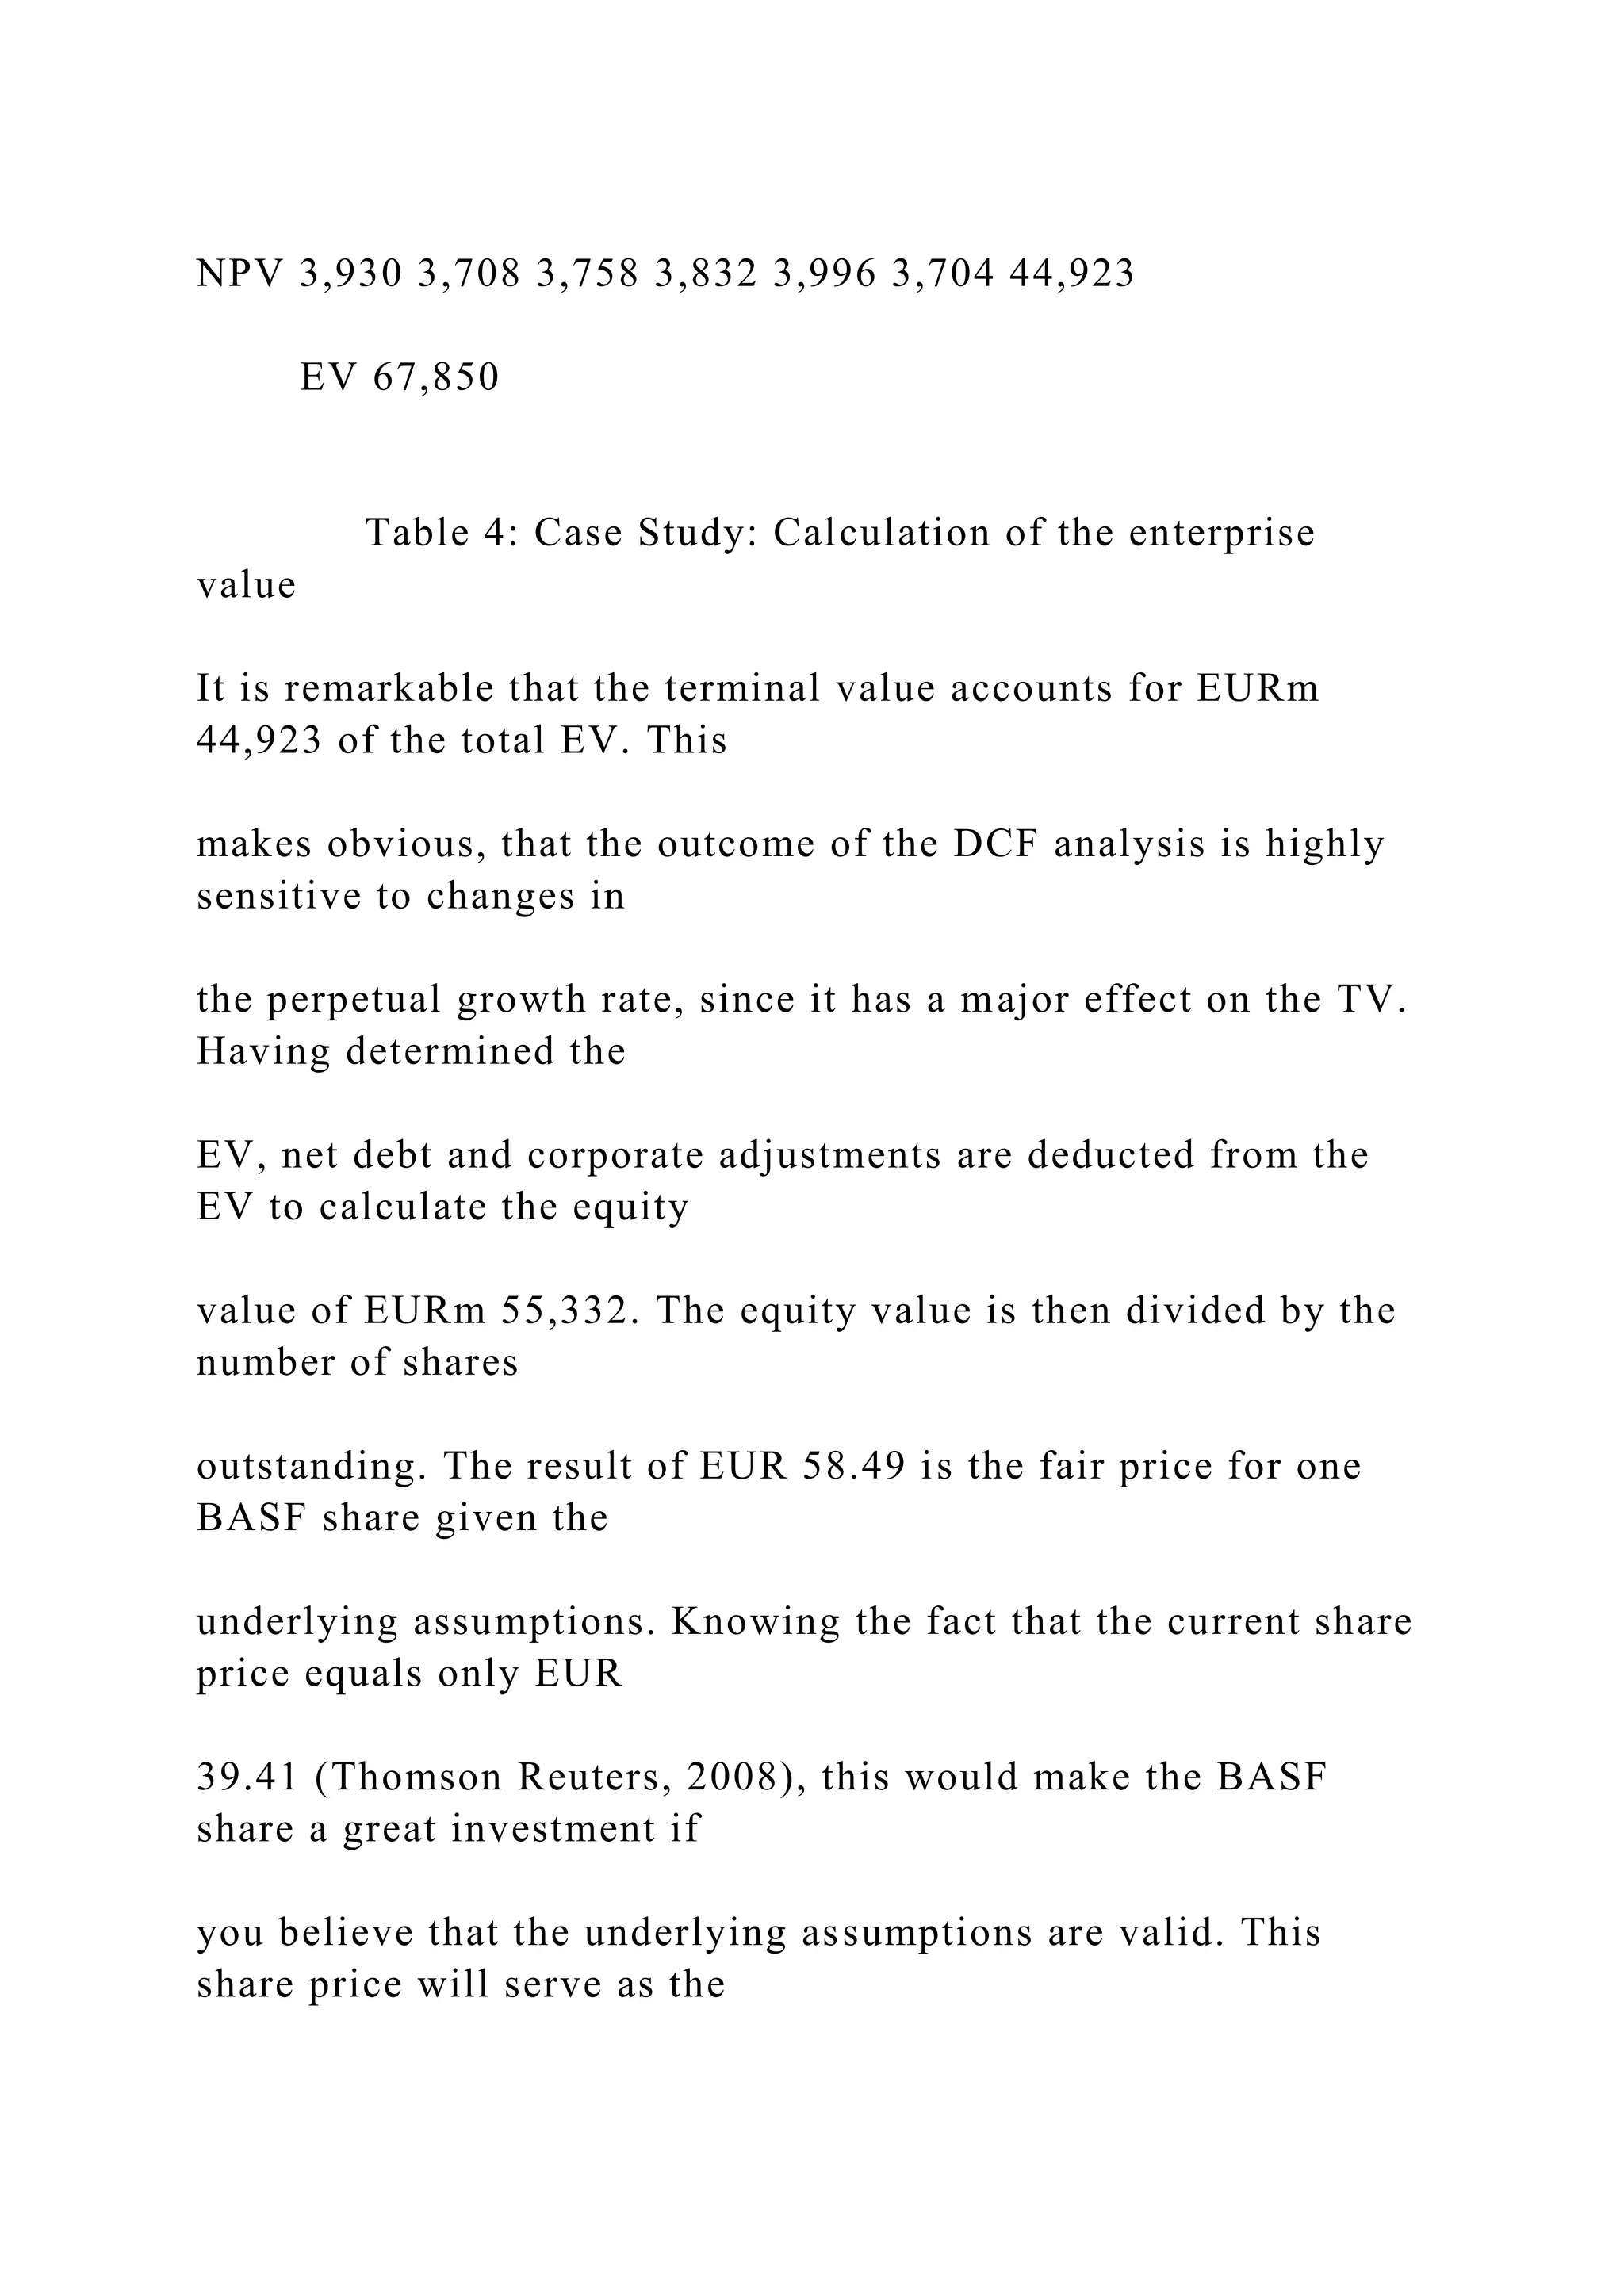
The document outlines the process of calculating the weighted average cost of capital (WACC) for a company, emphasizing the significance of the cost of capital and various methods to compute it. It explains the necessary components, such as the cost of equity and debt, and the importance of historical financial data for accurate estimation. Additionally, the text discusses the discounted cash flow (DCF) valuation method, its applications, and the impact of assumptions on company valuation.
![FIN 430 — Finance Theory and PracticeProject Assignments
Calculating theWeighted Average Cost of Capital (WACC)
foryour Company
For use in Conjunction with the Firm Valuation Project
First ensure that you have read relevant pages in the text. Some
important sections would include the following, but you may
also double-check the references in the text by using the index
[see: Cost of Capital and Target (optimal) Capital Structure,
etc.]:
The important Chapter in the text is the one entitled "The Cost
of Capital," – with a particular focus on the section entitled
“The Weighted Average Cost of Capital” and the section “Four
Mistakes to Avoid” at the end of the chapter.
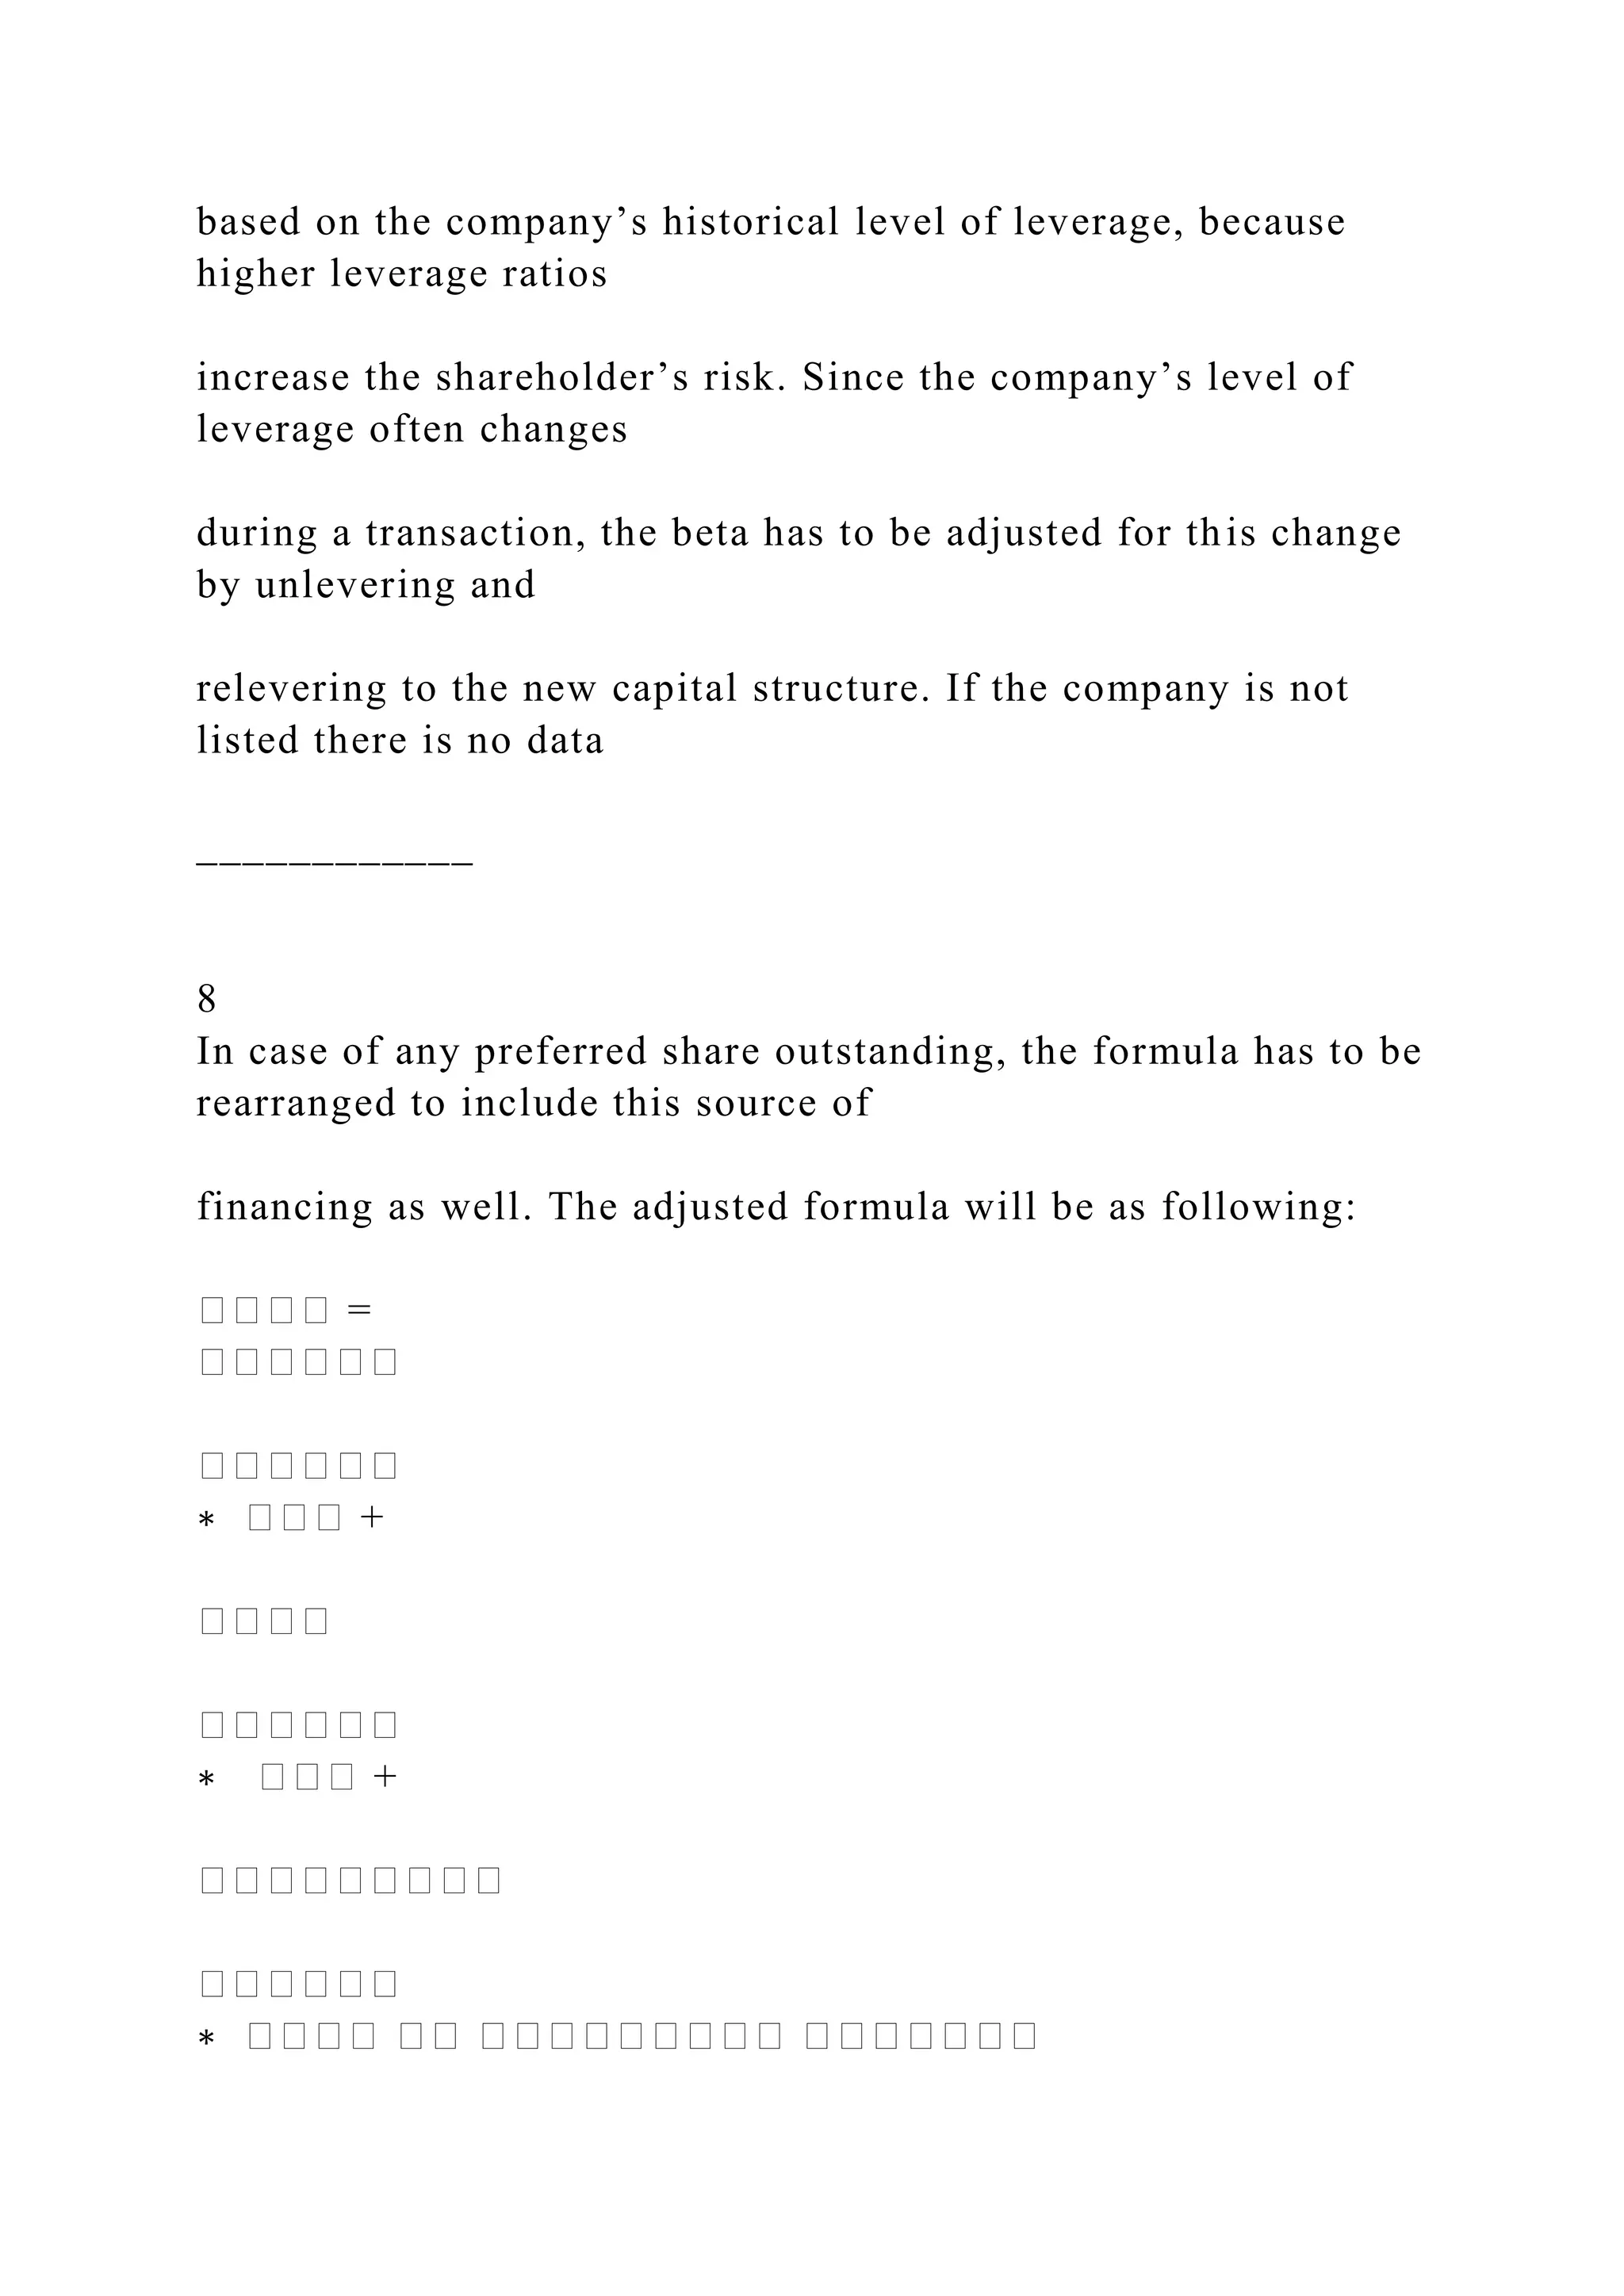
The WACC formula discussed below does not include Preferred
Stock. Should your company use PS, be sure to adjust the
equation for it, and see the section in the chapter on the Cost of
Preferred Stock.
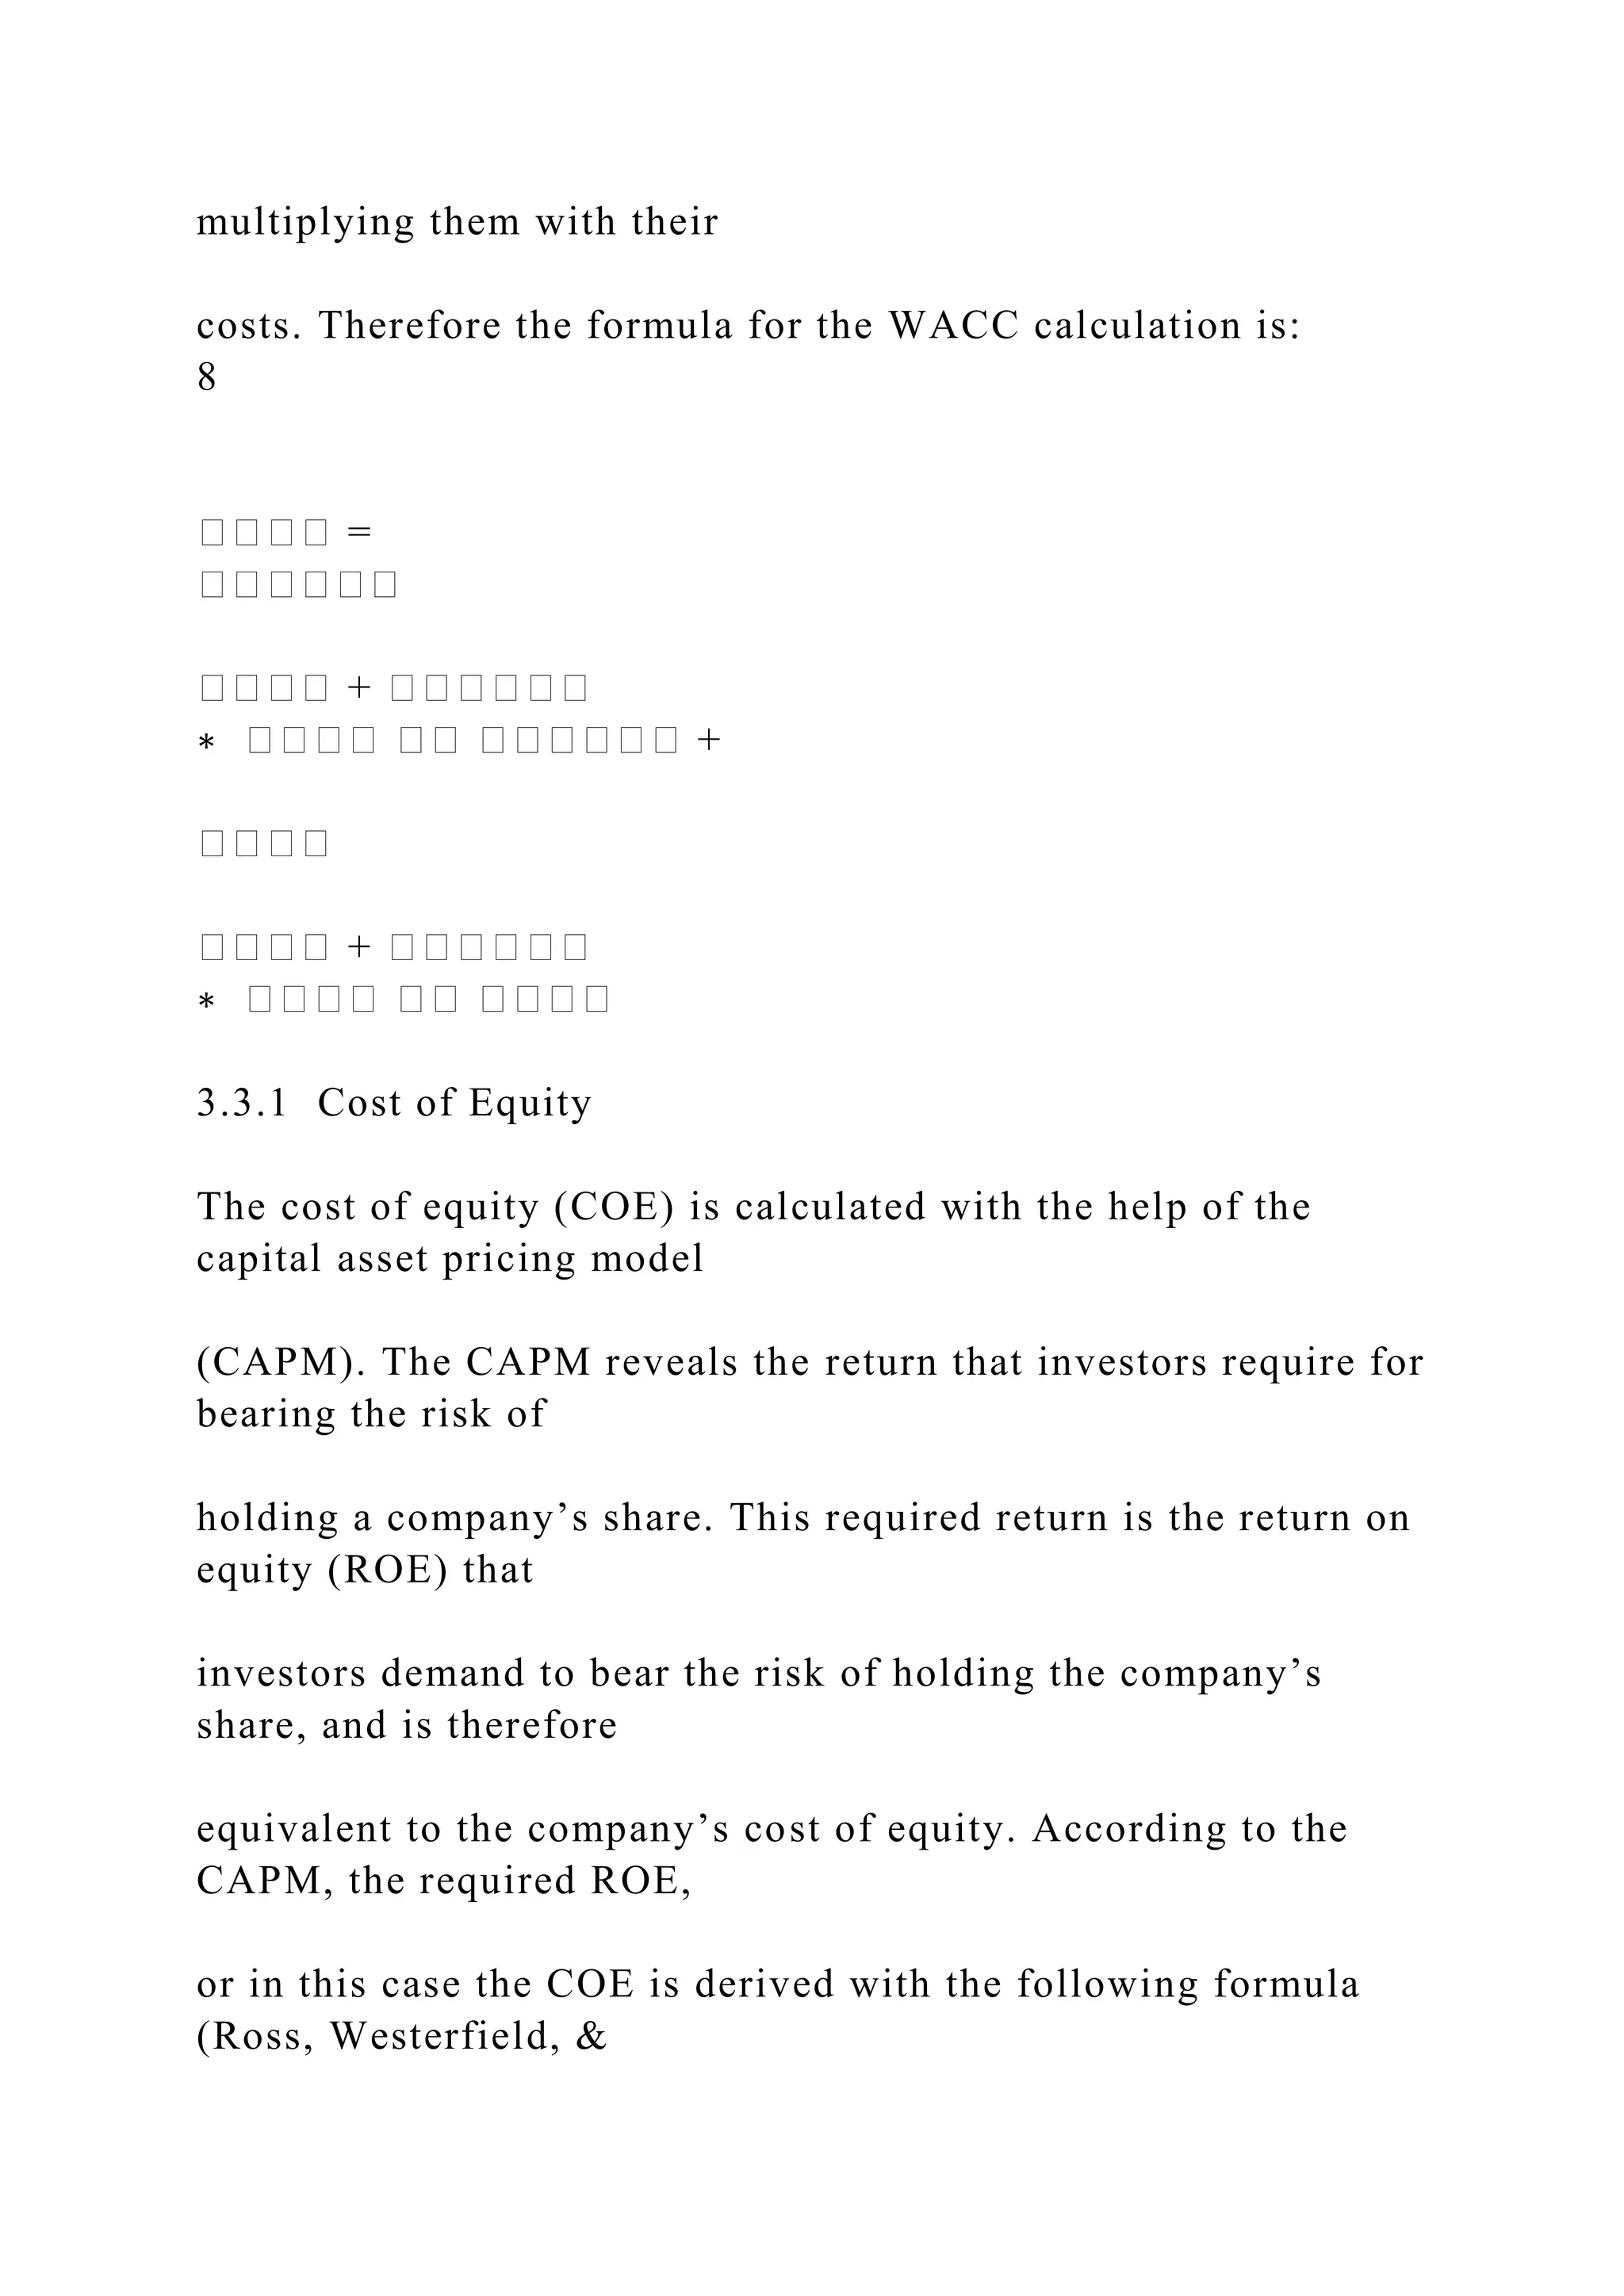
The WACC formula that we use is:
WACC = wdrd(1-T) + wsrs
We need to know how to calculate:
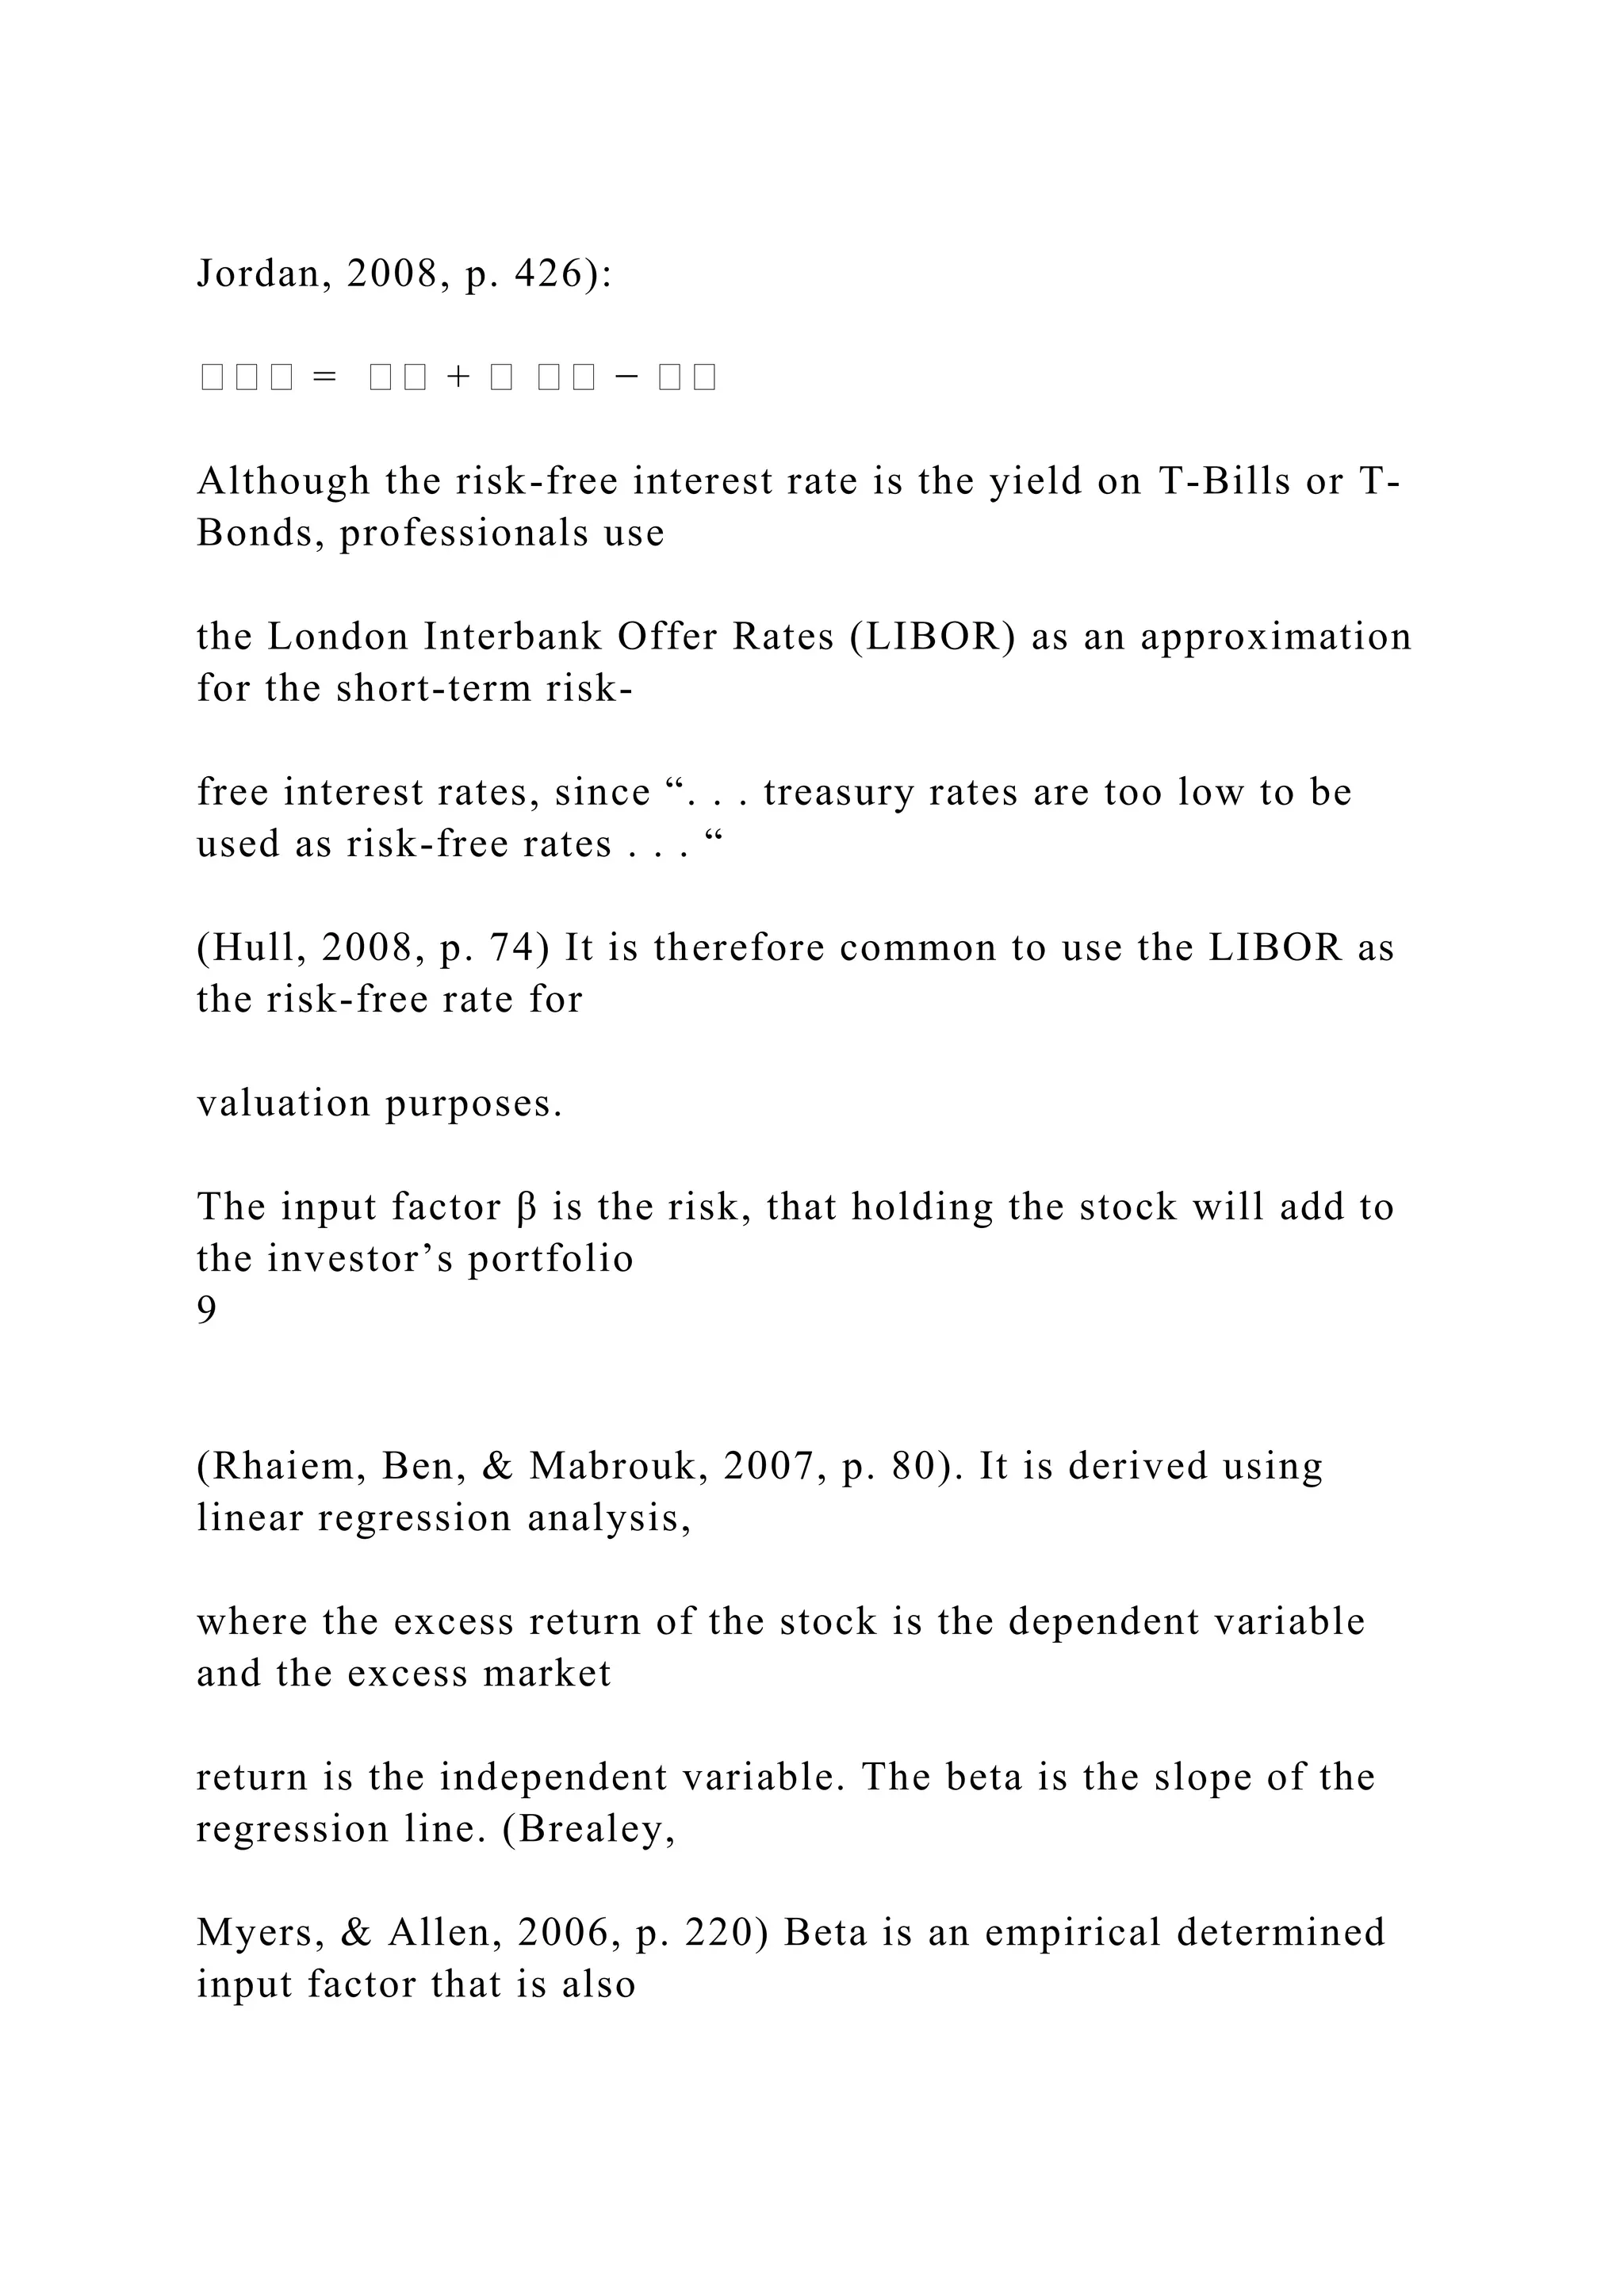
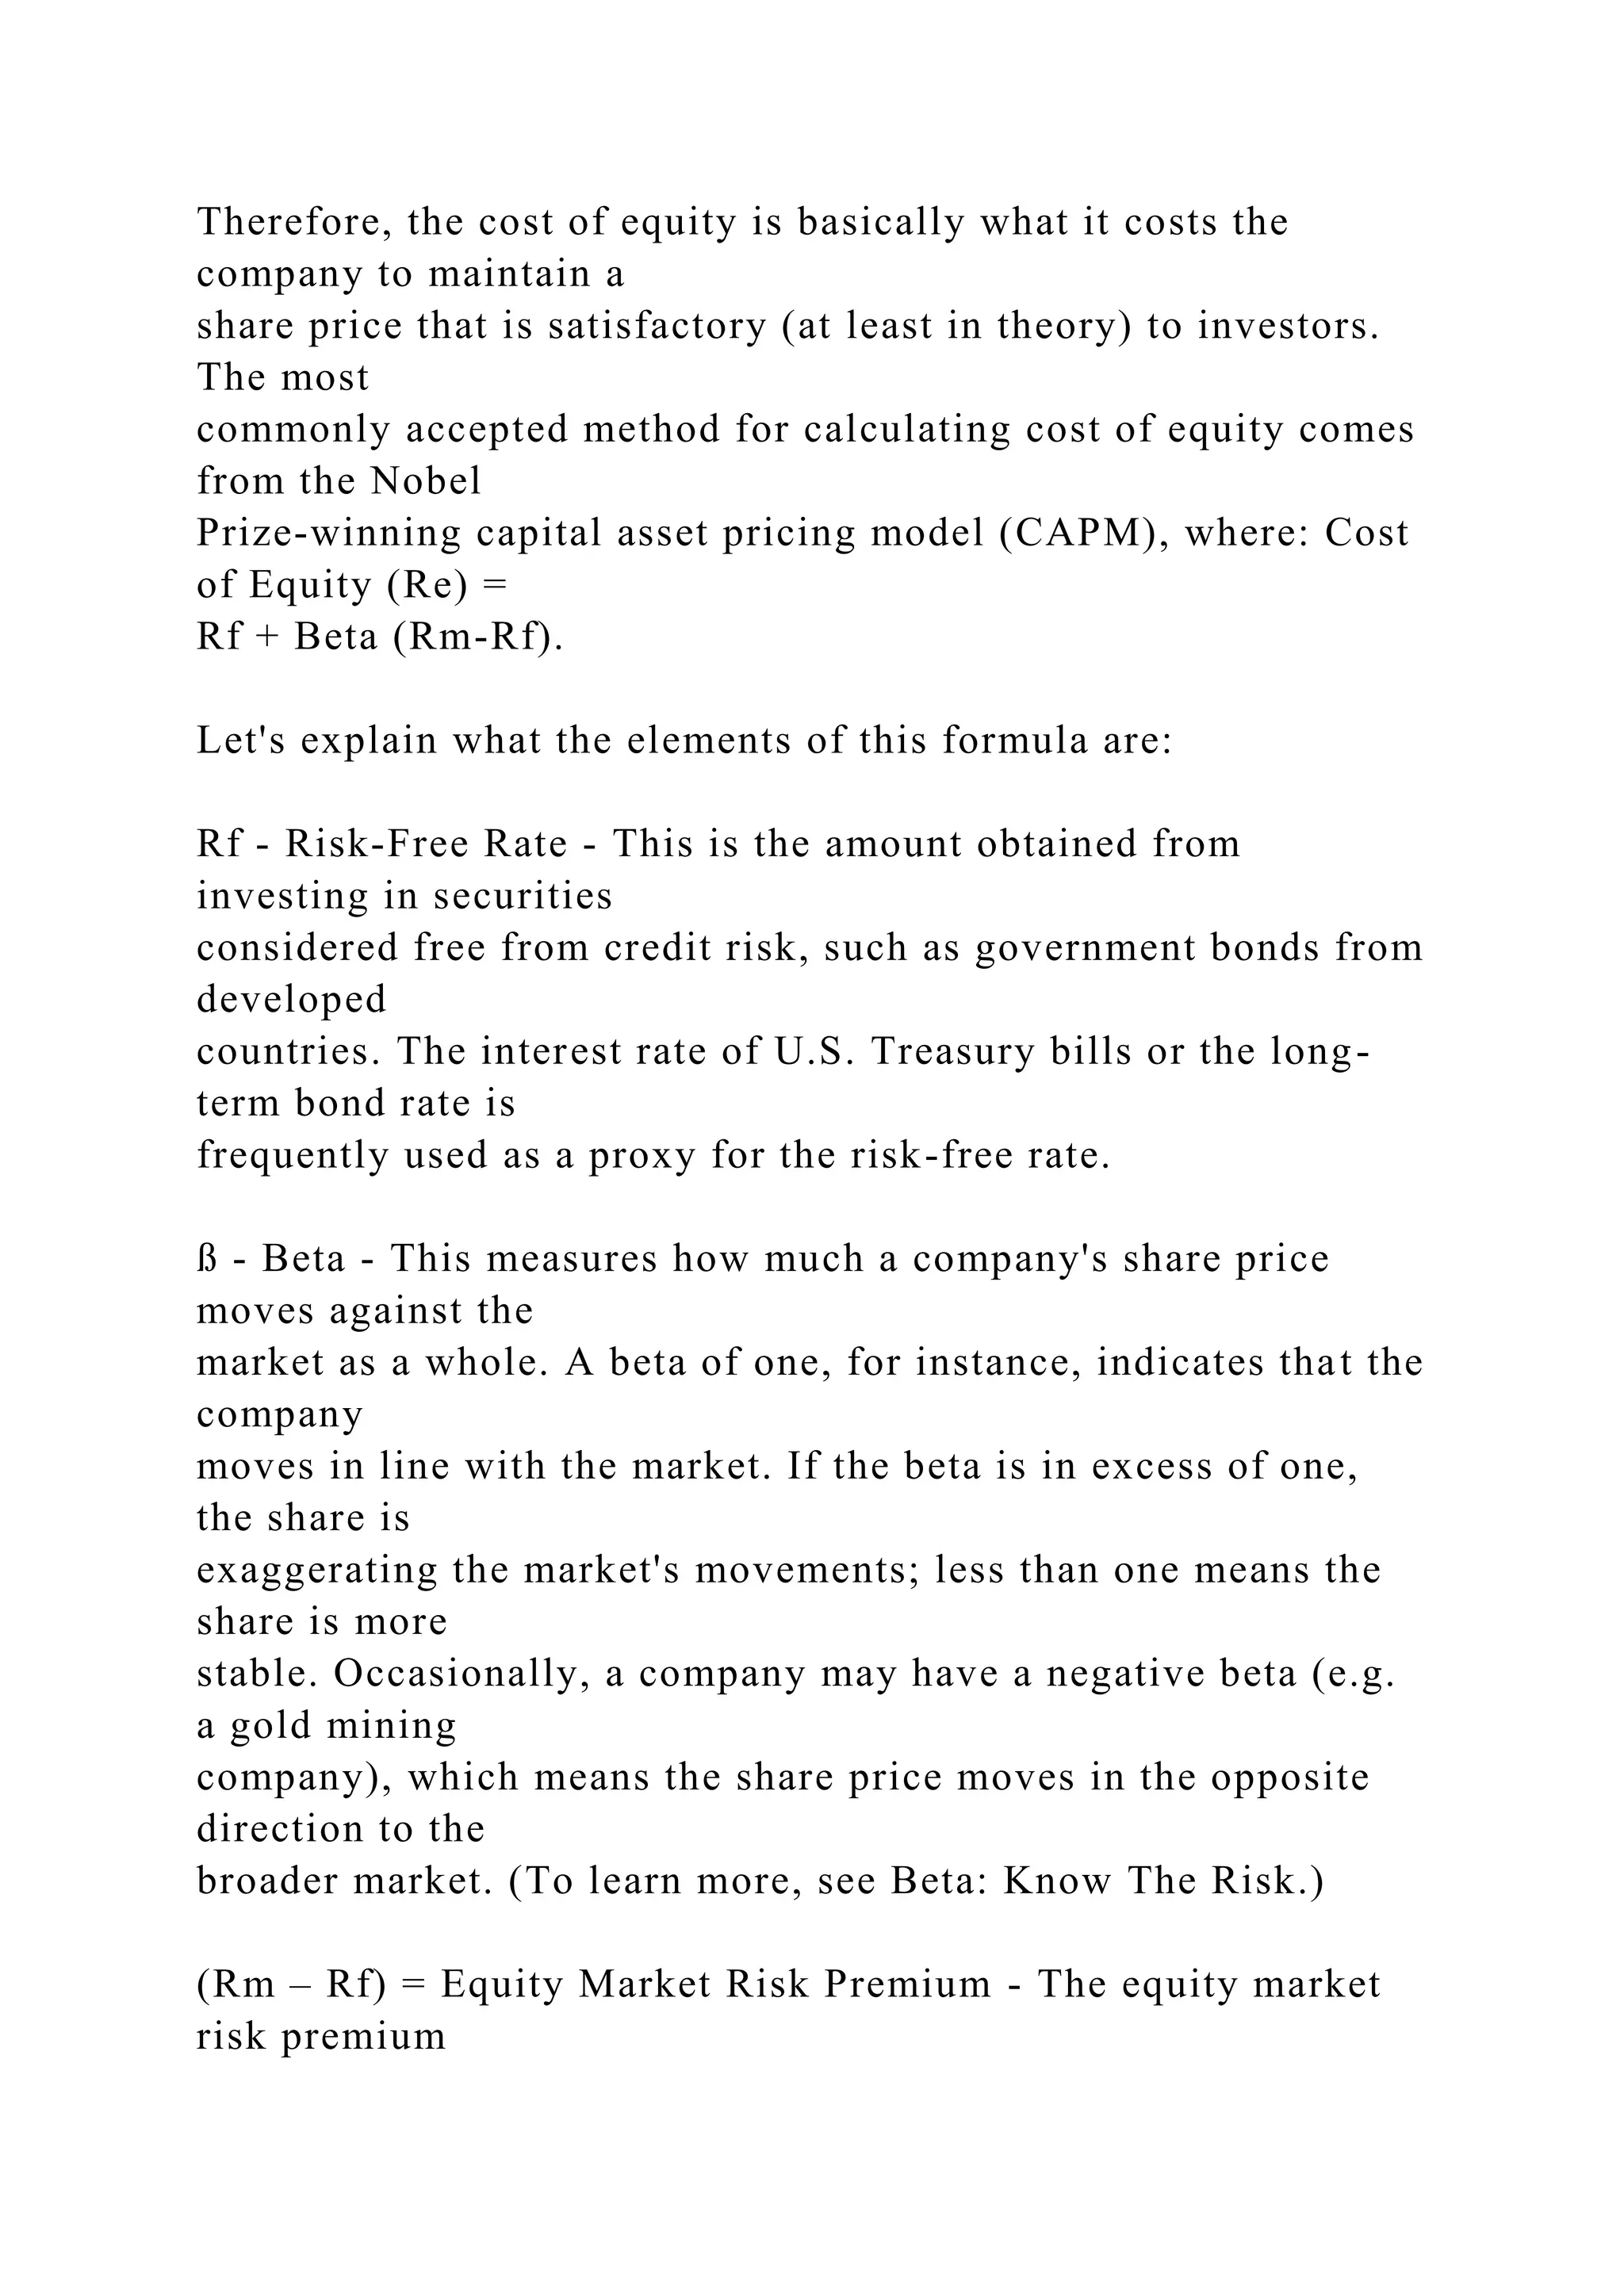
1. rsthe cost of common equity. Use the Security Market
Line (SML) – this is why you learn how to calculate a
company’s beta and also why you learn how to find the
appropriate risk-free rate and market-risk premium. For a](https://image.slidesharecdn.com/fin430financetheoryandpracticeprojectassignmentscalculat-221031130230-ab53fe6e/75/FIN-430-Finance-Theory-and-PracticeProject-AssignmentsCalculat-docx-1-2048.jpg)
![review, see the section the text, The CAPM Approach.
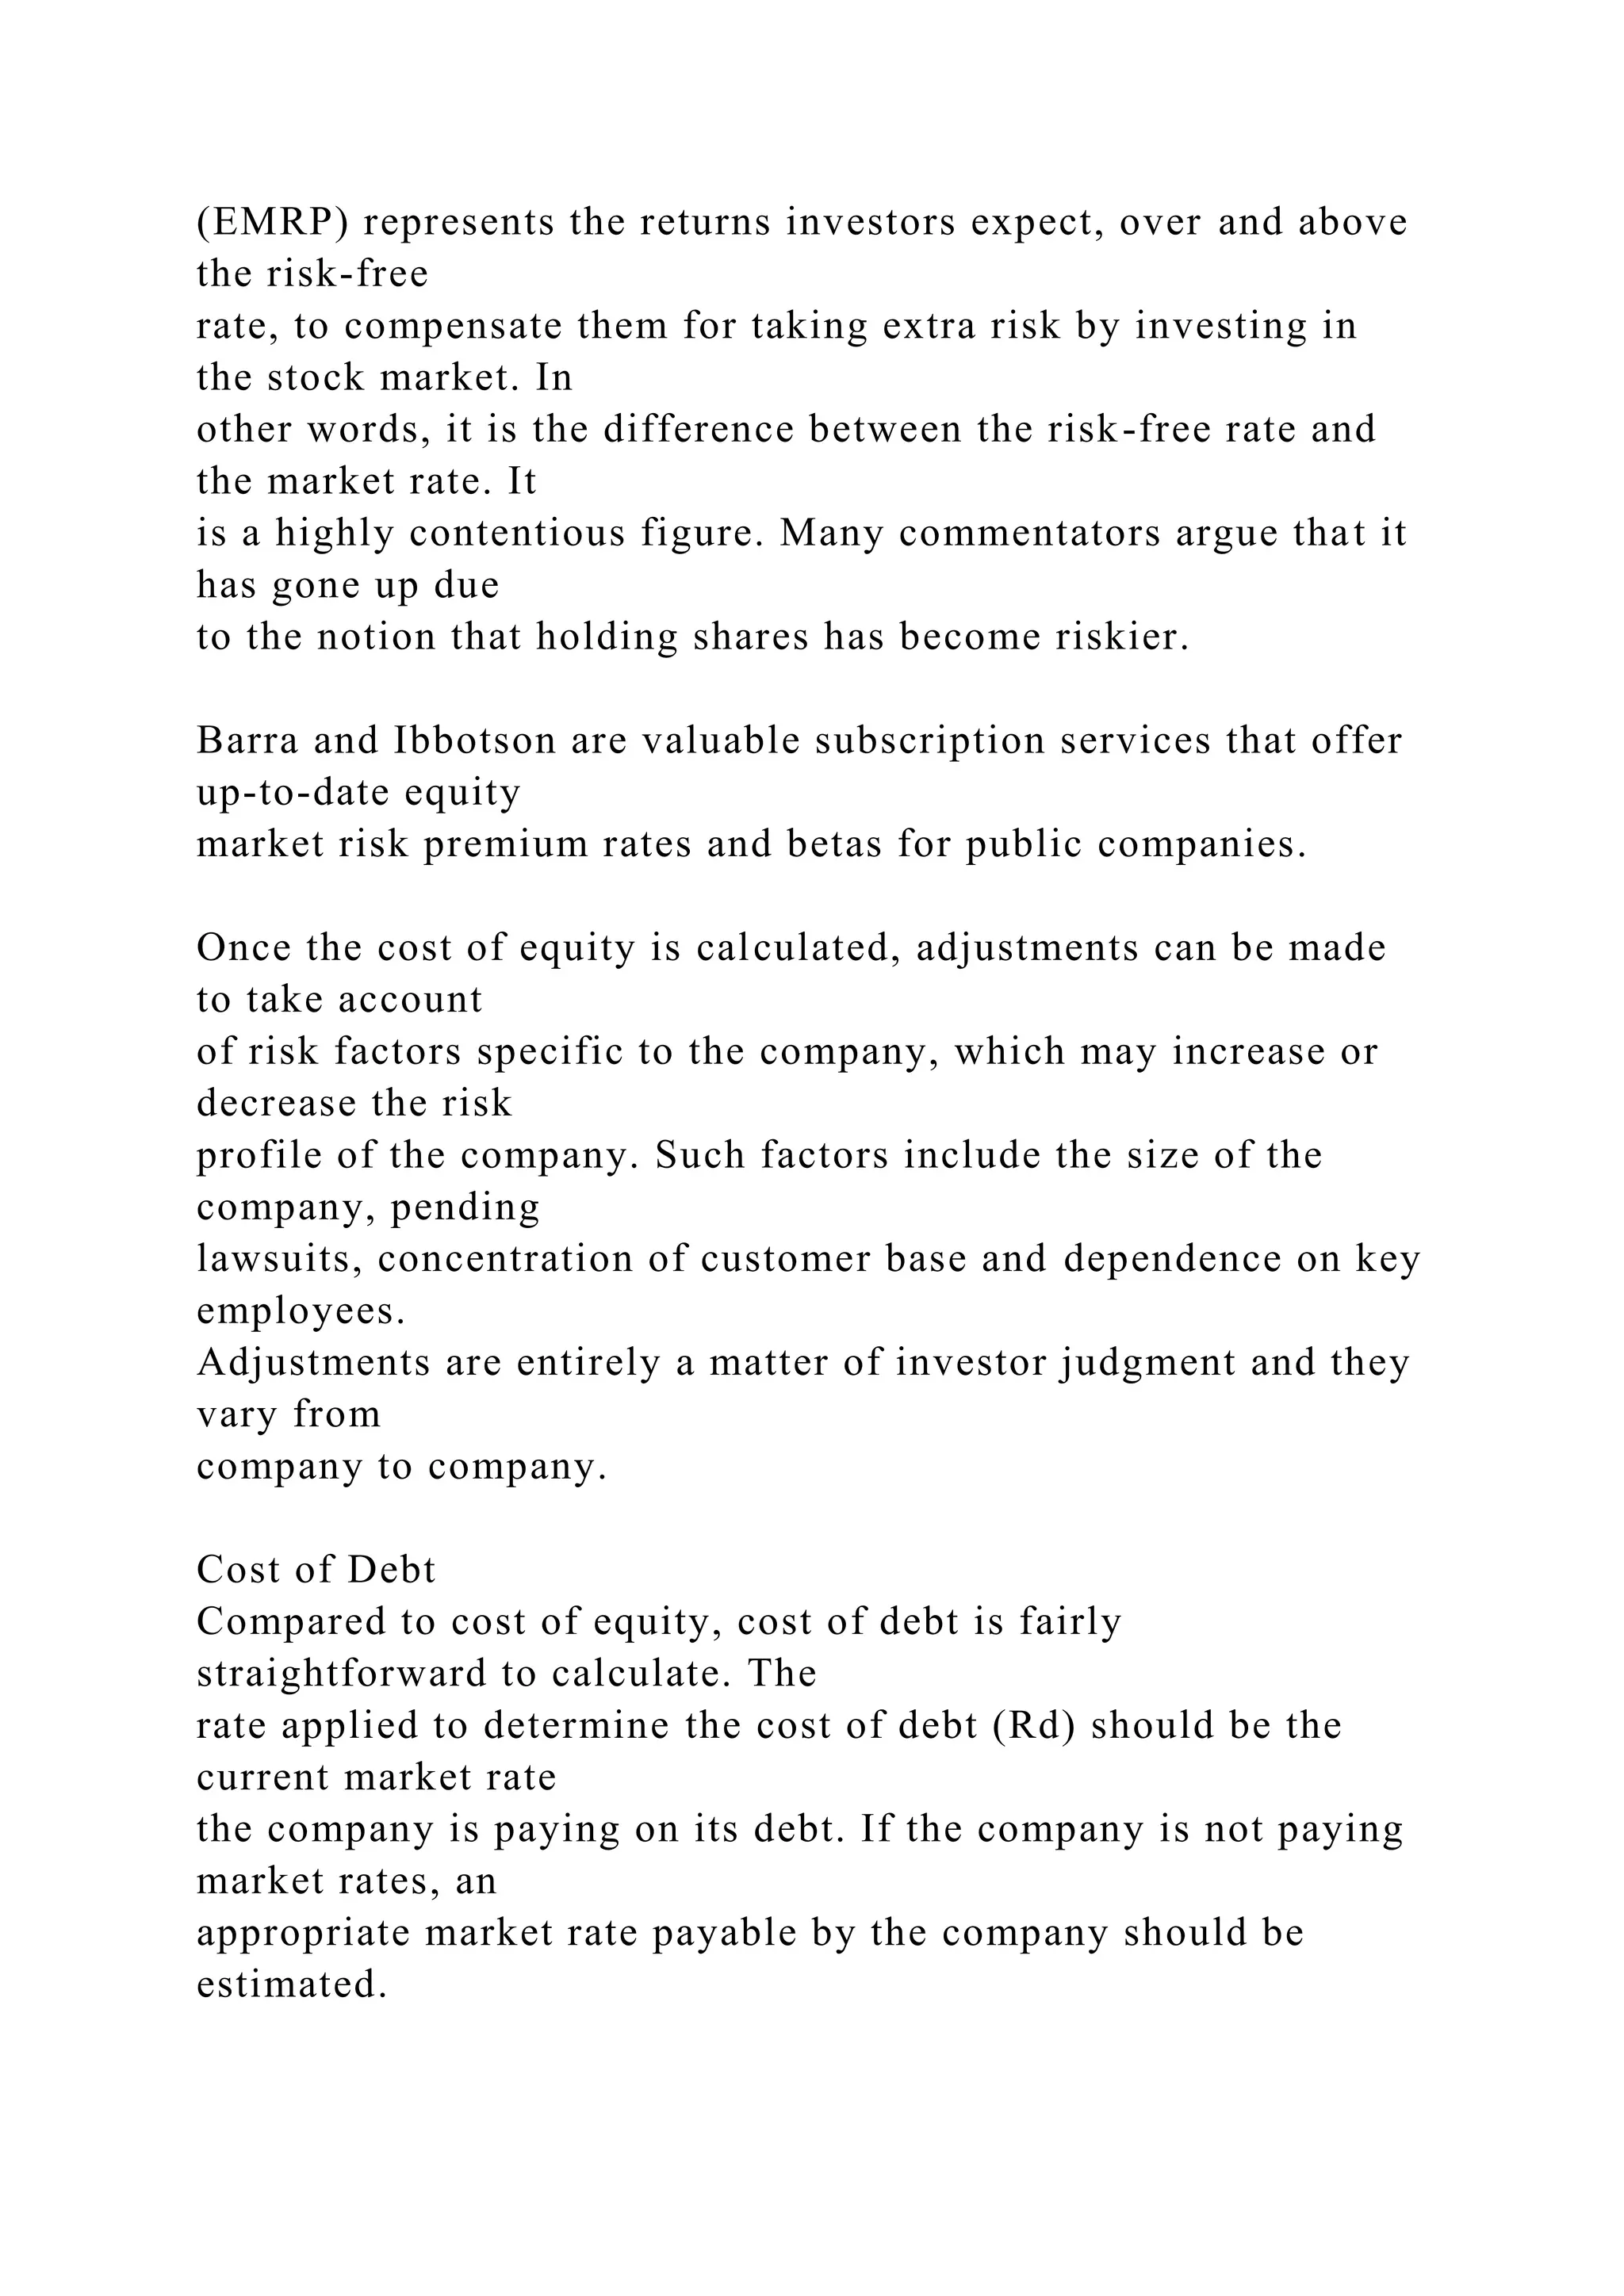
2. The weights (wd and ws – note that: wd + ws = 1; so you
only have to calculate one of them). We need to calculate the
weight of debt and the weight of equity (for the cost of debt,
this simply means: what proportion of the firm’s financing is by
debt?). There is a lot to say here, simplified as Theory 1,
Theory 2 and Practice:
a. Theory 1: Theory says that we should use the target
weights along with the market values of both debt and equity
(see the Four Mistakes to Avoid). But the market value of debt
is typically difficult to calculate, because we need to know the
YTM (which is rd) for all of the company’s debt, but we cannot
calculate the YTM without having the current prices of the
company’s outstanding bonds, and most company’s bonds do
not trade (i.e., they will not have up-to-date or current prices –
remember how to calculate the price (value) of a bond on your
calculators?!). As a result, at least for the group project, we go
to Theory 2.
b. Theory 2: Theory also says that we should use the
TARGET weights, but this is a management decision, and as
“outsiders” we do not have access to the thoughts of the CFO or
CEO. So we should look instead to the historical pattern of the
use of debt (mix of debt and equity), and this is one reason that
you should have about 10 years of financial data.
c. Practice: Since we cannot “work” according to the strict
theory of finance, we have to estimate the relevant weights. As
a result, we will use the formula:
wd = Book Value of Debt / [Market Value of Equity + Book
Value of Debt]
The book value of debt is calculated by adding up ALL of the](https://image.slidesharecdn.com/fin430financetheoryandpracticeprojectassignmentscalculat-221031130230-ab53fe6e/75/FIN-430-Finance-Theory-and-PracticeProject-AssignmentsCalculat-docx-2-2048.jpg)
![Seminar Paper
Fall 2008
Abstract
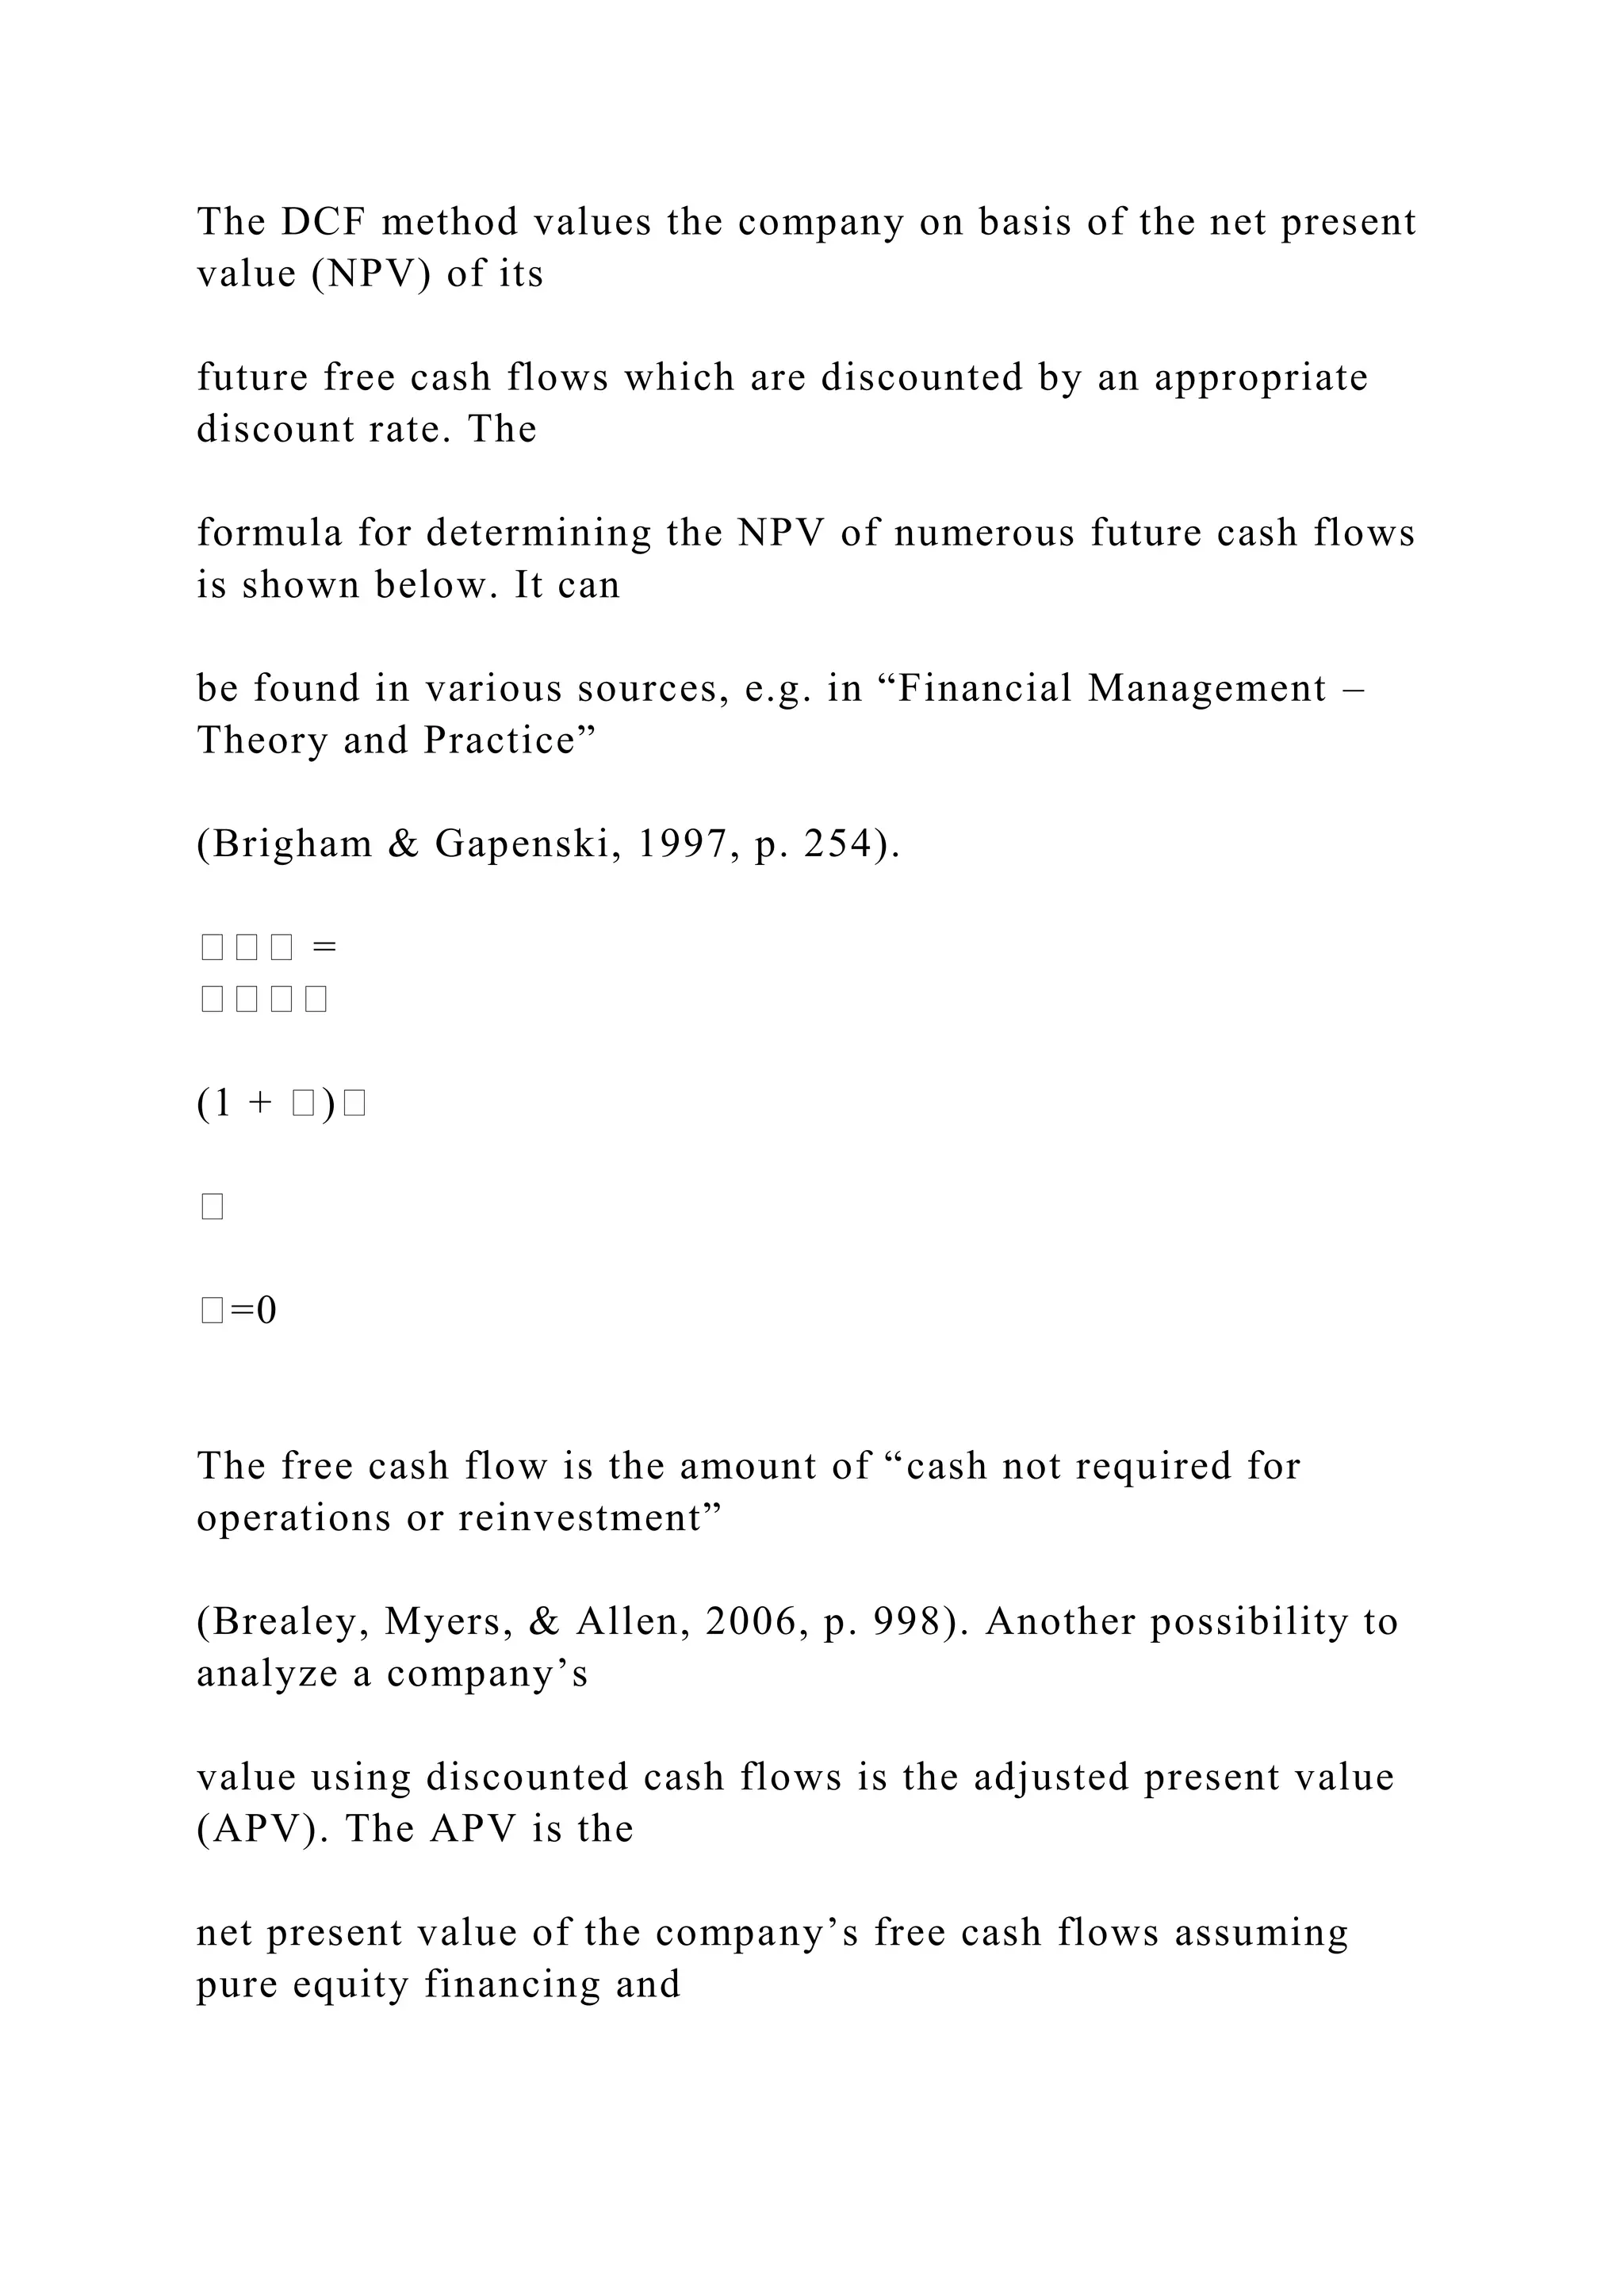
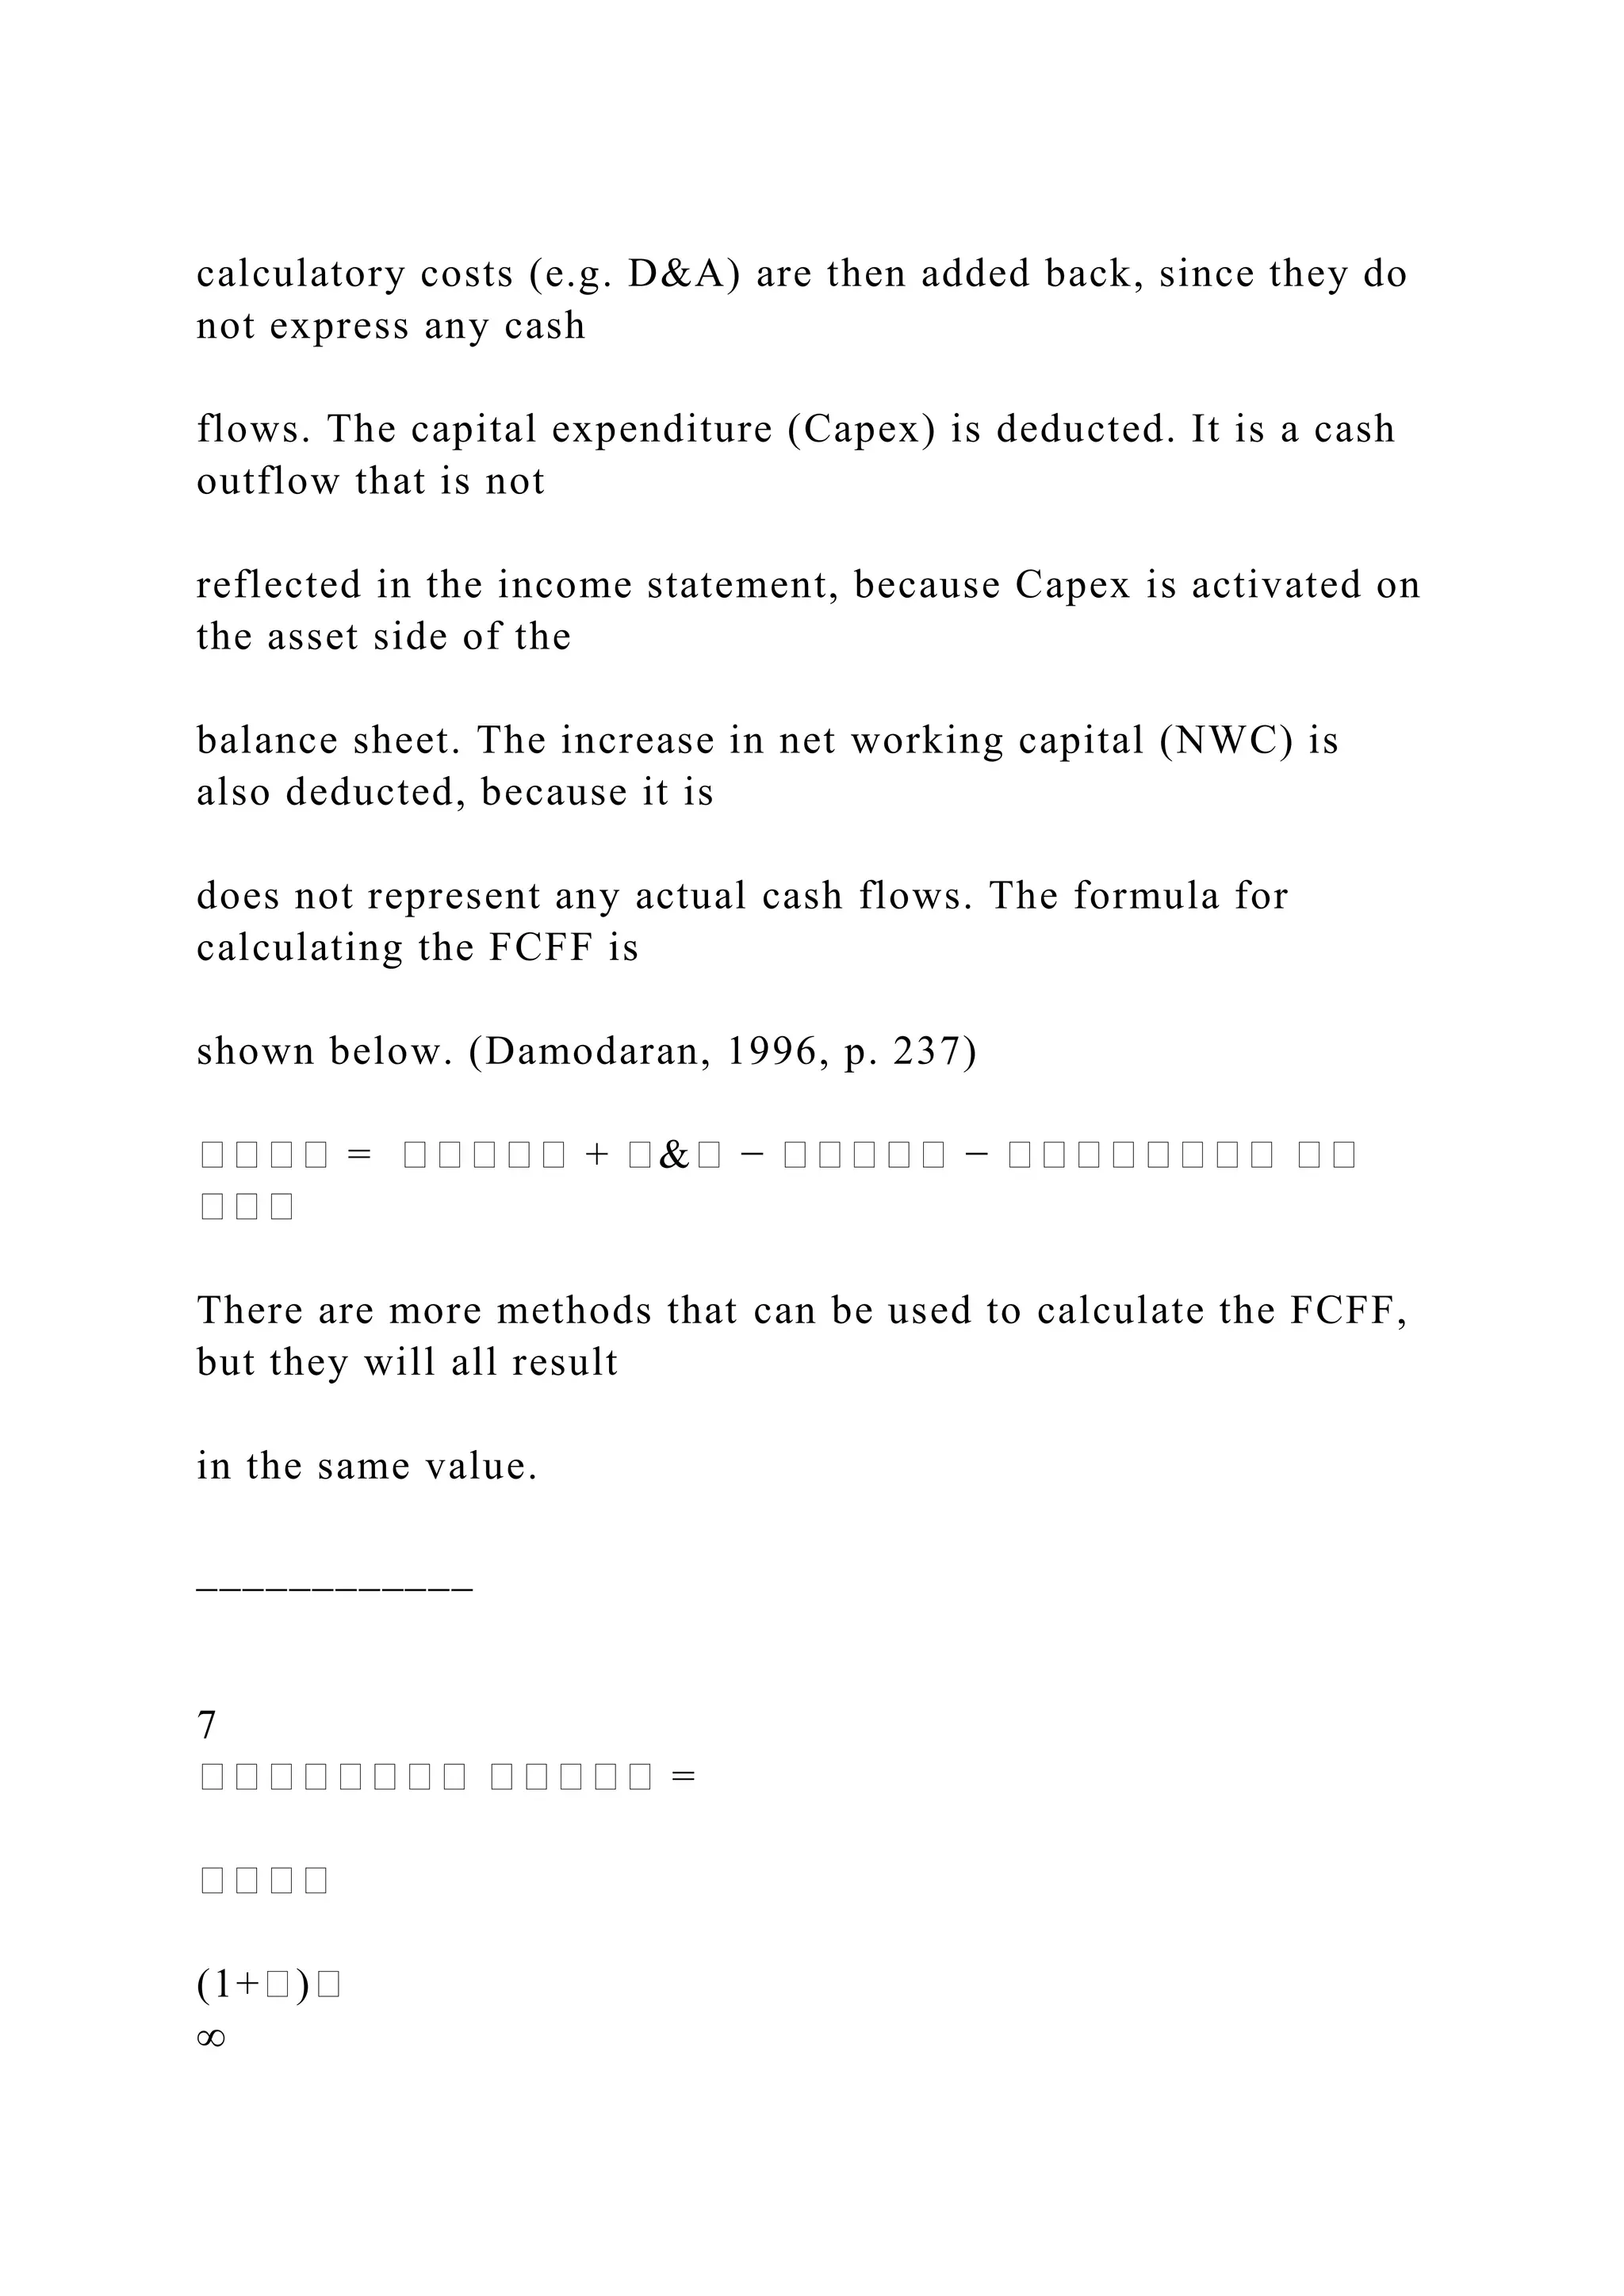
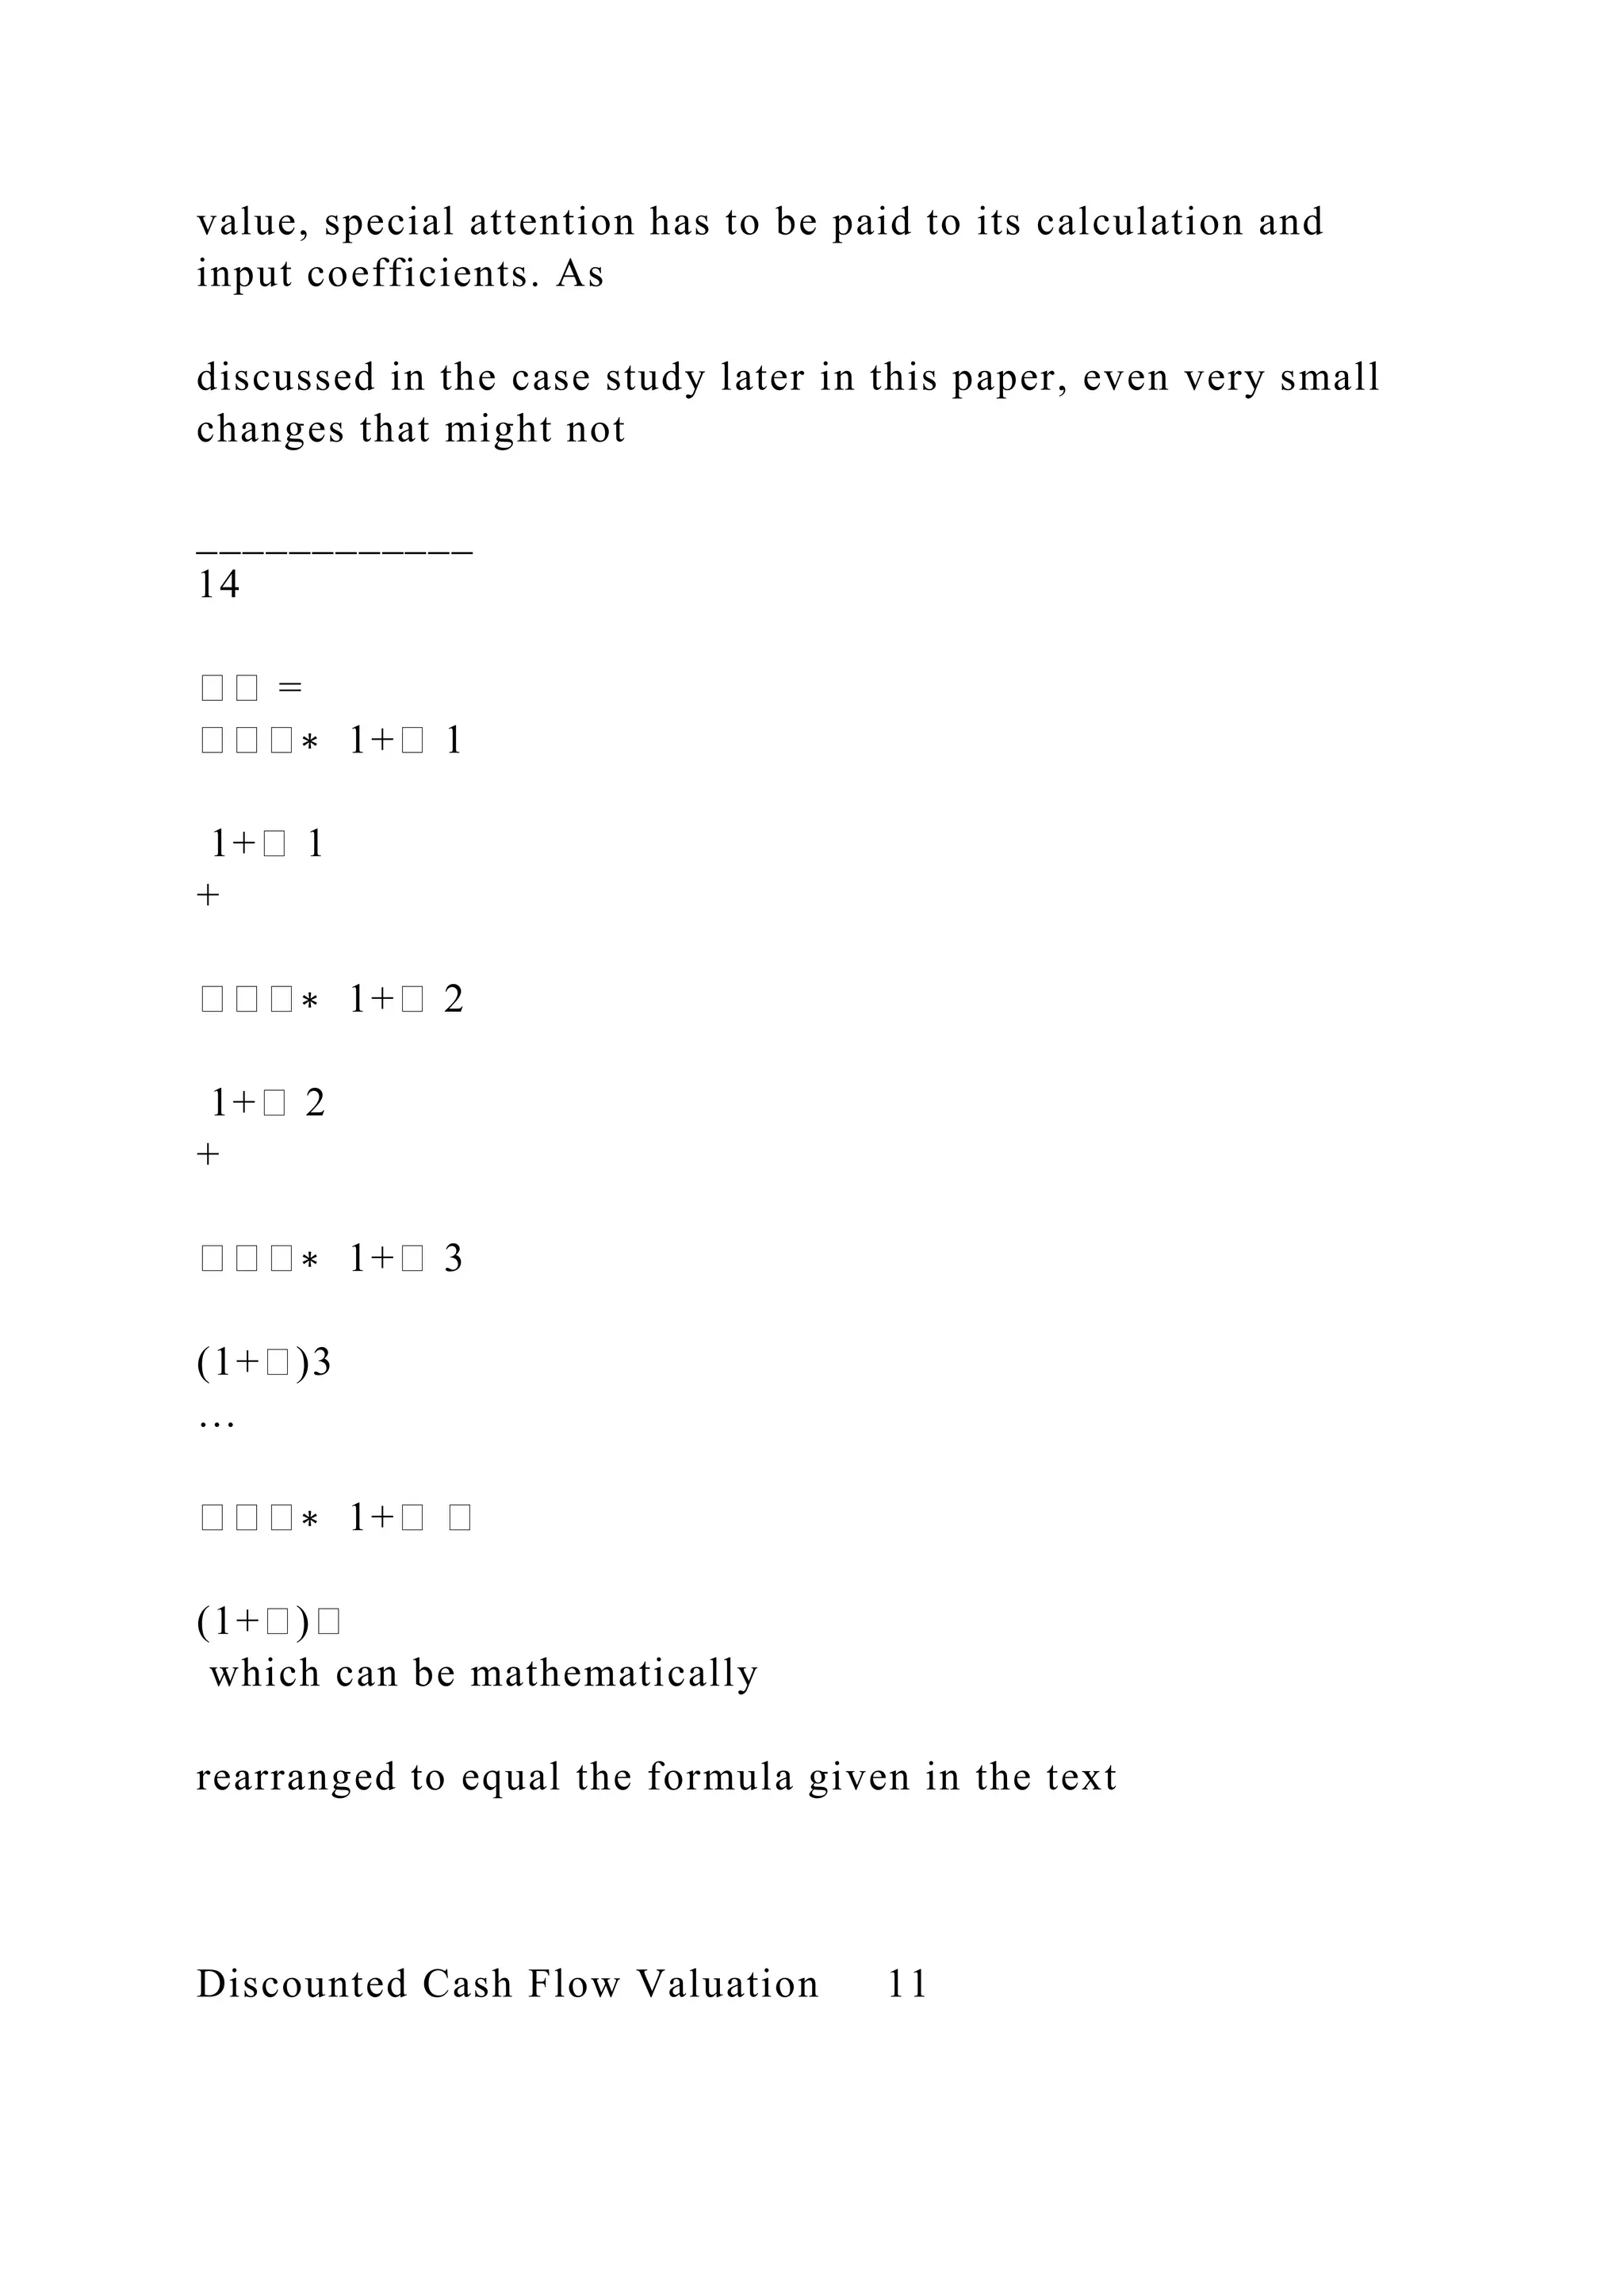
This paper closely examines theoretical and practical aspects of
the widely used discounted
cash flows (DCF) valuation method. It assesses its potentials as
well as several weaknesses. A
special emphasize is being put on the valuation of companies
using the DCF method. The
paper finds that the discounted cash flow method is a powerful
tool to analyze even complex
situations. However, the DCF method is subject to massive
assumption bias and even slight
changes in the underlying assumptions of an analysis can
drastically alter the valuation
results. A practical example of these implications is given using
a scenario analysis.
____________
1
Author: Florian Steiger, European Business School, e-mail:
[email protected]](https://image.slidesharecdn.com/fin430financetheoryandpracticeprojectassignmentscalculat-221031130230-ab53fe6e/75/FIN-430-Finance-Theory-and-PracticeProject-AssignmentsCalculat-docx-6-2048.jpg)
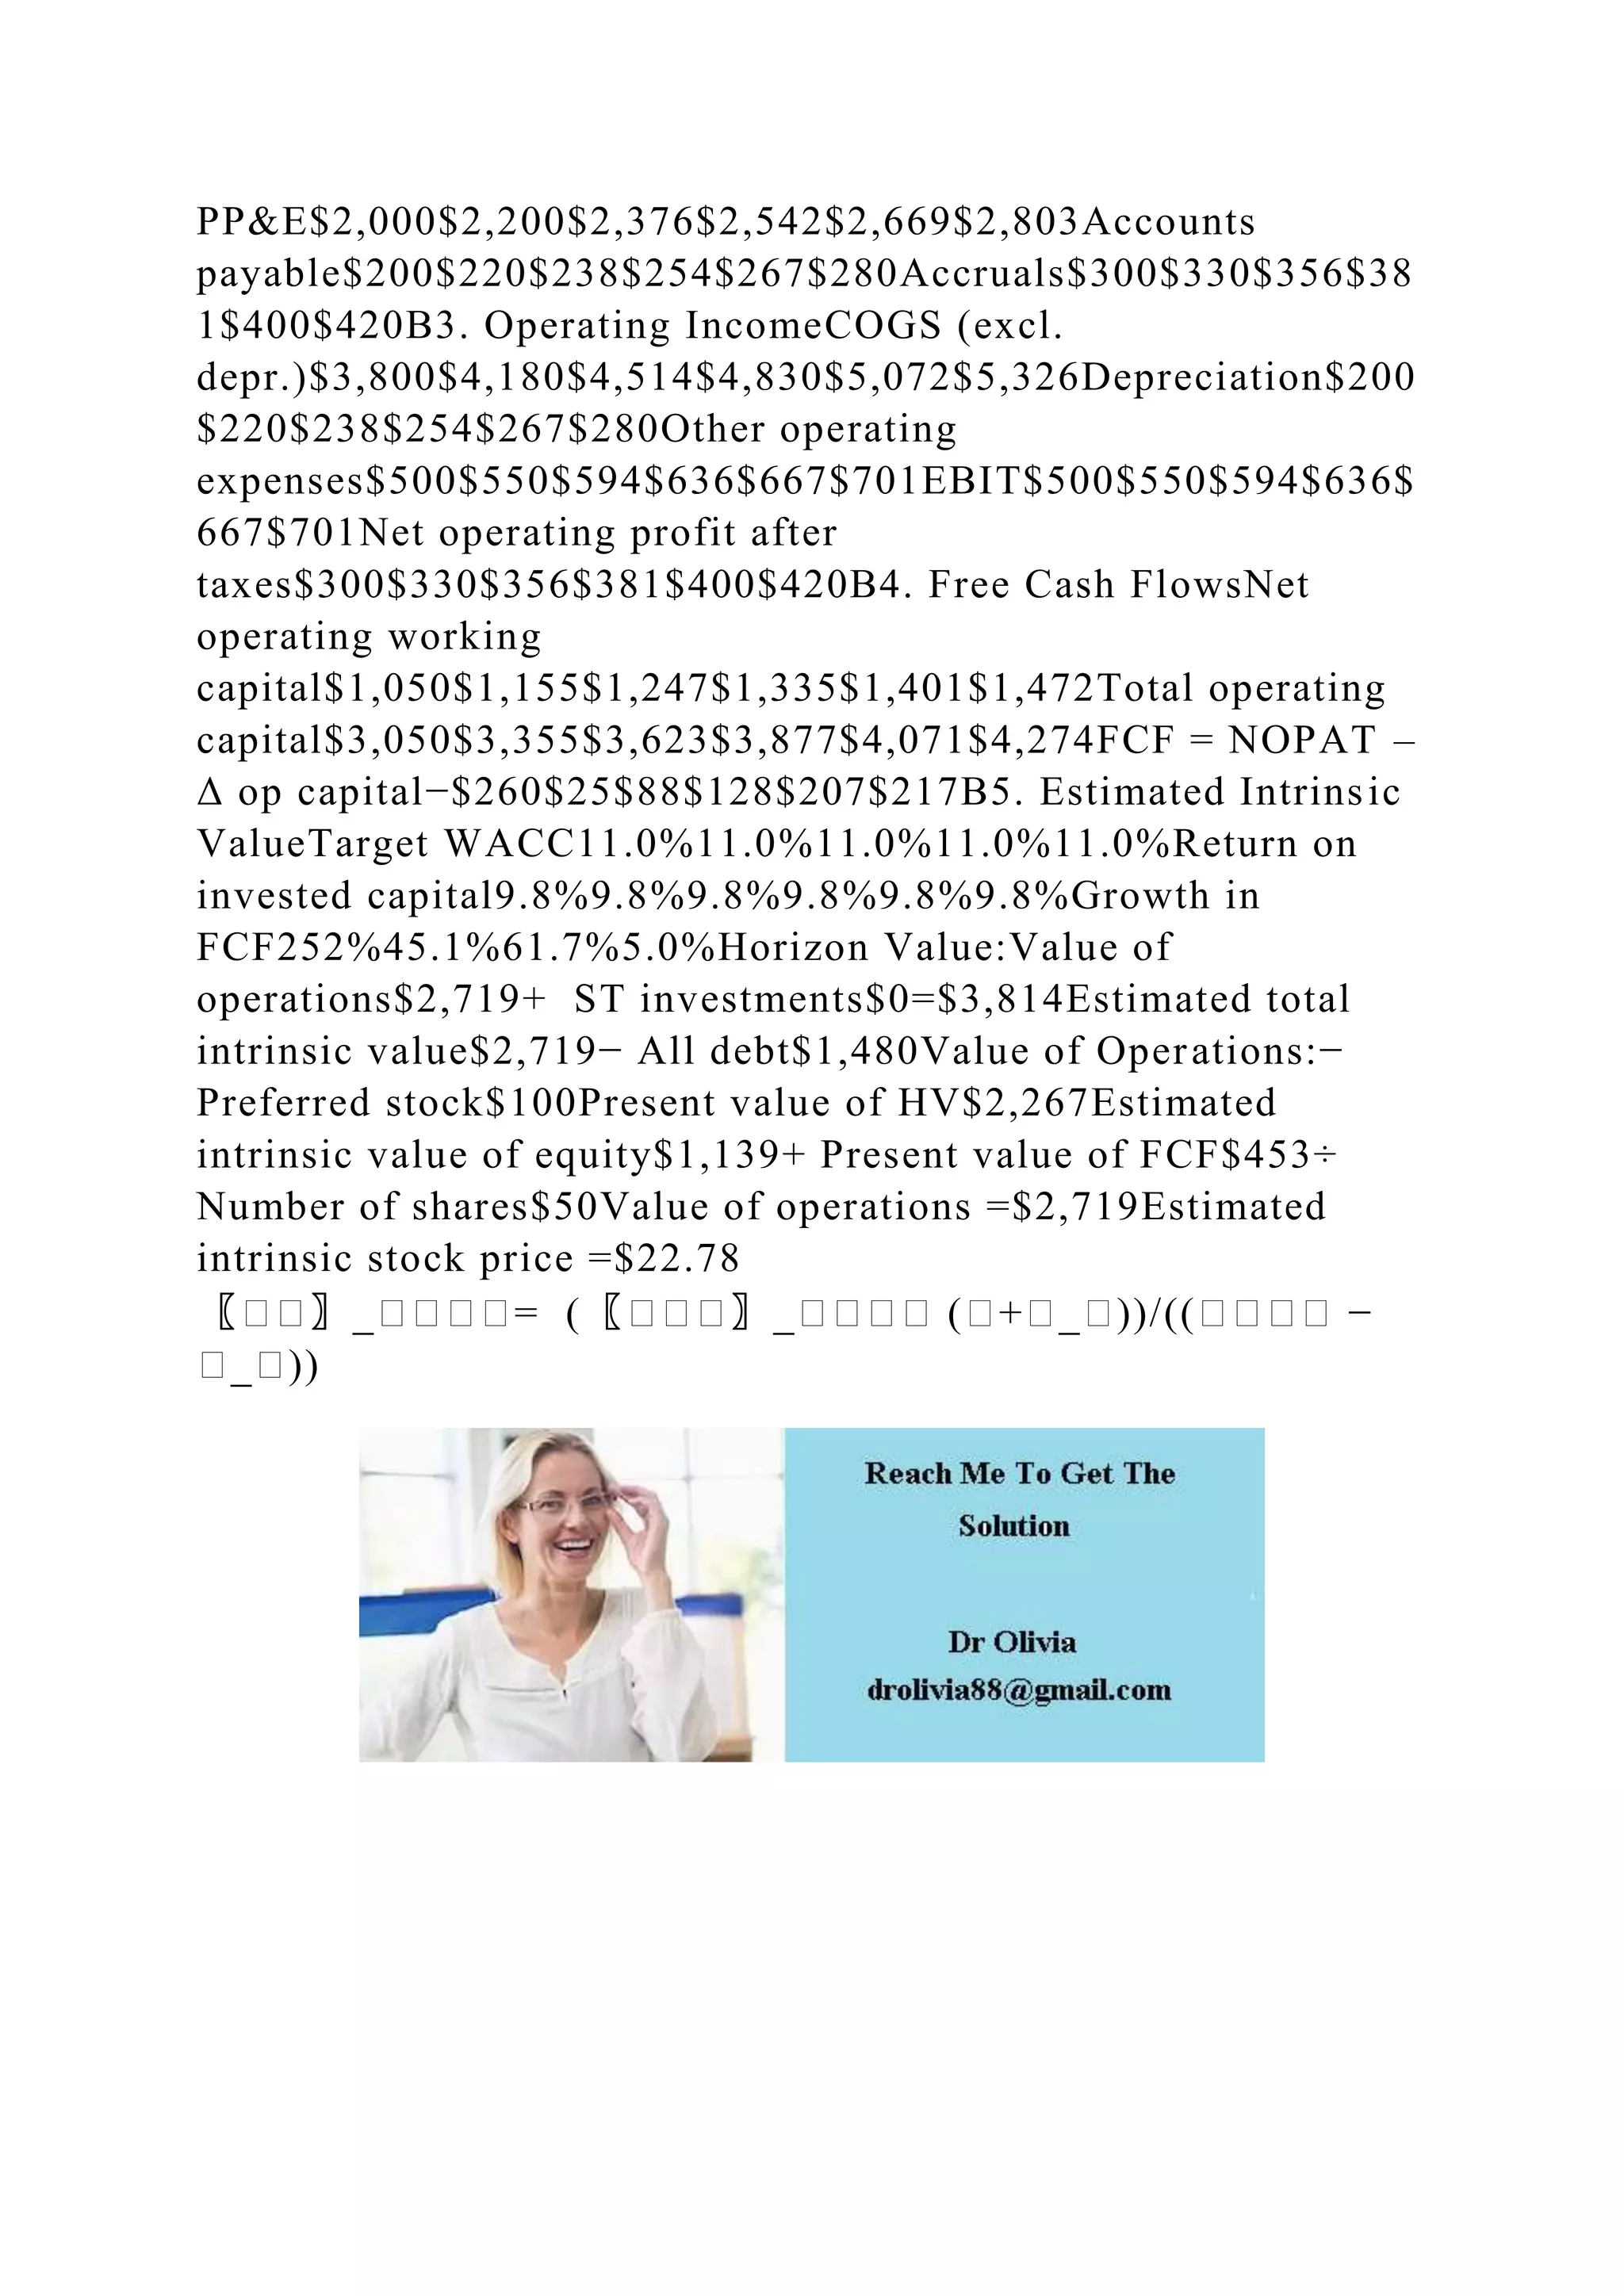
![which leads to the firm value as follows. Note that the present
value of the FCFs = the Value of Operations (see the CH 7 and
the formula runs as followings).
Value of Operations (Enterprise Value )
+ Value of non-operating assets (one example would be
marketable securities)
= Total Firm value
- Value of Debt [we use the book value of ST and LT debt;
though theory suggests that the market value
- Value of Preferred Shares [if any]
= Value of Equity
÷ Number of Shares of Common Stock outstanding
Price per share
This price per share is your estimate of the fundamental value
of the firm stock, which you would then use to argue that the
firm is either currently over/under/fairly valued according to the
market, i.e., by comparing your price/share to
the current market price/share. Warren Buffet calls this
estimate the "intrinsic value" of the firm. Remember that you
may consider the efficient market hypothesis in relation to your
price estimate.
2. Dividend Growth Model (Multi-stage growth model)
3. Comparables (Stock Price Multiples Model): This method is
relatively easy and provides some useful valuations that often
set the ranges for the stock price. The course packet lecture
entitled “Using Stock Price Multiples to Estimate Stock Price”
describes this method. You may use either a direct competitor
or industry averages. For example, if you are analyzing Ford
Motor Corp. it would be appropriate to use GM as a comparable
firm (and/or the auto industry). Note that sector/industry ratios
can be obtained on Yahoo.finance [look under profiles, then on
the left hand side under Financial Links you should
see competitors]. Many different financial ratios can be used,](https://image.slidesharecdn.com/fin430financetheoryandpracticeprojectassignmentscalculat-221031130230-ab53fe6e/75/FIN-430-Finance-Theory-and-PracticeProject-AssignmentsCalculat-docx-80-2048.jpg)
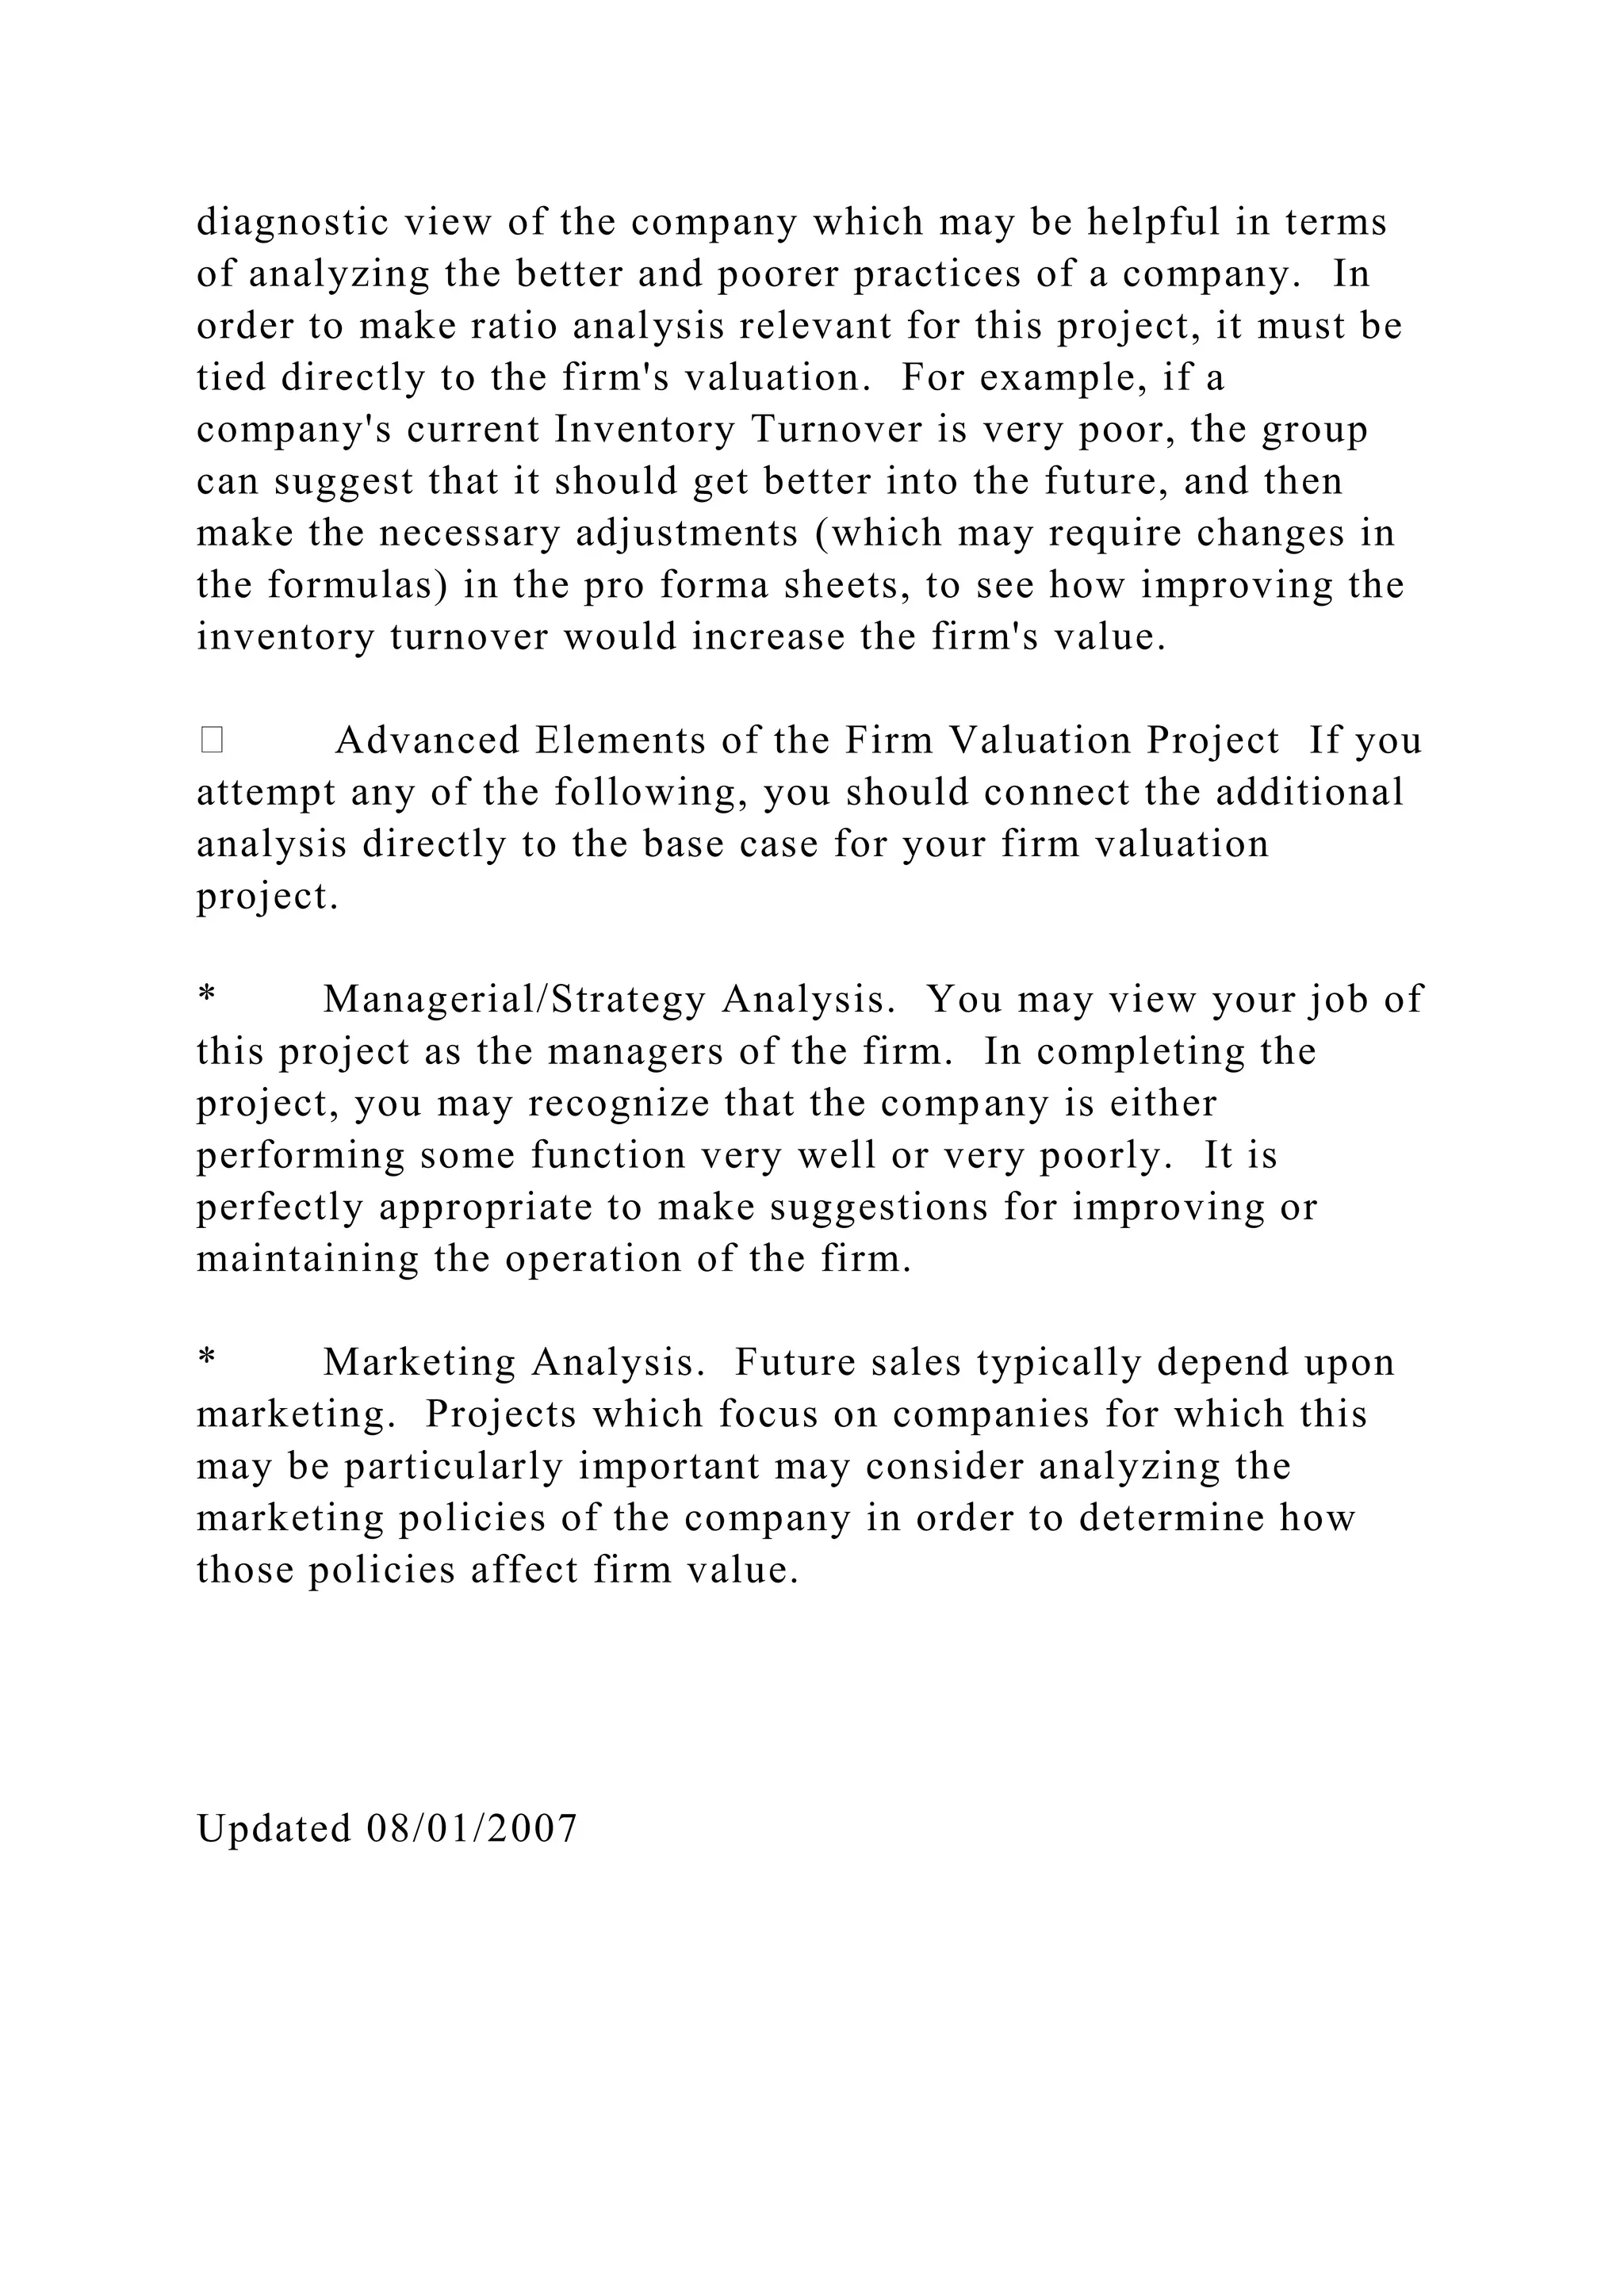
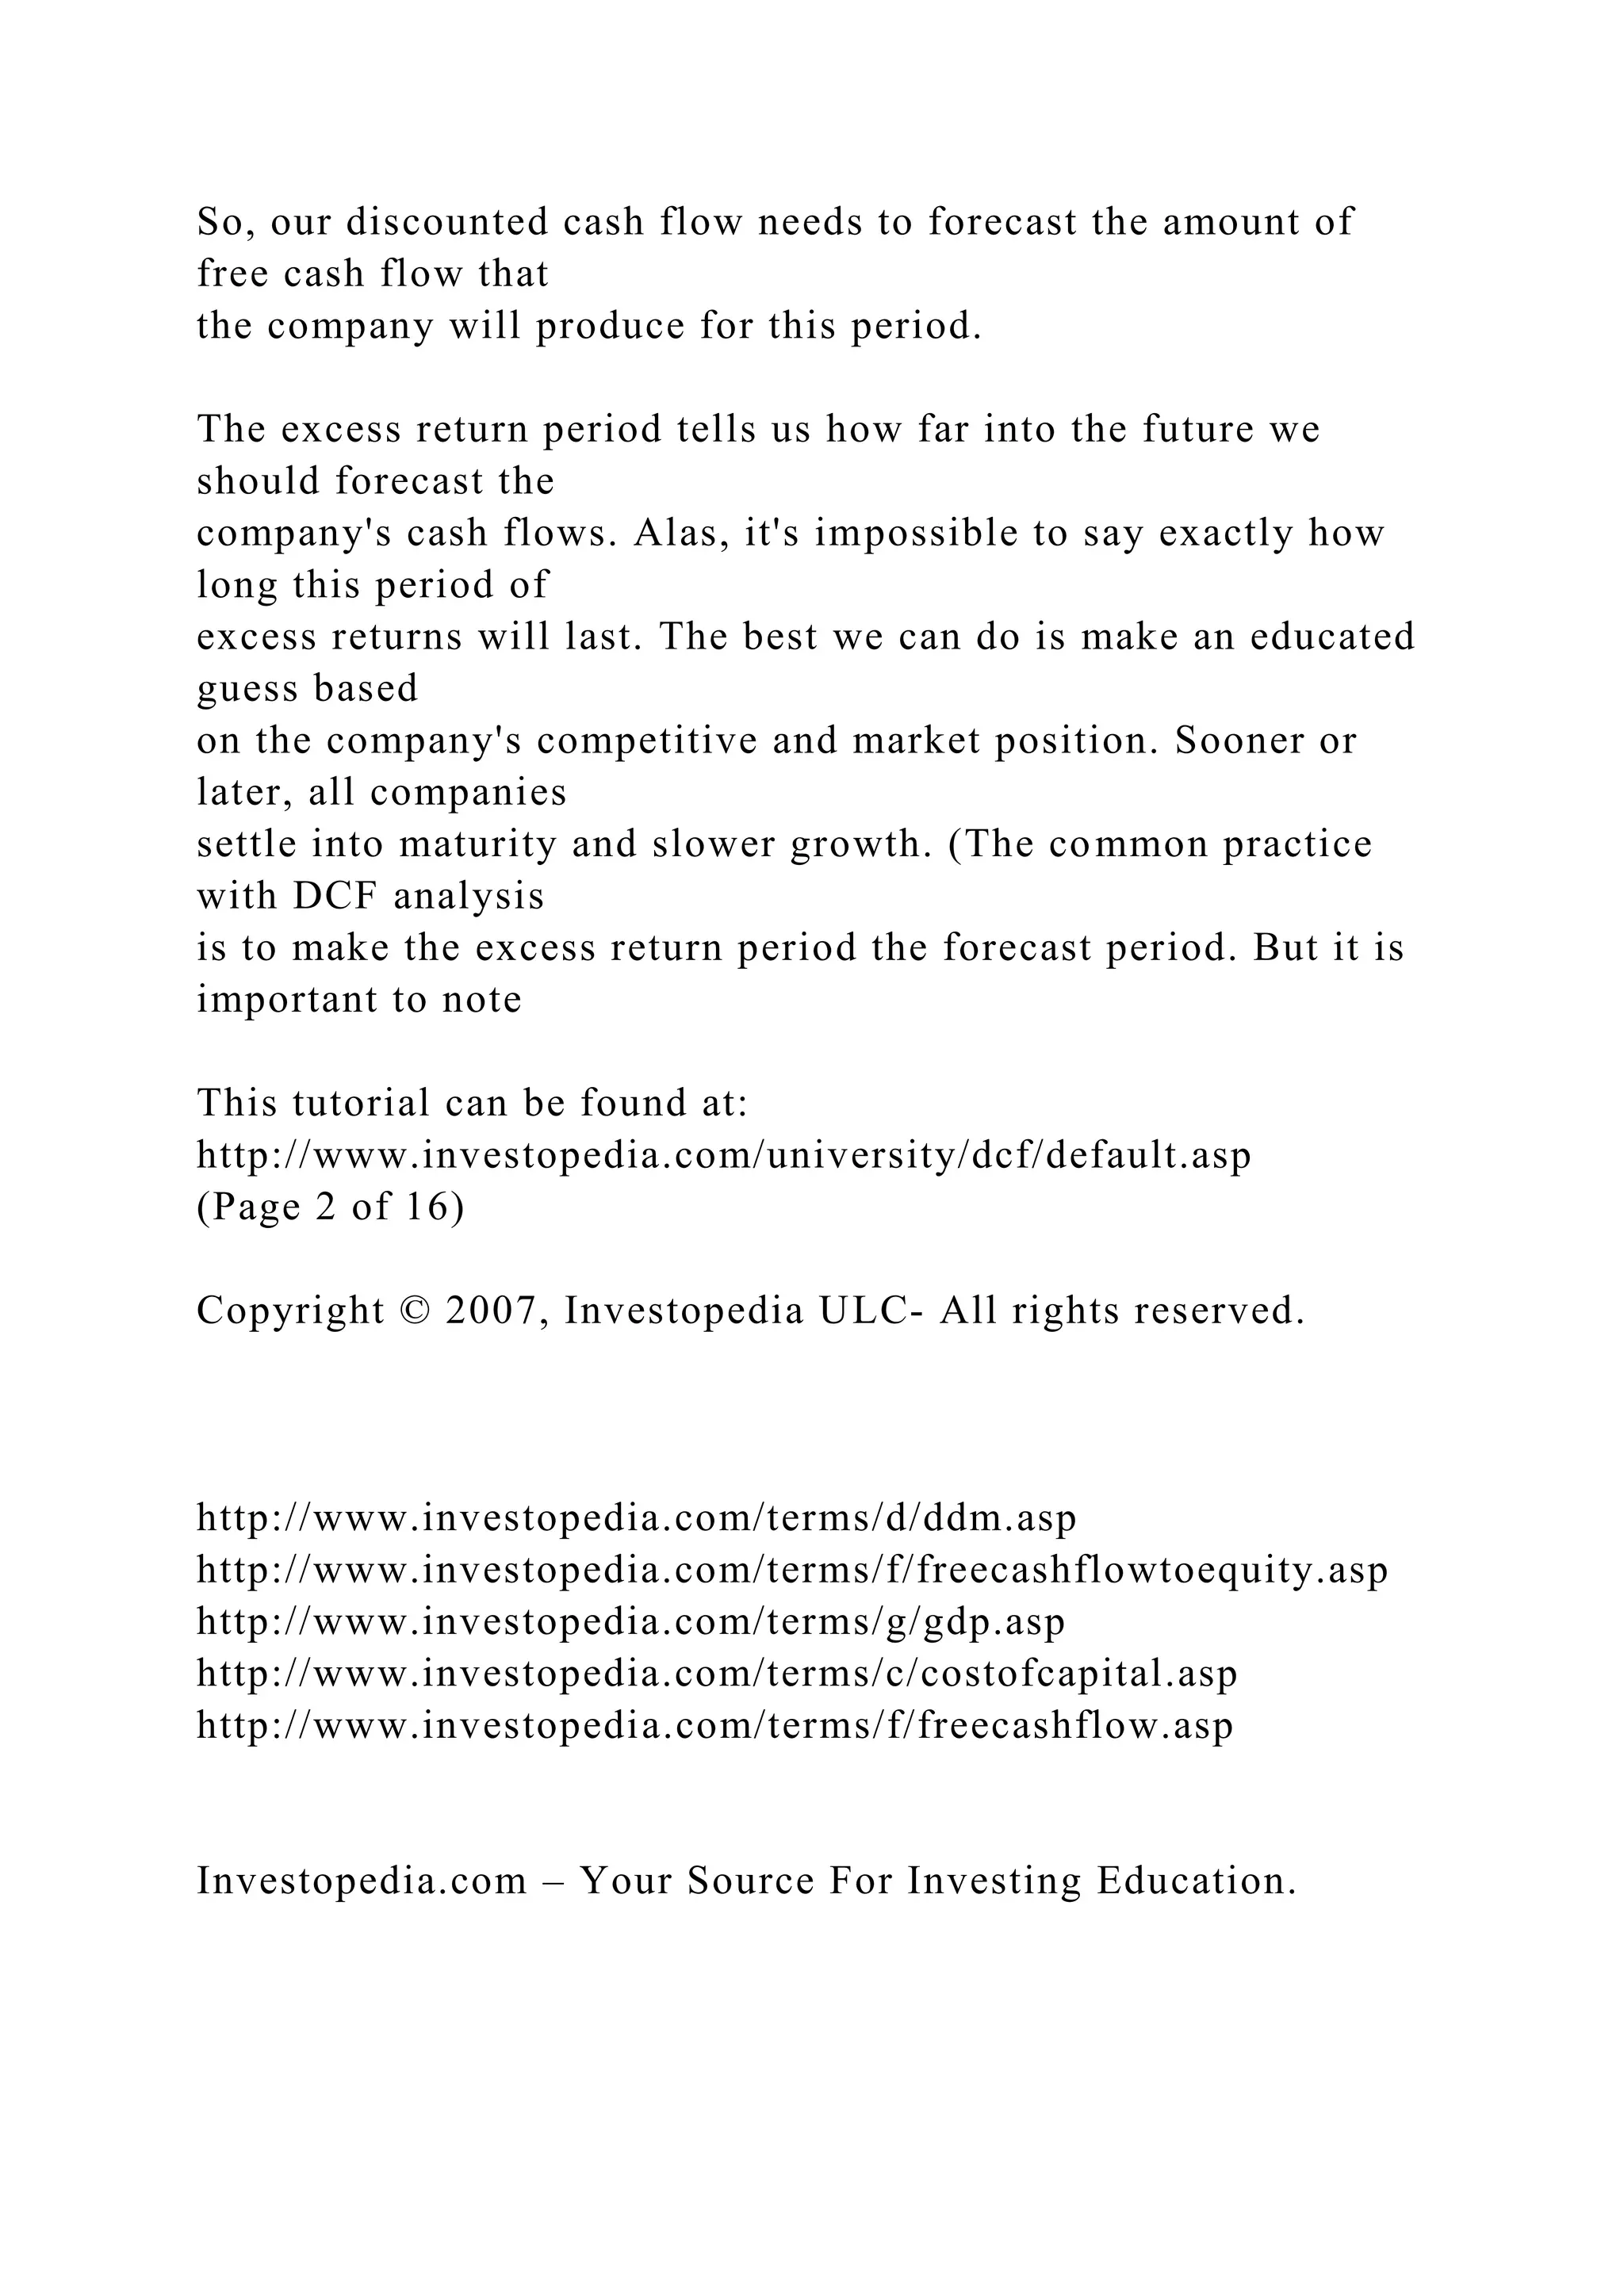
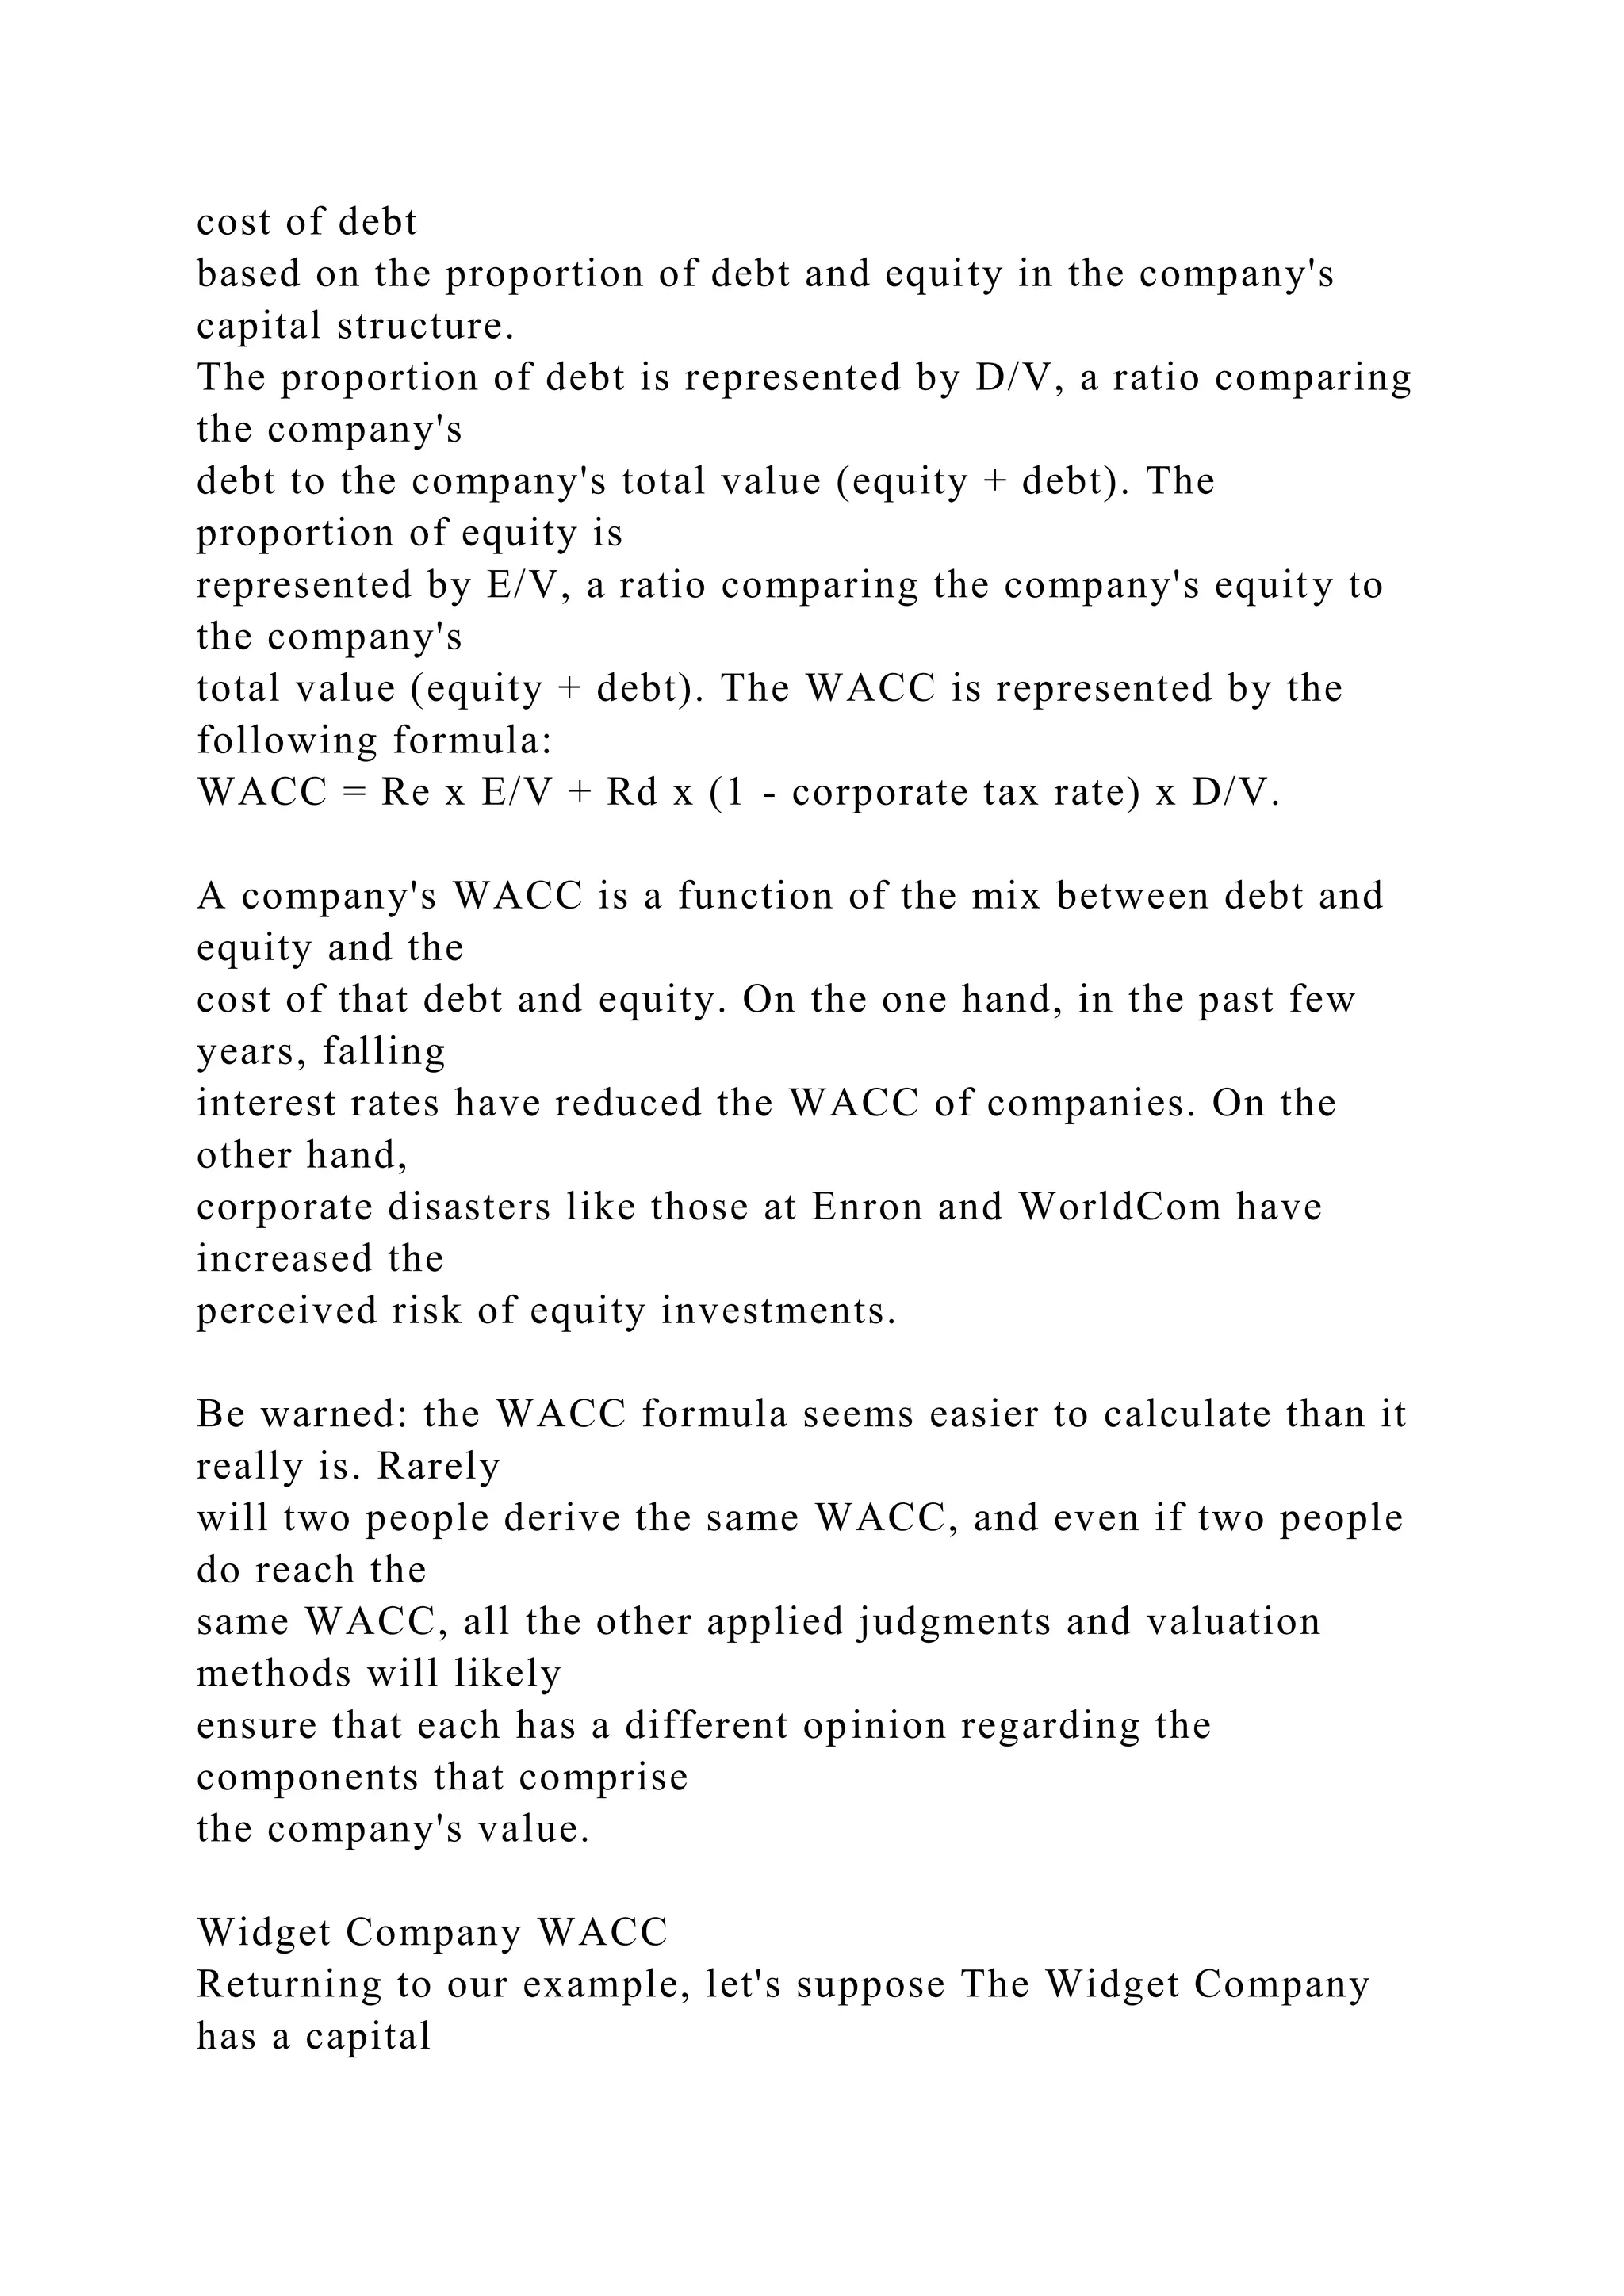
![structure of 40% debt and 60% equity, with a tax rate of 30%.
The risk-free rate
(RF) is 5%, the beta is 1.3 and the risk premium (RP) is 8%.
The WACC comes
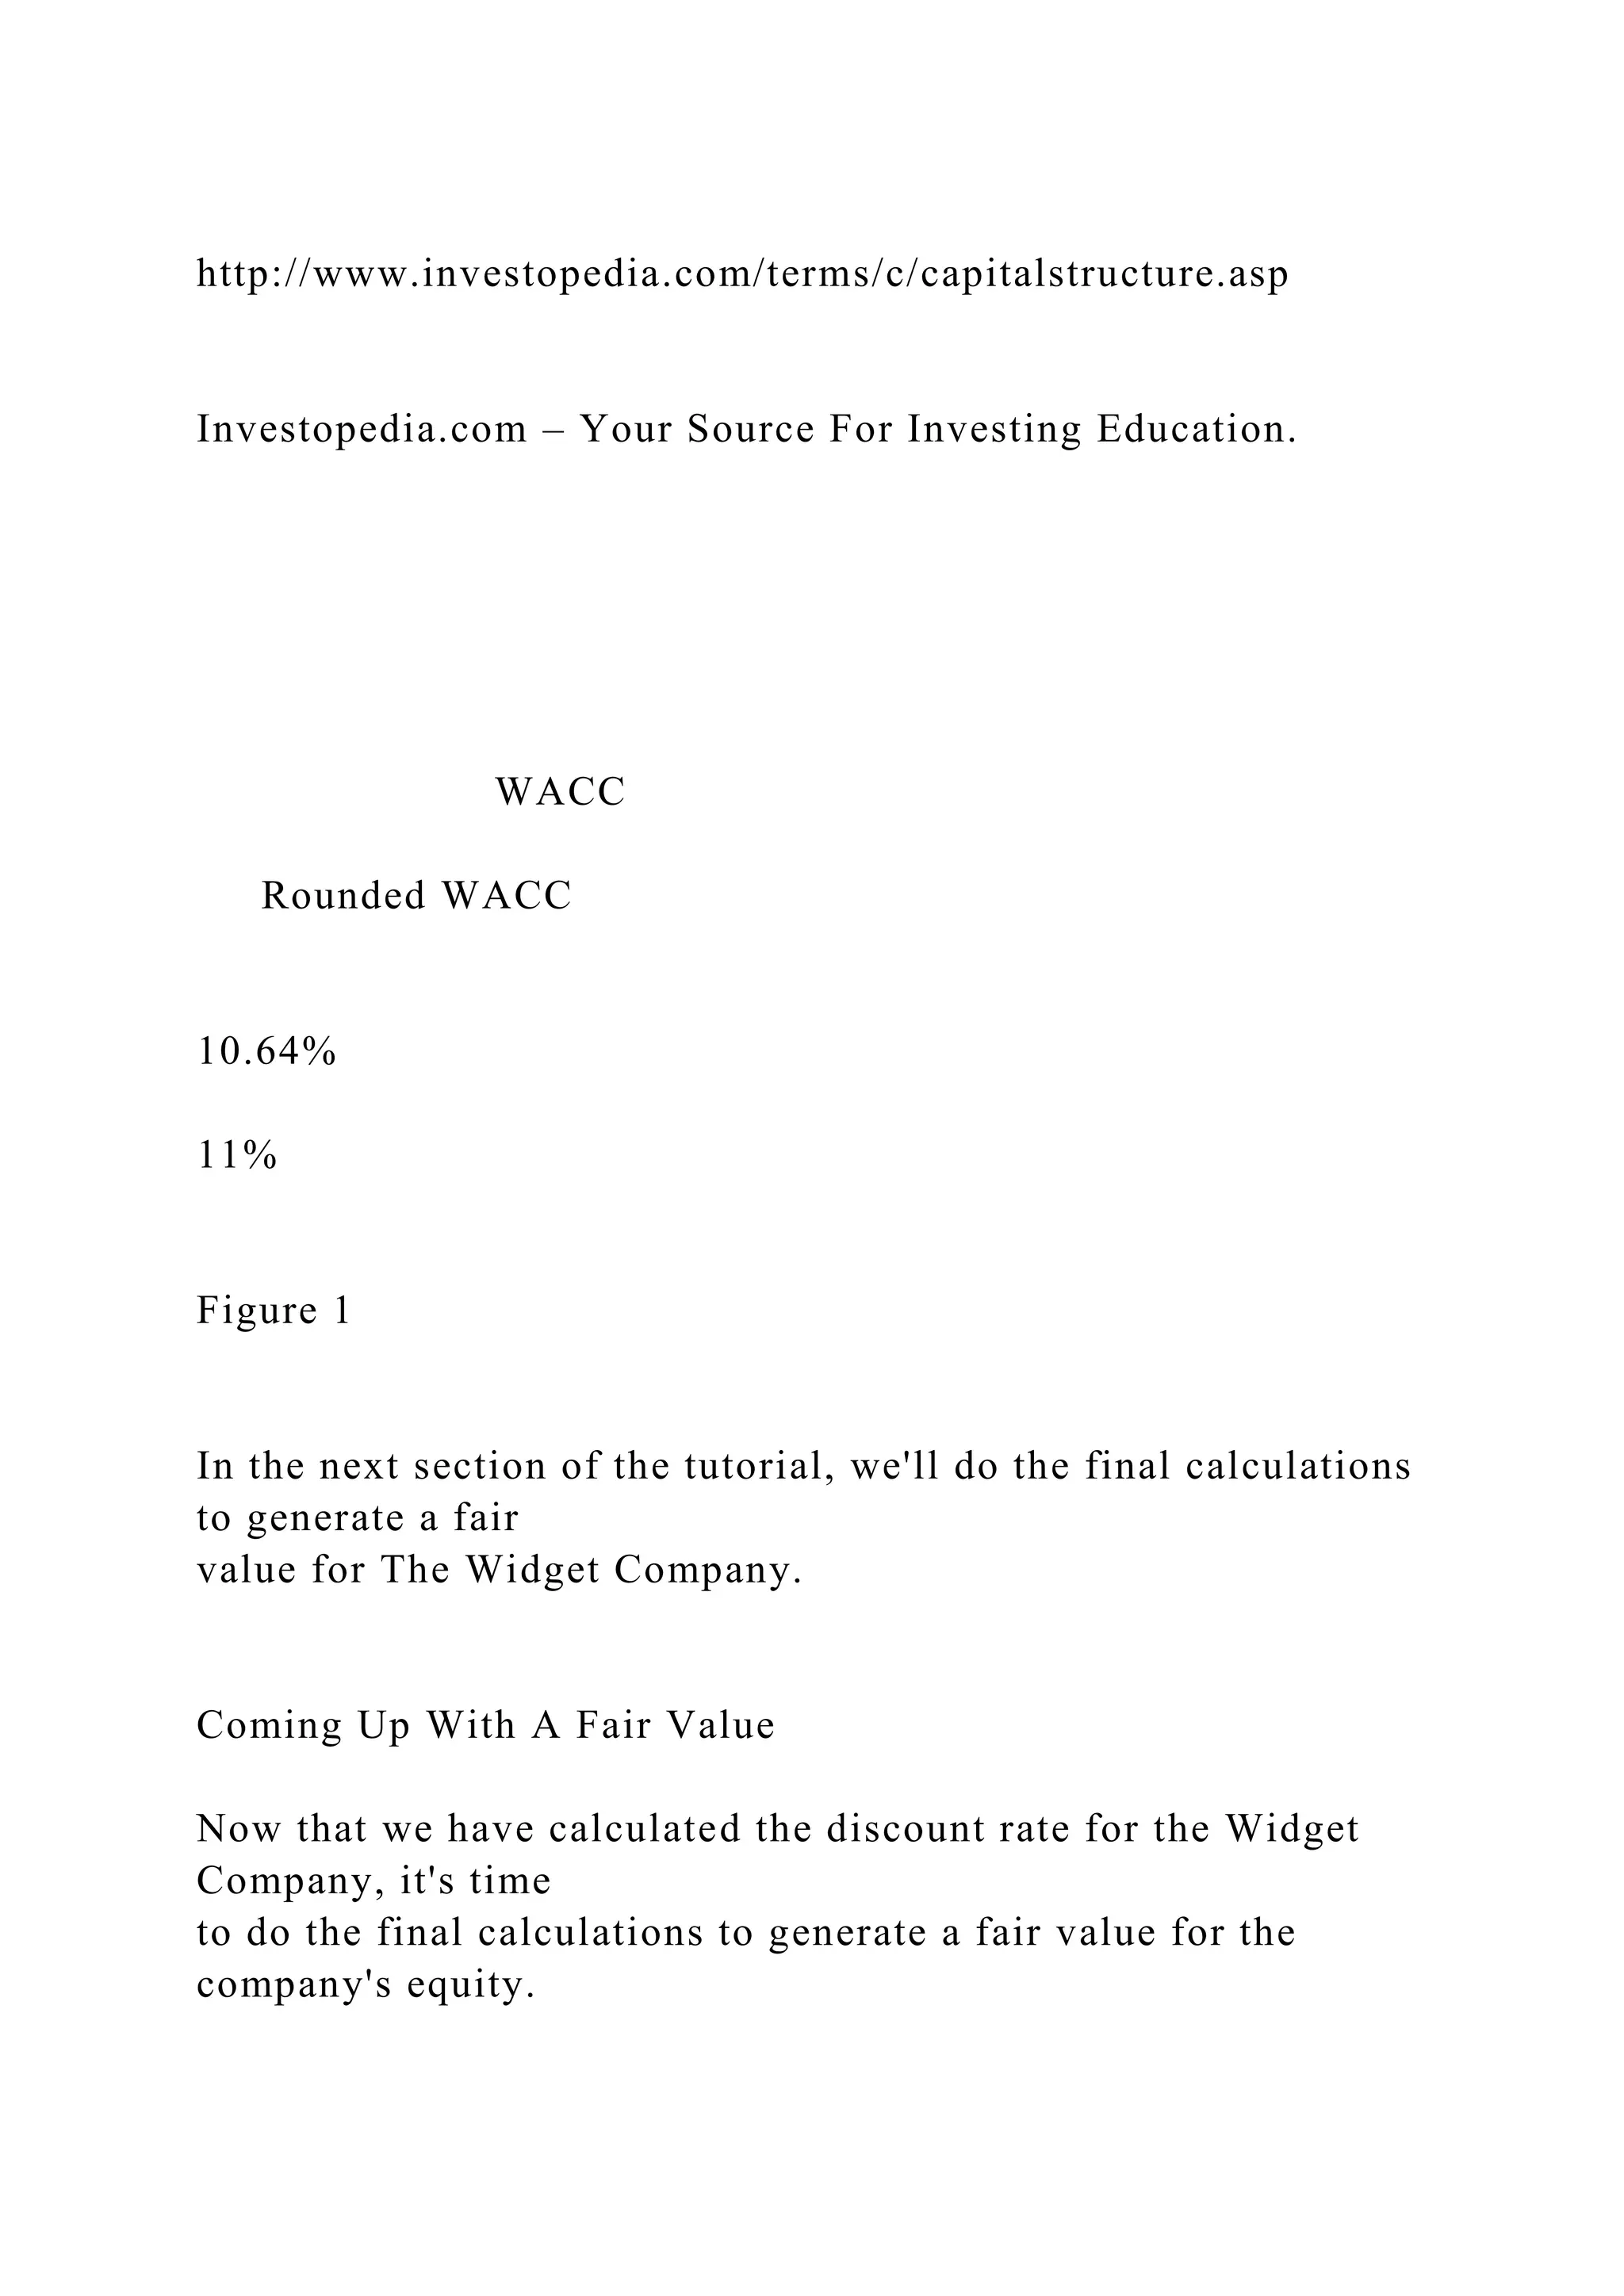
to 10.64%. So, rounded up to the nearest percentage, the
discount rate for The
Widget Company would be 11% (see Figure 1).
WACC for The Widget Company
Cost of Debt Cost of Equity
0.40 [Rd x (1-.30)] +
0.40 [5.0 x 0.7)] +
0.40 [3.5] +
1.40 +
0.60 [RF + b(RP)]
0.60 [5.0 + 1.3(8)]
0.60 [15.4]
9.24
This tutorial can be found at:
http://www.investopedia.com/university/dcf/default.asp
(Page 10 of 16)
Copyright © 2007, Investopedia ULC- All rights reserved.](https://image.slidesharecdn.com/fin430financetheoryandpracticeprojectassignmentscalculat-221031130230-ab53fe6e/75/FIN-430-Finance-Theory-and-PracticeProject-AssignmentsCalculat-docx-111-2048.jpg)
![University of Wollongong, [email protected]
T. Grai
Oakland University, USA
S. Haslitt
Oakland University, USA
C. B. McGowan
Universiti Kebangsaan Malaysia, [email protected]
Research Online is the open access institutional repository for
the
University of Wollongong. For further information contact the
UOW
Library: [email protected]
Publication Details
This article was originally published as Collier, H, Grai, T,
Haslitt, S and McGowan, CB, An example of the use of
financial ratio
analysis: the case of Motorola, Decision Sciences Institute
Conference, Florida, 2-6 March 2004.
http://ro.uow.edu.au/
http://ro.uow.edu.au/
http://ro.uow.edu.au/
http://ro.uow.edu.au
http://ro.uow.edu.au/commpapers
http://ro.uow.edu.au/business
http://ro.uow.edu.au/
http://ro.uow.edu.au/
An example of the use of financial ratio analysis: the case of
Motorola
Abstract
In this paper, we demonstrate the use of actual financial data for](https://image.slidesharecdn.com/fin430financetheoryandpracticeprojectassignmentscalculat-221031130230-ab53fe6e/75/FIN-430-Finance-Theory-and-PracticeProject-AssignmentsCalculat-docx-131-2048.jpg)
![Henry W. Collier, University of Wollongong, [email protected]
Timothy Grai, Oakland University
Steve Haslitt, Oakland University
Carl B. McGowan, Jr., Universiti Kegangsaan Malaysia,
[email protected]
Abstract: In this paper, we demonstrate the use of actual
financial data for financial ratio analysis. We construct a
financial and
industry analysis for Motorola Corporation. The objective is to
show students exactly how to compute ratios for an actual
company. This paper demonstrates the difficulties in applying
the principles of financial ratio analysis when the data are not
homogeneous as is the case in textbook examples. We use
Motorola as an example because the firm has several segments,
two of
which account for the majority of sales and represent two
industries (semi-conductor and communications) that have
different
characteristics. The case illustrates the complexity of financial
analysis.
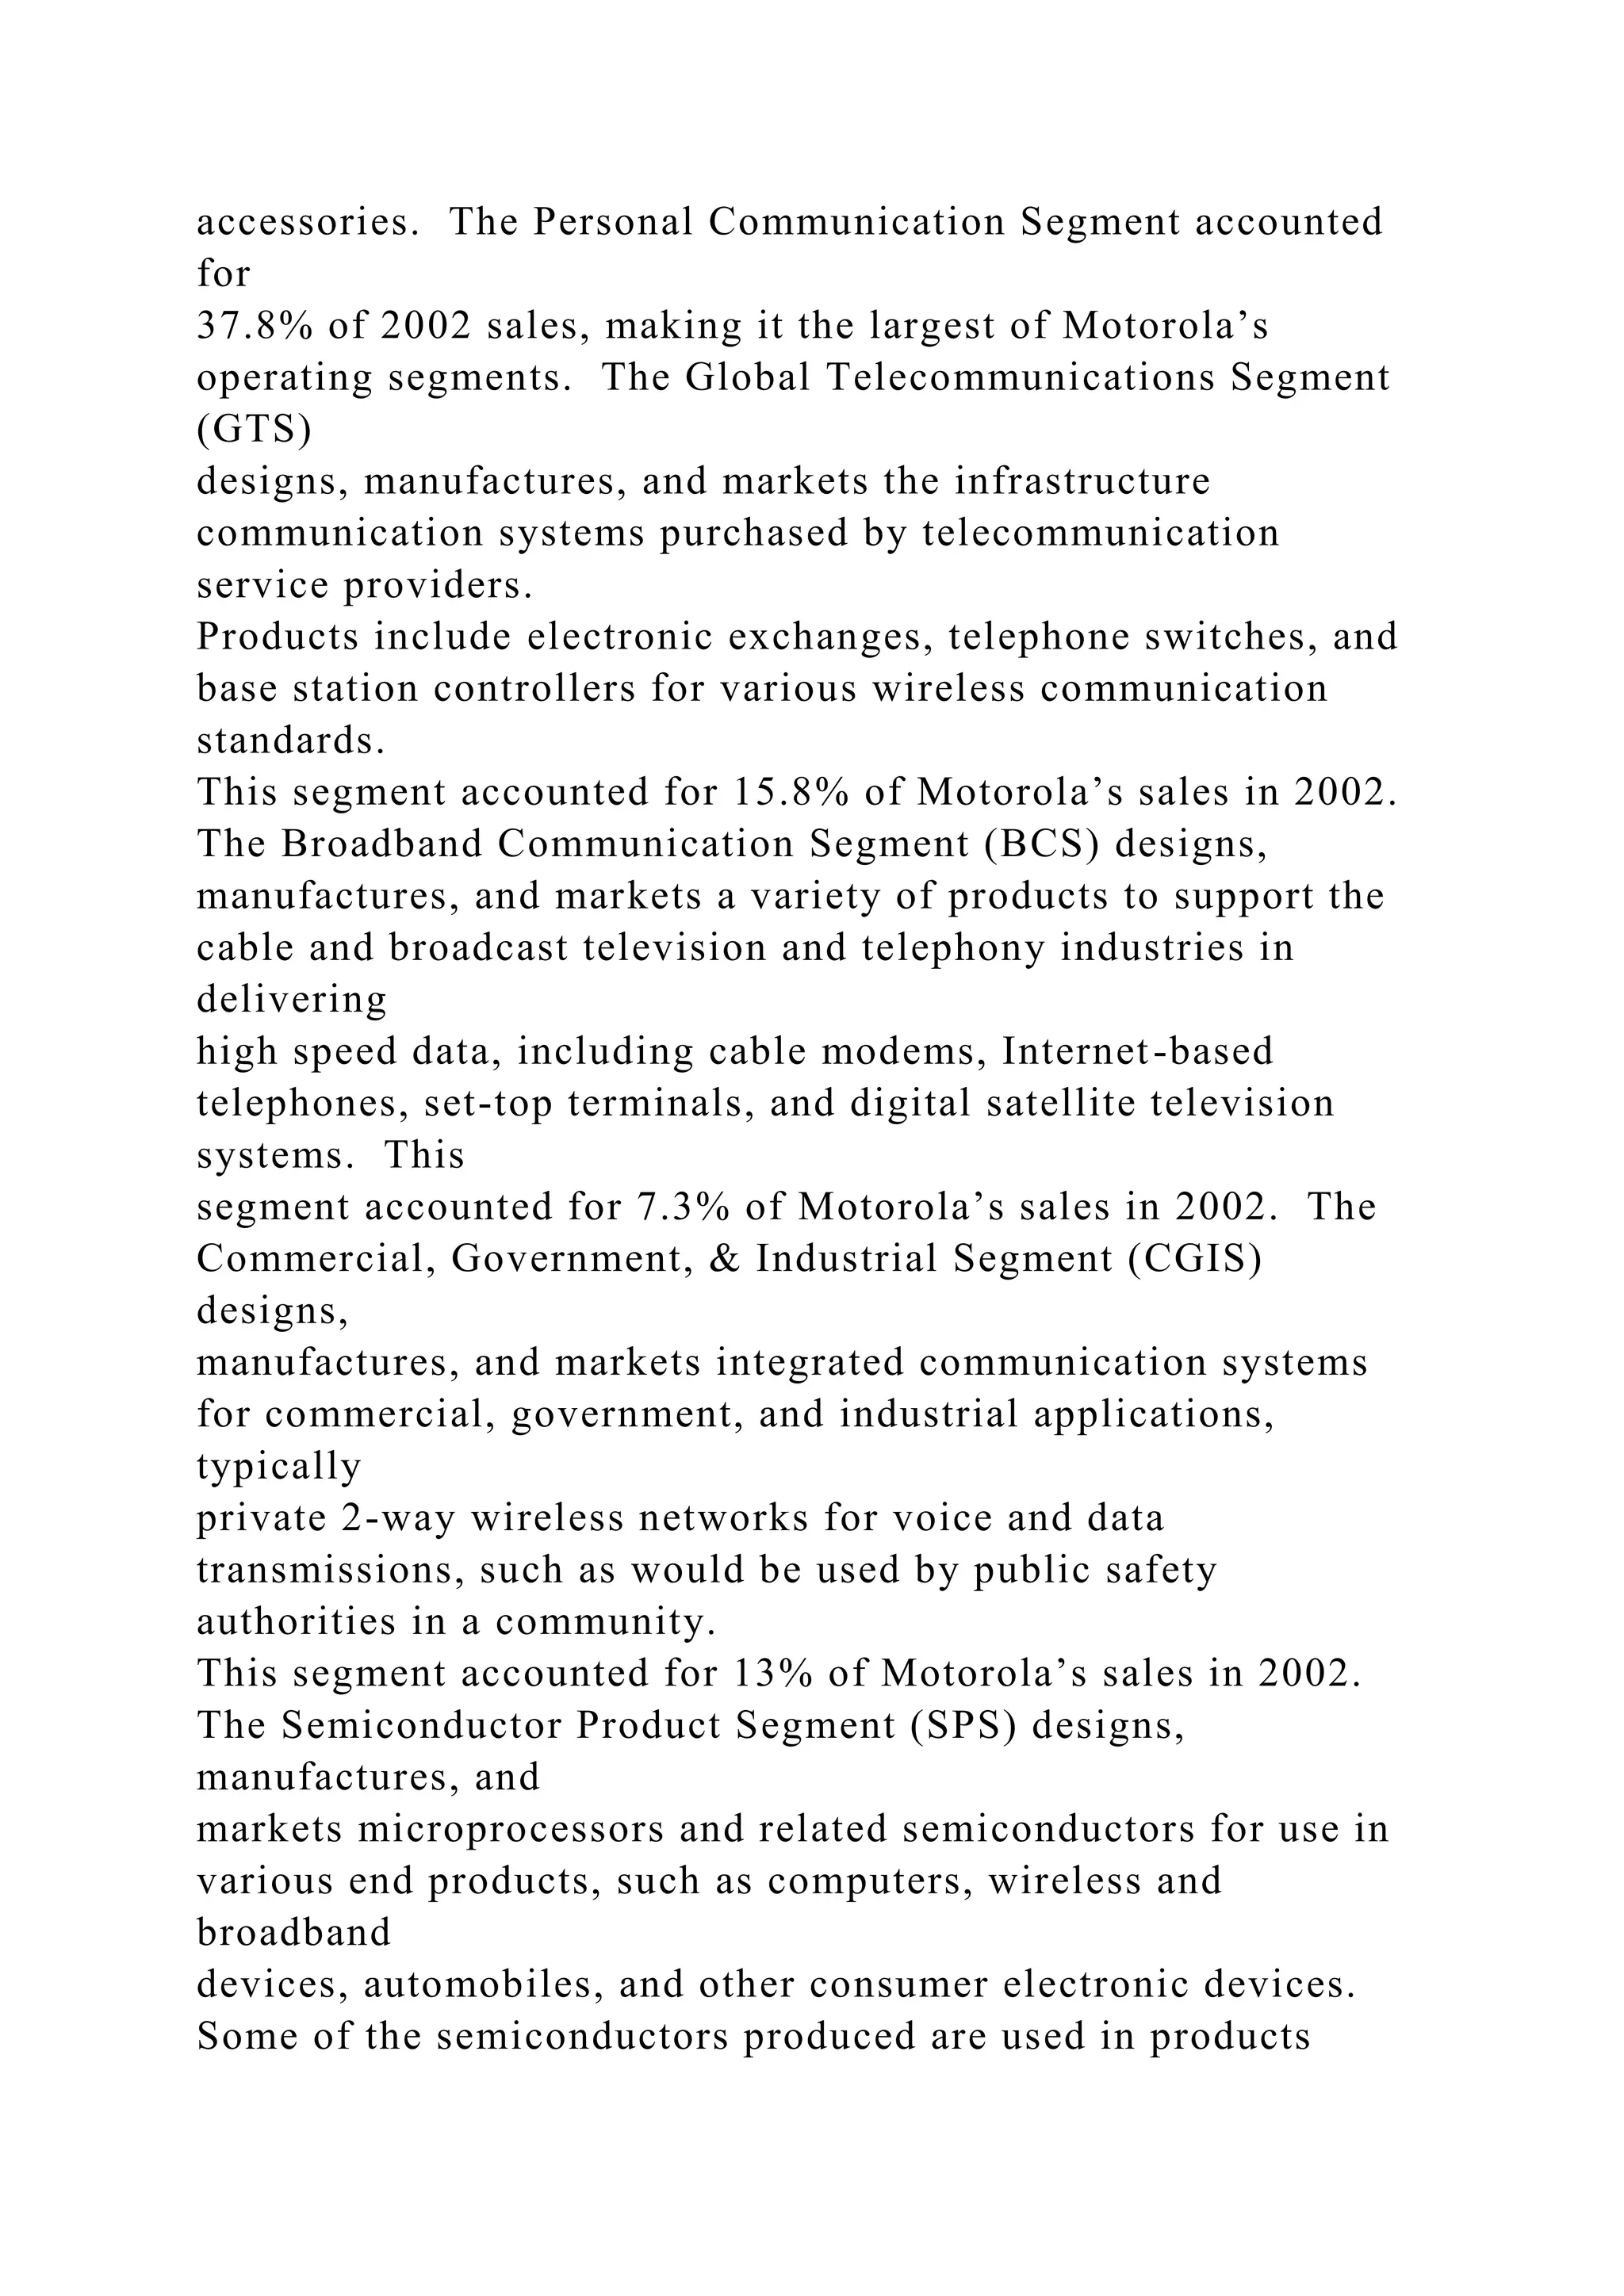
MOTOROLA SEGMENT ANALYSIS
Motorola is a global manufacturer of communication products,
semiconductors, and embedded electronic solutions. The
company is
divided into six operating segments that publicly report
financial results. The Personal Communication Segment (PCS)
designs,
manufactures, and markets wireless communication products for
service subscribers. Products include wireless handsets,
personal 2-
way radios, and messaging devices, along with the associated](https://image.slidesharecdn.com/fin430financetheoryandpracticeprojectassignmentscalculat-221031130230-ab53fe6e/75/FIN-430-Finance-Theory-and-PracticeProject-AssignmentsCalculat-docx-133-2048.jpg)
![Journal of
Financial Economics, 60, 2001, pp. 187-243.
Motorola Completes Sale of 25 Million of Its 108 Million
Shares of Nextel, retrieved from
http://biz.yahoo.com/prnews/030304/cgtu025_1.html
Motorola Sells $325M of Nextel Stock, retrieve from
http//biz.yahoo.com/ap/030305/Motorola_Nextel_1.html
Nokia Unveils New Phones to Crack CDMA Market, retrieved
from
http://biz.yahoo.com/rc/030317_tech_nokia_handsets_2.html
Nokia, Motorola Lose China Market Share to Domestic
Companies, retrieved from
http://biz.yahoo.com/djus/030314/0020000011_1.html
Reiter, Chris. Mobile Phone Sales Rose 6% to 423 Million
Units Last Year, Dow Jones Business New, retrieved from
http://biz.yahoo.com/djus/030309/2037000327_3.html
Yahoo.finance.com
Yahoo.marketguide.com
The data tables and sources of data used in this paper are
available upon request from Carl B. McGowan, Jr.,
[email protected] .
University of WollongongResearch Online2004An example of
the use of financial ratio analysis: the case of MotorolaH. W.
CollierT. GraiS. HaslittC. B. McGowanPublication DetailsAn
example of the use of financial ratio analysis: the case of
MotorolaAbstractDisciplinesPublication Details](https://image.slidesharecdn.com/fin430financetheoryandpracticeprojectassignmentscalculat-221031130230-ab53fe6e/75/FIN-430-Finance-Theory-and-PracticeProject-AssignmentsCalculat-docx-154-2048.jpg)