Download to read offline
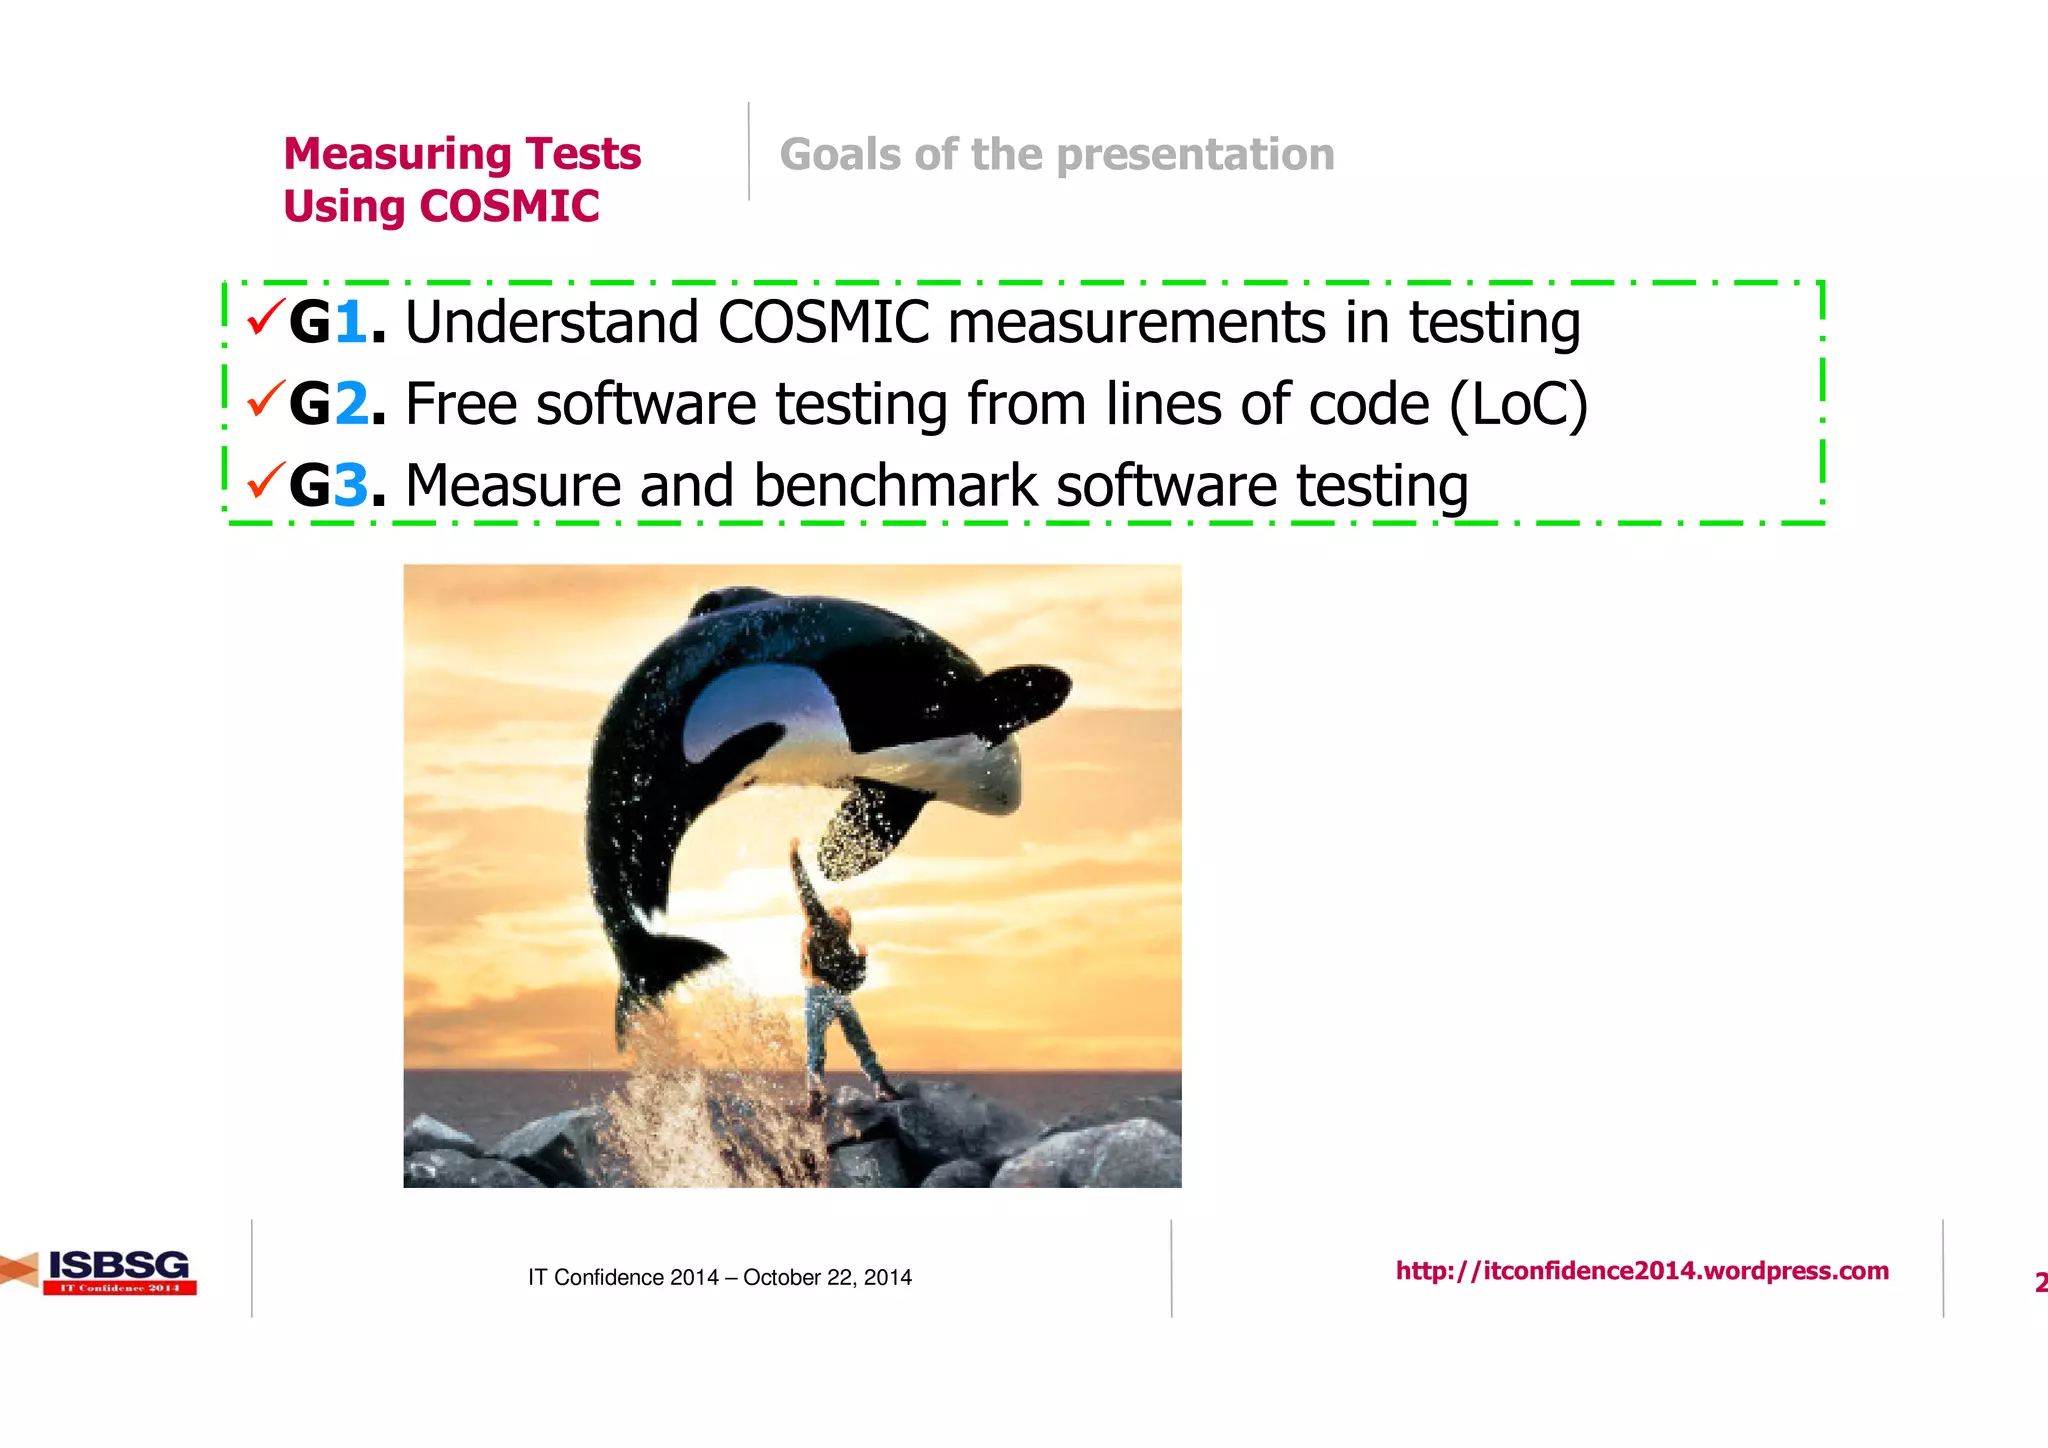
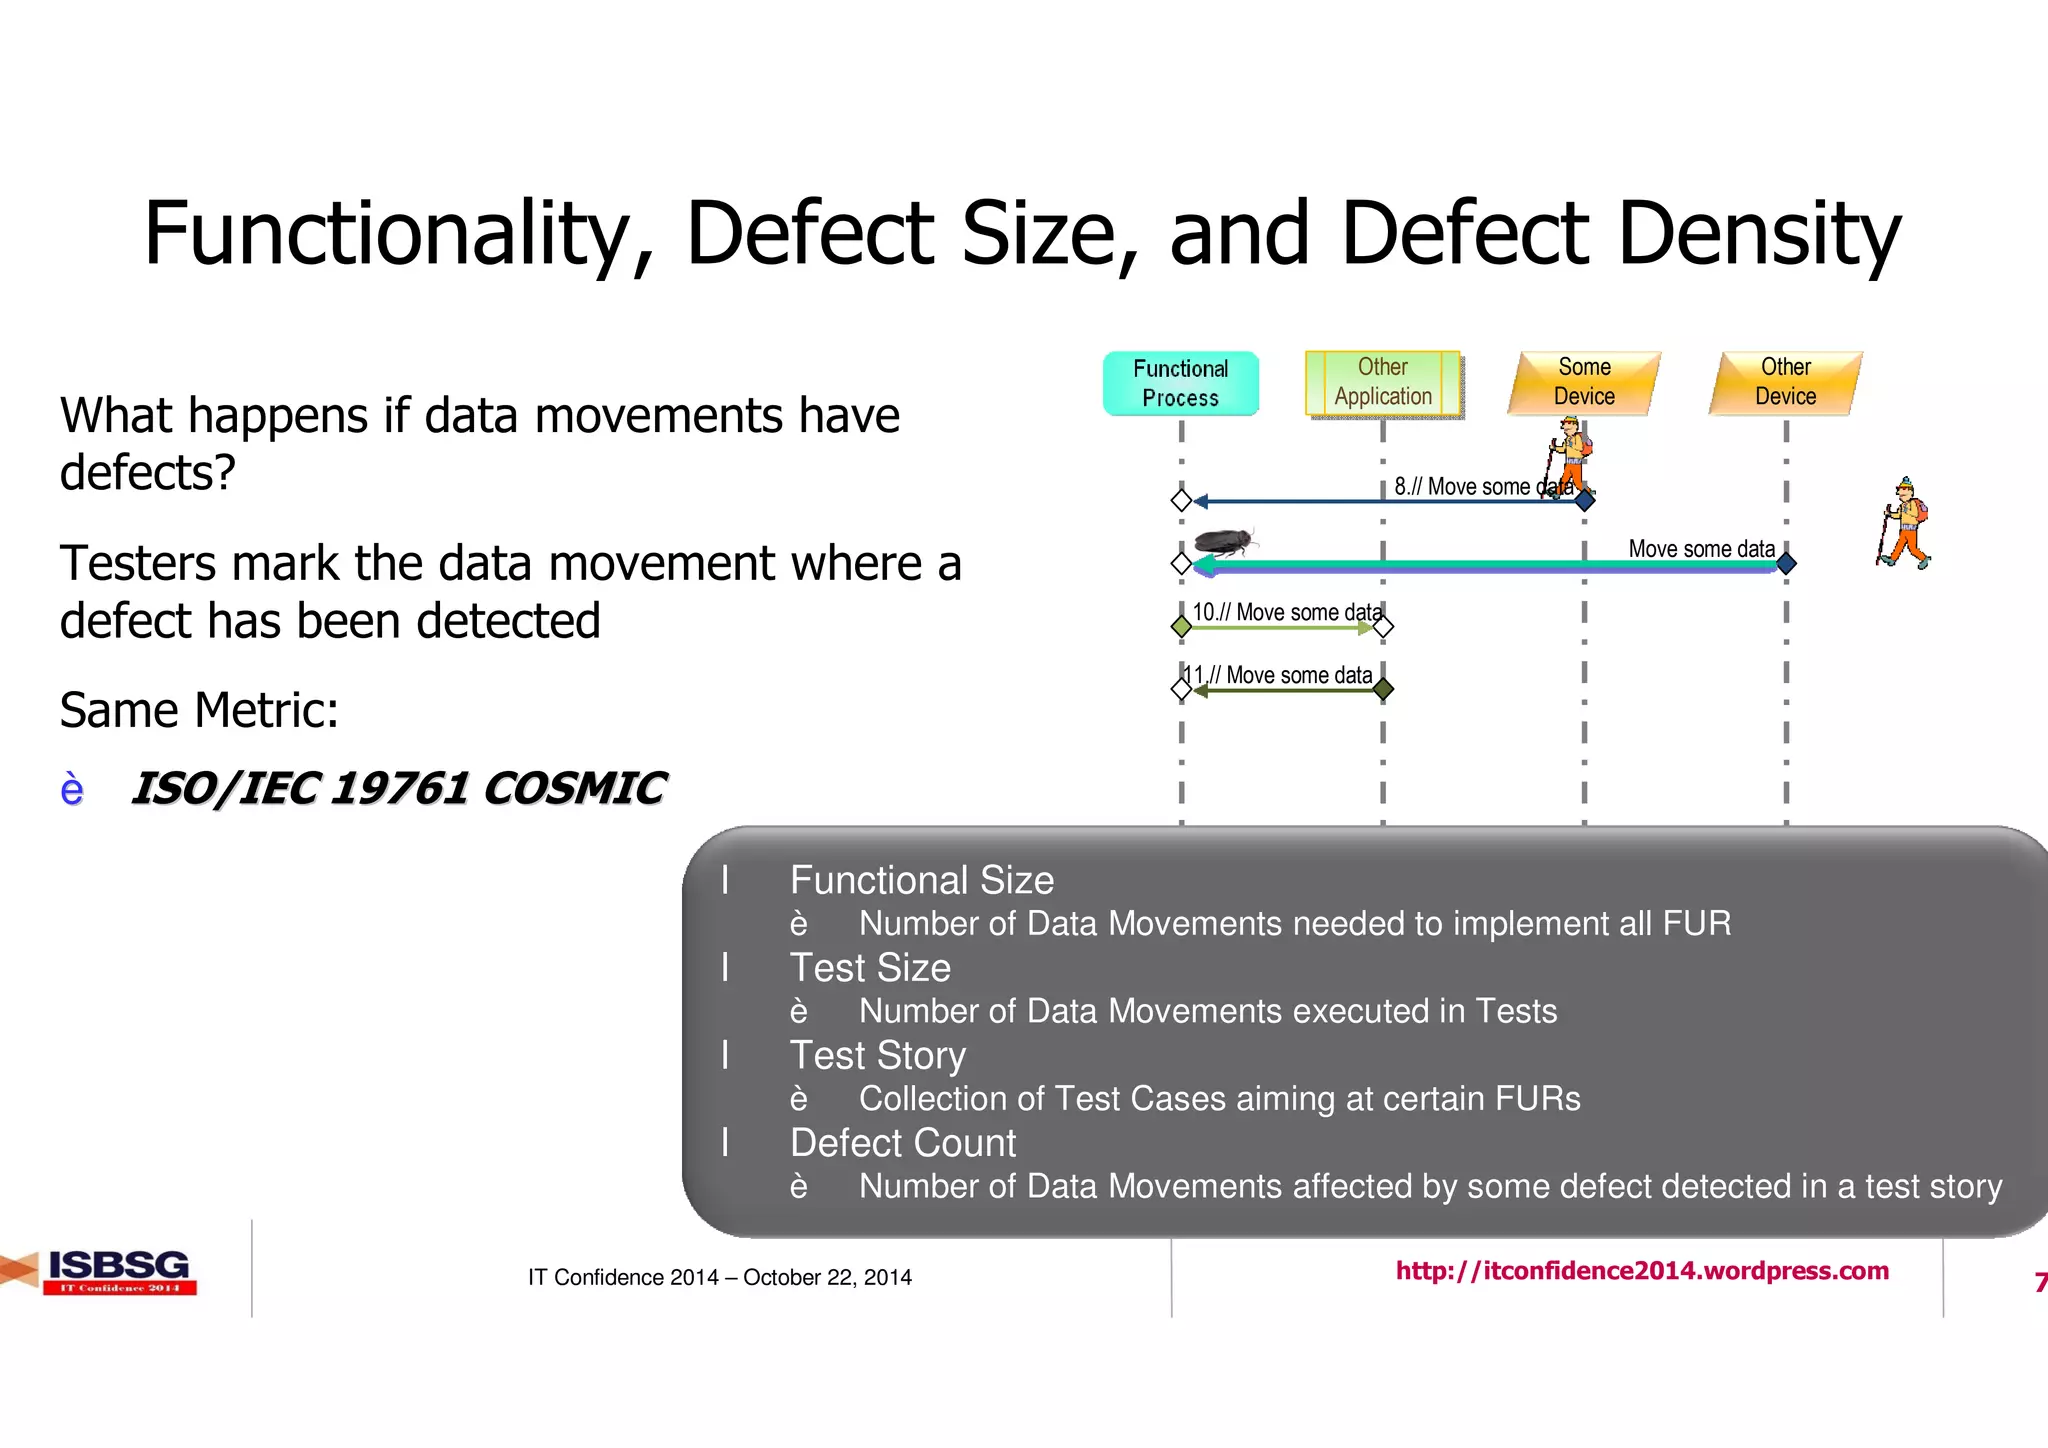
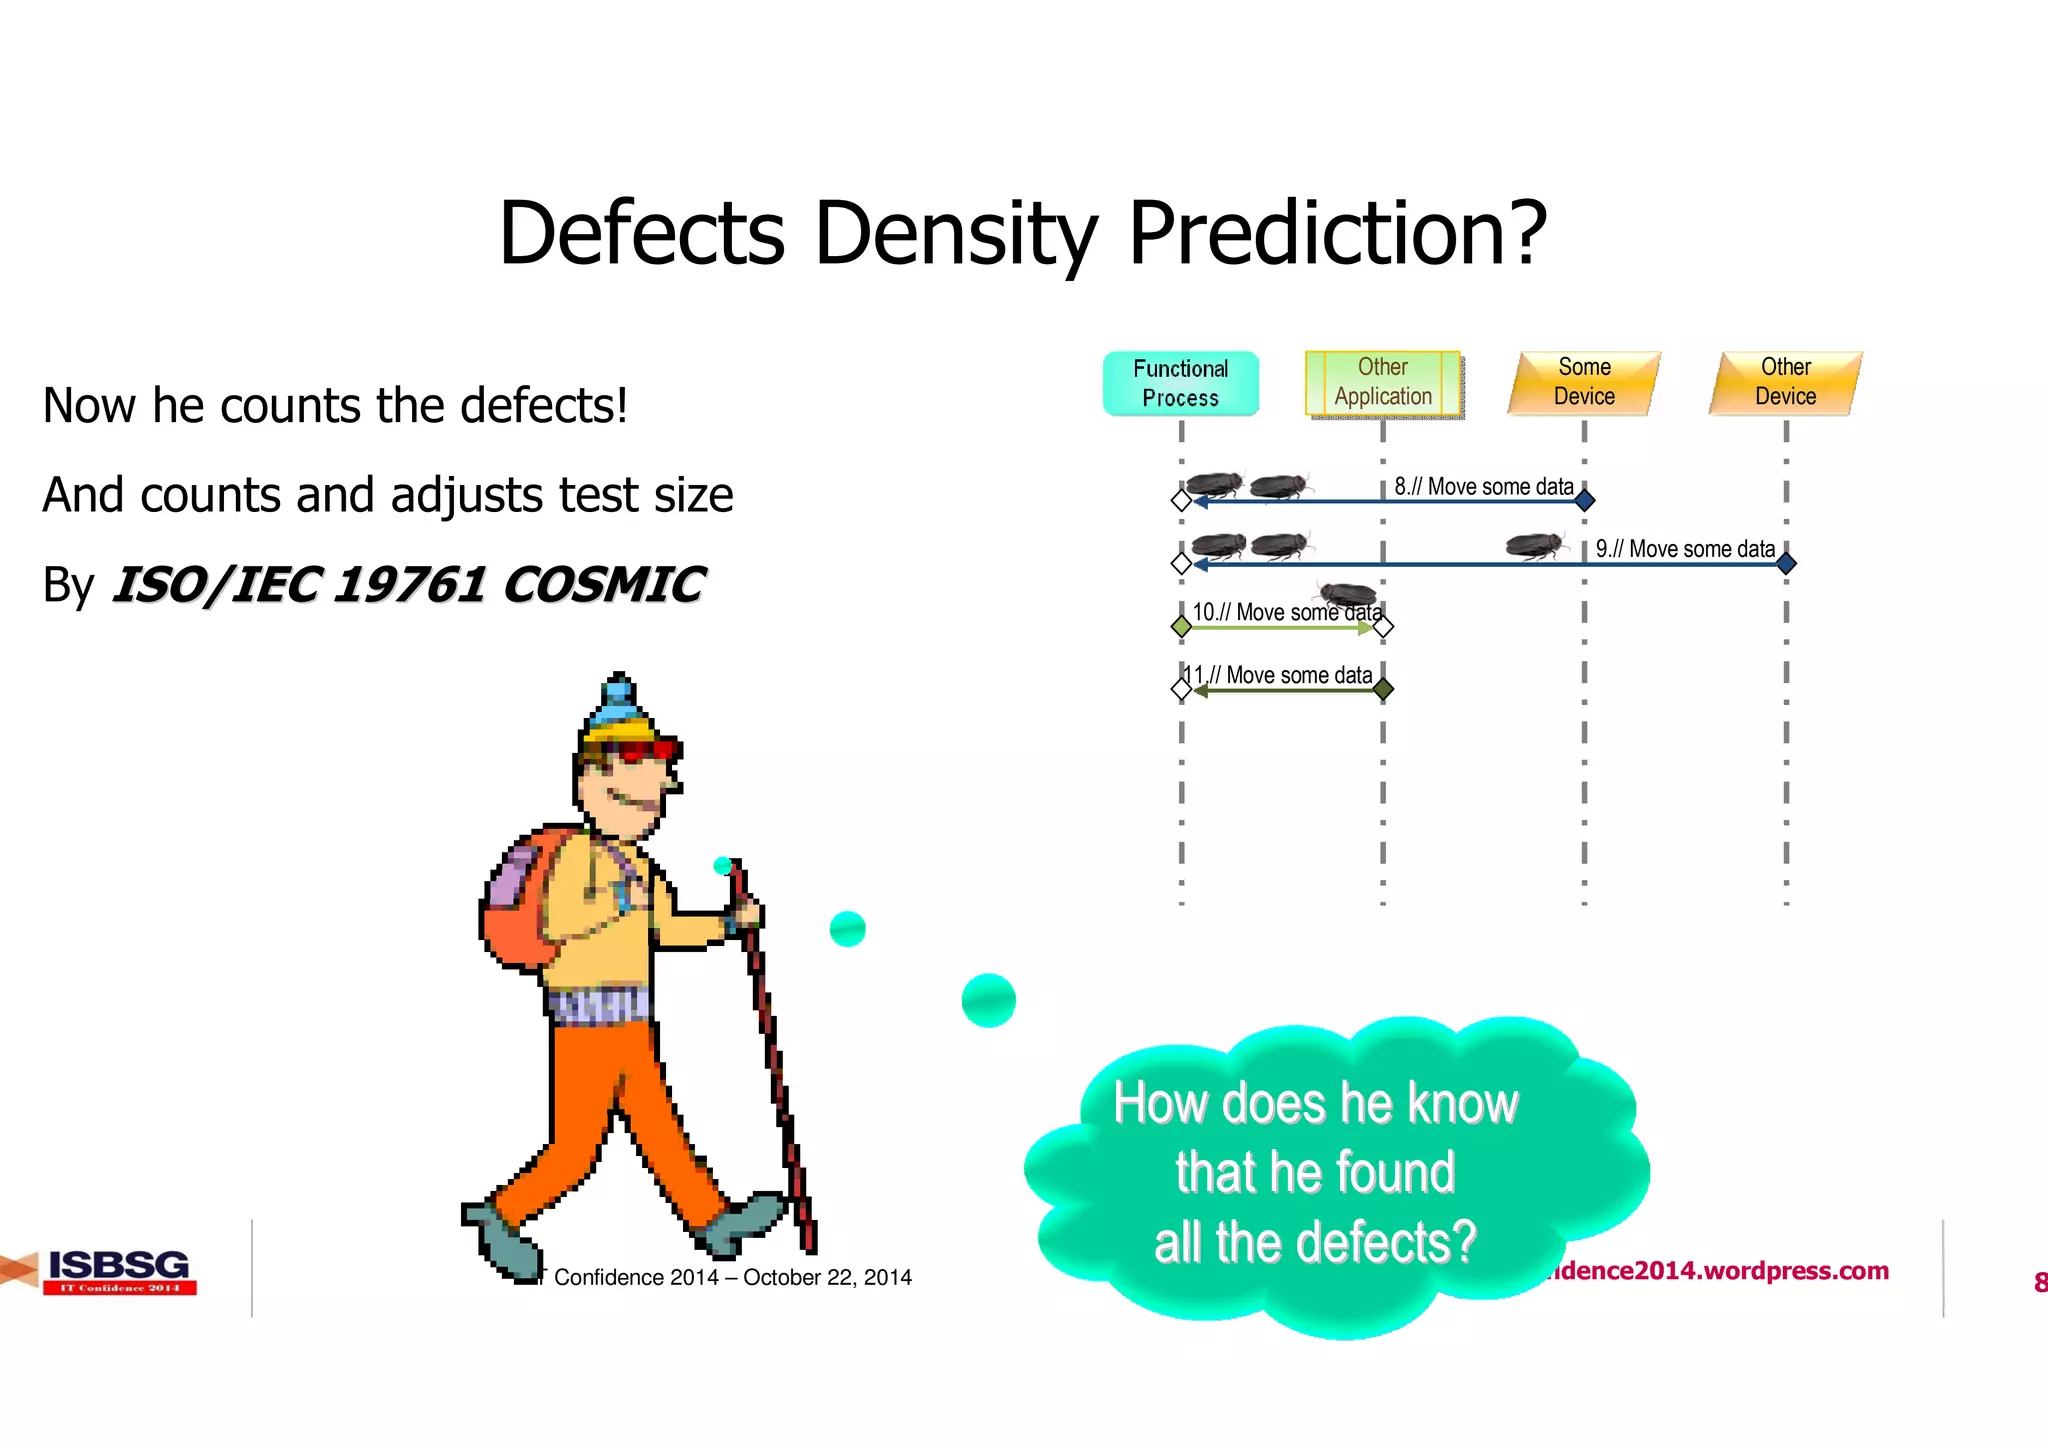
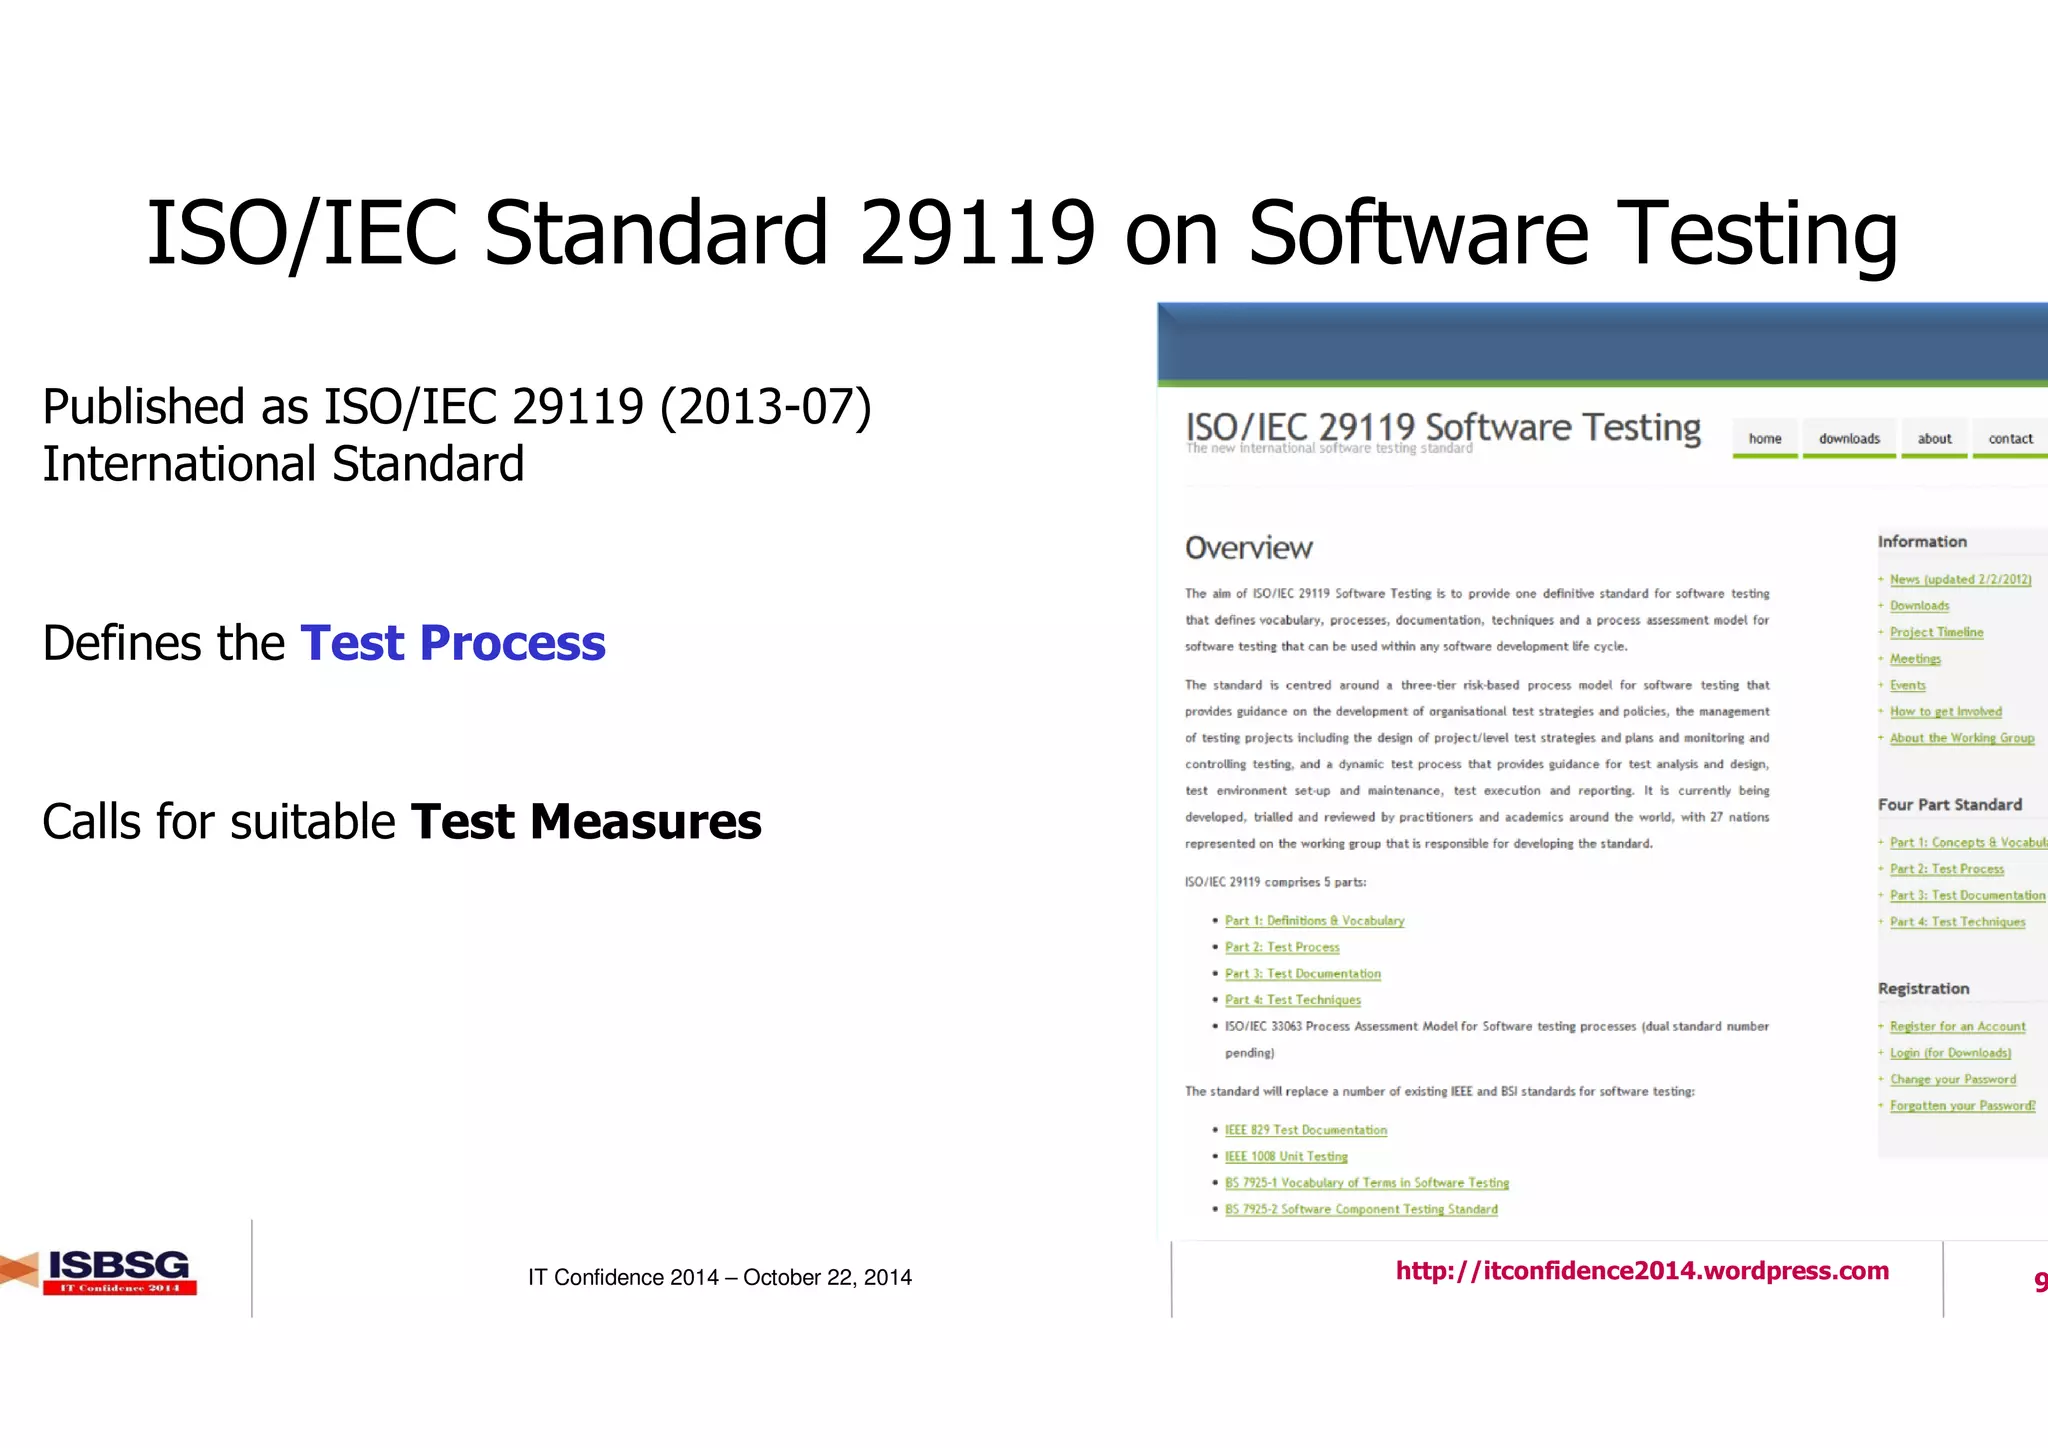
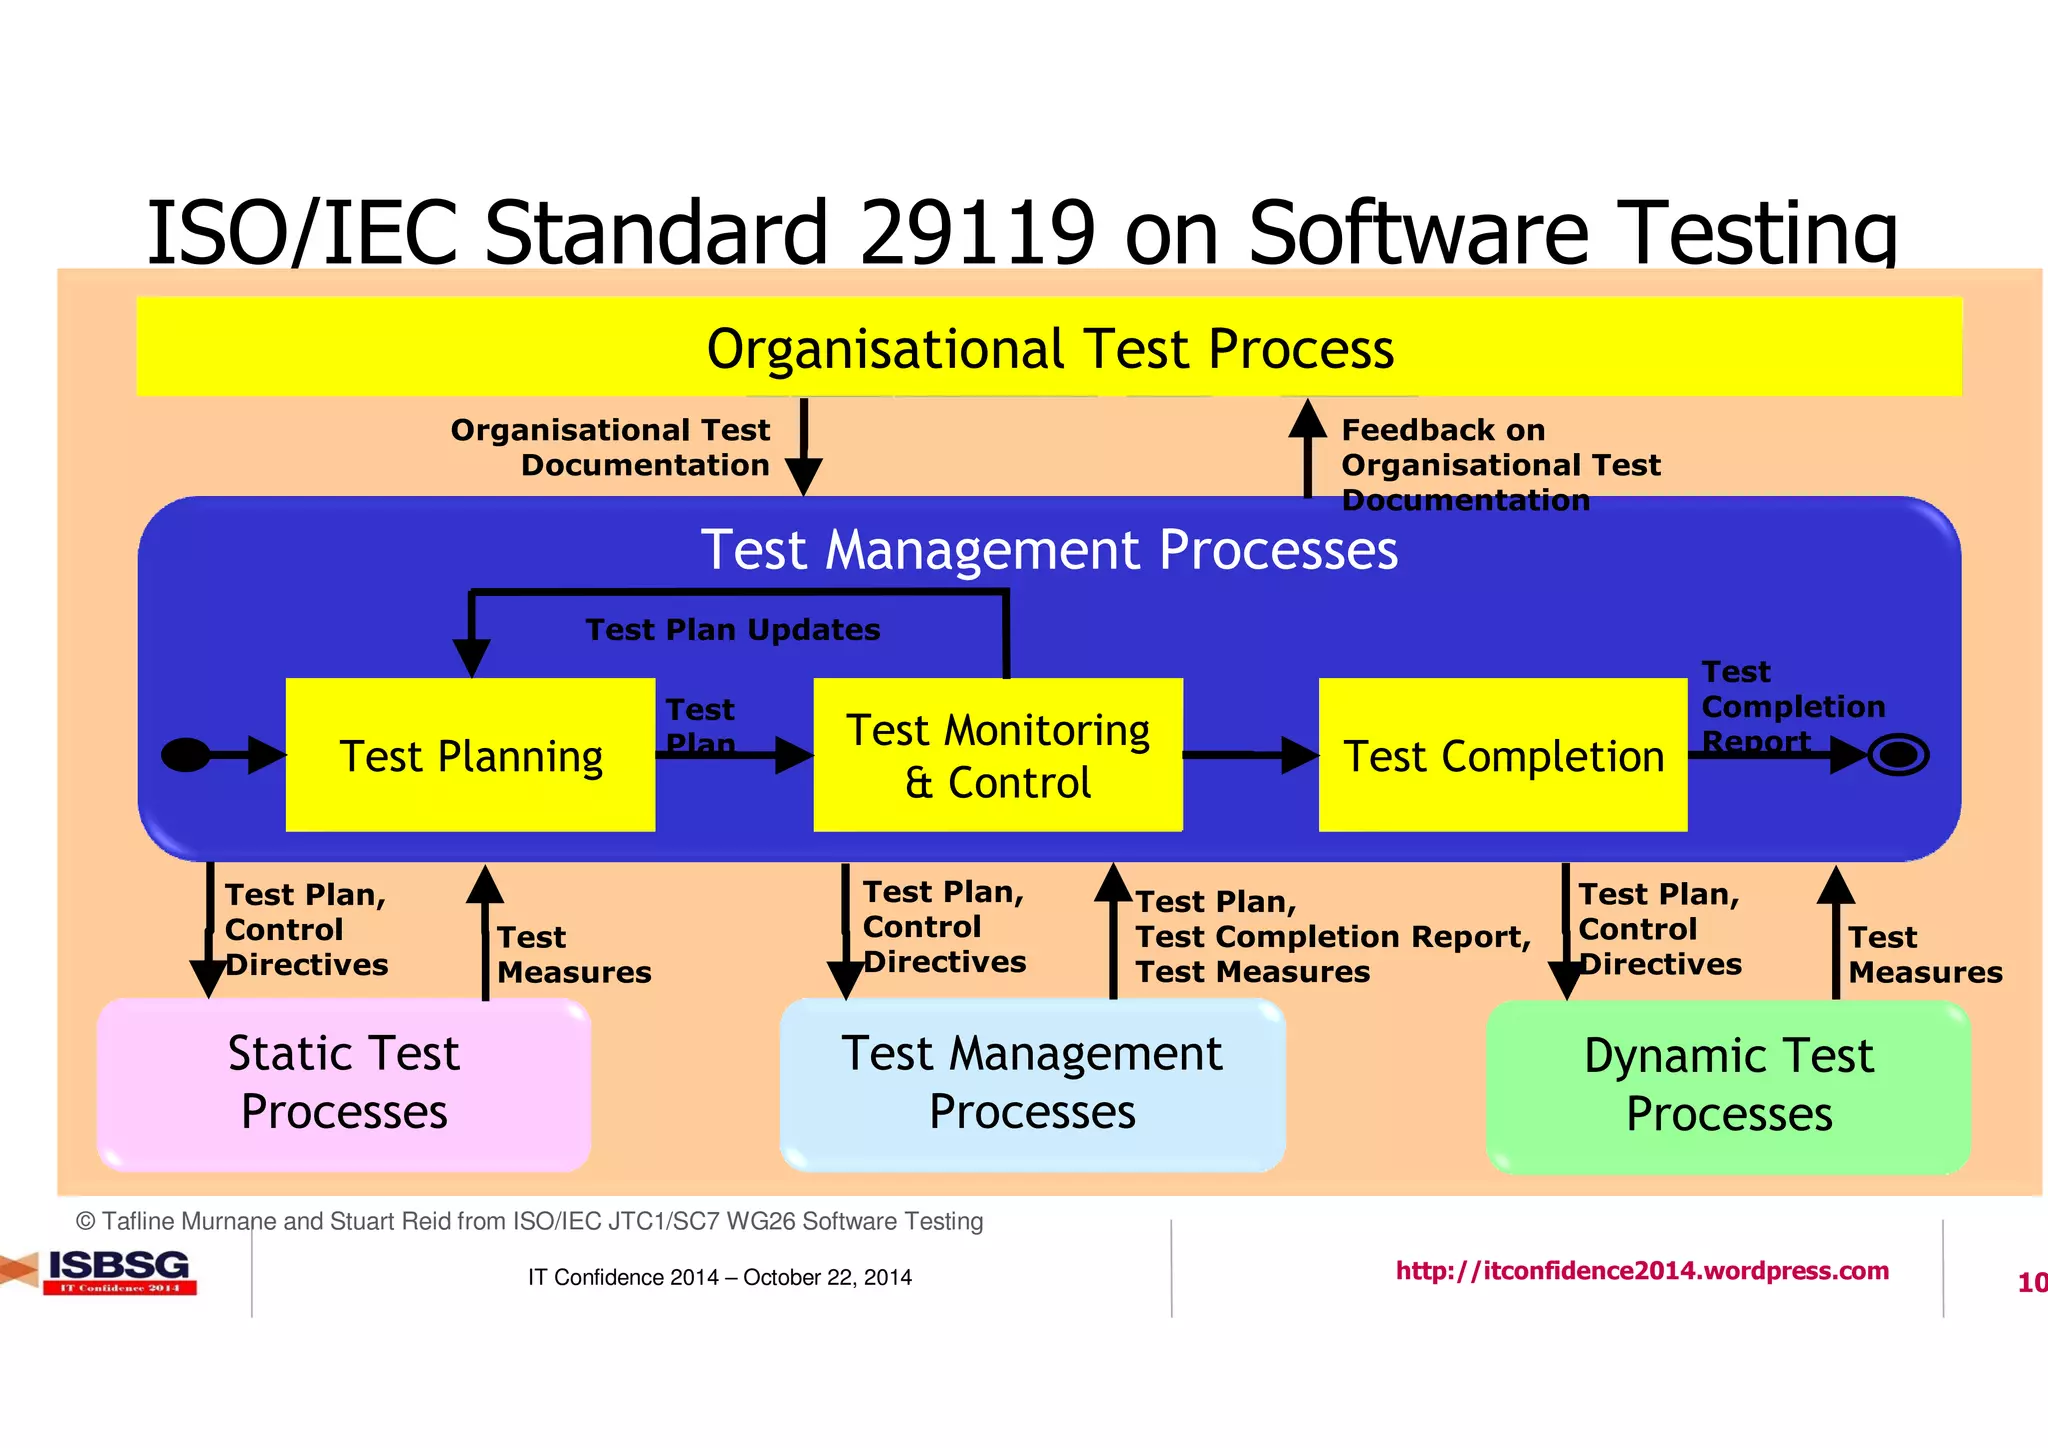
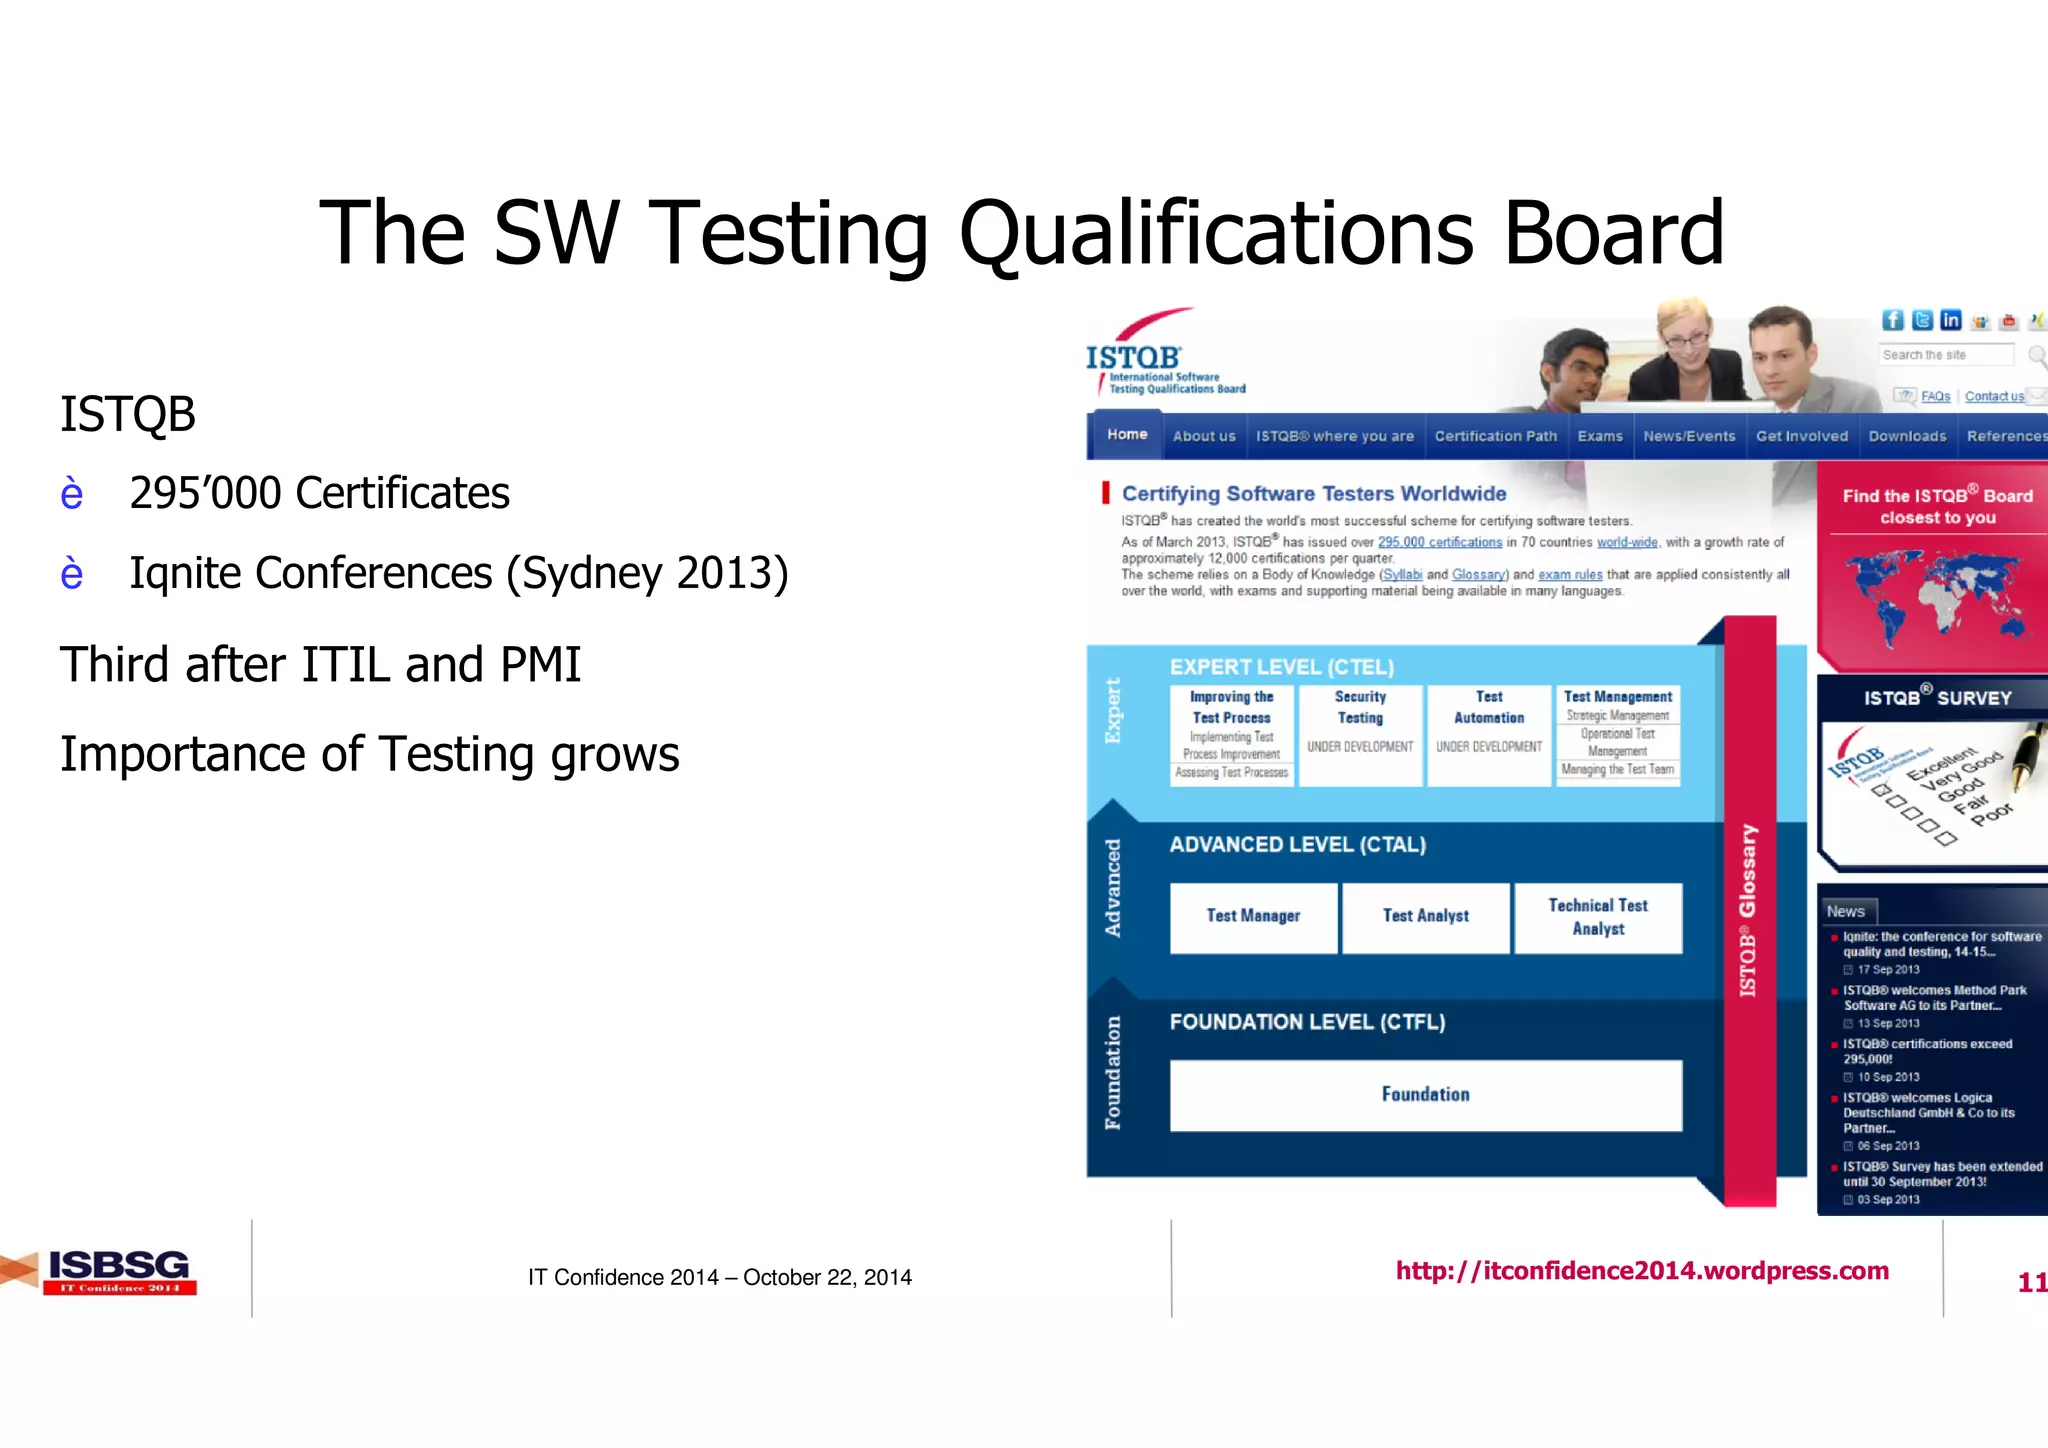
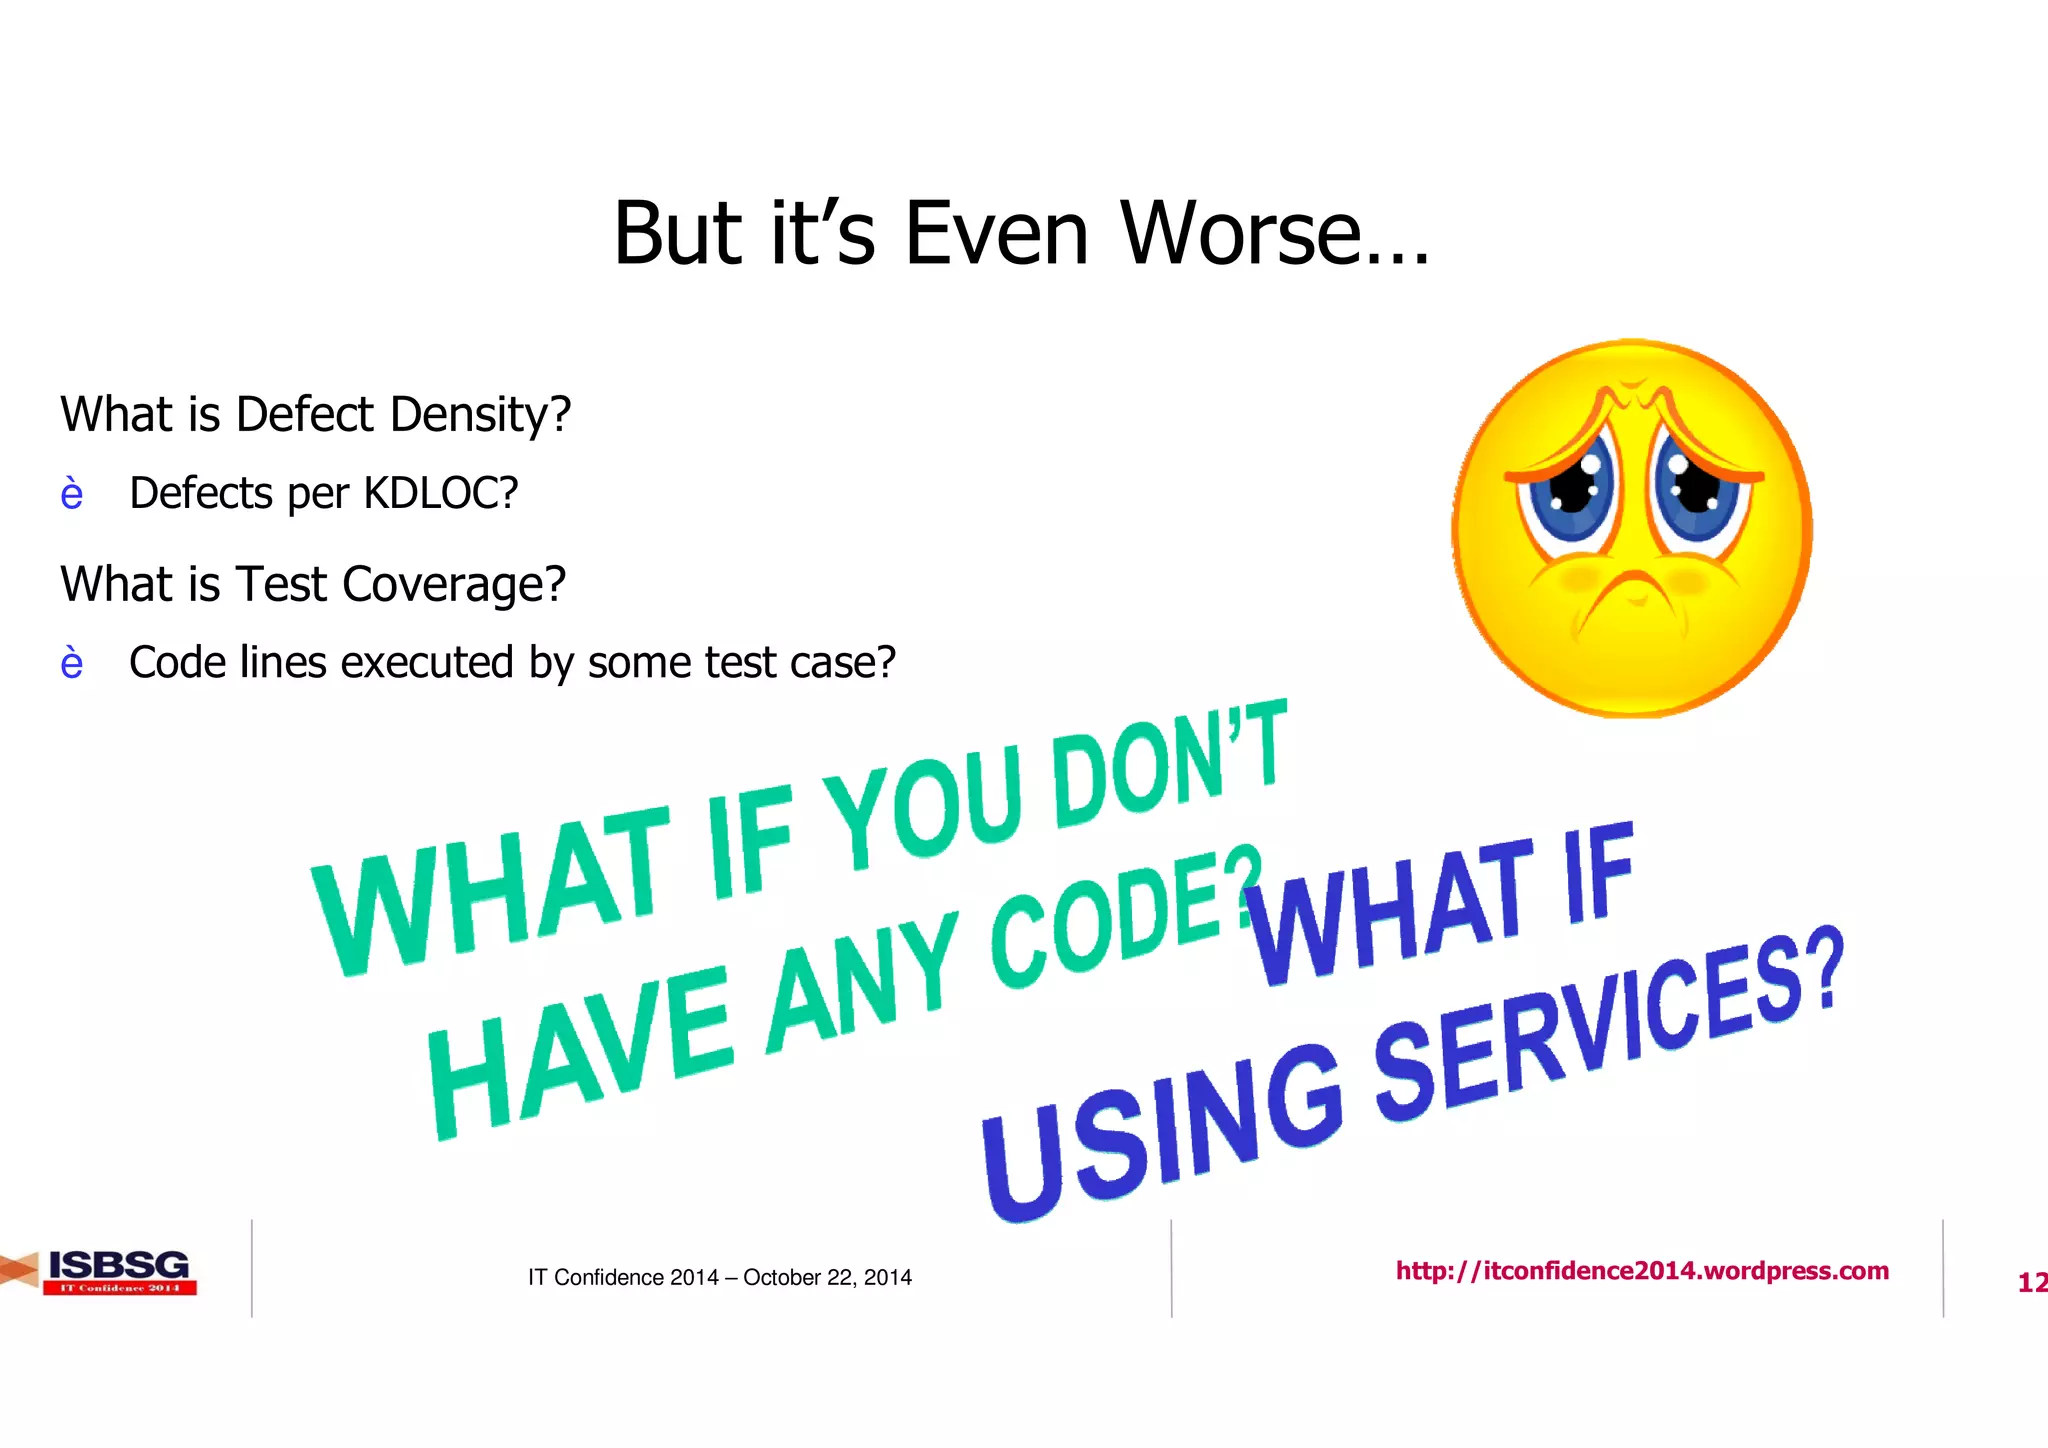
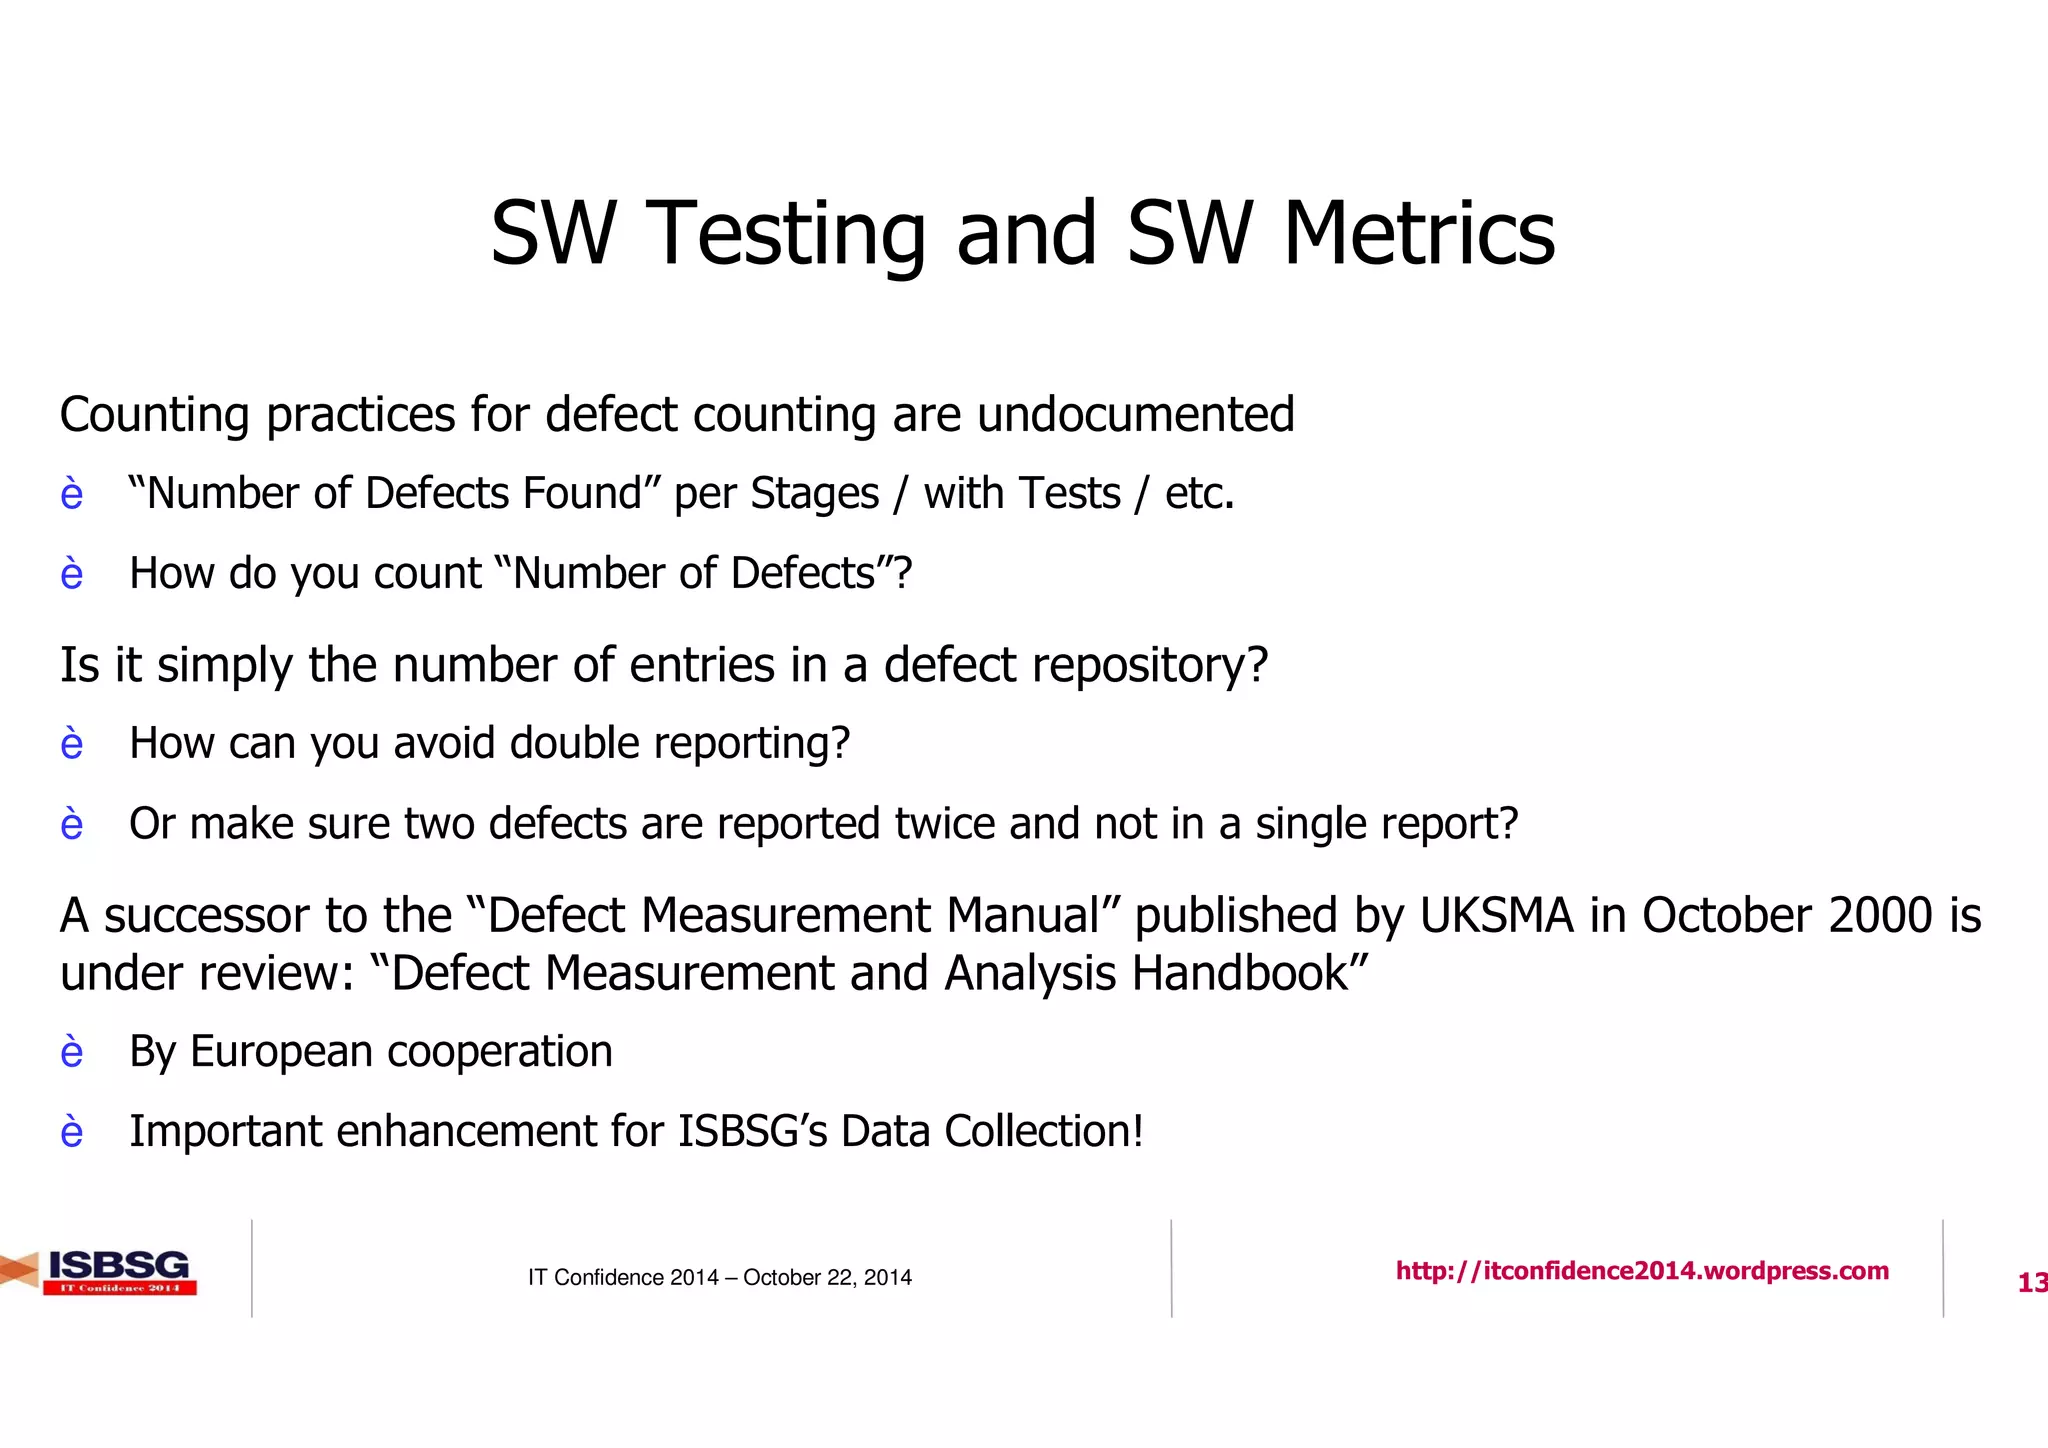
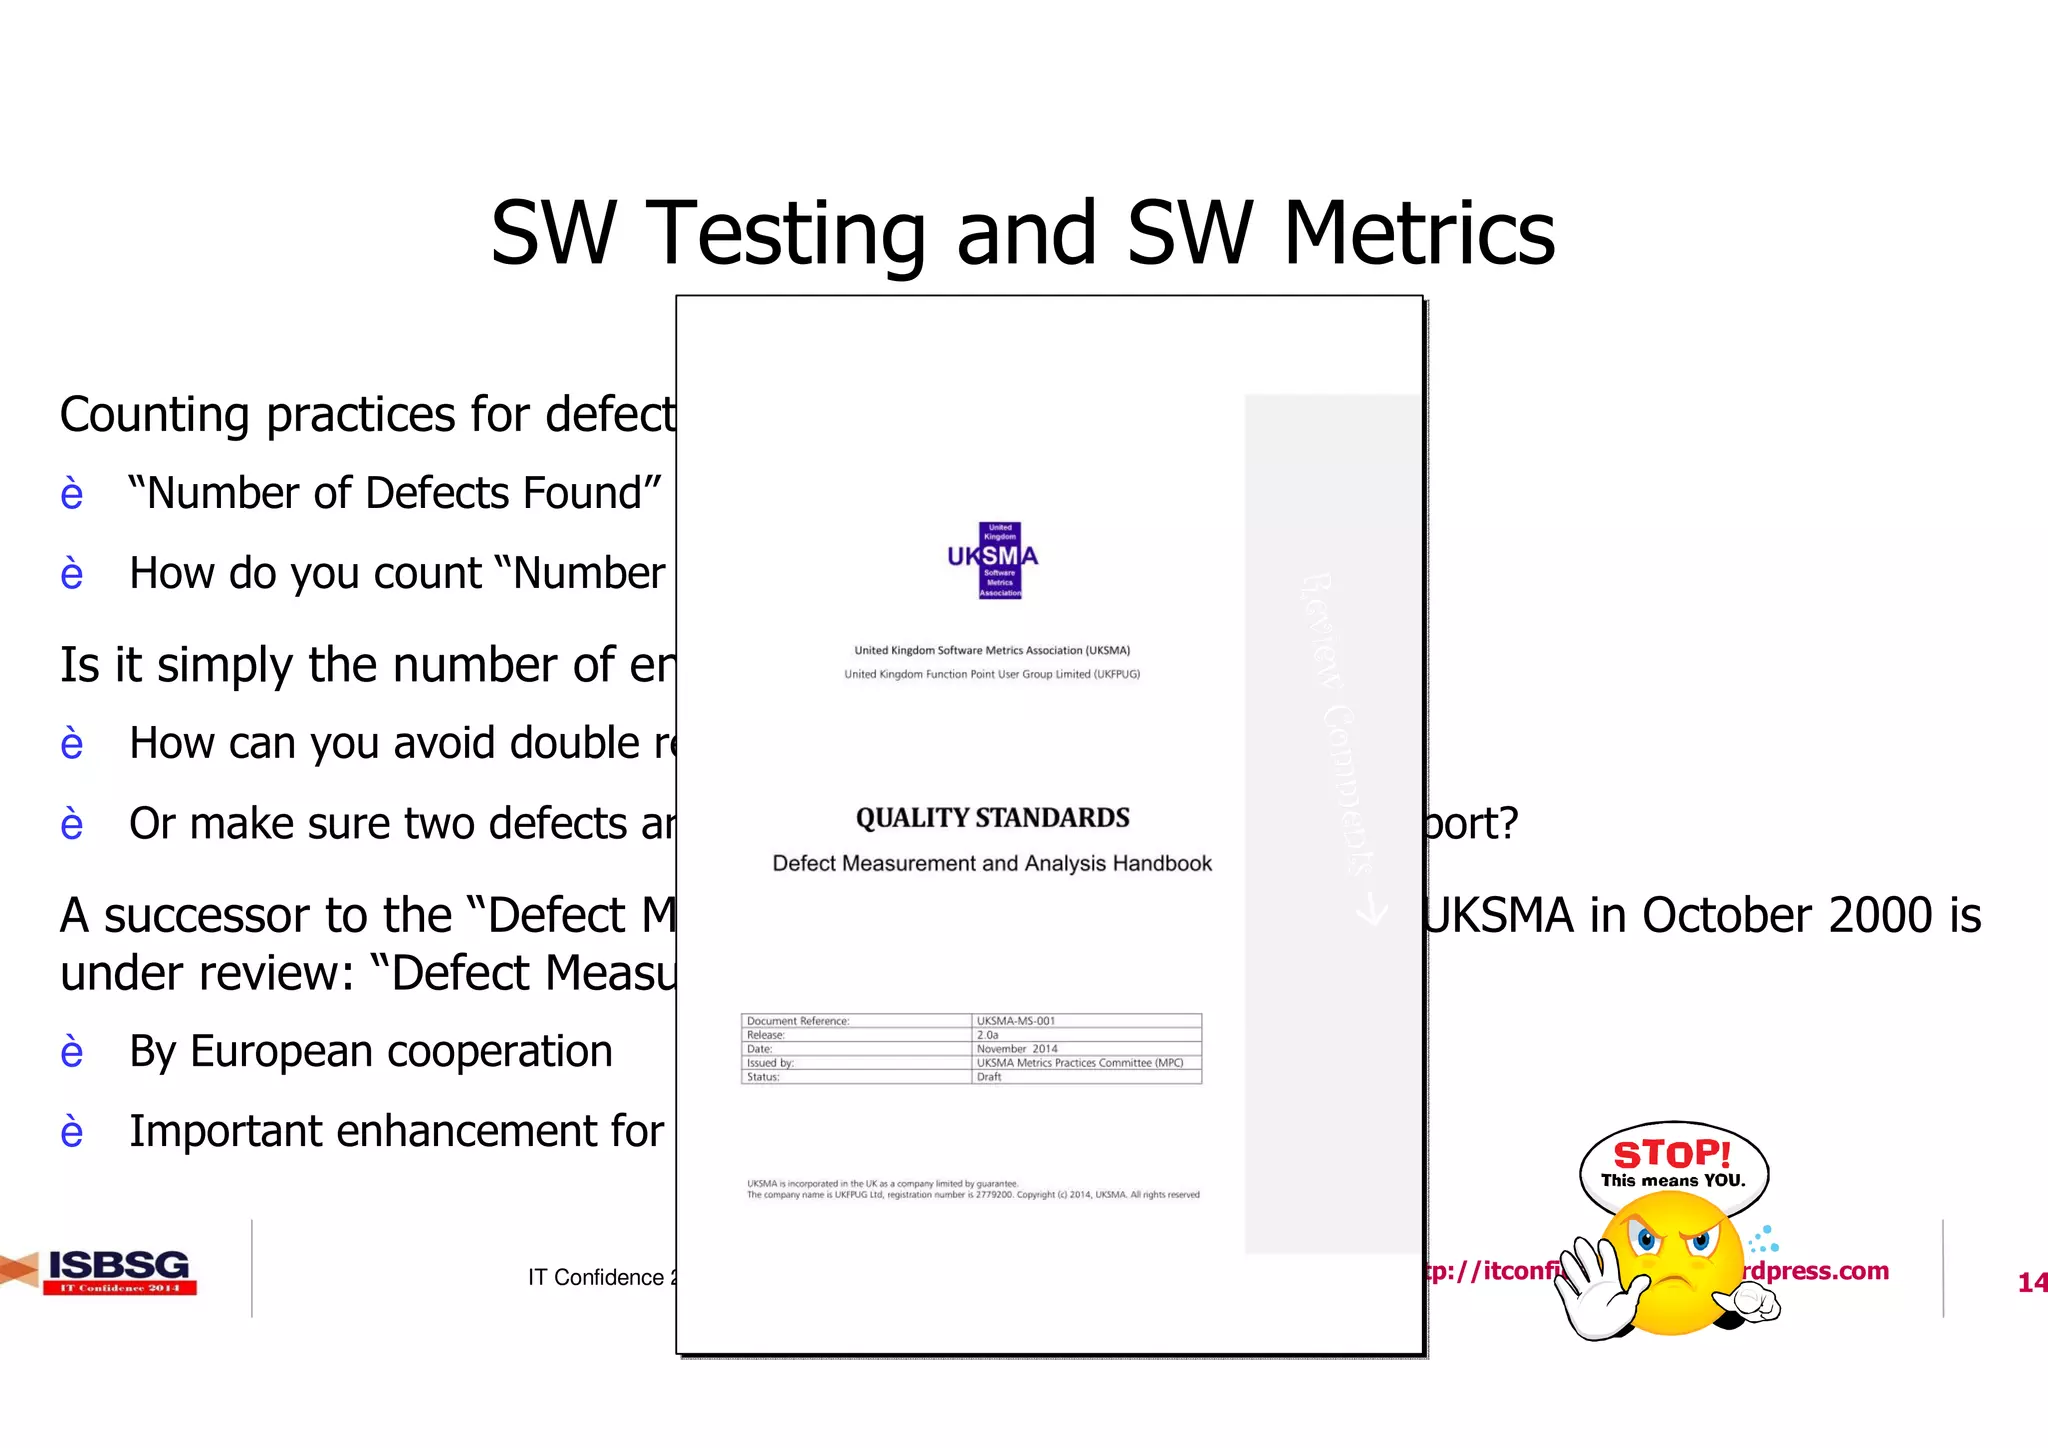
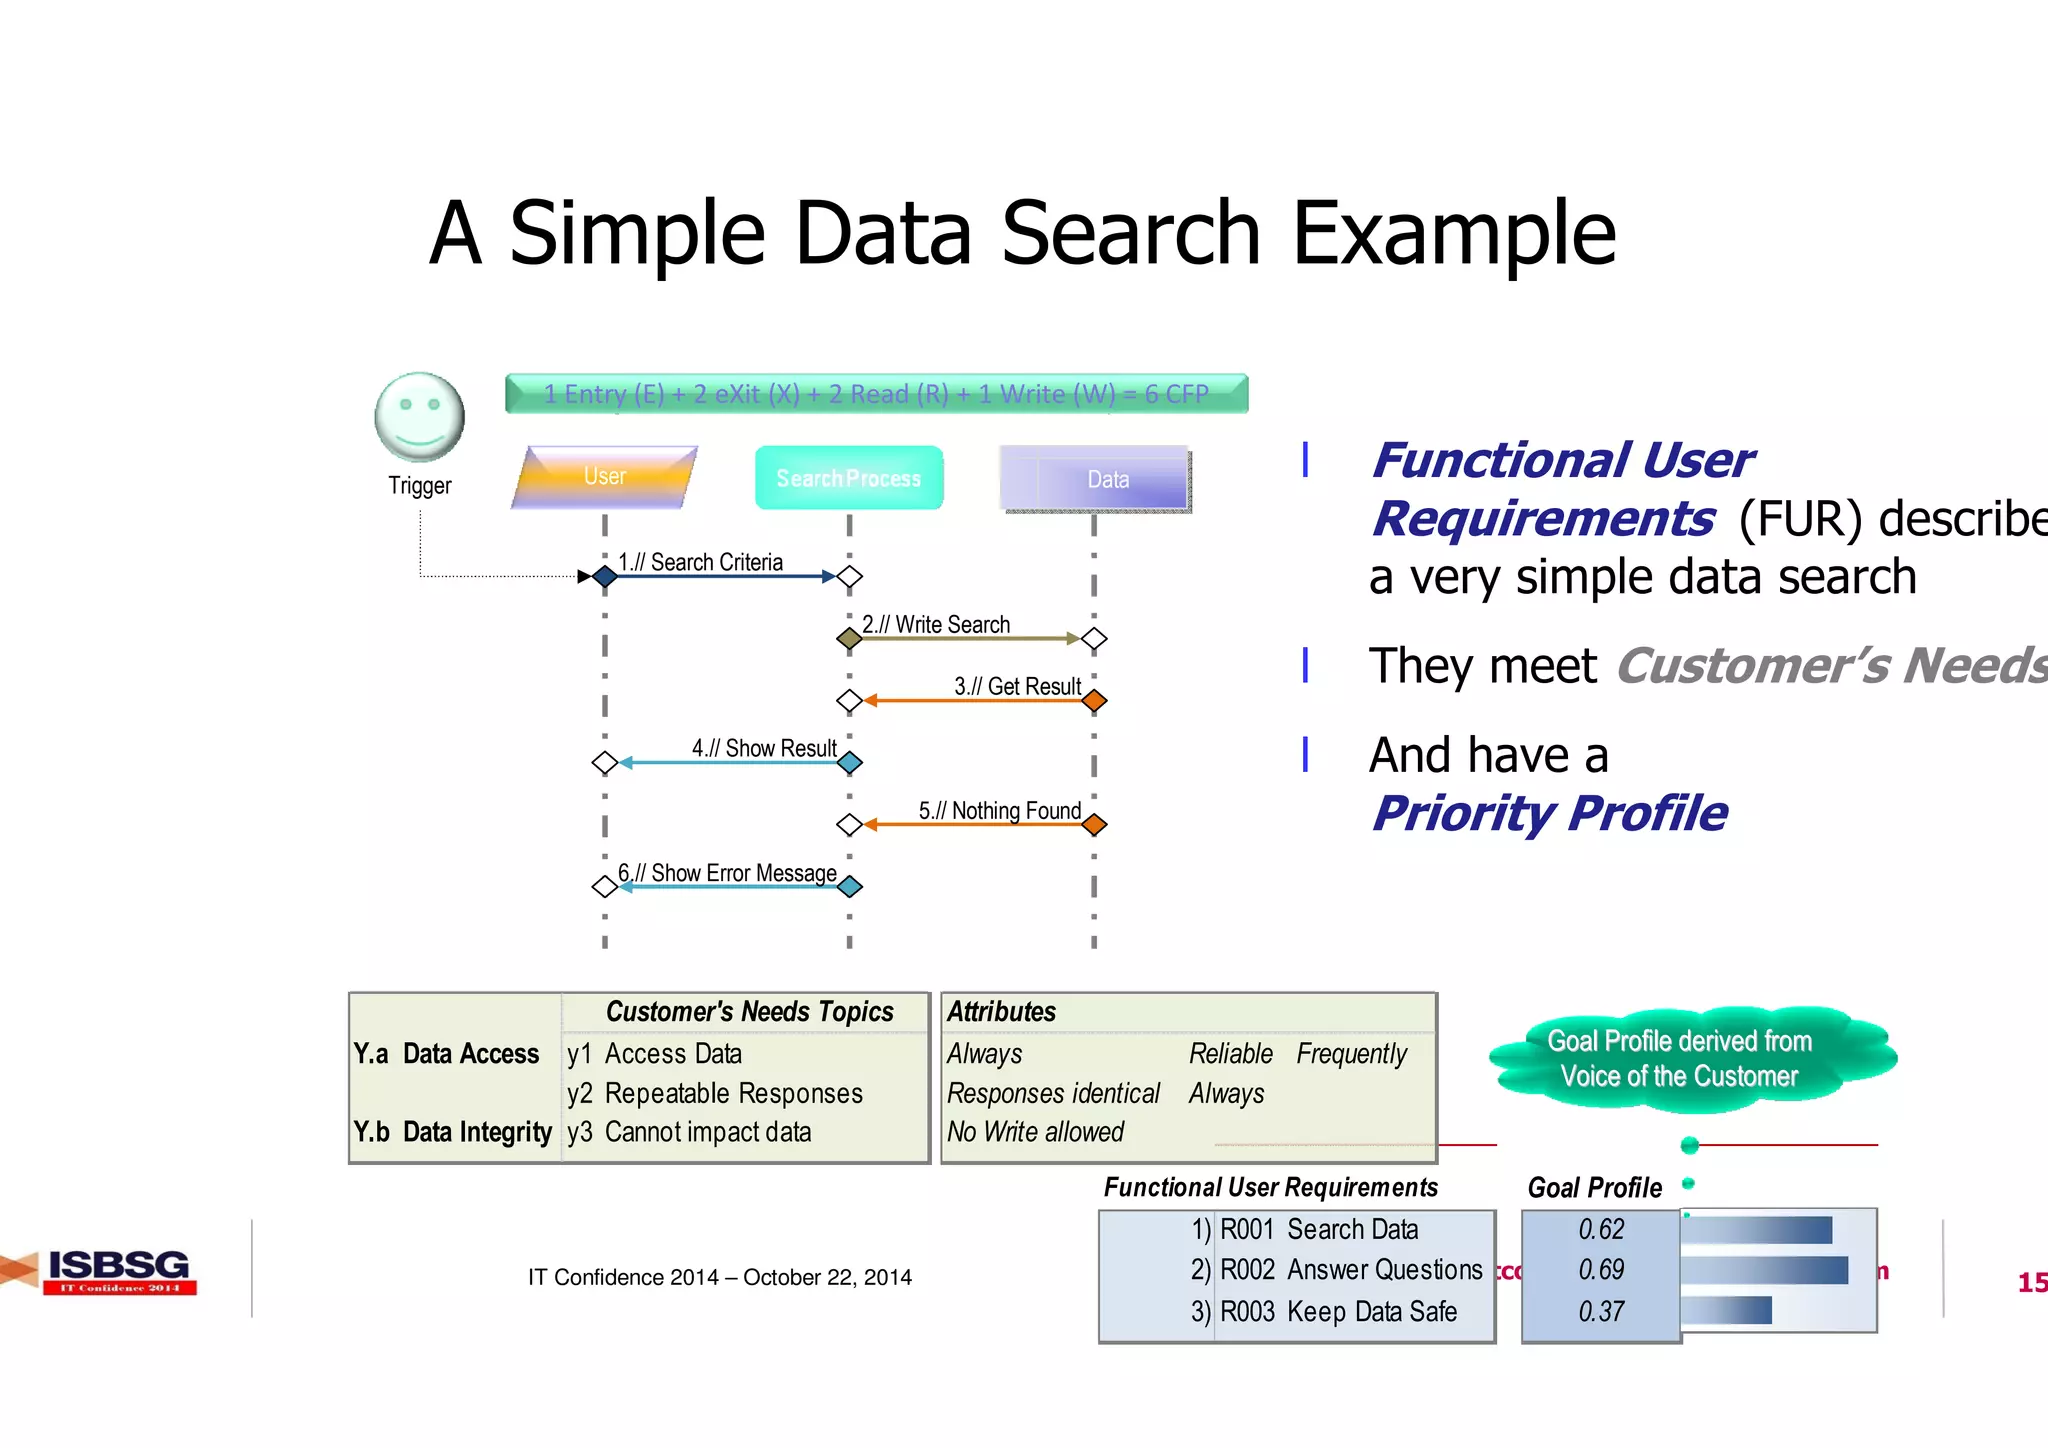
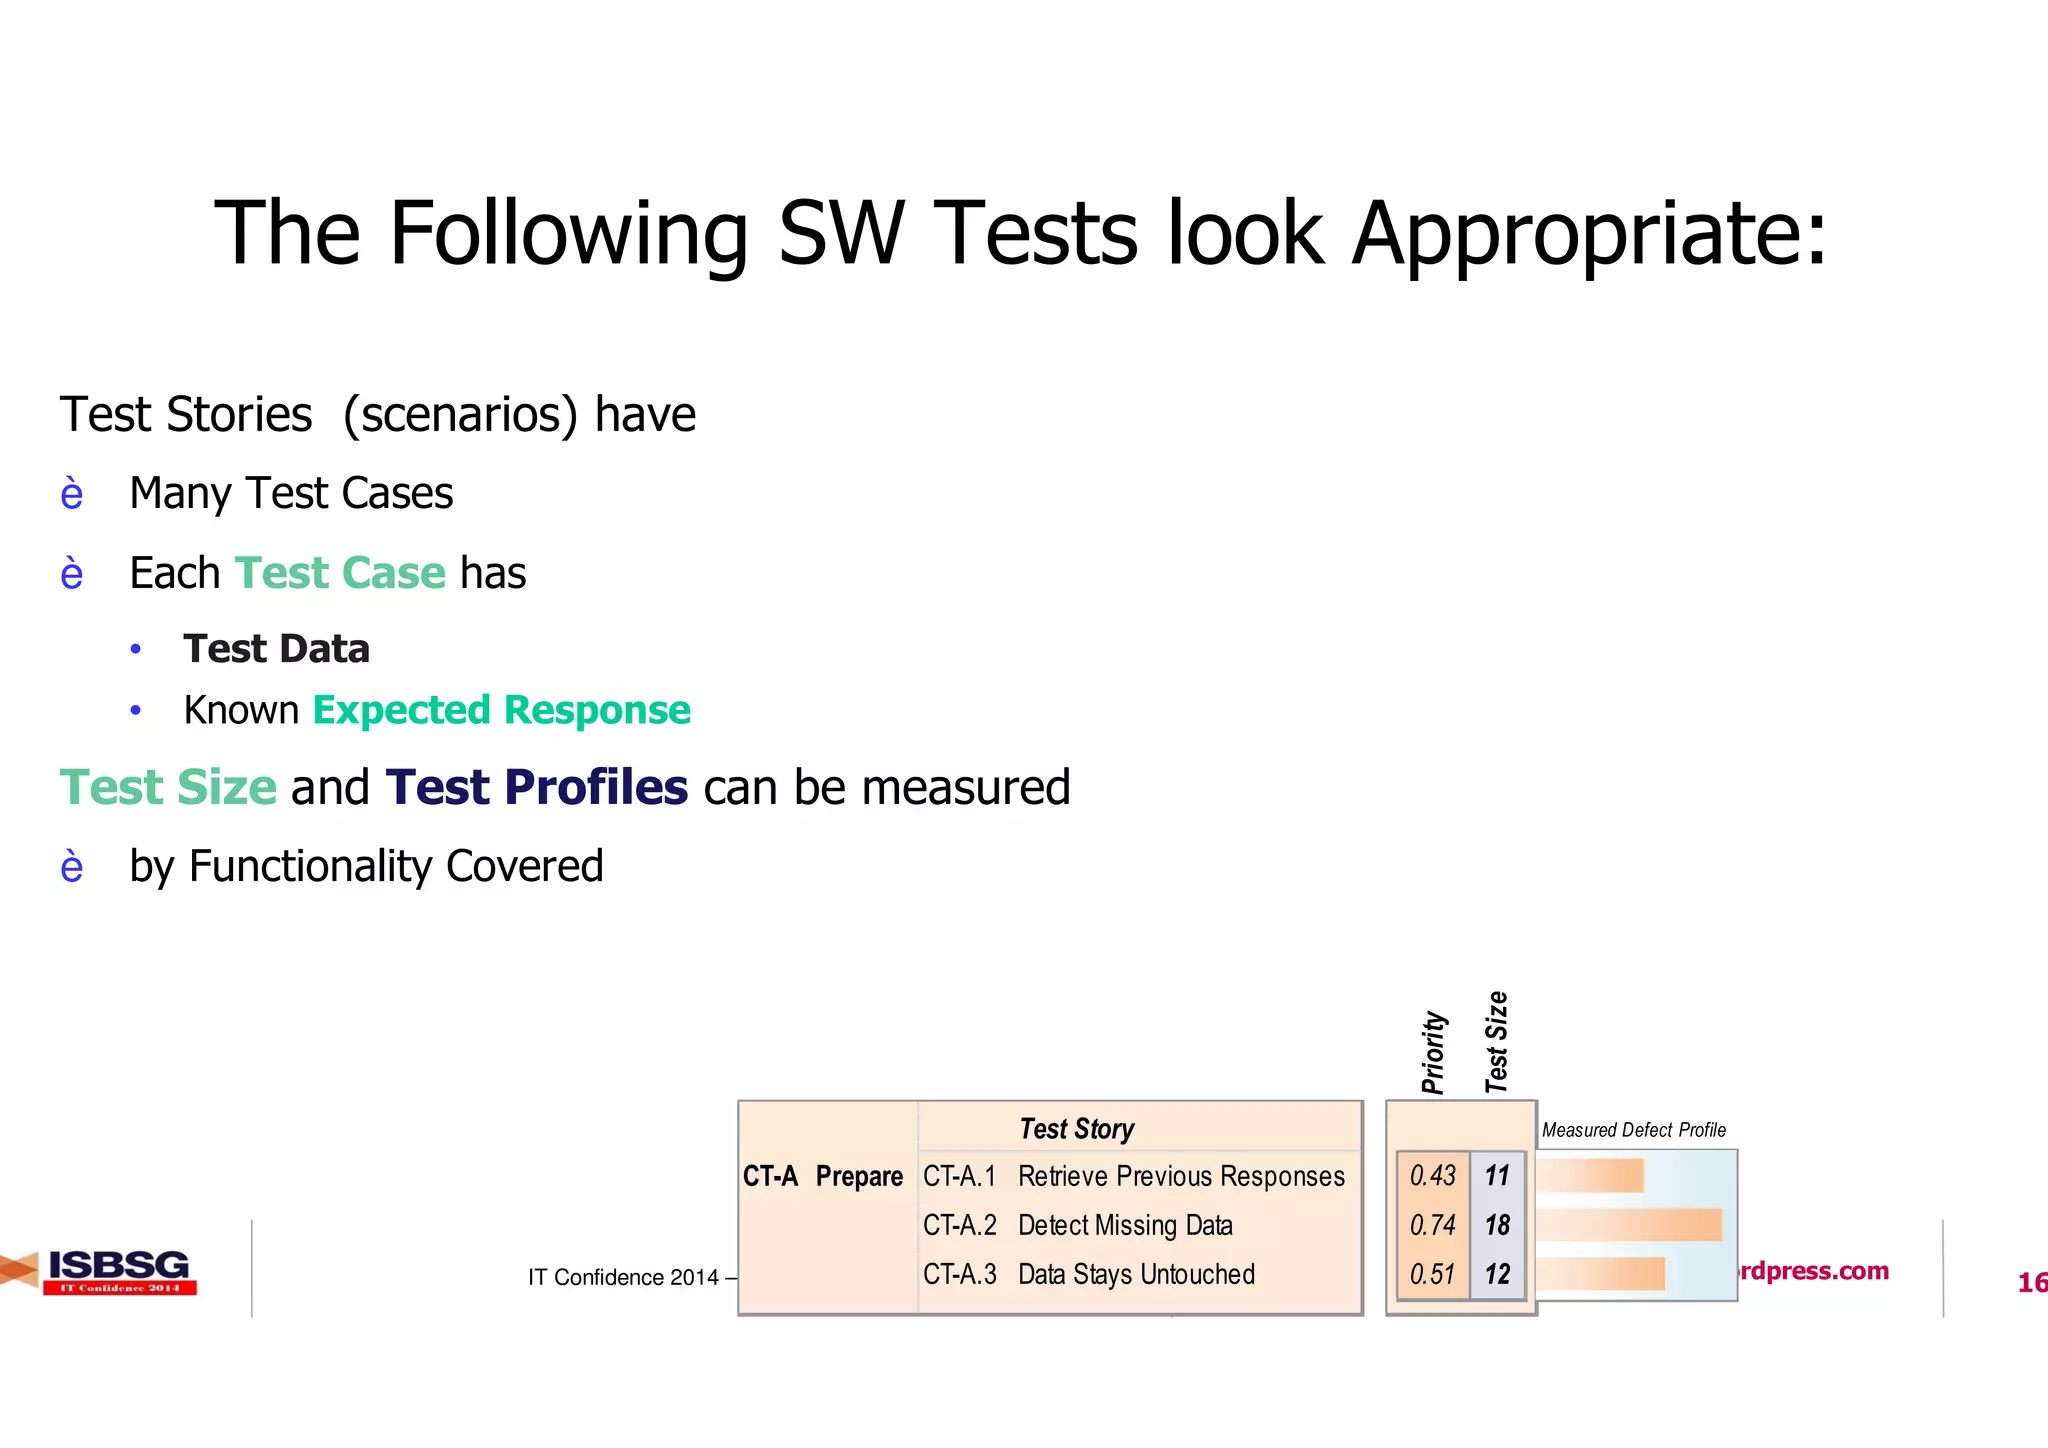
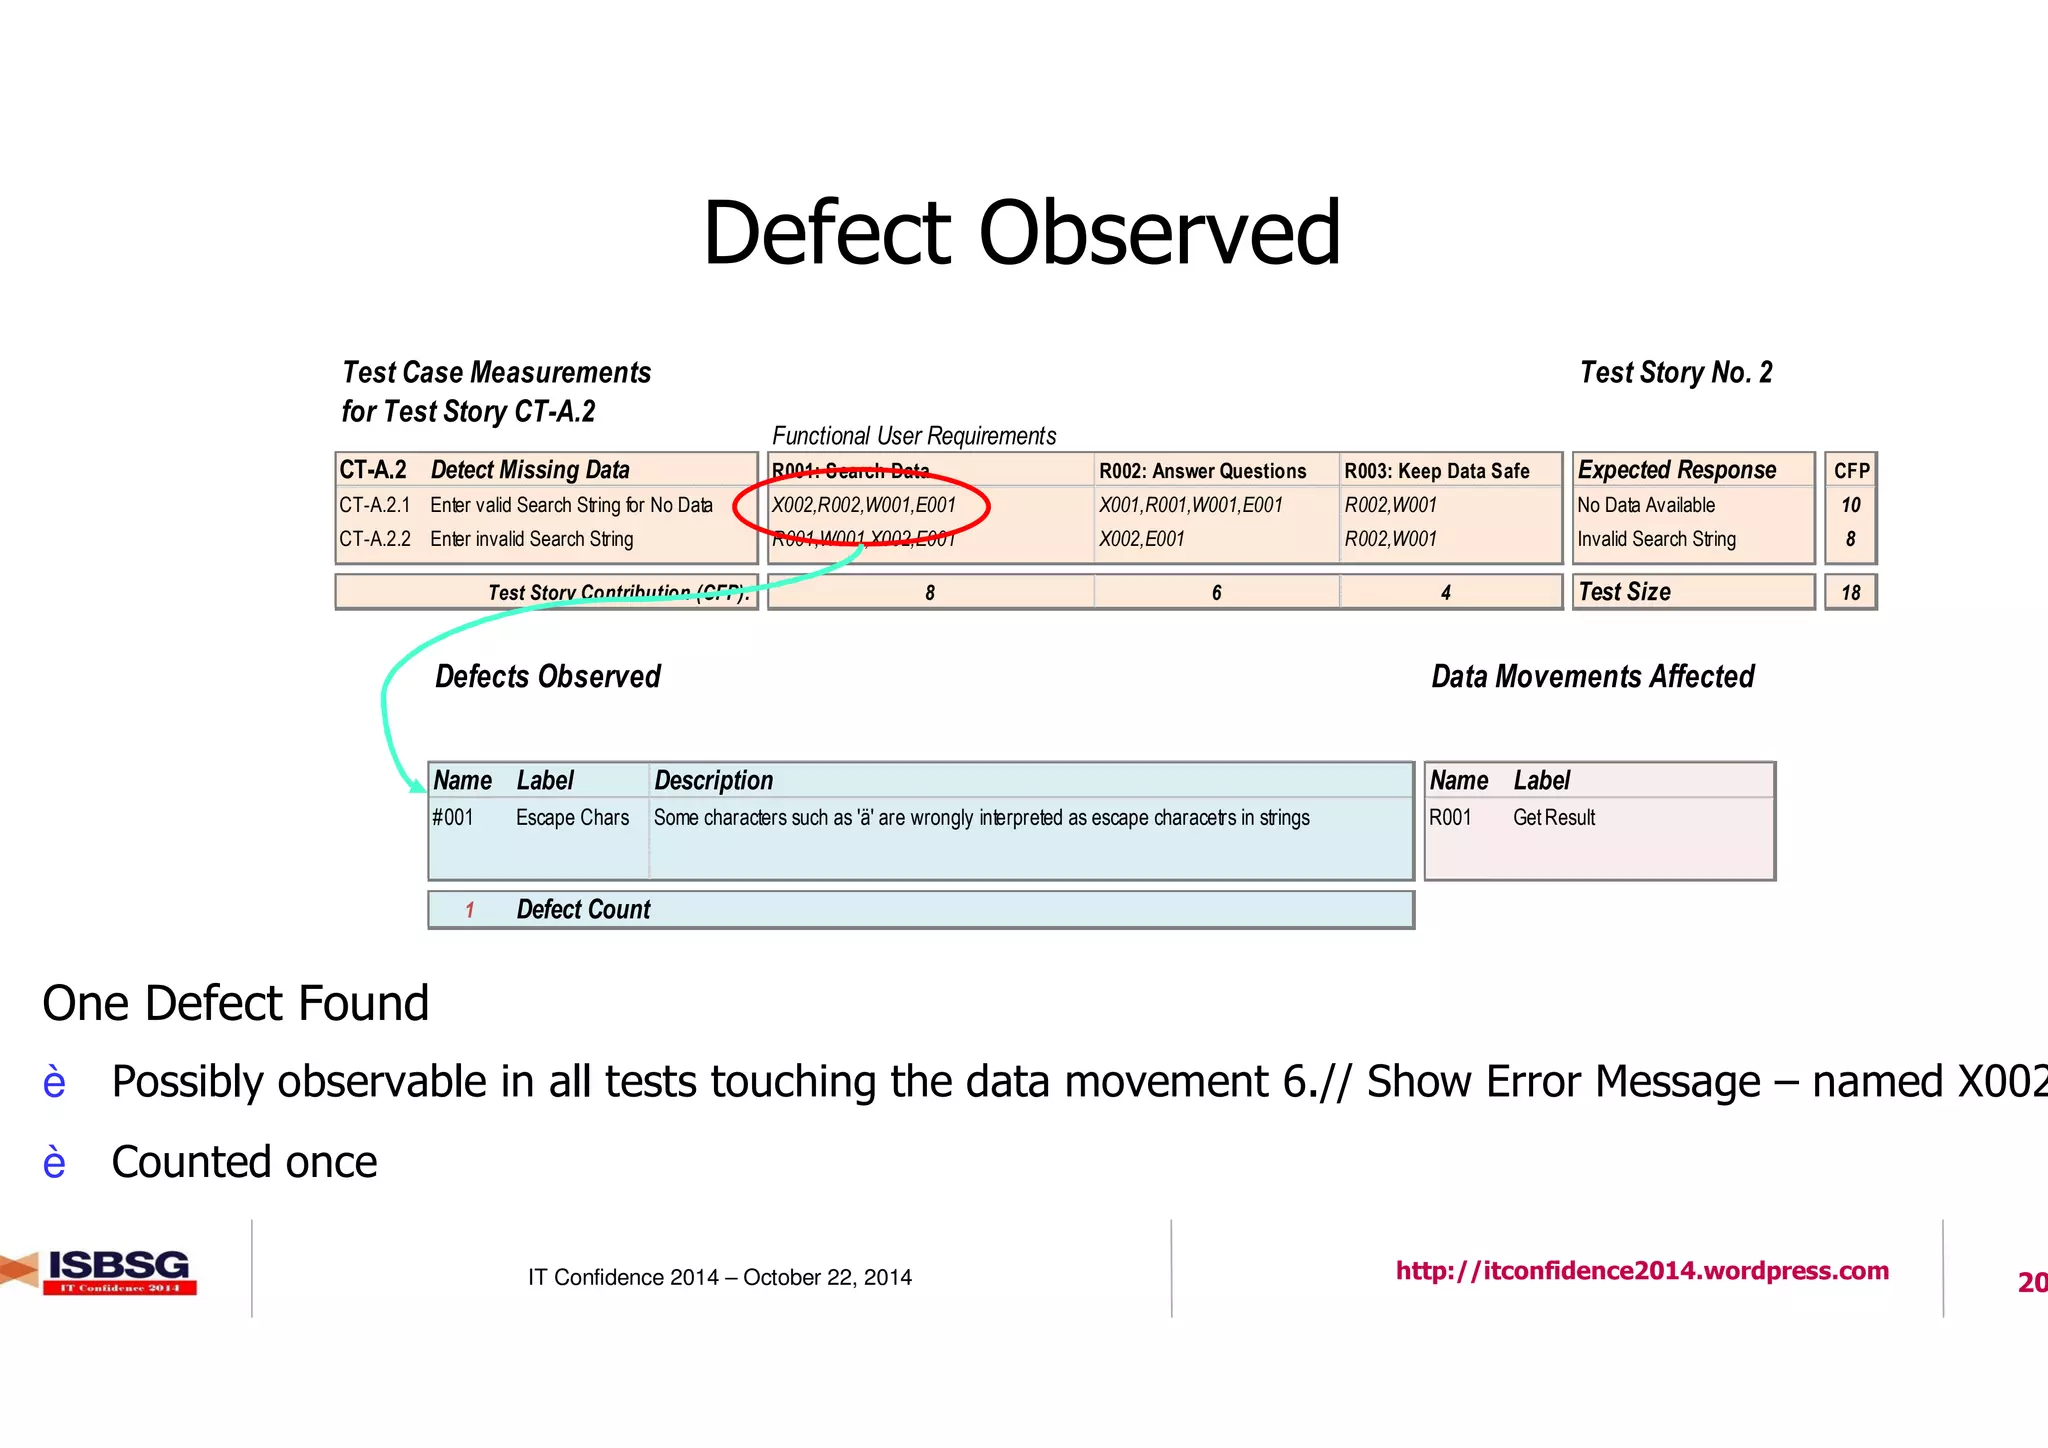
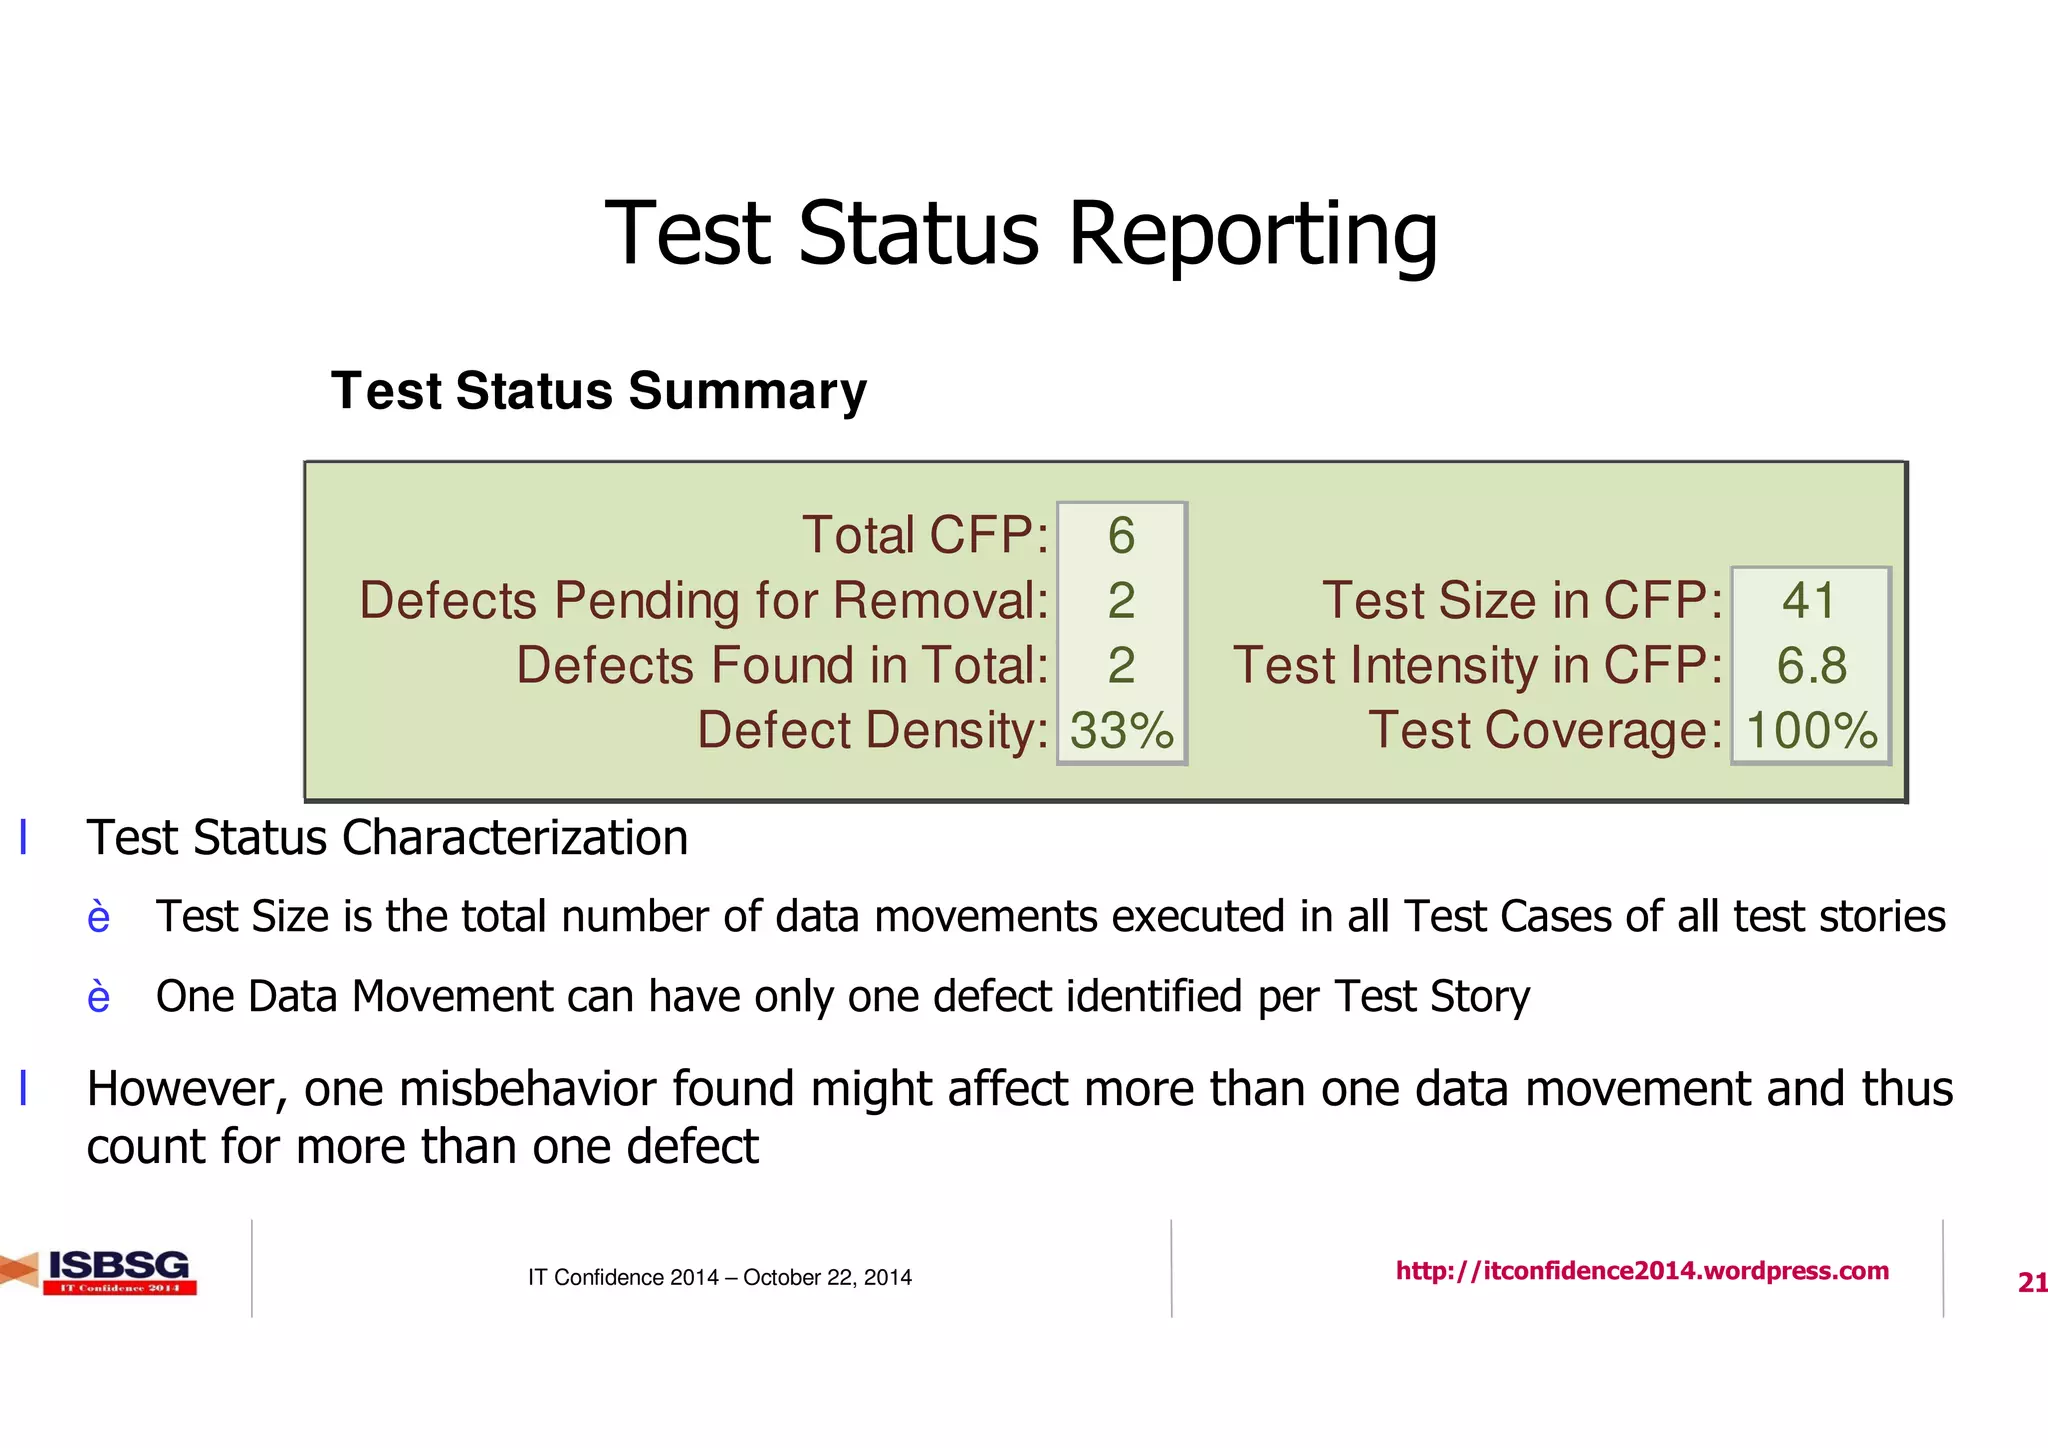
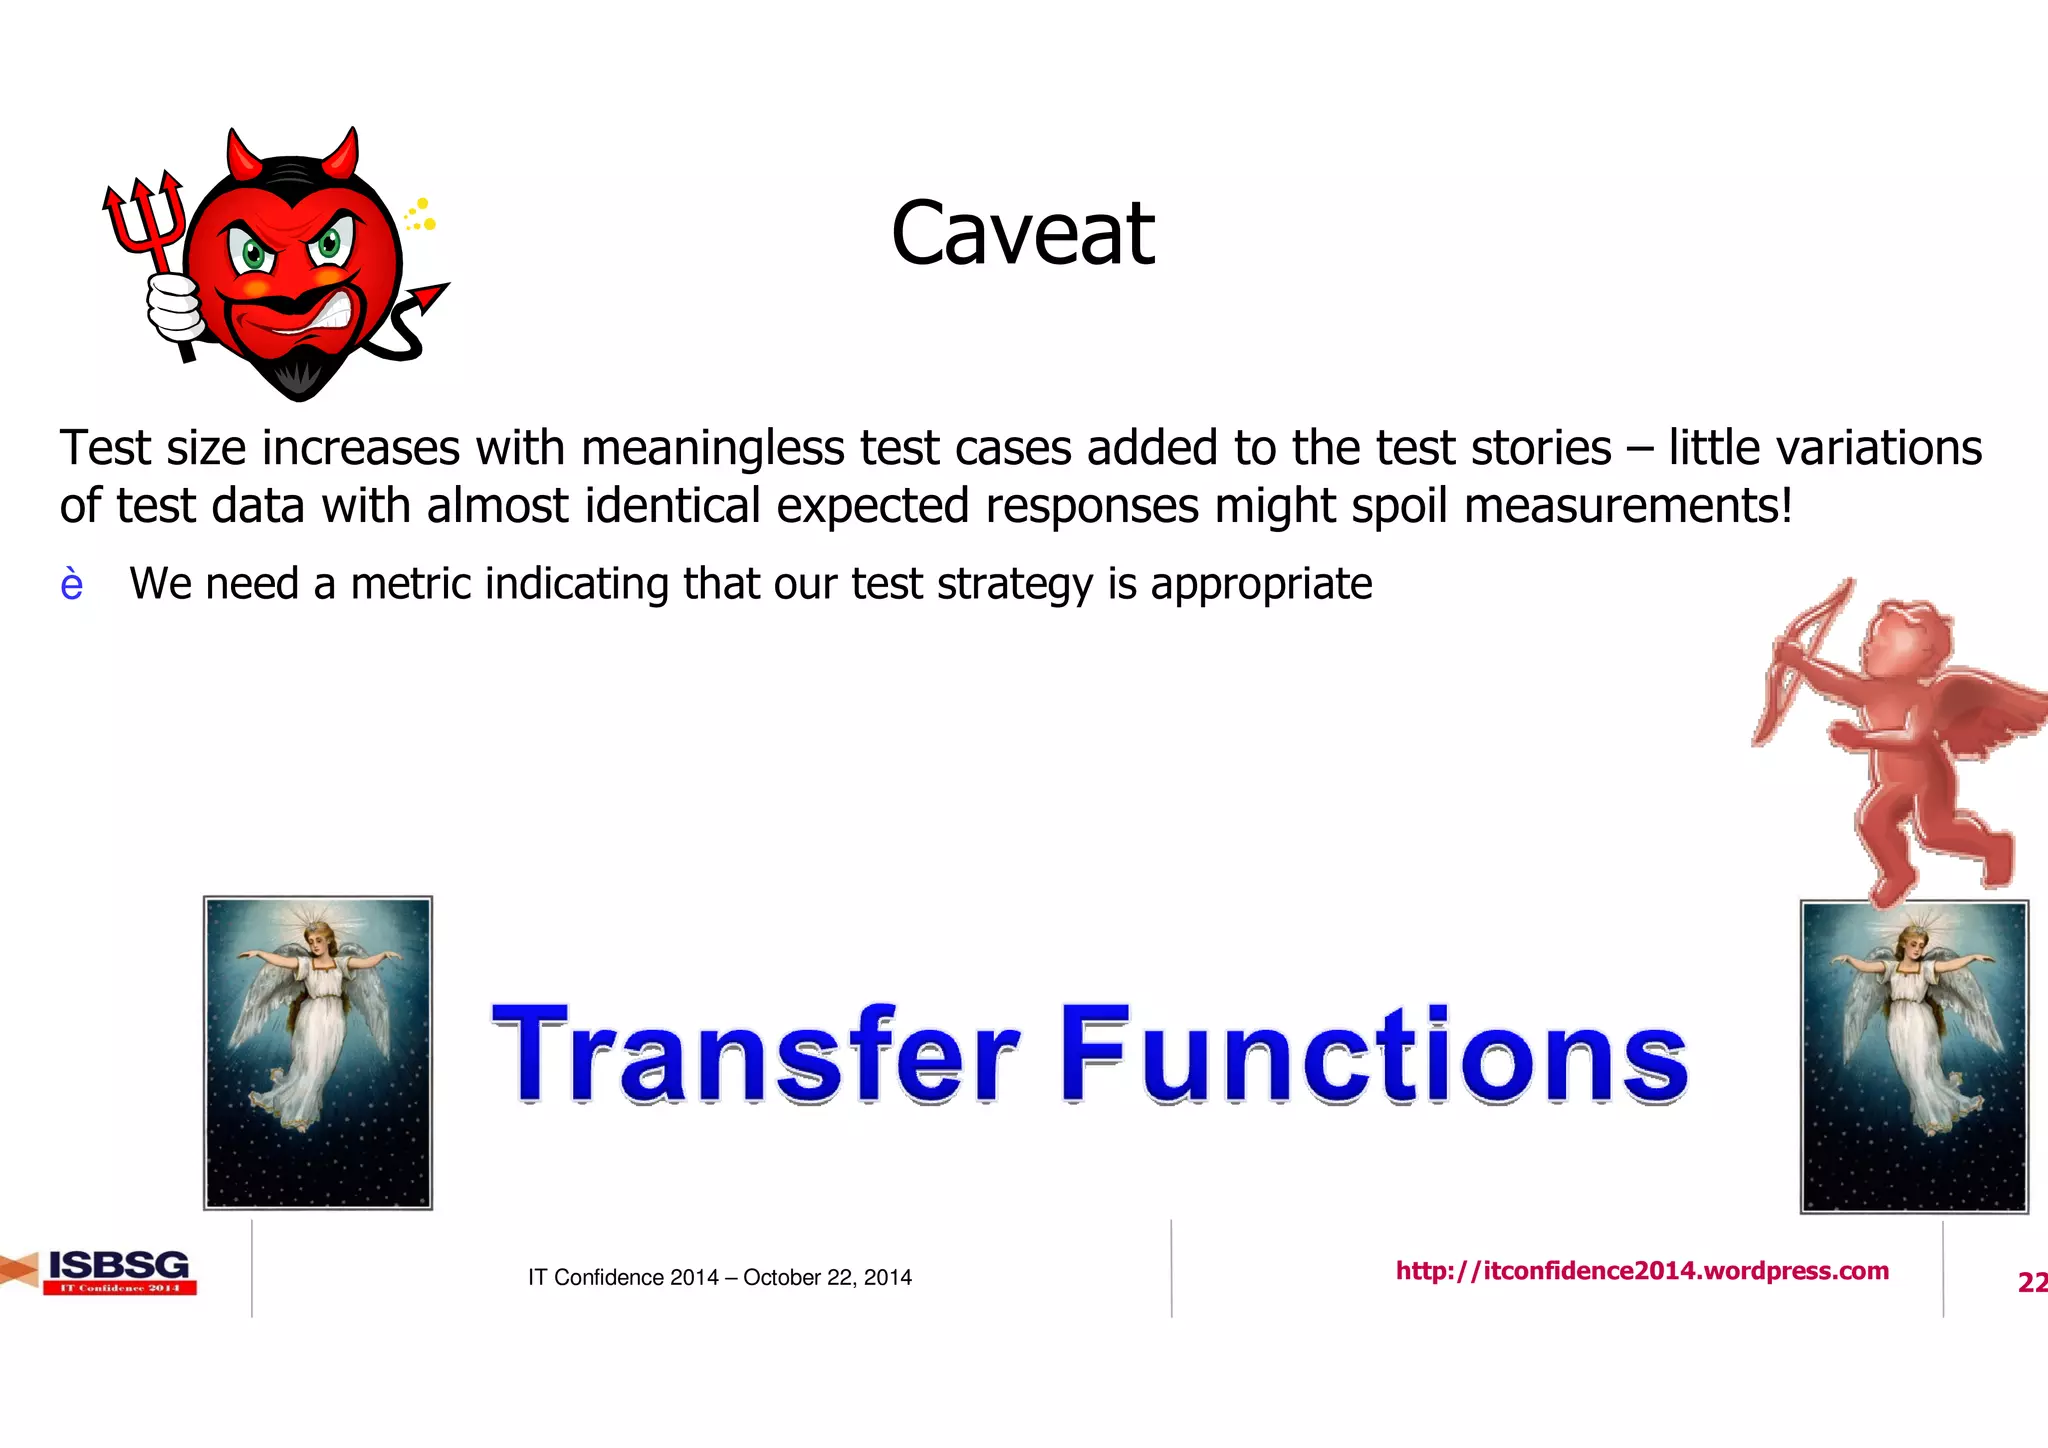
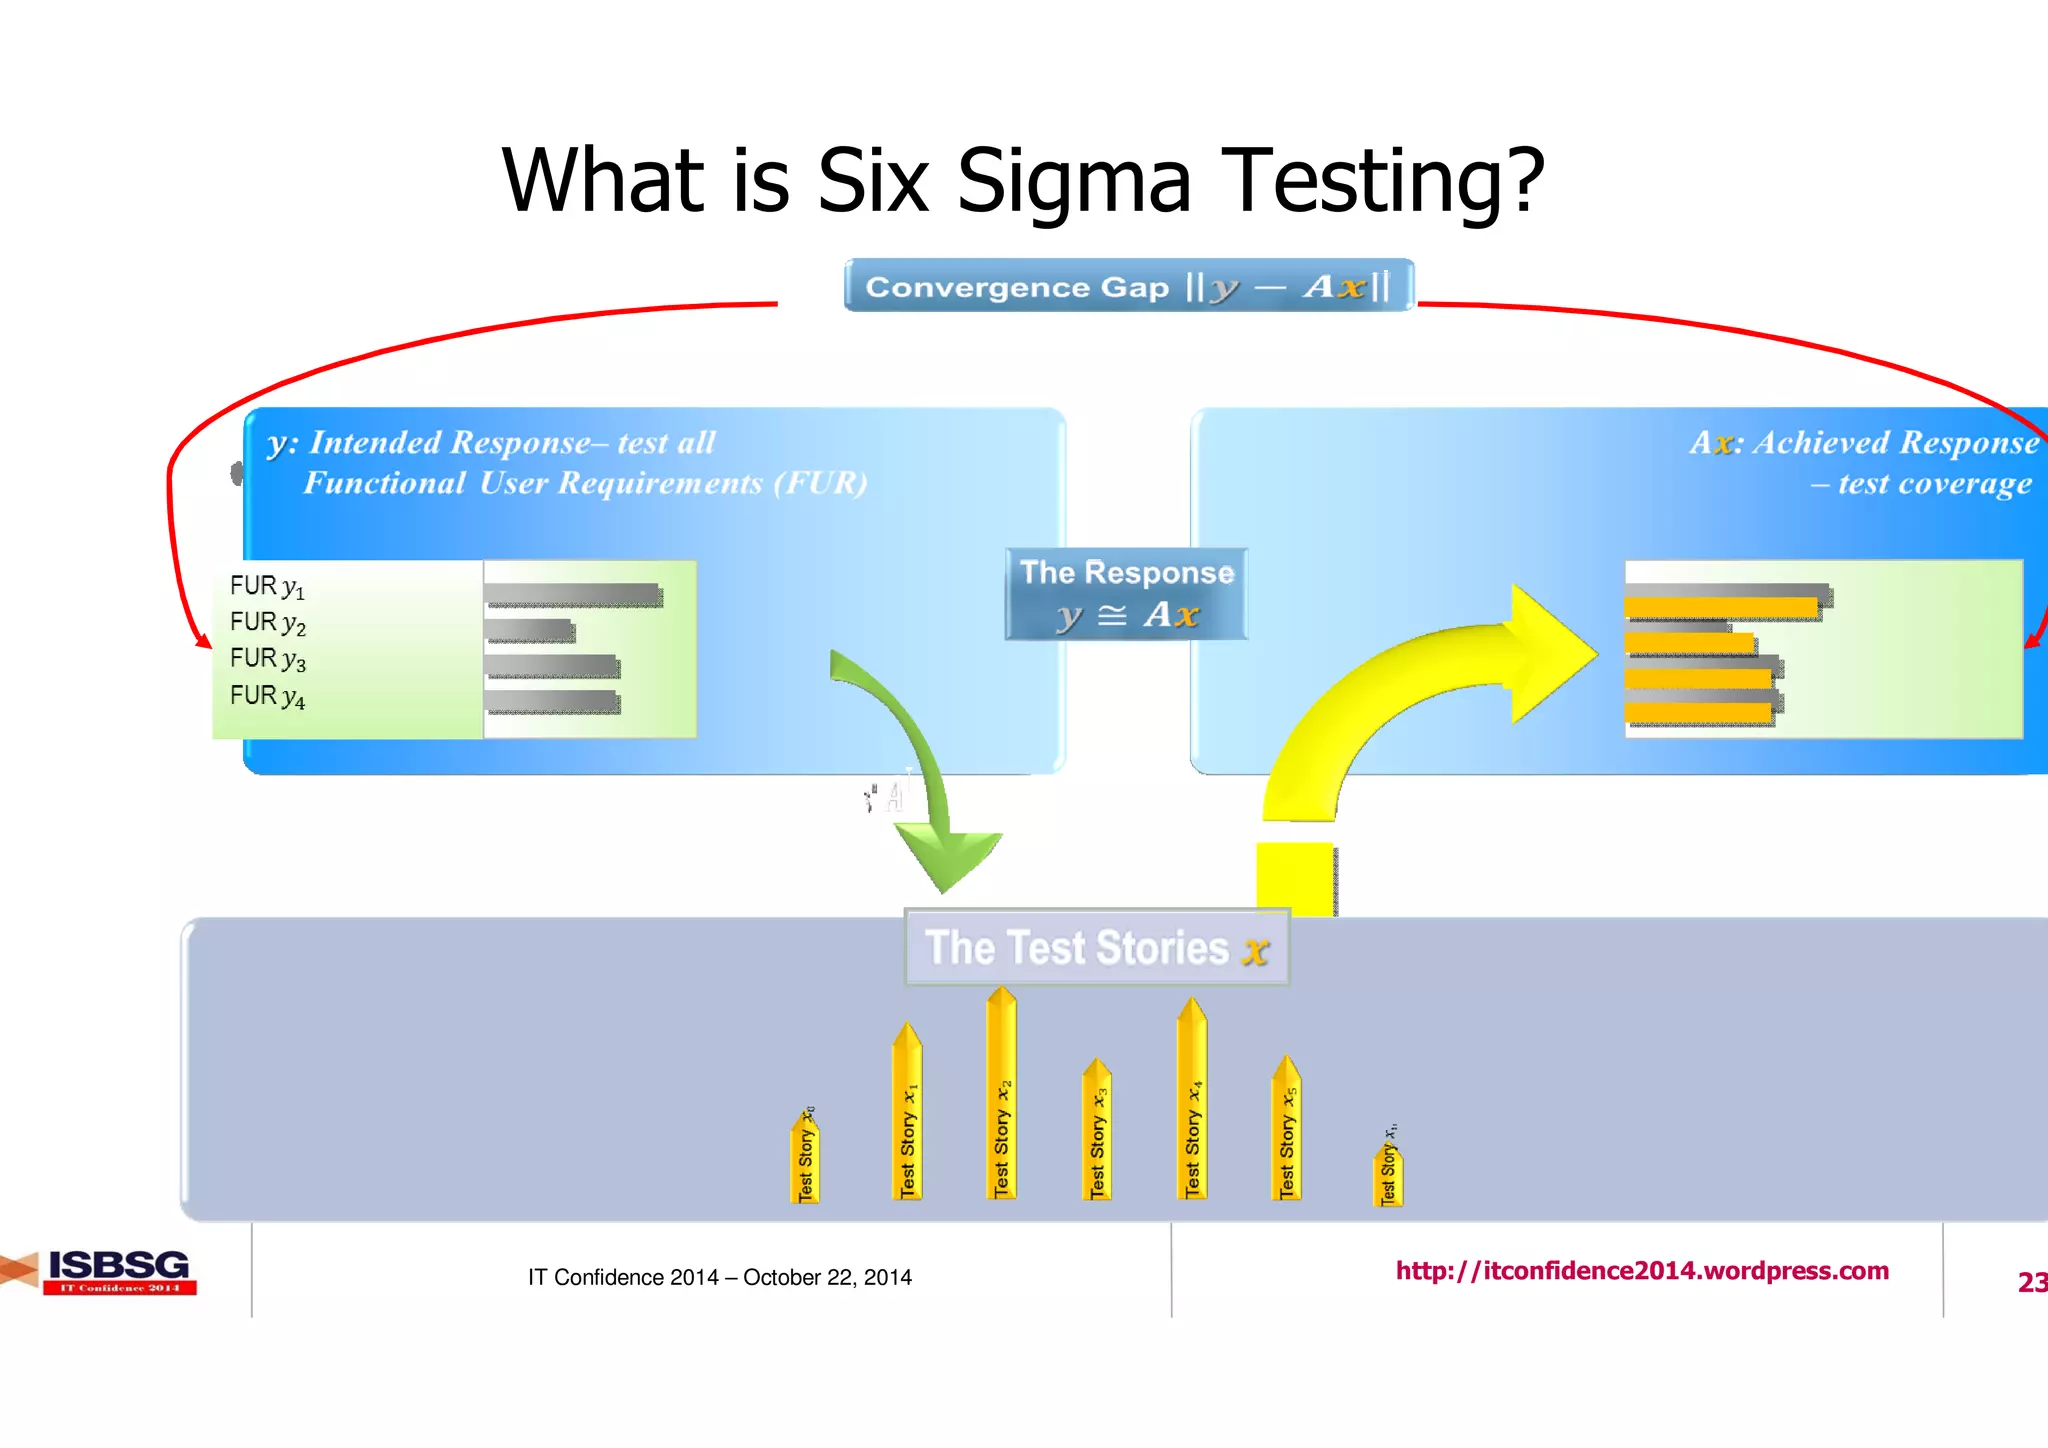
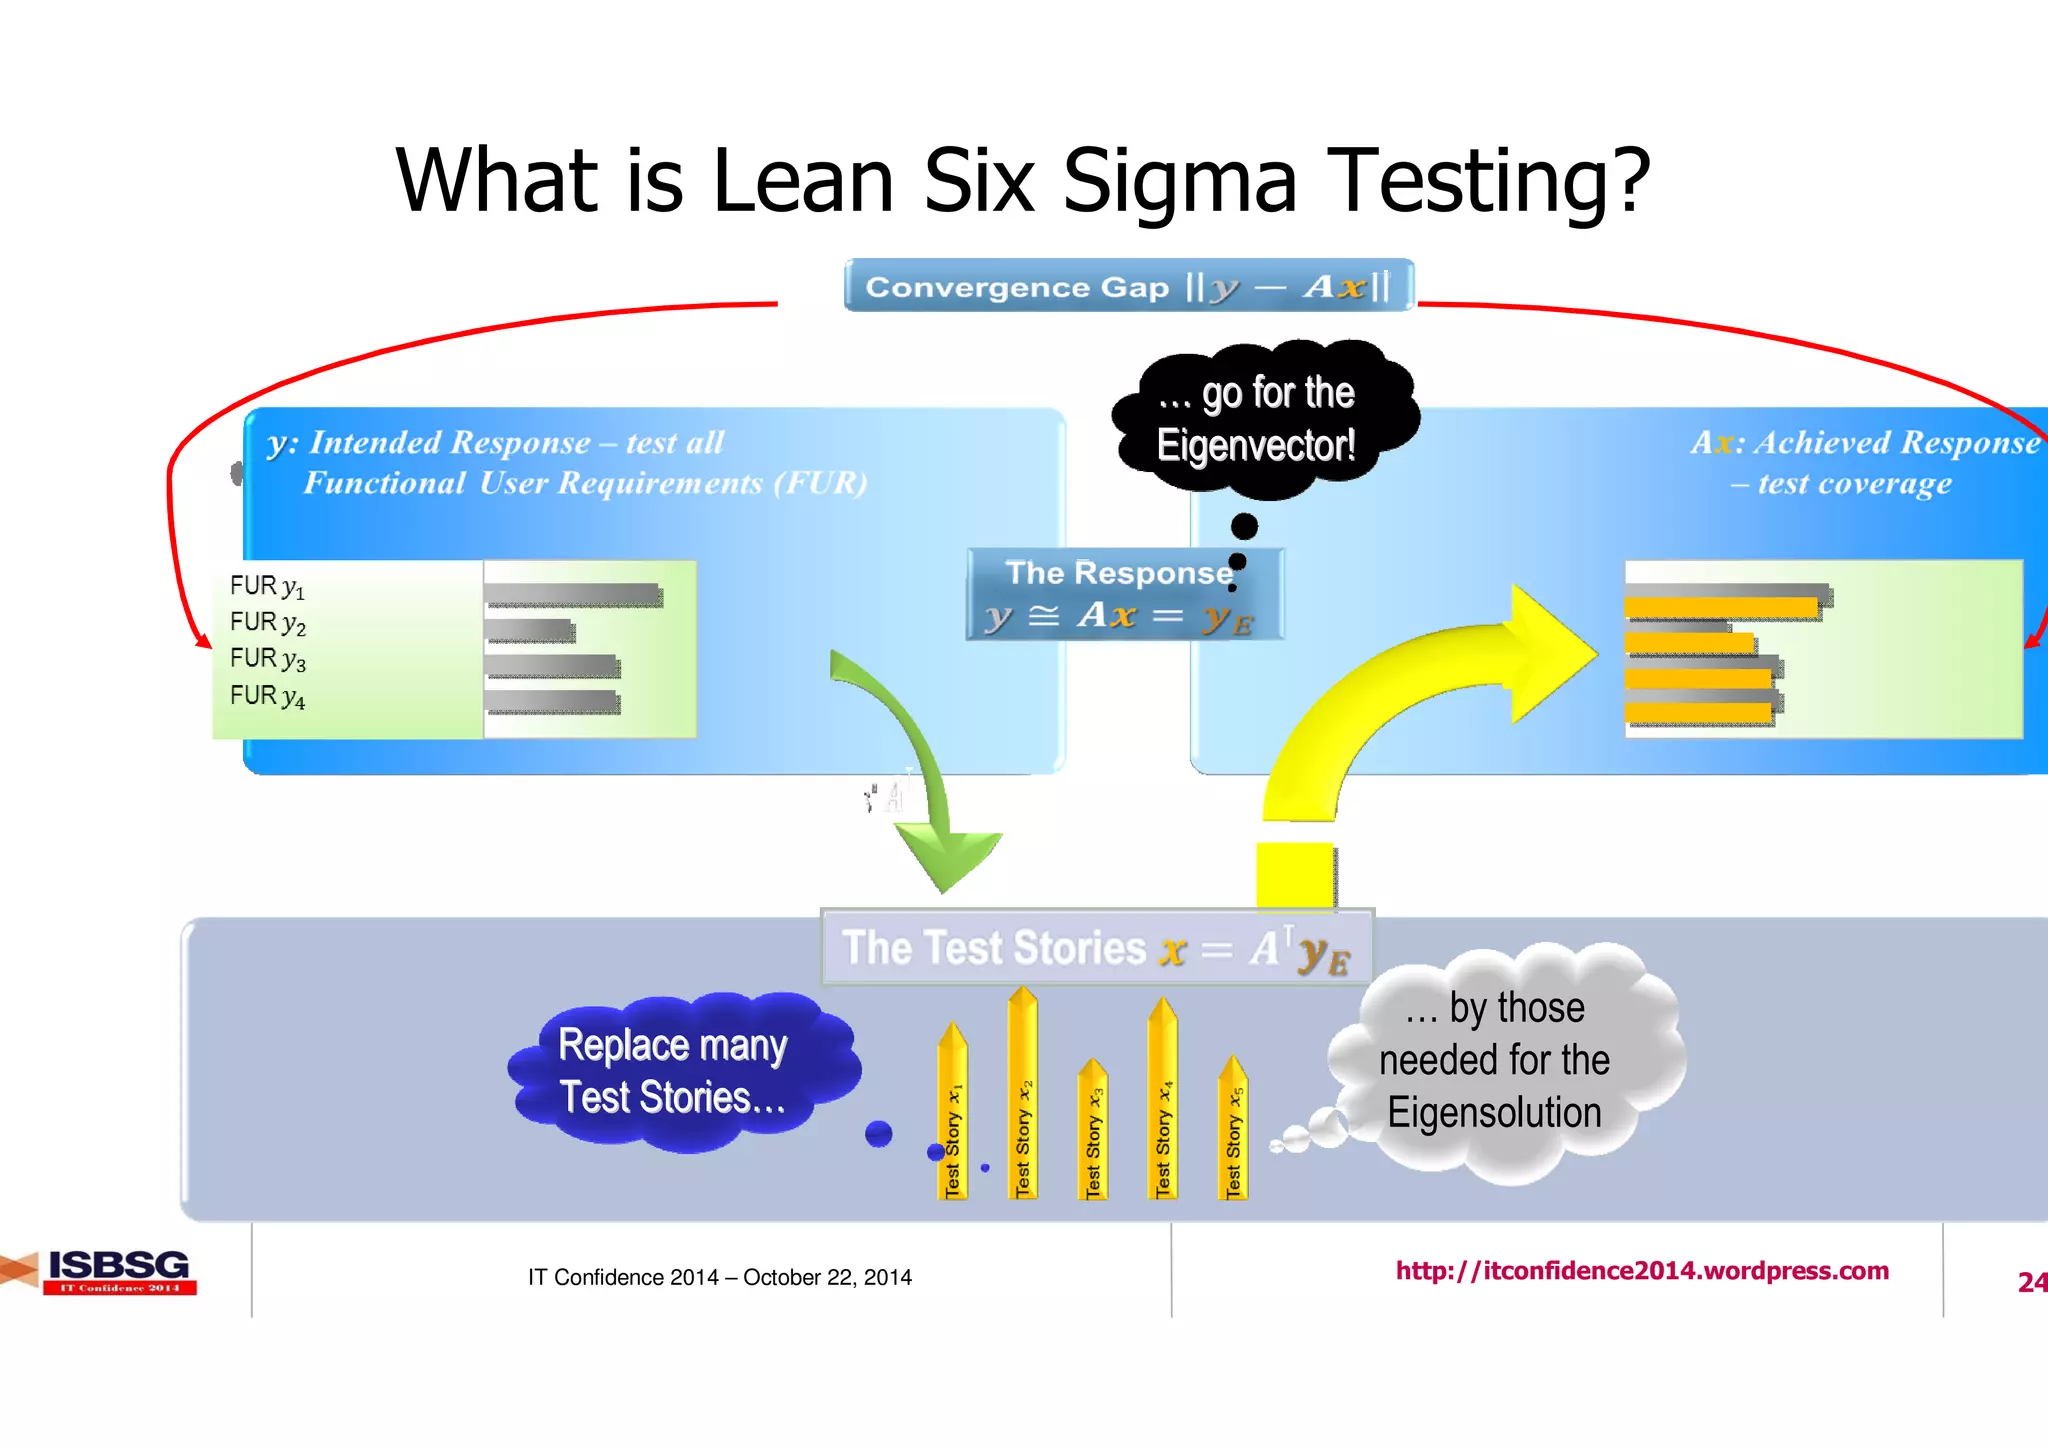
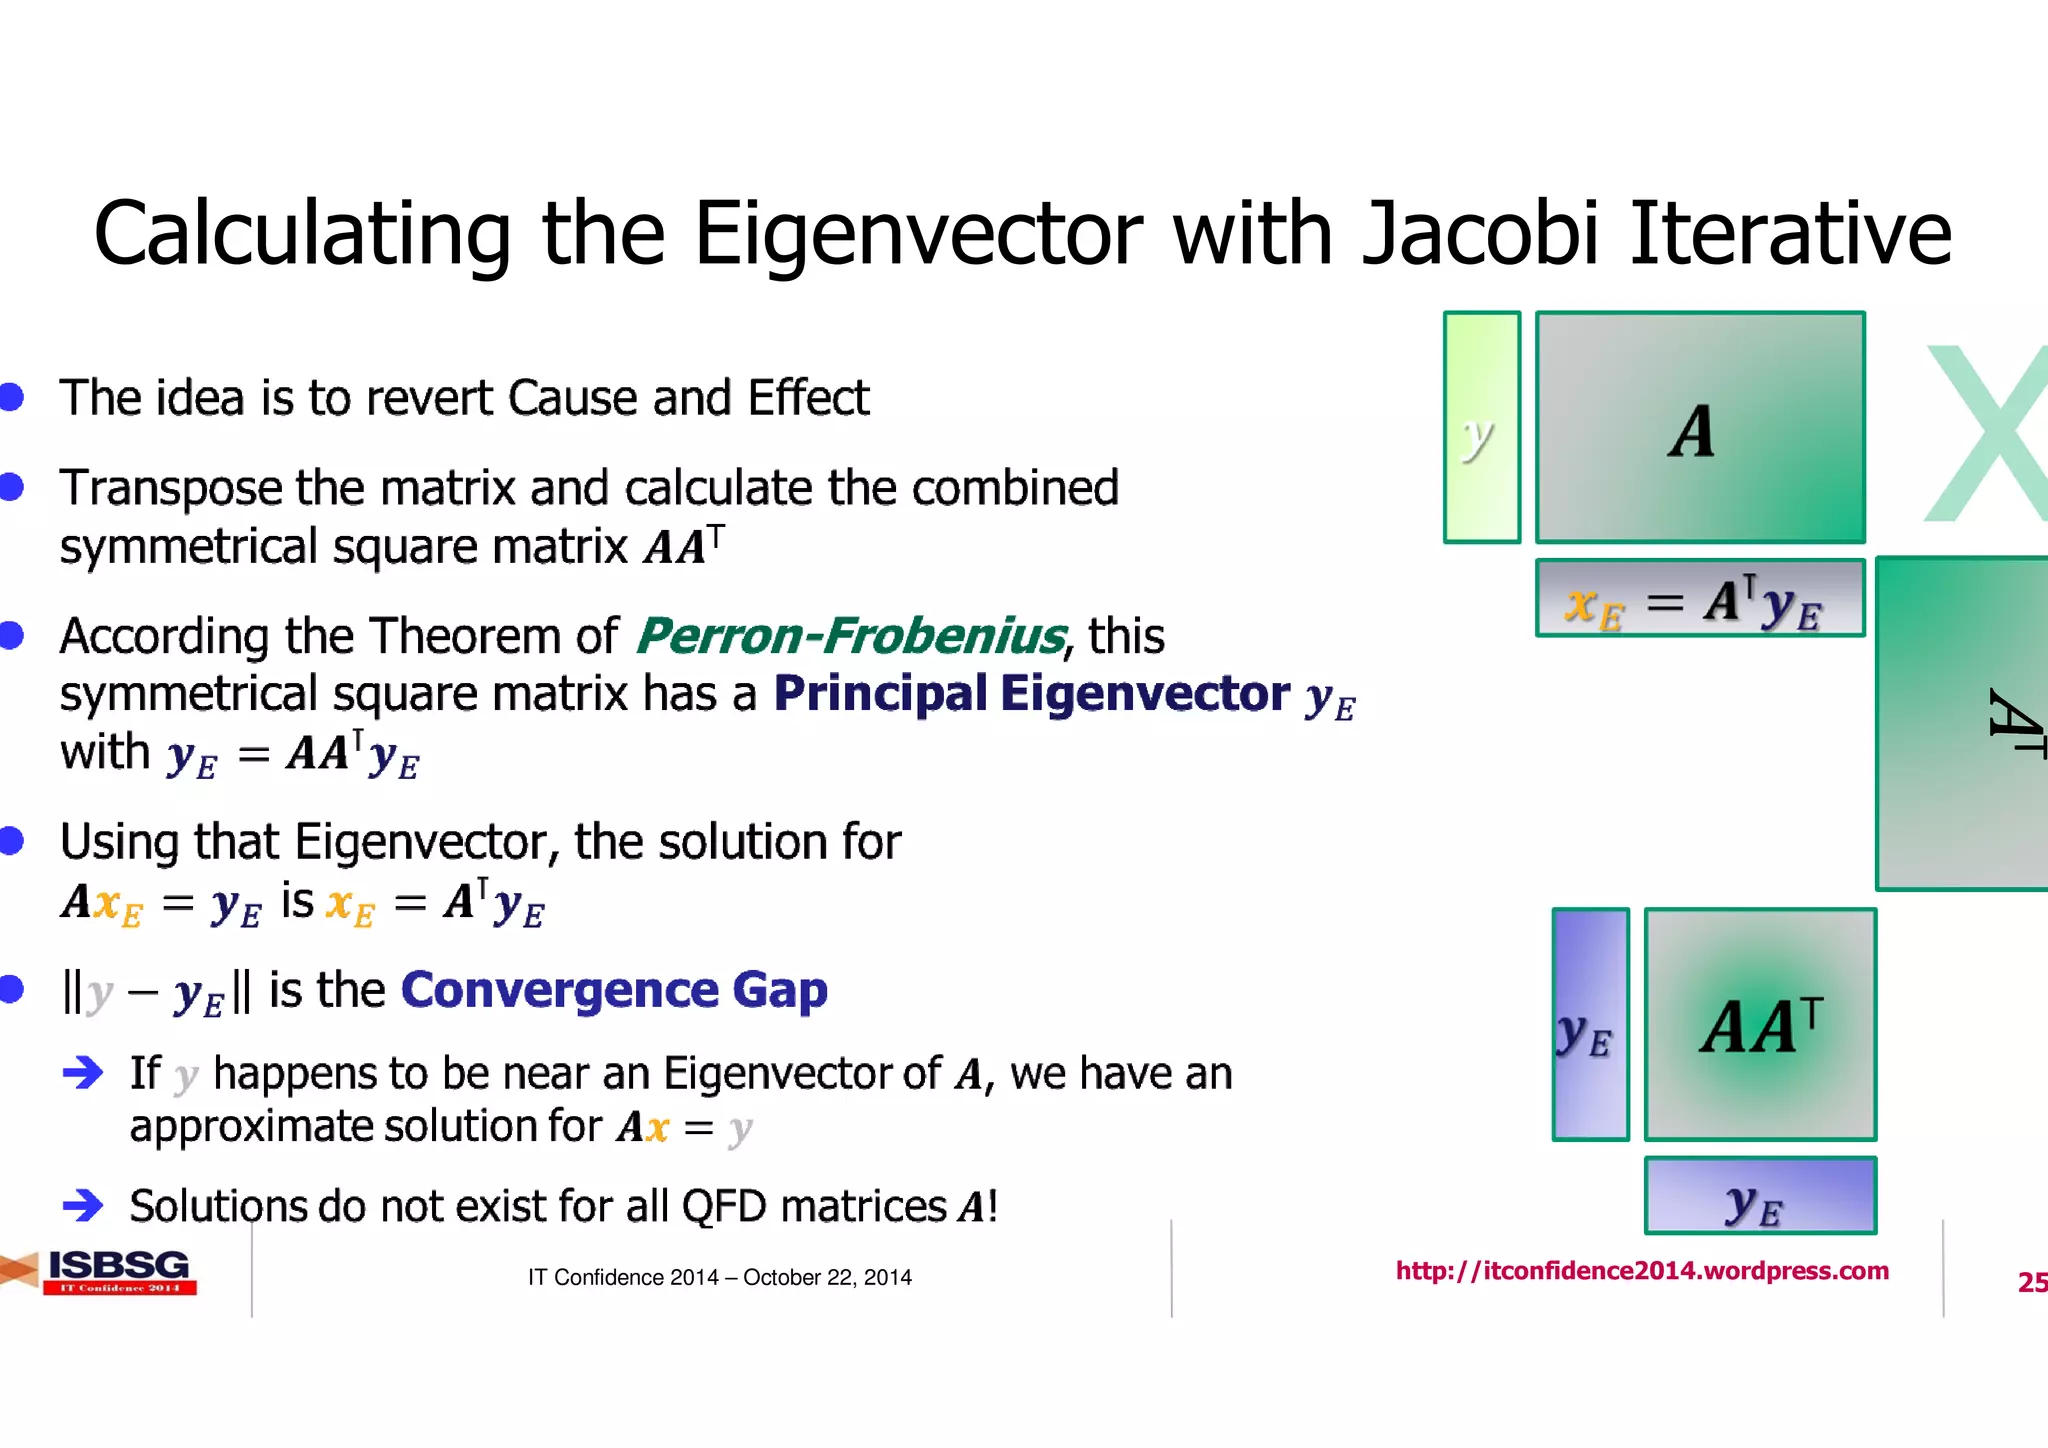
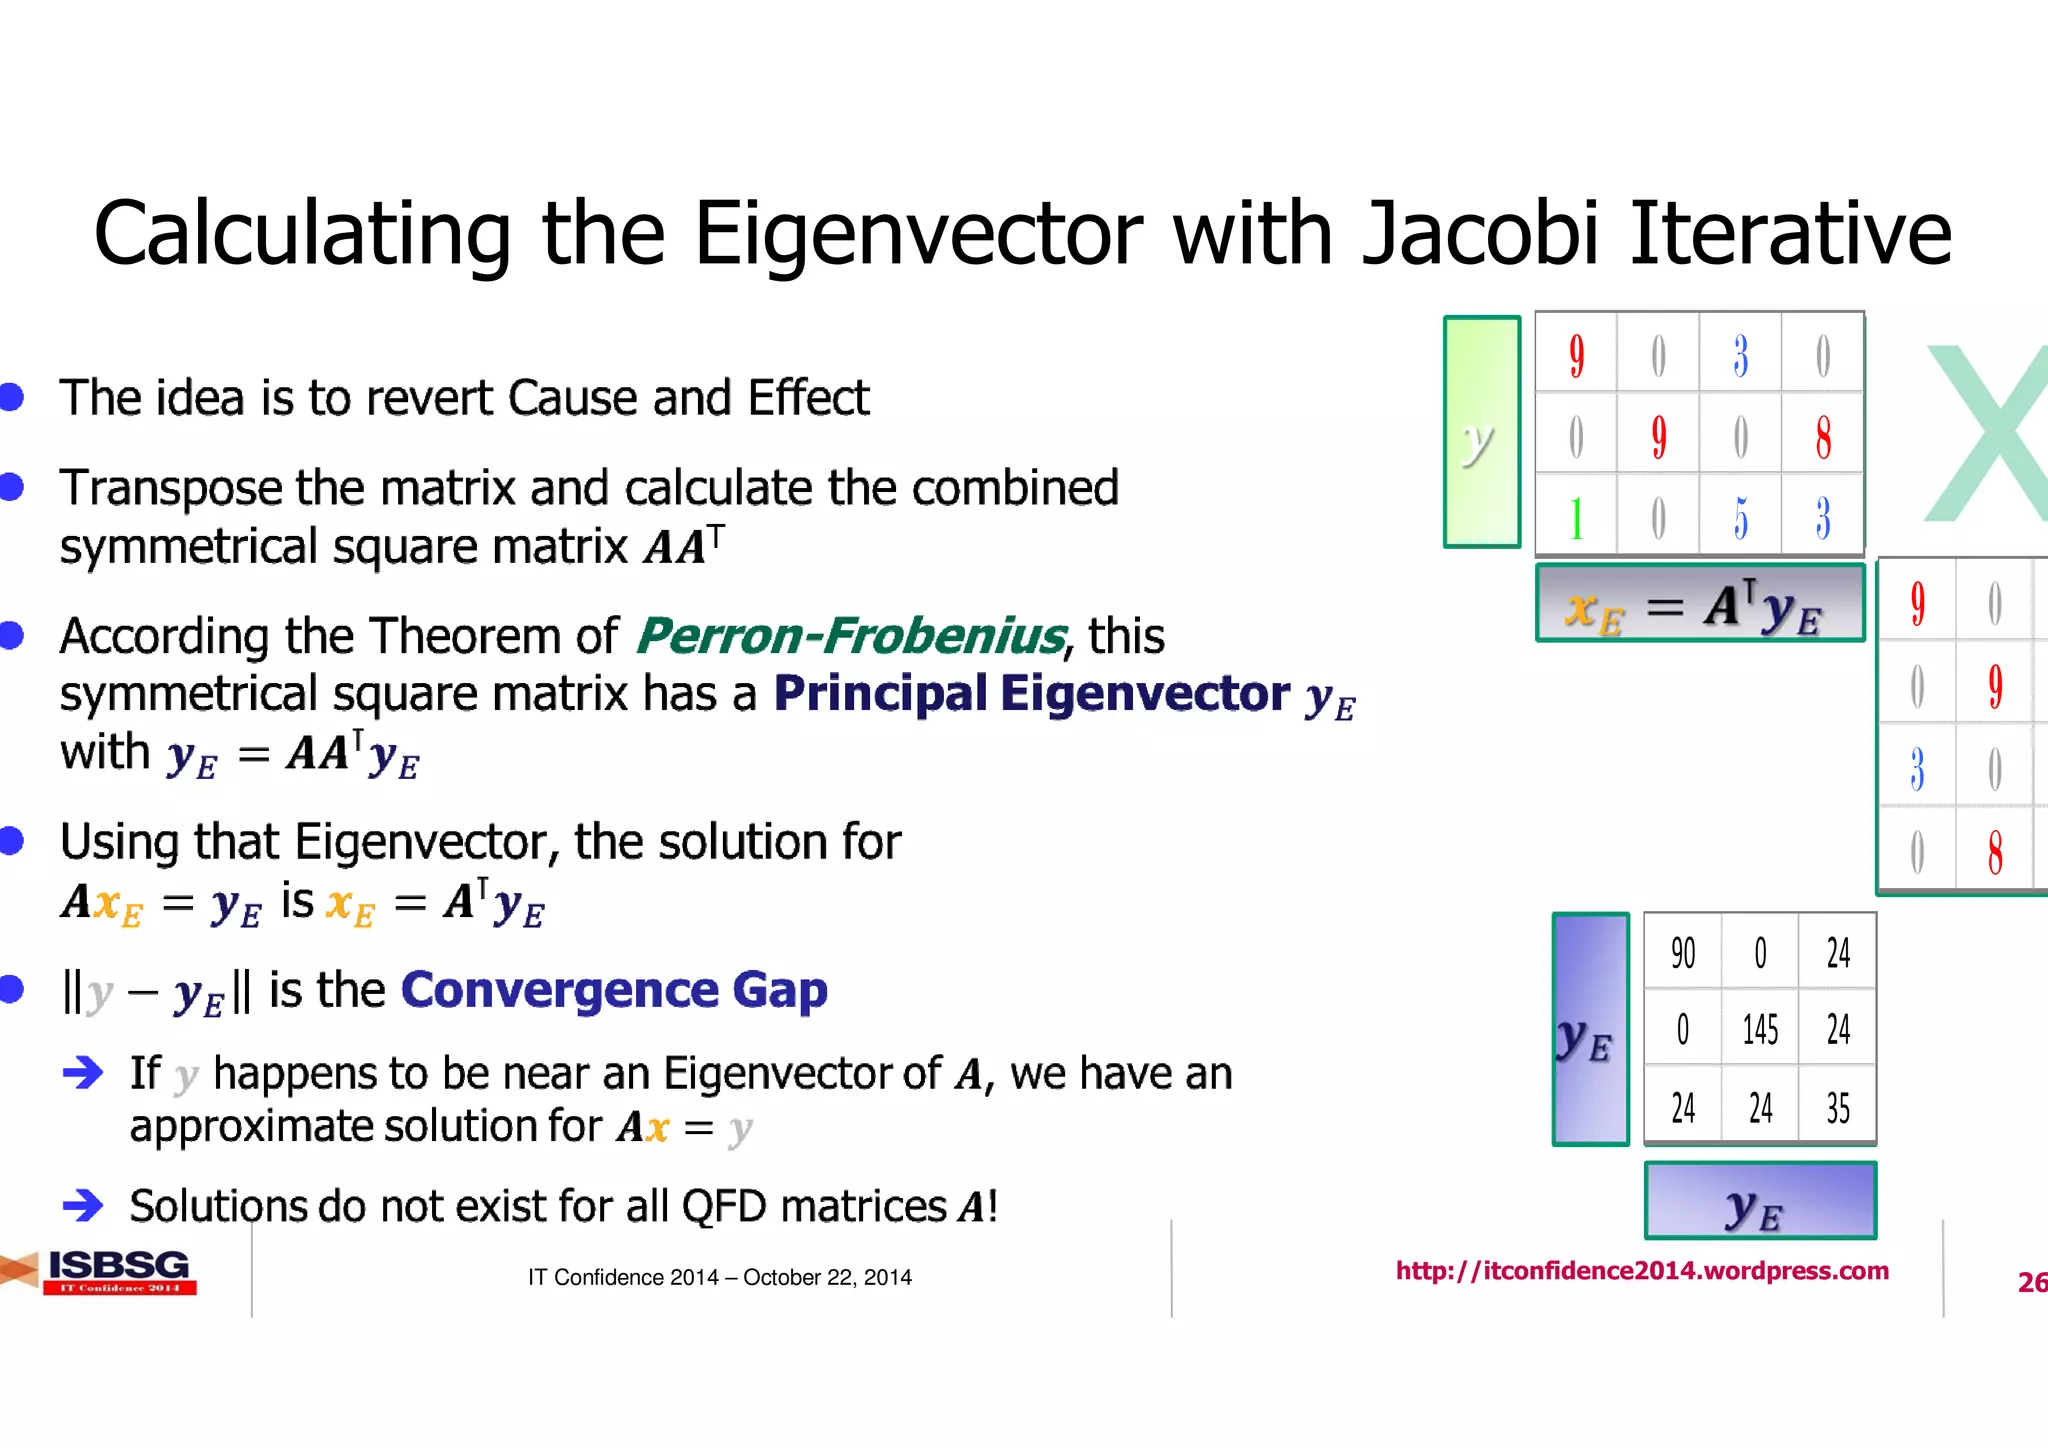
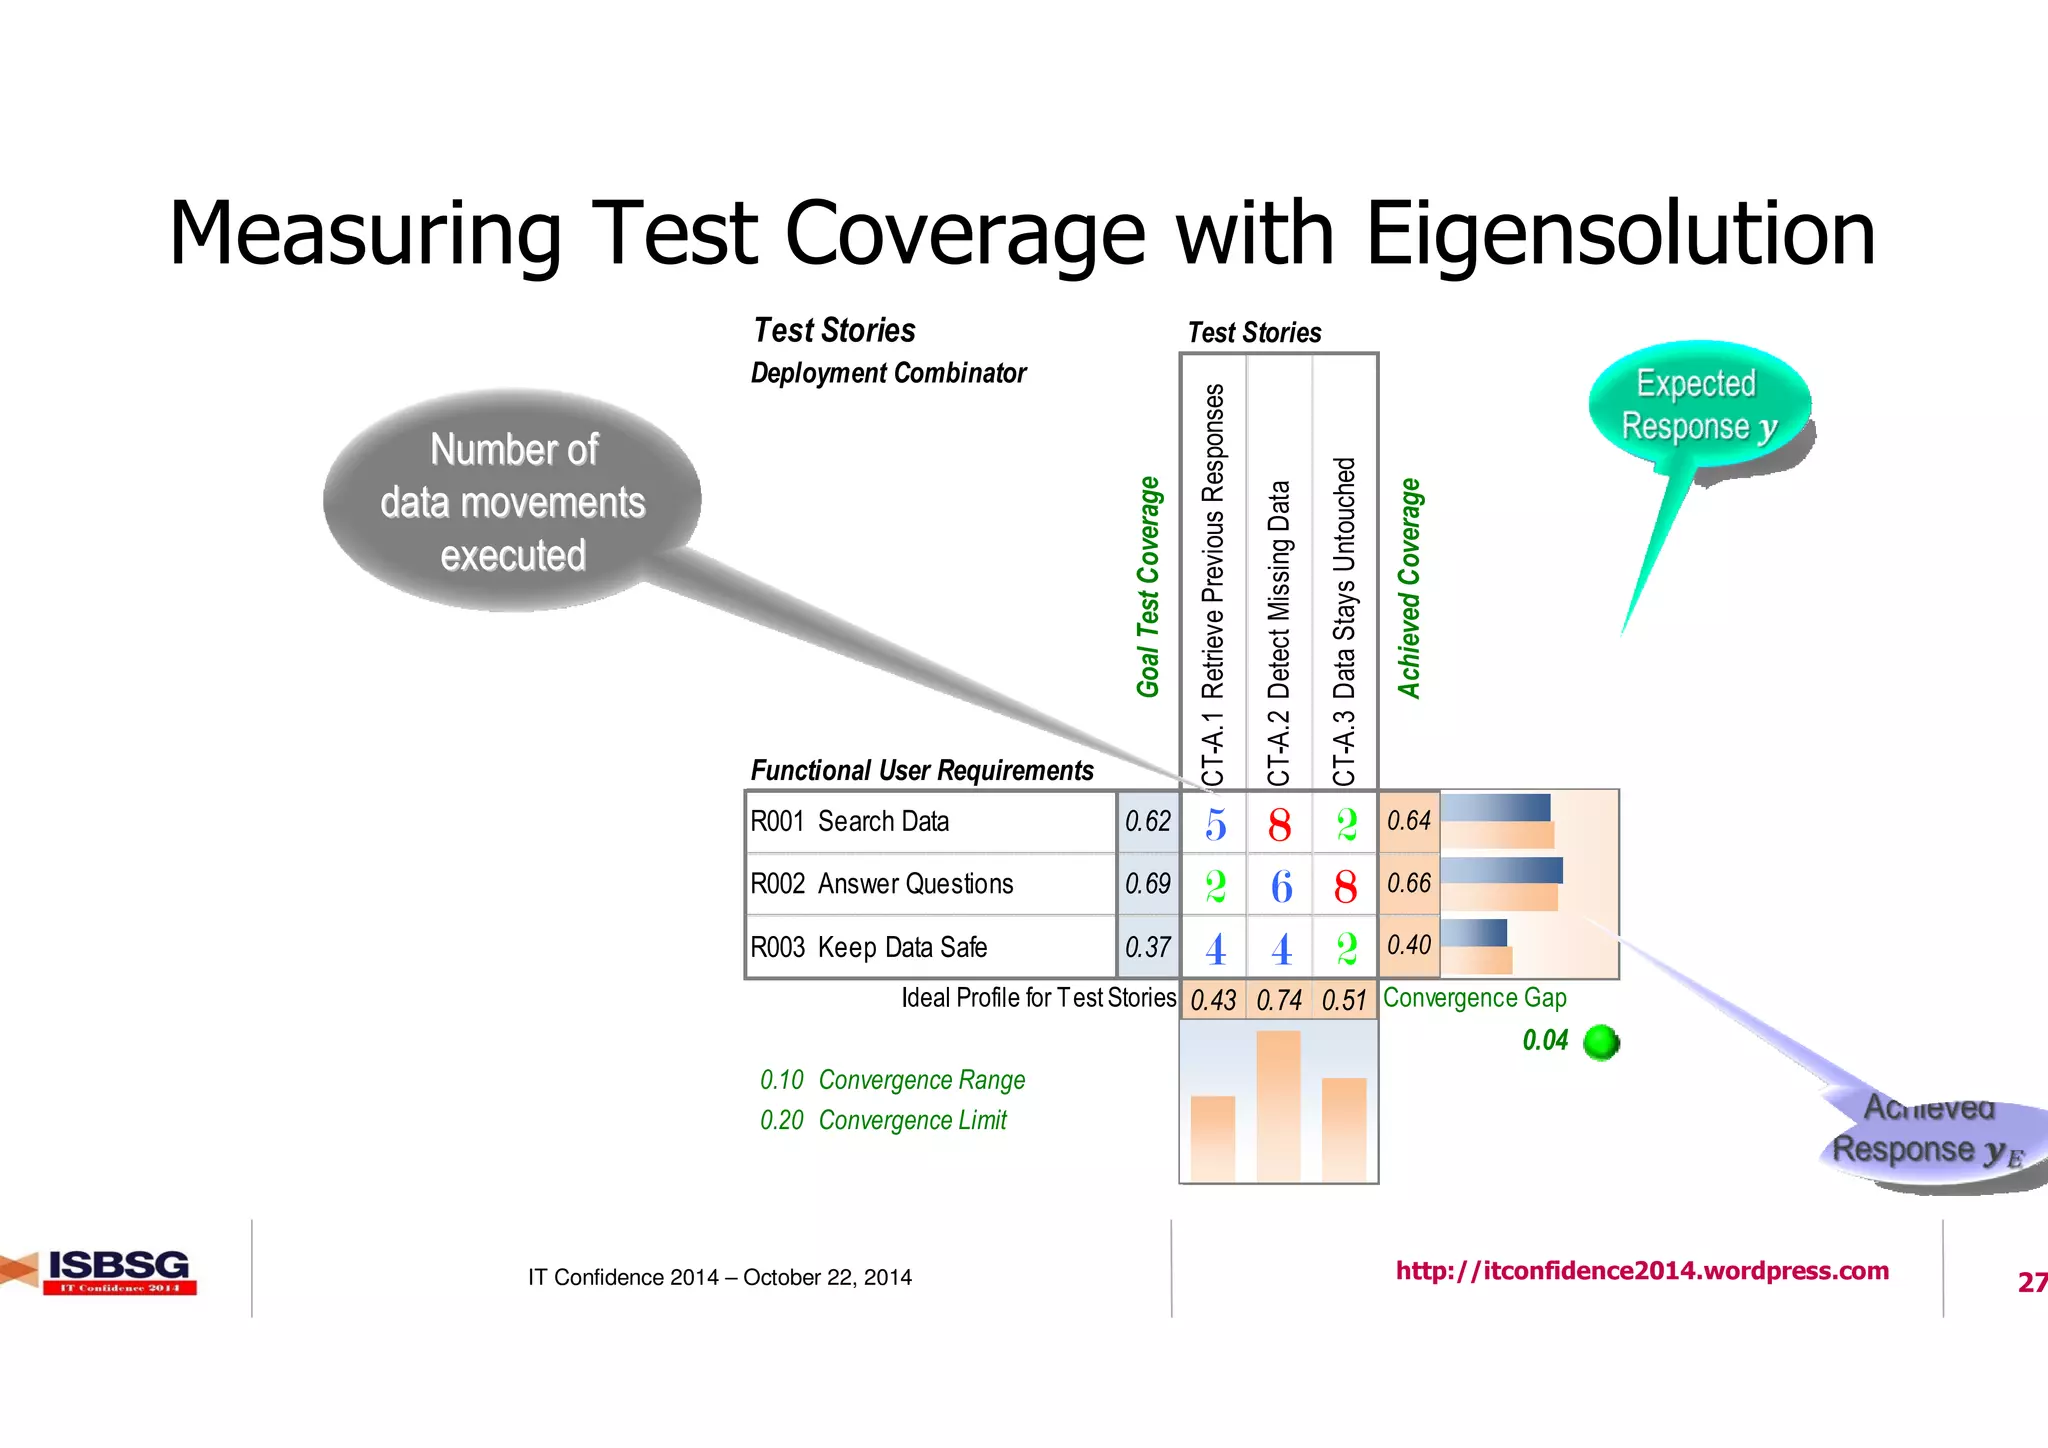
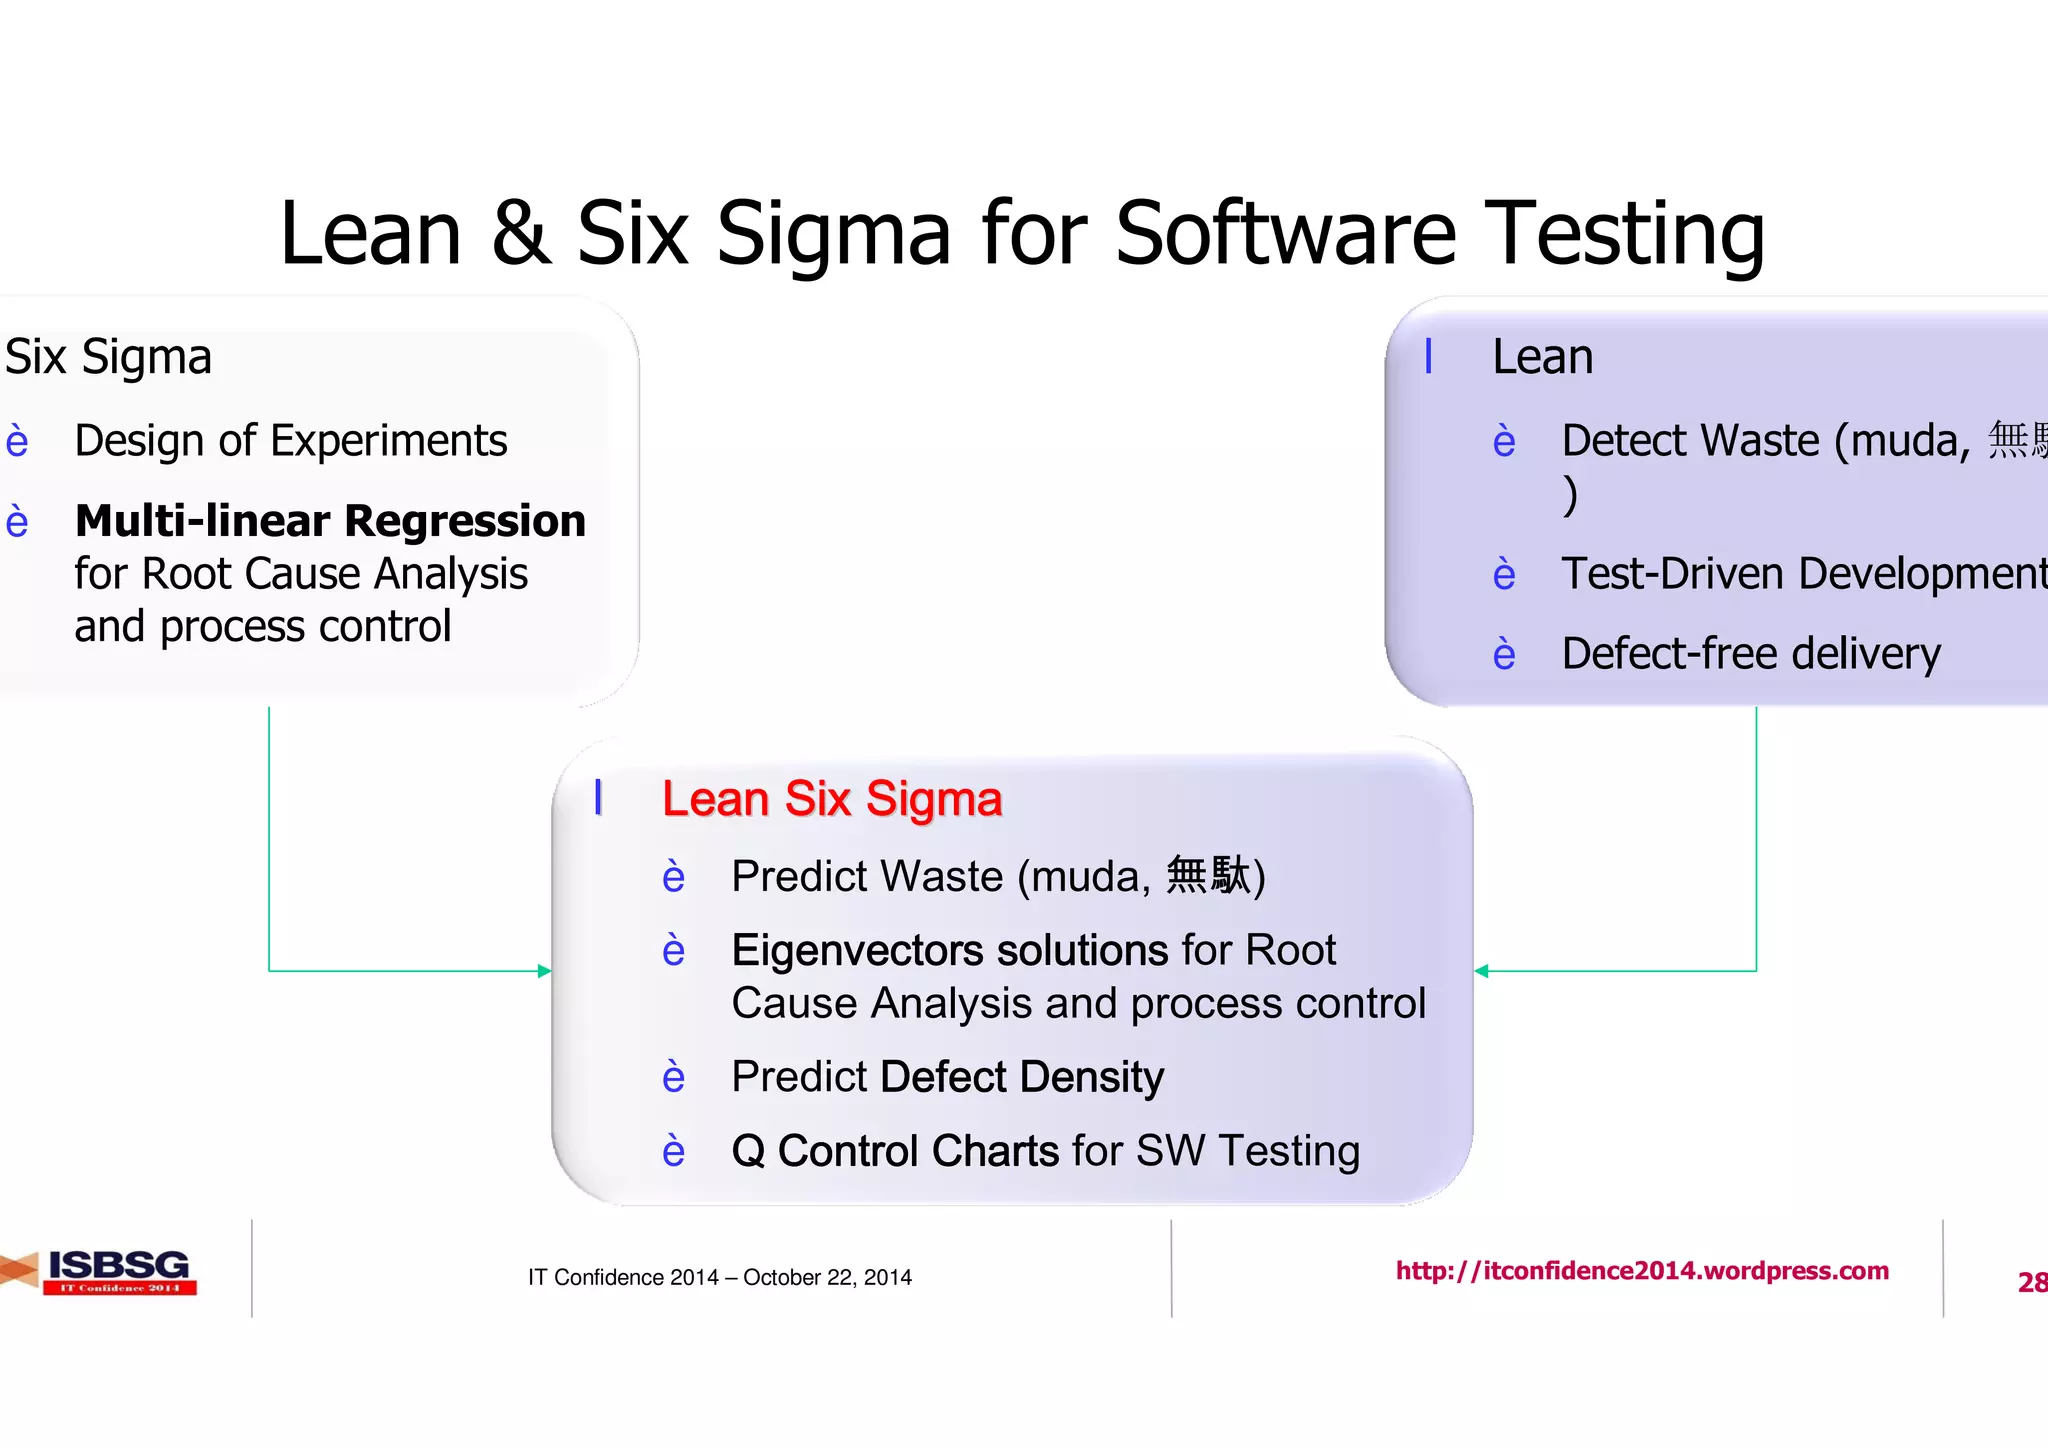

The document discusses measuring software testing using the COSMIC method, aiming to enhance understanding and benchmarking in cloud-based ICT services. It highlights various metrics, such as defect density and test coverage, while referencing ISO standards and the significance of effective defect counting practices. Additionally, it addresses the evolution of software testing methods like Six Sigma and Lean approaches to improve efficiency and quality in software development.