Downloaded 12 times

![12
Customer
Orientation
Lean
Six Sigma
Agile
Processes
Project
Estimations
Transfer
Functions
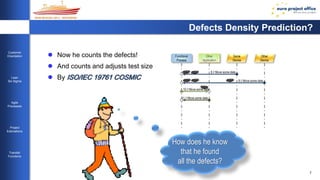
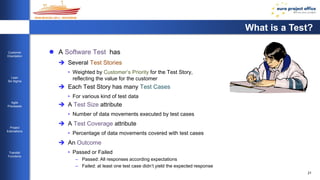
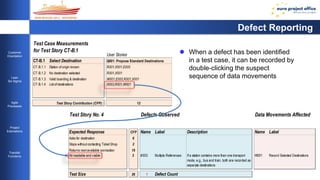
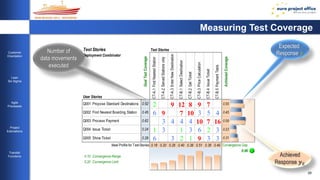
As a … [Functional User] I want to … [get something done] Such that …[quality characteristic] So that … [value or benefit]
1) Q001 Propose Standard Destinations User of public transportation be able to store my preferred
destinations
they are valid for the Ticket
Shop
I no longer have to pay fees
when catched without tickets
2) Q002 Find Nearest Boarding Station User of public transportation locate nearest station with GPS that's being served right now I immediately can see whether
it's right
3) Q003 Process Payment Provider of transportation
services
give user access to their
preferred payment options
all payments are traceable in
Ticket Shop
they can manage spending
4) Q004 Issue Ticket User of public transportation get a valid ticket with settings from Ticket Shop I no longer have to pay fees
when catched without tickets
5) Q005 Show Ticket Ticket controller see the validated ticket I can check validity period and
travel range
I don't need to go into a dispute
with a client
Functional User Requirements
Example: The Ticket Apps
Customer’s Voice:
Give me a ticket subito!
Without much ado and questions
if I simply want to go home](https://image.slidesharecdn.com/iwsm2014-defectdensitymeasurementsusingcosmicthomasfehlmann-141006233336-conversion-gate01/85/Iwsm2014-defect-density-measurements-using-cosmic-thomas-fehlmann-12-320.jpg)
![17
Customer
Orientation
Lean
Six Sigma
Agile
Processes
Project
Estimations
Transfer
Functions
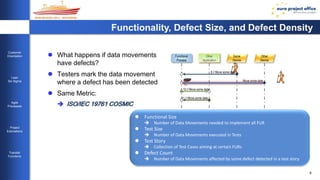
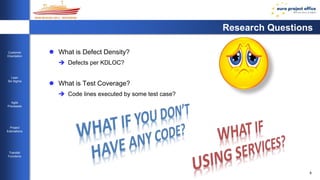
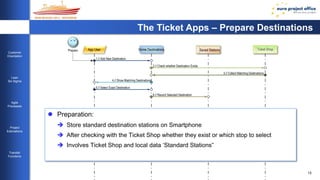
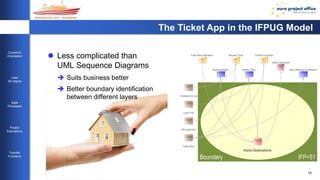
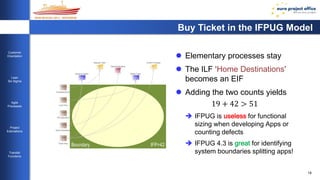
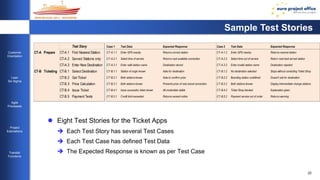
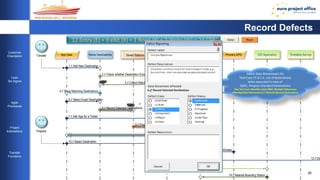
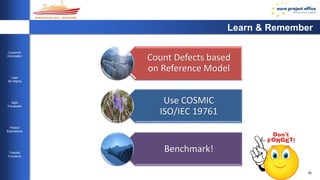
Prepare Destination in the IFPUG Model
It is not obvious what happens
Two elementary process seem
unrelated
Nevertheless, they update an ILF
[Uh, they forgot the elementary
process for deleting obsolete
home destinations!]
Show Matching Destinations
Enter New Destination
Boundary IFP=19
EI
EQ
EO
ILF
EIF
ILF
1 / 2
Home Destinations
EO
1 / 2
EI
1 / 3
EIF
2 / 12
Ticket Shop](https://image.slidesharecdn.com/iwsm2014-defectdensitymeasurementsusingcosmicthomasfehlmann-141006233336-conversion-gate01/85/Iwsm2014-defect-density-measurements-using-cosmic-thomas-fehlmann-17-320.jpg)
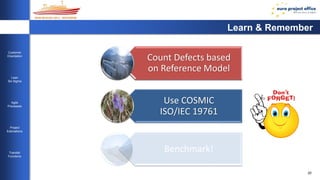
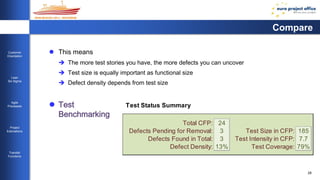
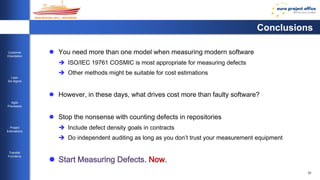

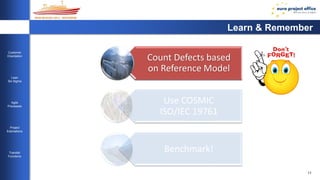
This document discusses measuring defect density in software projects using the COSMIC functional size measurement method. It proposes: 1) Counting the number of defects found based on the number of affected data movements, as defined by the COSMIC model, rather than just defect repository entries. 2) Adjusting the test size measurement to match the number of data movements executed in tests. 3) This allows defect density to be calculated more precisely and supports benchmarking across projects.