This presentation will discuss the employment and job market for Canada. The following are the areas of focus:
1. Manufacturing
2. Natural Resources
3. Retail and Wholesale Trade
4. Government jobs
5. Economic Growth
6. Infrastructure Spending
7. Social program spending
8. Power Generation
9. Economic Stimulus
10. Capital Investment
This presentation will discuss Canada Labour Market Trends for July 2016. The presentation will look at wages, job openings, job creation, job losses and key government policies,
Caution: The presentation also provides details by month. It is important to look at the overall trends and not just one month.
Summary
Employment by Sector
Job Creation Target for 2016
BM Analysis/Comments Employment
BMO/Urbanized areas employment
Key Quotes/Bloomberg
Labour Rates
The local employment market entered its third consecutive month of improving conditions with the unemployment rate declining 50 basis points to 5.9 percent.
"Record rise in starting salaries as permanent (and contract) candidate availability plummets....unlikely to be resolved until employers recognise that, for staff, remuneration is about much more than take home pay.”
For new ideas on attracting candidates please email sjagger@rethink-recruitment.com and I'll be happy to help.
December report on Permanent and temporary jobs - Permanent placements rise a...Steven Jagger
December report on Permanent and temporary jobs - Permanent placements rise at faster rate again! Average starting salaries awarded to people placed in permanent jobs continued to rise with the availability of staff to fill permanent job roles continued to fall in December.
The unemployment rate in South Africa increased in Q1:2017 to 27,7%, the highest rate since September 2003. The growth in employment by 144 000, was offset by the growth in the number of job-seekers by 433 000 driving the unemployment rate to 27,7% in the first quarter of 2017.
Britain at a crossroads: Shaping the nation’s post-Brexit labour marketResolutionFoundation
The Resolution Foundation and the CBI jointly hosted a half-day conference in Westminster with leading employers, economists and policy makers to discuss the big labour market issues facing Britain and how to shape its post-Brexit future. These are the various Resolution Foundation presentations.
Employment increased by 23,000 jobs so the expanding labor force only increased the overall unemployment rate by 30 basis points to 6.3 percent. This is the second consecutive month when unemployment increased.
Minneapolis–St. Employment Update | December 2015Carolyn Bates
The local unemployment rate of 2.9% has hit its lowest point since 2001. Coupled with year-over-year labor force growth of 34.2 thousand jobs, Minneapolis-St. Paul currently has one of the strongest economies of any major metro in the United States.
As is typically the case, MSP’s office-using sectors dominated hiring by taking 48.0 percent of the 12-month total employment growth, while the industrial sectors experienced a loss of 1.8 percent.
At the national level, monthly growth of 211,000 jobs over the course of November represented the second consecutive month of rebound after a slowdown in mid-2015. At the current rate of growth, a mid-to-late-2016 timeframe seems likely for the first stage of tightening.
After increasing in July, the local labor market contracted by 2,000 workers in August. Along with that employment held flat, still near a historic high. As a result, unemployment edged down 40 basis points to 3.3 percent.
February 2016 U.S. employment update and outlook JLL
The labor market recorded a soft opening to 2016, adding only 151,000 new jobs, although unemployment fell below 5.0 percent for the first time since 2008.
July saw the labor market add 157,000 net new jobs, slower than growth in recent months but still positive and healthy overall. A 13,000-job contraction in government employment, combined with a 5,000 financial activities jobs lost in net terms, were partially responsible for this slowdown. At the same time, sustained talent shortages across markets continue to keep growth more volatile than normal.
Northern Ireland Labour Market Slide Pack - December 2013Richard Ramsey
A PowerPoint slide pack highlighting Northern Ireland's labour market trends is attached for your information. It follows last week's Quarterly Employment Survey which revealed that Northern Ireland posted its 7th successive quarterly rise in employment with all sectors of the economy recording positive growth. It is noted that Northern Ireland has now recouped over one-quarter of the jobs lost during the downturn. Furthermore, last week it was also revealed that NI's unemployment register, or claimant count, fell for the 10th consecutive month in November. The slide pack includes NI v UK employment performance by sector and analysis of full-time & part-time employment trends. The table of contents and a few pertinent charts are also highlighted below.
Minneapolis–St. Paul Employment Update | October 2016Carolyn Bates
Minneapolis-St. Paul has the fifth-lowest unemployment rate in the nation among all large metros, according to the most recent BLS estimates.
Once again, MSP achieved record-breaking employment totals for professional and business services, a fundamental component to the metro’s economic growth. A net total of 8,300 jobs have been added in the industry year-over-year (Y-O-Y).
While office-using sectors were responsible for 31% of growth this month, educational and health services continue to drive regional employment gains and currently account for 39% of Y-O-Y job growth.
Nationwide, unemployment rose by 10bp to 5.0% in September on the back of rising labor force participation, which also saw a bump to 62.9%. At the same time, initial unemployment claims continue to fall, with the moving average resting near a cyclical low of 250,000 per week.
U.S. job openings have jumped by 3.9% over the year even as employment is only up 1.7%. This signals strong demand by employers but lagging labor force growth that is failing to keep up with demand.
November 2016 U.S. employment update and outlookJLL
October's 161,000 net new jobs missed expectations, but unemployment still dropped to 4.9 percent, as signs point to a potential interest rate hike in December.
U.S. employment update and outlook: January 2015 JLL
December recorded yet another strong month of employment growth. 252,000 net new jobs were added to the national economy, and unemployment dropped by an additional 20 basis points to 5.6 percent.
As a result, roughly 3.0 million jobs have been created over the course of 2014, and we expect this momentum to increase as we start off 2015.
See more economic, office and real estate research at http://bit.ly/1x52B8B
Minneapolis–St. Employment Update | May 2016Carolyn Bates
The Minneapolis-St. Paul metro’s unemployment rate ticked up slightly to 4.0% from 3.9% while the total labor force shrunk by nearly 3,000 jobs, according to the most recent estimates available from the BLS.
Educational and health services were responsible for the largest share of Minneapolis-St. Paul’s 12-month employment growth, adding 11.3 thousand jobs. Continuing the trend of recent months, industrial sectors once again outperformed office sectors, contributing 25.4% of total growth compared to office’s contribution of 23.4%.
At the national level, employment growth slowed sharply in April to 160,000 net new jobs, the lowest figure since early 2015. Slow job growth mirrored underwhelming GDP growth of 0.5 percent in Q1 2016. Although labor-market performance was disappointing in April, employee confidence in particular showed a very different story. A record 5.4 million job openings were recorded (+6.1 percent year-over-year) as companies seek to expand their headcounts to handle new demand for goods and services.
The U.S. labor market rebounded to the strong performance seen near the end of 2014, adding 280,000 jobs in May with unemployment changing little, at 5.5 percent. Education, health, professional and business services, and leisure and hospitality led the growth, and while most other industries continued to expand, mining and logging is still unstable as oil prices have yet to stabilize.
Despite somewhat gloomy first-quarter numbers for metrics such as GDP, we expect to see further economic momentum throughout the second half of 2015 and into 2016.
Growth in jobs exceeds population increases in large metro areas, so you can also expect the battle for talent to drive up wages in the coming months.
November 2015 U.S. employment update and outlookJLL
October saw the labor market return to form after a two-month slowdown, adding 271,000 net new jobs across industries, in turn bringing down unemployment to 5 percent, the lowest rate seen during the recovery so far.
Notable over the past few months has been a rise in wages in an otherwise low-inflation environment, which will boost the personal expenditures component of GDP in the coming quarters.
February 2015 U.S. employment update and outlookJLL
Factoring in sharp upward revisions in November and December, the labor market has registered 267,750 new jobs each month over the past year, well above average this cycle.
Unemployment is up slightly to 5.7 percent, but that’s because more people are looking for jobs. Labor force participation is now up to 62.9 percent—a promising sign of confidence, though participation is still near record lows.
Other external indicators like consumer confidence, hires, quits and spending all mirror the improvements seen in the labor market of late. We expect them to continue throughout 2015 and into 2016.
See more economic, office and real estate research at http://bit.ly/1CCcWBs
Network Marketing are delighted to be working with this International Digital Marketing agency who are now on the hunt for a superb Head of SEO to spearhead an exciting time for the agency.
Network Marketing are delighted to be working with this Digital Marketing agency in Central Manchester, who are looking for a Head of Outreach to lead the agency forward in terms of its outreach offering. This is an agency which is really on a steep upwards growth curve and is looking for a leader to take the agency's outreach services forward.
The Impact of Artificial Intelligence on Modern Society.pdfssuser3e63fc
Just a game Assignment 3
1. What has made Louis Vuitton's business model successful in the Japanese luxury market?
2. What are the opportunities and challenges for Louis Vuitton in Japan?
3. What are the specifics of the Japanese fashion luxury market?
4. How did Louis Vuitton enter into the Japanese market originally? What were the other entry strategies it adopted later to strengthen its presence?
5. Will Louis Vuitton have any new challenges arise due to the global financial crisis? How does it overcome the new challenges?Assignment 3
1. What has made Louis Vuitton's business model successful in the Japanese luxury market?
2. What are the opportunities and challenges for Louis Vuitton in Japan?
3. What are the specifics of the Japanese fashion luxury market?
4. How did Louis Vuitton enter into the Japanese market originally? What were the other entry strategies it adopted later to strengthen its presence?
5. Will Louis Vuitton have any new challenges arise due to the global financial crisis? How does it overcome the new challenges?
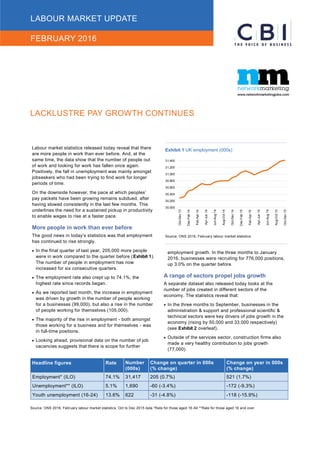
1. LABOUR MARKET UPDATE
FEBRUARY 2016
LACKLUSTRE PAY GROWTH CONTINUES
Supported by
Labour market statistics released today reveal that there
are more people in work than ever before. And, at the
same time, the data show that the number of people out
of work and looking for work has fallen once again.
Positively, the fall in unemployment was mainly amongst
jobseekers who had been trying to find work for longer
periods of time.
On the downside however, the pace at which peoples’
pay packets have been growing remains subdued, after
having slowed consistently in the last few months. This
underlines the need for a sustained pickup in productivity
to enable wages to rise at a faster pace.
More people in work than ever before
The good news in today’s statistics was that employment
has continued to rise strongly.
In the final quarter of last year, 205,000 more people
were in work compared to the quarter before (Exhibit 1).
The number of people in employment has now
increased for six consecutive quarters.
The employment rate also crept up to 74.1%, the
highest rate since records began.
As we reported last month, the increase in employment
was driven by growth in the number of people working
for a businesses (99,000), but also a rise in the number
of people working for themselves (105,000).
The majority of the rise in employment - both amongst
those working for a business and for themselves - was
in full-time positions.
Looking ahead, provisional data on the number of job
vacancies suggests that there is scope for further
employment growth. In the three months to January
2016, businesses were recruiting for 776,000 positions,
up 3.0% on the quarter before.
A range of sectors propel jobs growth
A separate dataset also released today looks at the
number of jobs created in different sectors of the
economy. The statistics reveal that:
In the three months to September, businesses in the
administration & support and professional scientific &
technical sectors were key drivers of jobs growth in the
economy (rising by 50,000 and 33,000 respectively)
(see Exhibit 2 overleaf).
Outside of the services sector, construction firms also
made a very healthy contribution to jobs growth
(77,000).
Headline figures Rate Number
(000s)
Change on quarter in 000s
(% change)
Change on year in 000s
(% change)
Employment* (ILO) 74.1% 31,417 205 (0.7%) 521 (1.7%)
Unemployment** (ILO) 5.1% 1,690 -60 (-3.4%) -172 (-9.3%)
Youth unemployment (16-24) 13.6% 622 -31 (-4.8%) -118 (-15.9%)
Source: ONS 2016, February labour market statistics, Oct to Dec 2015 data *Rate for those aged 16-64 **Rate for those aged 16 and over
Exhibit 1 UK employment (000s)
Source: ONS 2016, February labour market statistics
30,000
30,200
30,400
30,600
30,800
31,000
31,200
31,400
Oct-Dec13
Dec-Feb14
Feb-Apr14
Apr-Jun14
Jun-Aug14
Aug-Oct14
Oct-Dec14
Dec-Feb15
Feb-Apr15
Apr-Jun15
Jun-Aug15
Aug-Oct15
Oct-Dec15
2. 2
In contrast, the number of jobs in sectors like human
health & social work and transport & storage fell in the
three months to September (-33,000 and -20,000
respectively).
Fewer people looking for work...
Alongside the rise in employment across the UK, the
number of unemployed people fell.
In the final quarter of 2015, unemployment declined by
60,000, compared to the previous quarter (Jul-Sept). As
a result, 1.69 million people are now out of work and
looking for work (Exhibit 3).
The unemployment rate now stands at 5.1% which,
although lower than before the crisis began, was a touch
higher than the consensus expectation of a fall to 5.0%.
The decline in unemployment seen at the end of 2015 was
due in the main to a fall in the number of people who had
been looking for work for longer periods of time.
The number of people out of work for over six and up to
12 months fell by 27,000, while the number out of work
for over a year declined by 26,000.
In contrast, the number of people who had been seeking
work for up to six months fell by just 8,000 in the three
months to December.
...including young people
Positively, today’s data shows that youth unemployment
has continued to edge downwards.
In the last three months of 2015, the number of 16 to 24
year olds unemployed fell by 31,000.
As a result, 622,000 young people are now looking for
work. Almost two thirds of these young people are not in
full-time education while the remaining third are seeking
part-time opportunities which fit around their studies.
The youth unemployment rate is now 13.6%, which, like
the overall unemployment rate, is a little lower than
before the crisis began.
Employment grows in most of the UK’s
nations and regions...
The positive employment growth seen across the UK as a
whole was driven by almost all of the UK’s nations and
regions.
As Exhibit 4 overleaf shows, the north led the way with
the number of people in work rising strongly in the north
west (+56,000) and the north east (+47,000) in the final
quarter of 2015.
Employment growth was slightly lower, although still
healthy, in London (+25,000), Scotland (+22,000), the
East of England (+18,000), Northern Ireland and
Yorkshire & Humber (both +13,000) and the south east
(+12,000).
Employment also rose, albeit less strongly, in Wales
(+8,000) and the West Midlands (+4,000).
In contrast, the number of people in work remained
broadly similar in the south west (+3,000) and actually
fell in the East Midlands (-16,000).
…while unemployment falls across half of the
UK
While the increase in employment was fairly widespread,
the fall in unemployment was concentrated in half of the
UK’s nations and regions.
Exhibit 3 UK unemployment (000s)
Source: ONS 2016, February labour market statistics
1,600
1,800
2,000
2,200
2,400
Oct-Dec13
Dec-Feb14
Feb-Apr14
Apr-Jun14
Jun-Aug14
Aug-Oct14
Oct-Dec14
Dec-Feb15
Feb-Apr15
Apr-Jun15
Jun-Aug15
Aug-Oct15
Oct-Dec15
Exhibit 2 Change in workforce jobs (000s, Q2-Q3 2015)
Source: ONS 2016, February labour market statistics
-40 -20 0 20 40 60 80 100
Construction
Admin & support
Agriculture, forestry & fishing
Prof scientific & technical
Transport & storage
Human health & social work