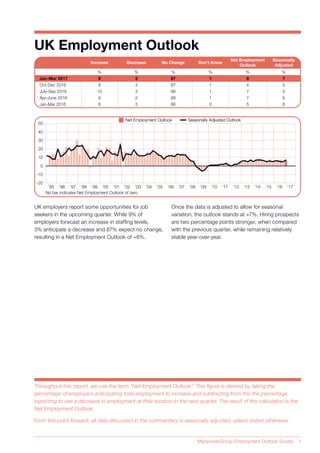
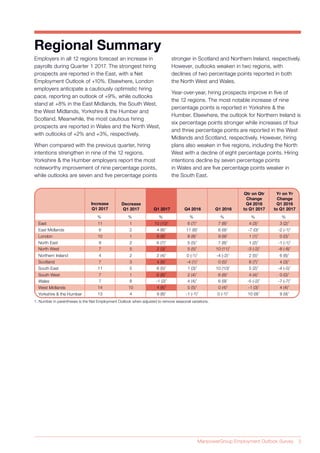
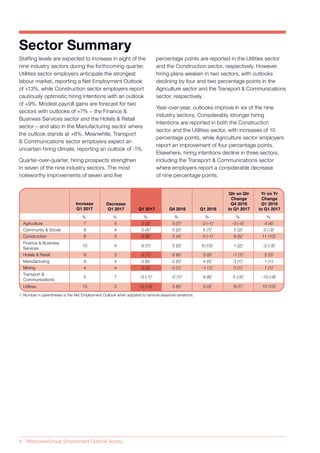
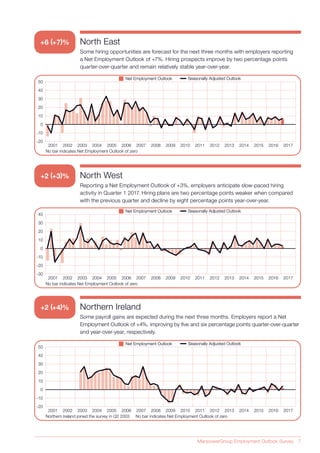
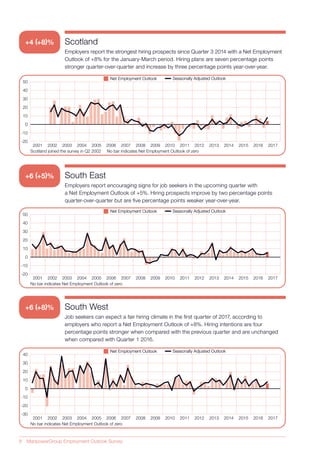
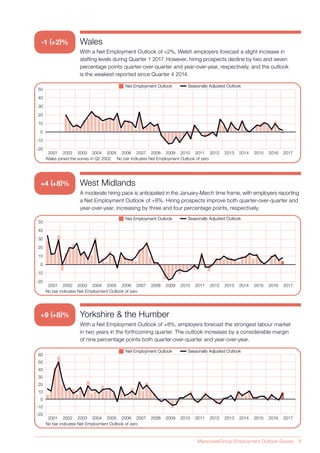
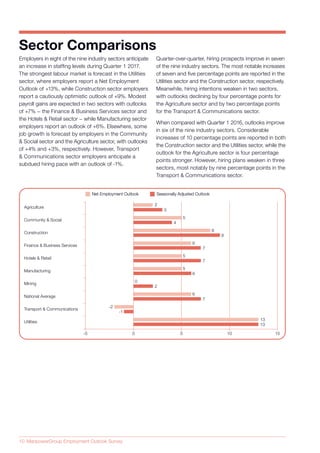
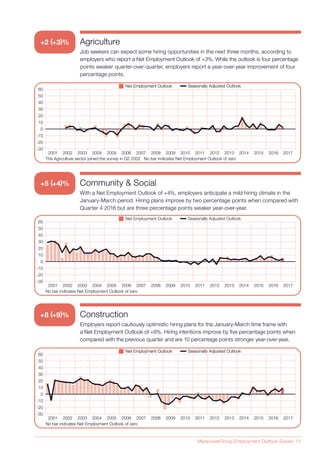
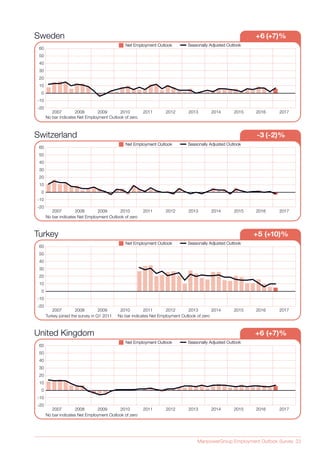
ManpowerGroup
Employment
Outlook Survey
UK
Q1
2017
The ManpowerGroup
Employment Outlook
Survey for the first quarter
2017 was conducted by
interviewing a representative
sample of 2,104 employers
in the UK.
All survey participants
were asked: “How do you
anticipate total employment
at your location to change
in the three months to
the end of March 2017
as compared to the
current quarter?”
Contents
UK Employment Outlook 1
Organisation-Size Comparisons
Regional Comparisons
Sector Comparisons
Global Employment Outlook 15
International Comparisons – EMEA
International Comparisons – Americas
International Comparisons – Asia Pacific
About the Survey 31
About ManpowerGroup®
32
UnitedKingdom
Employment
Outlook
ManpowerGroup Employment Outlook Survey 1
Increase Decrease No Change Don’t Know
Net Employment
Outlook
Seasonally
Adjusted
% % % % % %
Apr-June 2016
July-Sep 2016
Oct-Dec 2016
Jan-Mar 2017
Jan-Mar 2016
9 2 88 1 7 6
10 3 86 1 7 5
8 4 87 1 4 5
9 3 87 1 6 7
8 3 86 3 5 6
Seasonally Adjusted OutlookSeasonally Adjusted OutlookNet Employment OutlookNet Employment Outlook
No bar indicates Net Employment Outlook of zero
’95 ’96 ’97 ’98 ’99 ’00 ’01 ’02 ’03 ’04 ’05 ’06 ’07 ’08 ’09 ’10 ’11 ’12 ’13 ’14 ’15 ’16 ’17
50
40
30
20
10
0
-10
-20
UK Employment Outlook
UK employers report some opportunities for job
seekers in the upcoming quarter. While 9% of
employers forecast an increase in staffing levels,
3% anticipate a decrease and 87% expect no change,
resulting in a Net Employment Outlook of +6%.
Once the data is adjusted to allow for seasonal
variation, the outlook stands at +7%. Hiring prospects
are two percentage points stronger, when compared
with the previous quarter, while remaining relatively
stable year-over-year.
Throughout this report, we use the term “Net Employment Outlook”. This figure is derived by taking the
percentage of employers anticipating total employment to increase and subtracting from this the percentage
expecting to see a decrease in employment at their location in the next quarter. The result of this calculation is the
Net Employment Outlook.
From this point forward, all data discussed in the commentary is seasonally adjusted, unless stated otherwise.
2 ManpowerGroup Employment Outlook Survey
Participating employers are categorised into one of
four organisation sizes: Micro businesses have less
than 10 employees; Small businesses have 10-49
employees; Medium businesses have 50-199 employees;
and Large businesses have 200 or more employees.
Payrolls are forecast to grow in all four organisation
size categories during Quarter 1 2017. The strongest
hiring activity is anticipated by Large- and Medium-size
employers, who report Net Employment Outlooks
of +13%. Small employers expect a steady increase
in employment levels, reporting an outlook of +12%,
while the outlook for Micro employers stands at +4%.
Organisation-Size Comparisons
Quarter-over-quarter, Small employers report an
improvement of four percentage points, while
outlooks are two percentage points stronger in both
the Micro- and Medium-size categories. Meanwhile,
Large employers report relatively stable hiring plans.
When compared with Quarter 1 2016, Small employers
report a slight improvement of two percentage points
but the outlook for Large firms is two percentage
points weaker. Micro employers report no change and
Medium employers report relatively stable hiring plans.
IncreaseOrganisation-Size Decrease No Change Don’t Know
Net Employment
Outlook
Seasonally
Adjusted
% % % % % %
Large-Size 200 or more
Medium-Size 50-199
Small-Size 10-49
Micro-Size fewer than 10
24 9 62 5 15 13
12 5 80 3 7 13
13 3 83 1 10 12
6 3 90 1 3 4
Micro-Size fewer than 10Micro-Size fewer than 10
Graph displays Seasonally Adjusted DataGraph displays Seasonally Adjusted Data
Small-Size 10-49Small-Size 10-49 Medium-Size 50-199Medium-Size 50-199 Large-Size 200 or moreLarge-Size 200 or more
2005 2006 2007 2008 2009 2010 2011 2012 2013 2014 2015 2016 2017
-10
0
10
20
30
40
50
ManpowerGroup Employment Outlook Survey 3
Employers in all 12 regions forecast an increase in
payrolls during Quarter 1 2017. The strongest hiring
prospects are reported in the East, with a Net
Employment Outlook of +10%. Elsewhere, London
employers anticipate a cautiously optimistic hiring
pace, reporting an outlook of +9%, while outlooks
stand at +8% in the East Midlands, the South West,
the West Midlands, Yorkshire & the Humber and
Scotland. Meanwhile, the most cautious hiring
prospects are reported in Wales and the North West,
with outlooks of +2% and +3%, respectively.
When compared with the previous quarter, hiring
intentions strengthen in nine of the 12 regions.
Yorkshire & the Humber employers report the most
noteworthy improvement of nine percentage points,
while outlooks are seven and five percentage points
East
East Midlands
London
North West
North East
Northern Ireland
Scotland
South East
South West
Decrease
Q1 2017 Q1 2017 Q4 2016 Q1 2016
Qtr on Qtr
Change
Q4 2016
to Q1 2017
Yr on Yr
Change
Q1 2016
to Q1 2017
Increase
Q1 2017
% % % % % % %
Wales
West Midlands
Yorkshire & the Humber
1. Number in parentheses is the Net Employment Outlook when adjusted to remove seasonal variations.
6
11
10
8
7
4
7
11
7
2
1
1
2
5
2
3
5
1
4 (8)1
10 (10)1
9 (9)1
6 (7)1
2 (3)1
2 (4)1
4 (8)1
6 (5)1
6 (8)1
11 (8)1
6 (7)1
8 (8)1
5 (5)1
5 (5)1
0 (-1)1
-4 (1)1
1 (3)1
2 (4)1
6 (9)1
7 (8)1
9 (9)1
7 (8)1
10 (11)1
-4 (-2)1
0 (5)1
10 (10)1
6 (8)1
-7 (0)1
4 (3)1
1 (1)1
1 (2)1
-3 (-2)1
2 (5)1
8 (7)1
5 (2)1
4 (4)1
-2 (-1)1
3 (2)1
0 (0)1
-1 (-1)1
-8 (-8)1
6 (6)1
4 (3)1
-4 (-5)1
0 (0)1
7 8 -1 (2)1
4 (4)1
6 (9)1
-5 (-2)1
-7 (-7)1
14 10 4 (8)1
5 (5)1
0 (4)1
-1 (3)1
4 (4)1
13 4 9 (8)1
-1 (-1)1
0 (-1)1
10 (9)1
9 (9)1
Regional Summary
stronger in Scotland and Northern Ireland, respectively.
However, outlooks weaken in two regions, with
declines of two percentage points reported in both
the North West and Wales.
Year-over-year, hiring prospects improve in five of
the 12 regions. The most notable increase of nine
percentage points is reported in Yorkshire & the
Humber. Elsewhere, the outlook for Northern Ireland is
six percentage points stronger while increases of four
and three percentage points are reported in the West
Midlands and Scotland, respectively. However, hiring
plans also weaken in five regions, including the North
West with a decline of eight percentage points. Hiring
intentions decline by seven percentage points
in Wales and are five percentage points weaker in
the South East.
4 ManpowerGroup Employment Outlook Survey
Staffing levels are expected to increase in eight of the
nine industry sectors during the forthcoming quarter.
Utilities sector employers anticipate the strongest
labour market, reporting a Net Employment Outlook
of +13%, while Construction sector employers report
cautiously optimistic hiring intentions with an outlook
of +9%. Modest payroll gains are forecast for two
sectors with outlooks of +7% − the Finance &
Business Services sector and the Hotels & Retail
sector – and also in the Manufacturing sector where
the outlook stands at +6%. Meanwhile, Transport
& Communications sector employers expect an
uncertain hiring climate, reporting an outlook of -1%.
Quarter-over-quarter, hiring prospects strengthen
in seven of the nine industry sectors. The most
noteworthy improvements of seven and five
Agriculture
Community & Social
Construction
Hotels & Retail
Finance & Business
Services
Manufacturing
Mining
Transport &
Communications
Utilities
Decrease
Q1 2017 Q1 2017 Q4 2016 Q1 2016
Qtr on Qtr
Change
Q4 2016
to Q1 2017
Yr on Yr
Change
Q1 2016
to Q1 2017
Increase
Q1 2017
% % % % % % %
1. Number in parentheses is the Net Employment Outlook when adjusted to remove seasonal variations.
9
7
8
10
8
9
4
5
15
4
5
0
4
3
4
4
7
2
5 (4)1
2 (3)1
8 (9)1
6 (7)1
5 (7)1
5 (6)1
0 (2)1
-2 (-1)1
13 (13)1
0 (2)1
5 (7)1
2 (4)1
5 (5)1
6 (6)1
2 (5)1
0 (1)1
-2 (1)1
5 (6)1
5 (7)1
-2 (-1)1
-3 (-1)1
8 (10)1
3 (5)1
4 (5)1
-1 (1)1
8 (8)1
3 (3)1
5 (2)1
-3 (-4)1
6 (5)1
1 (2)1
-1 (1)1
3 (1)1
0 (1)1
0 (-2)1
8 (7)1
0 (-3)1
4 (4)1
11 (10)1
-2 (-3)1
2 (2)1
1 (1)1
1 (1)1
-10 (-9)1
10 (10)1
Sector Summary
percentage points are reported in the Utilities sector
and the Construction sector, respectively. However,
hiring plans weaken in two sectors, with outlooks
declining by four and two percentage points in the
Agriculture sector and the Transport & Communications
sector, respectively.
Year-over-year, outlooks improve in six of the nine
industry sectors. Considerably stronger hiring
intentions are reported in both the Construction
sector and the Utilities sector, with increases of 10
percentage points, while Agriculture sector employers
report an improvement of four percentage points.
Elsewhere, hiring intentions decline in three sectors,
including the Transport & Communications sector
where employers report a considerable decrease
of nine percentage points.
ManpowerGroup Employment Outlook Survey 5
Job seekers in all 12 regions can expect positive hiring
activity during the upcoming quarter, according to UK
employers. The strongest labour market is anticipated
in the East, where the Net Employment Outlook stands
at +10%, while London employers anticipate a fair
hiring climate, reporting an outlook of +9%. Elsewhere,
outlooks of +8% are reported in the East Midlands,
the South West, the West Midlands, Yorkshire & the
Humber and Scotland, while the outlook for the North
East stands at +7%. The most cautious hiring prospects
are reported in Wales, where the outlook is +2%, while
employers report modest hiring plans in both the
North West and Northern Ireland, with outlooks of
+3% and +4%, respectively.
When compared with Quarter 4 2016, hiring intentions
strengthen in nine of the 12 regions. Yorkshire & the
Humber employers report the most notable increase
of nine percentage points, while outlooks are seven
-5 15
East
East Midlands
London
National Average
North East
North West
Northern Ireland
Scotland
South East
South West
Wales
West Midlands
Yorkshire & the Humber
10
10
8
4
9
9
7
6
7
6
3
2
4
2
8
4
5
6
8
6
2
-1
8
4
8
9
Net Employment OutlookNet Employment Outlook Seasonally Adjusted OutlookSeasonally Adjusted Outlook
0 5 10
Regional Comparisons
and five percentage points stronger in Scotland and
Northern Ireland, respectively. South West employers
report an increase of four percentage points and
outlooks are three percentage points stronger in both
the West Midlands and the East. However, hiring plans
are two percentage points weaker in the North West
and Wales.
Year-over-year, outlooks improve in five of the 12 regions,
including Yorkshire & the Humber, where employers
report an increase of nine percentage points. The
outlook for Northern Ireland is six percentage points
stronger, while increases of four and three percentage
points are reported in the West Midlands and Scotland,
respectively. However, hiring prospects also weaken in
five regions, most notably by eight percentage points
in the North West. Elsewhere, hiring intentions decline
by seven and five percentage points in Wales and the
South East, respectively.
6 ManpowerGroup Employment Outlook Survey
East
Job seekers can expect an optimistic hiring climate in the upcoming quarter, according
to employers who report a Net Employment Outlook of +10%. Hiring intentions improve
by three and two percentage points quarter-over-quarter and year-over-year, respectively.
East Midlands
Reporting a Net Employment Outlook of +8%, employers expect the moderate hiring pace
to continue in Quarter 1 2017. Hiring intentions are unchanged when compared with the
previous quarter and remain relatively stable year-over-year.
Seasonally Adjusted OutlookSeasonally Adjusted OutlookNet Employment OutlookNet Employment Outlook
No bar indicates Net Employment Outlook of zero
2001 2002 2003 2004 2005 2006 2007 2008 2009 2010 2011 2012 2013 2014 2015 2016 2017
50
40
30
20
10
0
-10
-20
Seasonally Adjusted OutlookSeasonally Adjusted OutlookNet Employment OutlookNet Employment Outlook
No bar indicates Net Employment Outlook of zero
2001 2002 2003 2004 2005 2006 2007 2008 2009 2010 2011 2012 2013 2014 2015 2016 2017
50
40
30
20
10
0
-10
-20
+10 (+10)%
+4 (+8)%
+9 (+9)% London
Employers continue to report cautiously optimistic hiring plans with a Net Employment
Outlook of +9% for the January-March period. The outlook remains relatively stable quarter-
over-quarter and is unchanged when compared with Quarter 1 2016.
Seasonally Adjusted OutlookSeasonally Adjusted OutlookNet Employment OutlookNet Employment Outlook
No bar indicates Net Employment Outlook of zero
2001 2002 2003 2004 2005 2006 2007 2008 2009 2010 2011 2012 2013 2014 2015 2016 2017
50
40
30
20
10
0
-10
-20
ManpowerGroup Employment Outlook Survey 7
+6 (+7)% North East
Some hiring opportunities are forecast for the next three months with employers reporting
a Net Employment Outlook of +7%. Hiring prospects improve by two percentage points
quarter-over-quarter and remain relatively stable year-over-year.
Seasonally Adjusted OutlookSeasonally Adjusted OutlookNet Employment OutlookNet Employment Outlook
No bar indicates Net Employment Outlook of zero
2001 2002 2003 2004 2005 2006 2007 2008 2009 2010 2011 2012 2013 2014 2015 2016 2017
50
40
30
20
10
0
-10
-20
North West
Reporting a Net Employment Outlook of +3%, employers anticipate slow-paced hiring
activity in Quarter 1 2017. Hiring plans are two percentage points weaker when compared
with the previous quarter and decline by eight percentage points year-over-year.
Northern Ireland
Some payroll gains are expected during the next three months. Employers report a Net
Employment Outlook of +4%, improving by five and six percentage points quarter-over-quarter
and year-over-year, respectively.
Seasonally Adjusted OutlookSeasonally Adjusted OutlookNet Employment OutlookNet Employment Outlook
No bar indicates Net Employment Outlook of zero
2001 2002 2003 2004 2005 2006 2007 2008 2009 2010 2011 2012 2013 2014 2015 2016 2017
40
30
20
10
0
-10
-20
-30
Seasonally Adjusted OutlookSeasonally Adjusted OutlookNet Employment OutlookNet Employment Outlook
Northern Ireland joined the survey in Q2 2003 No bar indicates Net Employment Outlook of zero
2001 2002 2003 2004 2005 2006 2007 2008 2009 2010 2011 2012 2013 2014 2015 2016 2017
50
40
30
20
10
0
-10
-20
+2 (+3)%
+2 (+4)%
8 ManpowerGroup Employment Outlook Survey
Scotland
Employers report the strongest hiring prospects since Quarter 3 2014 with a Net Employment
Outlook of +8% for the January-March period. Hiring plans are seven percentage points
stronger quarter-over-quarter and increase by three percentage points year-over-year.
South East
Employers report encouraging signs for job seekers in the upcoming quarter with
a Net Employment Outlook of +5%. Hiring prospects improve by two percentage points
quarter-over-quarter but are five percentage points weaker year-over-year.
Seasonally Adjusted OutlookSeasonally Adjusted OutlookNet Employment OutlookNet Employment Outlook
Scotland joined the survey in Q2 2002 No bar indicates Net Employment Outlook of zero
2001 2002 2003 2004 2005 2006 2007 2008 2009 2010 2011 2012 2013 2014 2015 2016 2017
50
40
30
20
10
0
-10
-20
Seasonally Adjusted OutlookSeasonally Adjusted OutlookNet Employment OutlookNet Employment Outlook
No bar indicates Net Employment Outlook of zero
2001 2002 2003 2004 2005 2006 2007 2008 2009 2010 2011 2012 2013 2014 2015 2016 2017
50
40
30
20
10
0
-10
-20
+4 (+8)%
+6 (+5)%
South West
Job seekers can expect a fair hiring climate in the first quarter of 2017, according to
employers who report a Net Employment Outlook of +8%. Hiring intentions are four
percentage points stronger when compared with the previous quarter and are unchanged
when compared with Quarter 1 2016.
Seasonally Adjusted OutlookSeasonally Adjusted OutlookNet Employment OutlookNet Employment Outlook
No bar indicates Net Employment Outlook of zero
2001 2002 2003 2004 2005 2006 2007 2008 2009 2010 2011 2012 2013 2014 2015 2016 2017
40
30
20
10
0
-10
-20
-30
+6 (+8)%
ManpowerGroup Employment Outlook Survey 9
Wales
With a Net Employment Outlook of +2%, Welsh employers forecast a slight increase in
staffing levels during Quarter 1 2017. However, hiring prospects decline by two and seven
percentage points quarter-over-quarter and year-over-year, respectively, and the outlook
is the weakest reported since Quarter 4 2014.
Seasonally Adjusted OutlookSeasonally Adjusted OutlookNet Employment OutlookNet Employment Outlook
Wales joined the survey in Q2 2002 No bar indicates Net Employment Outlook of zero
2001 2002 2003 2004 2005 2006 2007 2008 2009 2010 2011 2012 2013 2014 2015 2016 2017
50
40
30
20
10
0
-10
-20
-1 (+2)%
West Midlands
A moderate hiring pace is anticipated in the January-March time frame, with employers reporting
a Net Employment Outlook of +8%. Hiring prospects improve both quarter-over-quarter and
year-over-year, increasing by three and four percentage points, respectively.
Yorkshire & the Humber
With a Net Employment Outlook of +8%, employers forecast the strongest labour market
in two years in the forthcoming quarter. The outlook increases by a considerable margin
of nine percentage points both quarter-over-quarter and year-over-year.
Seasonally Adjusted OutlookSeasonally Adjusted OutlookNet Employment OutlookNet Employment Outlook
No bar indicates Net Employment Outlook of zero
2001 2002 2003 2004 2005 2006 2007 2008 2009 2010 2011 2012 2013 2014 2015 2016 2017
50
40
30
20
10
0
-10
-20
Seasonally Adjusted OutlookSeasonally Adjusted OutlookNet Employment OutlookNet Employment Outlook
No bar indicates Net Employment Outlook of zero
2001 2002 2003 2004 2005 2006 2007 2008 2009 2010 2011 2012 2013 2014 2015 2016 2017
-20
-10
0
10
20
30
40
50
60
+4 (+8)%
+9 (+8)%
10 ManpowerGroup Employment Outlook Survey
Employers in eight of the nine industry sectors anticipate
an increase in staffing levels during Quarter 1 2017.
The strongest labour market is forecast in the Utilities
sector, where employers report a Net Employment
Outlook of +13%, while Construction sector employers
report a cautiously optimistic outlook of +9%. Modest
payroll gains are expected in two sectors with outlooks
of +7% − the Finance & Business Services sector and
the Hotels & Retail sector − while Manufacturing sector
employers report an outlook of +6%. Elsewhere, some
job growth is forecast by employers in the Community
& Social sector and the Agriculture sector, with outlooks
of +4% and +3%, respectively. However, Transport
& Communications sector employers anticipate a
subdued hiring pace with an outlook of -1%.
-5 15
Agriculture
Community & Social
Construction
Finance & Business Services
Hotels & Retail
Manufacturing
Mining
National Average
Transport & Communications
Utilities
3
2
4
5
9
8
7
6
7
5
6
5
2
0
7
6
-1
-2
13
13
Net Employment OutlookNet Employment Outlook Seasonally Adjusted OutlookSeasonally Adjusted Outlook
0 5 10
Sector Comparisons
Quarter-over-quarter, hiring prospects improve in seven
of the nine industry sectors. The most notable increases
of seven and five percentage points are reported in the
Utilities sector and the Construction sector, respectively.
Meanwhile, hiring intentions weaken in two sectors,
with outlooks declining by four percentage points for
the Agriculture sector and by two percentage points
for the Transport & Communications sector.
When compared with Quarter 1 2016, outlooks improve
in six of the nine industry sectors. Considerable
increases of 10 percentage points are reported in both
the Construction sector and the Utilities sector, while the
outlook for the Agriculture sector is four percentage
points stronger. However, hiring plans weaken in three
sectors, most notably by nine percentage points in the
Transport & Communications sector.
ManpowerGroup Employment Outlook Survey 11
Agriculture
Job seekers can expect some hiring opportunities in the next three months, according to
employers who report a Net Employment Outlook of +3%. While the outlook is four percentage
points weaker quarter-over-quarter, employers report a year-over-year improvement of four
percentage points.
Community & Social
With a Net Employment Outlook of +4%, employers anticipate a mild hiring climate in the
January-March period. Hiring plans improve by two percentage points when compared with
Quarter 4 2016 but are three percentage points weaker year-over-year.
Seasonally Adjusted OutlookSeasonally Adjusted OutlookNet Employment OutlookNet Employment Outlook
The Agriculture sector joined the survey in Q2 2002 No bar indicates Net Employment Outlook of zero
2001 2002 2003 2004 2005 2006 2007 2008 2009 2010 2011 2012 2013 2014 2015 2016 2017
-30
-20
-10
0
10
20
30
40
50
60
Seasonally Adjusted OutlookNet Employment Outlook
No bar indicates Net Employment Outlook of zero
2001 2002 2003 2004 2005 2006 2007 2008 2009 2010 2011 2012 2013 2014 2015 2016 2017
-30
-20
-10
0
10
20
30
40
50
60
+5 (+4)%
+2 (+3)%
Construction
Employers report cautiously optimistic hiring plans for the January-March time frame with
a Net Employment Outlook of +9%. Hiring intentions improve by five percentage points when
compared with the previous quarter and are 10 percentage points stronger year-over-year.
Seasonally Adjusted OutlookSeasonally Adjusted OutlookNet Employment OutlookNet Employment Outlook
No bar indicates Net Employment Outlook of zero
2001 2002 2003 2004 2005 2006 2007 2008 2009 2010 2011 2012 2013 2014 2015 2016 2017
-30
-20
-10
0
10
20
30
40
50
60
+8 (+9)%
12 ManpowerGroup Employment Outlook Survey
Finance & Business Services
A fair hiring climate is forecast for the coming quarter with employers reporting a Net
Employment Outlook of +7%. Hiring plans improve by two percentage points when
compared with the previous quarter but are three percentage points weaker year-over-year.
Finance sub-sector employers anticipate the weakest labour market since Quarter 3 2014,
reporting a Net Employment Outlook of -3% for the next three months. Hiring prospects
remain relatively stable when compared with the previous quarter but decline by a
considerable margin of 17 percentage points year-over-year.
In the Business Services sub-sector, employers report cautiously optimistic hiring plans.
The Net Employment Outlook of +9% is four percentage points stronger quarter-over-quarter
and remains relatively stable when compared with Quarter 1 2016.
Seasonally Adjusted OutlookSeasonally Adjusted OutlookNet Employment OutlookNet Employment Outlook
No bar indicates Net Employment Outlook of zero
2001 2002 2003 2004 2005 2006 2007 2008 2009 2010 2011 2012 2013 2014 2015 2016 2017
-30
-20
-10
0
10
20
30
40
50
60
+6 (+7)%
Hotels & Retail
Employers report encouraging signs for job seekers in the next three months. The Net
Employment Outlook of +7% remains relatively stable when compared with the previous
quarter and is two percentage points stronger year-over-year.
B2B sub-sector employers anticipate some hiring opportunities in the January-March time
frame, reporting a Net Employment Outlook of +6%. The outlook improves by four and
seven percentage points quarter-over-quarter and year-over-year, respectively.
In the B2C sub-sector, job seekers can expect a modest hiring pace, according to employers
who report a Net Employment Outlook of +4% for Quarter 1 2017. However, hiring prospects
decline by four percentage points quarter-over-quarter and are two percentage points
weaker year-over-year.
Hotels & Restaurants sub-sector employers forecast steady payroll gains during the first
quarter of 2017, reporting a Net Employment Outlook of +13%. The outlook strengthens
both quarter-over-quarter and year-over-year, increasing by nine and three percentage
points, respectively.
Seasonally Adjusted OutlookSeasonally Adjusted OutlookNet Employment OutlookNet Employment Outlook
No bar indicates Net Employment Outlook of zero
2001 2002 2003 2004 2005 2006 2007 2008 2009 2010 2011 2012 2013 2014 2015 2016 2017
-30
-20
-10
0
10
20
30
40
50
60
+5 (+7)%
ManpowerGroup Employment Outlook Survey 13
Manufacturing
Job seekers can expect a moderate hiring pace in Quarter 1 2017, according to employers
who report a Net Employment Outlook of +6%. Hiring intentions remain relatively stable both
quarter-over-quarter and year-over-year.
Seasonally Adjusted OutlookSeasonally Adjusted OutlookNet Employment OutlookNet Employment Outlook
No bar indicates Net Employment Outlook of zero
2001 2002 2003 2004 2005 2006 2007 2008 2009 2010 2011 2012 2013 2014 2015 2016 2017
-30
-20
-10
0
10
20
30
40
50
60
+5 (+6)%
Mining
Employers anticipate a quiet labour market in the forthcoming quarter, reporting a Net
Employment Outlook of +2%. The outlook remains relatively stable both quarter-over-quarter
and year-over-year.
Seasonally Adjusted OutlookSeasonally Adjusted OutlookNet Employment OutlookNet Employment Outlook
The Mining sector joined the survey in Q2 2002 No bar indicates Net Employment Outlook of zero
2001 2002 2003 2004 2005 2006 2007 2008 2009 2010 2011 2012 2013 2014 2015 2016 2017
-30
-20
-10
0
10
20
30
40
50
60
0 (+2)%
14 ManpowerGroup Employment Outlook Survey
Utilities
Reporting a Net Employment Outlook of +13%, employers anticipate a steady hiring pace in
the first quarter of 2017. Hiring prospects improve by seven percentage points quarter-over-
quarter and are considerably stronger year-over-year, increasing by 10 percentage points.
Transport & Communications
Job seekers can expect to face the weakest – and first negative – labour market since
Quarter 4 2012 in the coming quarter, according to employers who report a Net Employment
Outlook of -1%. Hiring prospects are two percentage points weaker quarter-over-quarter and
decline by nine percentage points when compared with Quarter 1 2016.
In the Transport sub-sector employers expect the subdued hiring climate to continue in
the upcoming quarter, reporting a Net Employment Outlook of -1%. The outlook is
unchanged when compared with the previous quarter but declines by nine percentage
points year-over-year.
Employers in the Telecoms sub-sector anticipate subdued hiring activity in Quarter 1 2017,
reporting a third consecutive negative Net Employment Outlook, standing at -2%. While
remaining relatively stable quarter-over-quarter, hiring plans decline by 17 percentage points
year-over-year.
Seasonally Adjusted OutlookSeasonally Adjusted OutlookNet Employment OutlookNet Employment Outlook
The Utilities sector joined the survey in Q2 2002 No bar indicates Net Employment Outlook of zero
2001 2002 2003 2004 2005 2006 2007 2008 2009 2010 2011 2012 2013 2014 2015 2016 2017
-30
-20
-10
0
10
20
30
40
50
60
Seasonally Adjusted OutlookSeasonally Adjusted OutlookNet Employment OutlookNet Employment Outlook
No bar indicates Net Employment Outlook of zero
2001 2002 2003 2004 2005 2006 2007 2008 2009 2010 2011 2012 2013 2014 2015 2016 2017
-30
-20
-10
0
10
20
30
40
50
60
+13 (+13)%
-2 (-1)%
ManpowerGroup Employment Outlook Survey 15
%
†EMEA – Europe, Middle East and Africa.
1. Number in parentheses is the Net Employment Outlook when adjusted to remove the impact of seasonal variations in hiring activity.
Please note that this data is not available for all countries as a minimum of 17 quarters worth of data is required. 
* Indicates unadjusted data.
Quarter 1 2017 Net Employment Outlook
-15 -10 -5 0 5 10 15 20 25 30 35 40 45
-15 -10 -5 0 5 10 15 20 25 30 35 40 45
Taiwan
India
Japan
Hungary
Slovenia
Guatemala
United States
New Zealand
Romania
Mexico
Hong Kong
Costa Rica
Bulgaria
Canada
Israel
Turkey
Australia
Poland
Singapore
Slovakia
Colombia
Panama
Austria
Germany
Greece
Peru
South Africa
Sweden
United Kingdom
Argentina
Belgium
Ireland
Netherlands
Portugal
China
Finland
Czech Republic
Norway
Spain
France
Italy
Switzerland
Brazil
Quarter 1 2017
Qtr on Qtr Change
Q4 2016 to Q1 2017
Yr on Yr Change
 Q1 2016 to Q1 2017
Americas
Asia Pacific
Australia
China
Hong Kong
Japan
India
New Zealand
Singapore
Taiwan
EMEA†
Austria
Belgium
Bulgaria
Costa Rica
Colombia
United States
Czech Republic
Greece
Hungary
South Africa
Slovenia
Slovakia
Poland
Portugal
Romania
Canada
Mexico
Peru
Brazil
Argentina
Guatemala
Panama
France
Germany
Finland
Ireland
Netherlands
Norway
Spain
Turkey
Italy
Switzerland
Sweden
Israel
UK
4 (4)1
3 (7)1
6 (6)1
8 (9)1
22 (23)1
15 (15)1
13 (13)1
21 (24)1
8 (9)1
20 (25)1
6 (11)1
12 (14)1
7 (7)1
1 (2)1
4 (7)1
5 (5)1
-3 (-2)1
4 (5)1
3 (3)1
1 (3)1
6 (7)1
5 (10)1
-2 (0)1
-1 (-1)1
0 (4)1
5 (5)1
-4 (-2)1
2 (0)1
0 (0)1
0 (1)1
-10 (-7)1
0 (1)1
-2 (4)1
-3 (-3)1
3 (3)1
5 (5)1
0 (0)1
1 (0)1
4 (4)1
-2 (-2)1
-19 (-19)1
-1 (-1)1
-1 (-2)1
7 (11)1
1 (0)1
2 (0)1
16 (12)1
9 (3)1
0 (-3)1
6 (8)1
-5 (-2)1
-4 (-4)1
13 (16)1
-3 (-2)1
-1 (-1)1
1 (3)1
-6 (-4)1
1 (1)1
2 (7)1
2 (1)1
2 (2)1
15 (17)1
5 (5)1
6 (6)1
8 (7)1
-1 (-1)1
1 (2)1
13 (17)1
5 (5)1
13 (13)1
7 (9)1
1 (1)1
-3 (-3)1
4 (9)1
-4 (-1)1
-1 (-1)1
5 1 –
6 (15)1
0 (3)1
5 (5)1
1 (2)1
2 (4)1
0 (-1)1
4 (4)1
-8 (-9)1
1 (-1)1
2 (2)1
7 (6)1
3 (0)1
-1 (-1)1
1 (1)1
16 (16)1
6 (7)1
1 (1)1
-1 (-1)1
8 (8)1
-1 (0)1
-3 (-5)1
-1 (0)1
-5 (-1)1
3 (3)1
1 (4)1
4 (2)1
7 (2)1
4 (4)1
2 (2)1
-4 (-3)1
-5 (-6)1
-1 (-1)1
-1 (-1)1
5 (5)1
-1 (0)1
0 (-1)1
2 (2)1
-3 (-3)1
-3 (-3)1
7 (10)1
-4 (-1)1
2 (2)1
-1 (-1)1
0 (0)1
2 (2)1
-6 (-6)1
6 (7)1
2 (2)1
1 (1)1
-1 (-1)1
+25%
+24%
+23%
+17%
+17%
+16%
+16%
+15%
+15%
+14%
+13%
+12%
+11%
+11%
+10%
+10%
+9%
+9%
+9%
+9%
+8%
+8%
+7%
+7%
+7%
+7%
+7%
+7%
+7%
+6%
+6%
+5%
+5% 
+5%* 
+4%
+4%
+3%
+3%
+3%
+2%
0%
-2%
-9%
Global Employment Outlook
16 ManpowerGroup Employment Outlook Survey
ManpowerGroup interviewed nearly 59,000 employers
across 43 countries and territories to forecast labour
market activity* in Quarter 1 2017. All participants were
asked: “How do you anticipate total employment at
your location to change in the three months to the end
of March 2017 as compared to the current quarter?”
The research from ManpowerGroup indicates job
seekers across the globe will likely find some
opportunities through the first three months of 2017.
Hiring activity is expected to continue in the majority
of the world’s labour markets. Most outlooks remain
relatively stable or have improved since last quarter and
this time last year. Altogether, employers in 40 of 43
countries and territories intend to add to their payrolls
by varying degrees at the start of 2017. The survey
reveals few signs that uncertainty associated with the
Brexit vote or the U.S. election will result in any
significant labour market volatility. Instead, employers
appear content to keep a watchful eye on marketplace
conditions and adjust workforce levels according to
their business needs.
Overall, forecasts are mixed in comparison to the
Quarter 4 2016 and Quarter 1 2016 surveys. Hiring
plans improve in 19 of 43 countries and territories
when compared quarter-over-quarter, decline in 17,
and are unchanged in seven. Outlooks strengthen
in 20 countries and territories year-over-year, weaken
in 18, and are unchanged in four. First-quarter hiring
confidence is strongest in Taiwan, India, Japan,
Hungary and Slovenia. The weakest forecasts are
reported in Brazil, Switzerland and Italy.
Job gains are expected in nine of the 10 countries
surveyed in the Americas. Hiring confidence
strengthens in four countries, declines in four, and is
unchanged in two when compared to the final three
months of 2016. Year-over-year, hiring prospects improve
in four countries but weaken in the remaining six. The
strongest first-quarter hiring plans are reported in both
Guatemala and the United States, while employers
in Brazil expect payrolls to shrink for the eighth
consecutive quarter and report the weakest hiring
plans across the region as well as across the globe.
Employers expect staffing levels to increase by varying
degrees in 23 of 25 countries in the Europe, Middle
East & Africa (EMEA) region. When compared
quarter-over-quarter, hiring plans improve in 12
countries, weaken in 10 and are unchanged in three.
In a year-over-year comparison, outlooks improve in
15 countries, decline in seven and are unchanged in
two.** The region’s most optimistic first-quarter hiring
plans are reported in Hungary and Slovenia with
employers in both countries expecting the strongest
labour market activity since the surveys were launched
in their respective countries. Conversely, the weakest
employer sentiment is reported in Switzerland, where
the outlook slips into negative territory for the first time
in two years and in Italy, where labour market activity is
expected to be flat in the first three months of the year.
Employers in all eight Asia Pacific countries and
territories expect workforce gains in the January-
March time frame. When first-quarter forecasts are
compared with the final three months of 2016, hiring
plans strengthen in three countries/territories, weaken
in three and are unchanged in two. In a year-over-year
comparison, hiring is expected to accelerate only in
New Zealand, slowdown in five other countries/territories
and remain unchanged in two. Taiwanese employers
expect the strongest hiring pace in the region as well
as across the globe. Meanwhile, Chinese employers
report the region’s most cautious hiring plans.
Full survey results for each of the 43 countries and
territories included in this quarter’s survey, plus
regional and global comparisons, can be found at
www.manpowergroup.com/meos
The next ManpowerGroup Employment Outlook
Survey will be released on 14 March 2017 and will
detail expected labour market activity for the second
quarter of 2017.
* Commentary is based on seasonally adjusted data where
available. Data is not seasonally adjusted for Portugal.
** Portugal joined the survey in Quarter 3 2016 and has no
year-over-year trend data to compare at this point.
The ManpowerGroup Employment Outlook Survey is
ManpowerGroup’s quarterly index of employer hiring confidence.
ManpowerGroup Employment Outlook Survey 17
ManpowerGroup interviewed nearly 21,000 employers
in 25 countries in the Europe, Middle East and Africa
(EMEA) region. Some level of job growth is expected
in all of the countries during the January-March time
frame except in Italy and Switzerland.
Employers in Hungary and Slovenia report the
strongest first-quarter forecasts, and hiring intentions
in both countries are the most optimistic reported
since their respective surveys were launched.
Hungary’s upbeat outlook is fuelled by unprecedented
optimism in both the Construction and Wholesale &
Retail Trade sectors. Similarly, Slovenia’s forecast is
underpinned by the most optimistic forecasts reported
to date in five of the country’s 10 industry sectors, with
the Construction and Wholesale & Retail Trade sector
outlooks also included among the five.
Job seekers will likely find similarly favourable first-
quarter hiring opportunities in both Romania and
Bulgaria. Romania’s outlook is the strongest since
Quarter 4 2008, with most hiring activity expected
in the Manufacturing and Wholesale & Retail Trade
sectors where approximately three of every 10
employers say they intend to add to their payrolls.
Bulgaria’s forecast is highlighted by the strongest
outlooks reported in the Finance, Insurance & Real
Estate, Manufacturing, and Wholesale & Retail Trade
sectors since the survey began.
Noteworthy advances in employer confidence are also
evident in Belgium with the strongest forecast reported
since Quarter 3 2011. The outlook is buoyed, in large
part, by the most optimistic hiring intentions reported
in more than five years in the Finance & Business
Services sector.
International Comparisons – EMEA
Similarly, Austrian forecasts in both the Manufacturing
and Agriculture sectors are the strongest since
Quarter 4 2008, and help boost the country’s overall
outlook to a level last reported in Quarter 3 2012.
Employer confidence is trending in the opposite
direction in Ireland. The outlook grows more
conservative as forecasts soften in most industry
sectors and regions in both quarter-over-quarter and
year-over-year comparisons.
Elsewhere, workforce gains are expected to be
modest. Employers in the United Kingdom remain
resilient following the Brexit referendum, with hiring
plans actually improving slightly from the prior quarter
and remaining relatively stable when compared to last
year at this time.
Some level of payroll growth is expected across
all industry sectors in Germany, with the most
opportunities expected in the Finance & Business
Services sector. The survey indicates the hiring pace
in France will be more subdued, but job growth is
anticipated in most industry sectors, particularly in
the Transport, Storage & Communications sector
where the outlook climbs considerably from both
the prior quarter and last year at this time.
Employer hiring confidence is decidedly more muted
in Italy and Switzerland. Italy’s outlook is relatively
stable in comparison to the prior quarter and last year
at this time, but hiring intentions are negative in six of
10 industry sectors and two of four regions. The Swiss
forecast drifts again into negative territory for the first
time in two years, dipping slightly in both quarter-over-
quarter and year-over-year comparisons.
Austria +3 (+7)%
Seasonally Adjusted OutlookSeasonally Adjusted OutlookNet Employment OutlookNet Employment Outlook
No bar indicates Net Employment Outlook of zero
20082007 2009 2010 2011 2012 2013 2014 2015 2016  2017
-20
-10
0
10
20
30
40
50
60
18 ManpowerGroup Employment Outlook Survey
Belgium +6 (+6)%
Seasonally Adjusted OutlookSeasonally Adjusted OutlookNet Employment OutlookNet Employment Outlook
No bar indicates Net Employment Outlook of zero
20082007 2009 2010 2011 2012 2013 2014 2015 2016  2017
-20
-10
0
10
20
30
40
50
60
Bulgaria +7 (+11)%
Bulgaria joined the survey in Q1 2011 No bar indicates Net Employment Outlook of zero
20082007 2009 2010 2011 2012 2013 2014 2015 2016  2017
Seasonally Adjusted OutlookNet Employment Outlook
-20
-10
0
10
20
30
40
50
60
Czech Republic +1 (+3)%
Seasonally Adjusted OutlookSeasonally Adjusted OutlookNet Employment OutlookNet Employment Outlook
Czech Republic joined the survey in Q2 2008 No bar indicates Net Employment Outlook of zero
20082007 2009 2010 2011 2012 2013 2014 2015 2016  2017
-20
-10
0
10
20
30
40
50
60
Finland +1 (+4)%
Finland joined the survey in Q4 2012 No bar indicates Net Employment Outlook of zero
20082007 2009 2010 2011 2012 2013 2014 2015 2016  2017
Seasonally Adjusted OutlookSeasonally Adjusted OutlookNet Employment OutlookNet Employment Outlook
-20
-10
0
10
20
30
40
50
60
ManpowerGroup Employment Outlook Survey 19
France +1 (+2)%
Seasonally Adjusted OutlookSeasonally Adjusted OutlookNet Employment OutlookNet Employment Outlook
No bar indicates Net Employment Outlook of zero
20082007 2009 2010 2011 2012 2013 2014 2015 2016  2017
-20
-10
0
10
20
30
40
50
60
Germany +4 (+7)%
Seasonally Adjusted OutlookSeasonally Adjusted OutlookNet Employment OutlookNet Employment Outlook
No bar indicates Net Employment Outlook of zero
20082007 2009 2010 2011 2012 2013 2014 2015 2016 2017
-20
-10
0
10
20
30
40
50
60
Greece +2 (+7)%
20082007 2009 2010 2011 2012 2013 2014 2015 2016  2017
Seasonally Adjusted OutlookSeasonally Adjusted OutlookNet Employment OutlookNet Employment Outlook
Greece joined the survey in Q2 2008 No bar indicates Net Employment Outlook of zero
-20
-10
0
10
20
30
40
50
60
Hungary +15 (+17)%
Seasonally Adjusted OutlookSeasonally Adjusted OutlookNet Employment OutlookNet Employment Outlook
Hungary joined the survey in Q3 2009 No bar indicates Net Employment Outlook of zero
20082007 2009 2010 2011 2012 2013 2014 2015 2016  2017
-20
-10
0
10
20
30
40
50
60
20 ManpowerGroup Employment Outlook Survey
Ireland +4 (+5)%
Seasonally Adjusted OutlookSeasonally Adjusted OutlookNet Employment OutlookNet Employment Outlook
No bar indicates Net Employment Outlook of zero
20082007 2009 2010 2011 2012 2013 2014 2015 2016  2017
-20
-10
0
10
20
30
40
50
60
Israel +7 (+10)%
Israel joined the survey in Q4 2011 No bar indicates Net Employment Outlook of zero
20082007 2009 2010 2011 2012 2013 2014 2015 2016  2017
Seasonally Adjusted OutlookSeasonally Adjusted OutlookNet Employment OutlookNet Employment Outlook
-20
-10
0
10
20
30
40
50
60
Italy -2 (0)%
Seasonally Adjusted OutlookSeasonally Adjusted OutlookNet Employment OutlookNet Employment Outlook
No bar indicates Net Employment Outlook of zero
20082007 2009 2010 2011 2012 2013 2014 2015 2016  2017
-20
-10
0
10
20
30
40
50
60
Netherlands +5 (+5)%
Seasonally Adjusted OutlookSeasonally Adjusted OutlookNet Employment OutlookNet Employment Outlook
No bar indicates Net Employment Outlook of zero
20082007 2009 2010 2011 2012 2013 2014 2015 2016  2017
-20
-10
0
10
20
30
40
50
60
ManpowerGroup Employment Outlook Survey 21
Norway +3 (+3)%
Seasonally Adjusted OutlookSeasonally Adjusted OutlookNet Employment OutlookNet Employment Outlook
No bar indicates Net Employment Outlook of zero
20082007 2009 2010 2011 2012 2013 2014 2015 2016  2017
-20
-10
0
10
20
30
40
50
60
Poland +4 (+9)%
Seasonally Adjusted OutlookSeasonally Adjusted OutlookNet Employment OutlookNet Employment Outlook
Poland joined the survey in Q2 2008 No bar indicates Net Employment Outlook of zero
20082007 2009 2010 2011 2012 2013 2014 2015 2016  2017
-20
-10
0
10
20
30
40
50
60
Portugal +5%
Net Employment OutlookNet Employment Outlook
Portugal joined the survey in Q3 2016 No bar indicates Net Employment Outlook of zero
20082007 2009 2010 2011 2012 2013 2014 2015 2016  2017
-20
-10
0
10
20
30
40
50
60
Romania +6 (+15)%
Seasonally Adjusted OutlookSeasonally Adjusted OutlookNet Employment OutlookNet Employment Outlook
Romania joined the survey in Q2 2008 No bar indicates Net Employment Outlook of zero
20082007 2009 2010 2011 2012 2013 2014 2015 2016  2017
-20
-10
0
10
20
30
40
50
60
22 ManpowerGroup Employment Outlook Survey
Slovenia +13 (+17)%
Slovenia joined the survey in Q1 2011 No bar indicates Net Employment Outlook of zero
20082007 2009 2010 2011 2012 2013 2014 2015 2016  2017
Seasonally Adjusted OutlookSeasonally Adjusted OutlookNet Employment OutlookNet Employment Outlook
-20
-10
0
10
20
30
40
50
60
South Africa +8 (+7)%
Seasonally Adjusted OutlookSeasonally Adjusted OutlookNet Employment OutlookNet Employment Outlook
No bar indicates Net Employment Outlook of zero
20082007 2009 2010 2011 2012 2013 2014 2015 2016 2017
-20
-10
0
10
20
30
40
50
60
Spain +1 (+3)%
Seasonally Adjusted OutlookSeasonally Adjusted OutlookNet Employment OutlookNet Employment Outlook
No bar indicates Net Employment Outlook of zero
20082007 2009 2010 2011 2012 2013 2014 2015 2016  2017
-20
-10
0
10
20
30
40
50
60
Slovakia +7 (+9)%
Net Employment OutlookNet Employment Outlook
Slovakia joined the survey in Q4 2011 No bar indicates Net Employment Outlook of zero
20082007 2009 2010 2011 2012 2013 2014 2015 2016 2017
Seasonally Adjusted OutlookSeasonally Adjusted Outlook
-20
-10
0
10
20
30
40
50
60
ManpowerGroup Employment Outlook Survey 23
Switzerland -3 (-2)%
Seasonally Adjusted OutlookSeasonally Adjusted OutlookNet Employment OutlookNet Employment Outlook
No bar indicates Net Employment Outlook of zero
20082007 2009 2010 2011 2012 2013 2014 2015 2016  2017
-20
-10
0
10
20
30
40
50
60
Turkey +5 (+10)%
Turkey joined the survey in Q1 2011 No bar indicates Net Employment Outlook of zero
20082007 2009 2010 2011 2012 2013 2014 2015 2016  2017
Seasonally Adjusted OutlookSeasonally Adjusted OutlookNet Employment OutlookNet Employment Outlook
-20
-10
0
10
20
30
40
50
60
United Kingdom +6 (+7)%
Seasonally Adjusted OutlookSeasonally Adjusted OutlookNet Employment OutlookNet Employment Outlook
No bar indicates Net Employment Outlook of zero
20082007 2009 2010 2011 2012 2013 2014 2015 2016  2017
-20
-10
0
10
20
30
40
50
60
Sweden +6 (+7)%
Seasonally Adjusted OutlookSeasonally Adjusted OutlookNet Employment OutlookNet Employment Outlook
No bar indicates Net Employment Outlook of zero
20082007 2009 2010 2011 2012 2013 2014 2015 2016  2017
-20
-10
0
10
20
30
40
50
60
24 ManpowerGroup Employment Outlook Survey
ManpowerGroup interviewed over 23,000 employers
from 10 countries throughout North, Central and
South America for the Quarter 1 2017 survey. First-
quarter payrolls are expected to grow in all countries
except Brazil.
The region’s most optimistic hiring plans are reported
in Guatemala and the U.S. with approximately one of
every five employers in both countries expecting to
add to their payrolls in the January-March time frame.
Employer confidence in the U.S. is strongest in the
Leisure & Hospitality sector with upbeat forecasts
also reported in the Wholesale & Retail Trade and
Transportation & Utilities sectors. In Guatemala one
of every four employers surveyed in the Manufacturing
sector plans to hire, boosting that sector’s forecast
to its most optimistic level since early 2010.
Opportunities for Canadian job seekers are expected
to be the strongest in three years. Public Administration
sector employers report the first quarter’s most active
hiring plans and the forecast climbs to its most
optimistic level since Quarter 4 2008. Increasingly
favourable forecasts are also reported in both the
Durable and Non-Durable Manufacturing sectors, as
the weak Canadian dollar is expected to boost U.S.
demand for manufactured output.
In Mexico, employer confidence remains upbeat with
workforce gains expected in all industry sectors and
regions. The strongest hiring intentions are reported in
both the Transport & Communications sector and the
Manufacturing sector, where anticipated job gains are
boosted in large part by automotive industry hiring plans.
Meanwhile, the hiring pace in Costa Rica is expected
to remain steady through the first three months of the
International Comparisons – Americas
year with upbeat forecasts reported in most industry
sectors and regions. Outlooks are also positive across
Panama’s industry sectors, but hiring is expected to be
moderately slower in comparison to year-ago levels.
Colombia’s employers anticipate some opportunities
for job seekers in the next three months. However, the
outlook dips for the third consecutive quarter to its
least optimistic level since Quarter 3 2009, weighed
down by the weakest Services sector forecast
reported since the survey was launched in Quarter 4
2008 and the gloomiest Mining sector forecast since
this sector began reporting separately in 2013.
Hiring plans are uniformly positive across Peru’s
industry sectors and regions. However, despite sharp
year-over-year gains in the Construction and Mining
sectors, overall hiring activity is expected to be little
changed when compared to the prior quarter and last
year at this time.
High inflation continues to temper employer
confidence in Argentina. But the overall forecast
remains cautiously optimistic with payrolls expected
to grow in most industry sectors and regions. The
Agriculture sector forecast is the strongest in more
than five years following four consecutive quarters
of growth and expectations of a record grain harvest.
Once again Brazilian employers report the weakest
hiring plans across the region, as well as across
the globe, and the forecast remains mired in
negative territory for the eighth consecutive quarter.
Prospects for job seekers in the Construction sector
remain dim, and the Services sector forecast grows
more negative following steep quarter-over-quarter
and year-over-year declines.
Argentina +7 (+6)%
Seasonally Adjusted OutlookSeasonally Adjusted OutlookNet Employment OutlookNet Employment Outlook
No bar indicates Net Employment Outlook of zero
20082007 2009 2010 2011 2012 2013 2014 2015 2016  2017
-20
-10
0
10
20
30
40
50
60
ManpowerGroup Employment Outlook Survey 25
Brazil -8 (-9)%
Seasonally Adjusted OutlookSeasonally Adjusted OutlookNet Employment OutlookNet Employment Outlook
Brazil joined the survey in Q4 2009 No bar indicates Net Employment Outlook of zero
20082007 2009 2010 2011 2012 2013 2014 2015 2016  2017
-20
-10
0
10
20
30
40
50
60
Canada +6 (+11)%
Seasonally Adjusted OutlookNet Employment Outlook
No bar indicates Net Employment Outlook of zero
20082007 2009 2010 2011 2012 2013 2014 2015 2016  2017
-20
-10
0
10
20
30
40
50
60
Colombia +6 (+8)%
Seasonally Adjusted OutlookSeasonally Adjusted OutlookNet Employment OutlookNet Employment Outlook
Colombia joined the survey in Q4 2008 No bar indicates Net Employment Outlook of zero
20082007 2009 2010 2011 2012 2013 2014 2015 2016 2017
-20
-10
0
10
20
30
40
50
60
Costa Rica +16 (+12)%
Seasonally Adjusted OutlookSeasonally Adjusted OutlookNet Employment OutlookNet Employment Outlook
No bar indicates Net Employment Outlook of zero
20082007 2009 2010 2011 2012 2013 2014 2015 2016  2017
-20
-10
0
10
20
30
40
50
60
26 ManpowerGroup Employment Outlook Survey
Guatemala +16 (+16)%
Seasonally Adjusted OutlookSeasonally Adjusted OutlookNet Employment OutlookNet Employment Outlook
Guatemala joined the survey in Q2 2008 No bar indicates Net Employment Outlook of zero
20082007 2009 2010 2011 2012 2013 2014 2015 2016  2017
-20
-10
0
10
20
30
40
50
60
Mexico +12 (+14)%
Seasonally Adjusted OutlookSeasonally Adjusted OutlookNet Employment OutlookNet Employment Outlook
No bar indicates Net Employment Outlook of zero
20082007 2009 2010 2011 2012 2013 2014 2015 2016 2017
-20
-10
0
10
20
30
40
50
60
Panama +8 (+8)%
Seasonally Adjusted OutlookSeasonally Adjusted OutlookNet Employment OutlookNet Employment Outlook
Panama joined the survey in Q2 2010 No bar indicates Net Employment Outlook of zero
20082007 2009 2010 2011 2012 2013 2014 2015 2016  2017
-20
-10
0
10
20
30
40
50
60
Peru +7 (+7)%
Seasonally Adjusted OutlookSeasonally Adjusted OutlookNet Employment OutlookNet Employment Outlook
No bar indicates Net Employment Outlook of zero
20082007 2009 2010 2011 2012 2013 2014 2015 2016  2017
-20
-10
0
10
20
30
40
50
60
ManpowerGroup Employment Outlook Survey 27
+13 (+16)%United States of America
Seasonally Adjusted OutlookSeasonally Adjusted OutlookNet Employment OutlookNet Employment Outlook
No bar indicates Net Employment Outlook of zero
20082007 2009 2010 2011 2012 2013 2014 2015 2016  2017
-20
-10
0
10
20
30
40
50
60
28 ManpowerGroup Employment Outlook Survey
Nearly 15,000 employers were interviewed in the Asia
Pacific region. Employers in each of the eight countries
and territories intend to add to their workforces
through the first three months of the year, although
hiring expectations vary widely.
Taiwan’s employers report the region’s strongest
first-quarter hiring intentions as well as the most
optimistic outlook among the survey’s 43 participating
countries and territories. Buoyed by expectations of
continued export growth and improving private
consumption figures, one of every four Taiwanese
employers expect to add to their workforces in the
January-March time frame.
India’s hiring pace is expected to slow for the fourth
consecutive quarter, and employer optimism dips
to its least optimistic level since Quarter 3 2013.
However, more than one in five Indian employers
tell us they intend to add to their payrolls through
the next three months. As a result, India’s hiring pace
is expected to be stronger than all countries and
territories participating in the survey except Taiwan.
Employers predict solid levels of job growth in each
of India’s seven industry sectors, with particular
emphasis on knowledgeable workers across virtually
every industry sector.
Opportunities for job seekers in Japan remain strong,
and a quarter of all employers anticipate adding
to their payrolls in the January-March time frame.
However, securing the talent they need continues
to prove an elusive goal for most employers in Japan.
As ManpowerGroup’s recent Talent Shortage Survey
reveals, employers remain challenged by a shrinking
pool of available talent and few prospects that a
solution to the shortage will be found soon.
International Comparisons – Asia Pacific
Employers in China remain cautiously optimistic with
some payroll growth forecast in all industry sectors
and regions. However, nearly two thirds of survey
respondents replied with “Don’t Know” when asked
to share their hiring plans for the January-March time
frame. This uncertainty may signal an expanding effort
to maintain workforce flexibility and adjust payrolls as
needed as the country continues its transition to a
more services-oriented economy.
Australia’s efforts to emphasise non-mining sectors
of the economy appear to be maintaining traction.
Employers across all sectors and regions expect
varying degrees of payroll gains, with the most
opportunities for job seekers expected in the Services
and Finance, Insurance & Real Estate sectors.
Employer hiring plans are also uniformly positive in
New Zealand. The forecast indicates that the most
active labour markets will be in the Transportation
& Utilities and Mining & Construction sectors.
Elsewhere, the hiring climate in Hong Kong is
expected to remain favourable despite an overall
slowdown in retail and tourism activity. Services sector
employers report the first quarter’s strongest outlook,
with steady hiring also expected in the Mining &
Construction sector, where a quarter of the employers
surveyed say they intend to add to payrolls in the
January-March period.
Employers in most of Singapore’s industry sectors
expect varying degrees of job growth. The exception
is the Wholesale & Retail Trade sector, where the
outlook has gradually declined for four consecutive
quarters and employers report their first negative
forecast since the 2009 recession.
Australia +8 (+9)%
Seasonally Adjusted OutlookSeasonally Adjusted OutlookNet Employment OutlookNet Employment Outlook
No bar indicates Net Employment Outlook of zero
20082007 2009 2010 2011 2012 2013 2014 2015 2016  2017
-20
-10
0
10
20
30
40
50
60
ManpowerGroup Employment Outlook Survey 29
+4 (+4)%China           
Seasonally Adjusted OutlookSeasonally Adjusted OutlookNet Employment OutlookNet Employment Outlook
No bar indicates Net Employment Outlook of zero
20082007 2009 2010 2011 2012 2013 2014 2015 2016  2017
-20
-10
0
10
20
30
40
50
60
Hong Kong +13 (+13)%
Seasonally Adjusted OutlookSeasonally Adjusted OutlookNet Employment OutlookNet Employment Outlook
No bar indicates Net Employment Outlook of zero
20082007 2009 2010 2011 2012 2013 2014 2015 2016  2017
-20
-10
0
10
20
30
40
50
60
+21 (+24)%India           
Seasonally Adjusted OutlookSeasonally Adjusted OutlookNet Employment OutlookNet Employment Outlook
No bar indicates Net Employment Outlook of zero
20082007 2009 2010 2011 2012 2013 2014 2015 2016  2017
-20
-10
0
10
20
30
40
50
60
Japan +22 (+23)%
Seasonally Adjusted OutlookSeasonally Adjusted OutlookNet Employment OutlookNet Employment Outlook
No bar indicates Net Employment Outlook of zero
20082007 2009 2010 2011 2012 2013 2014 2015 2016  2017
-20
-10
0
10
20
30
40
50
60
30 ManpowerGroup Employment Outlook Survey
New Zealand +15 (+15)%
Seasonally Adjusted OutlookSeasonally Adjusted OutlookNet Employment OutlookNet Employment Outlook
No bar indicates Net Employment Outlook of zero
20082007 2009 2010 2011 2012 2013 2014 2015 2016  2017
-20
-10
0
10
20
30
40
50
60
Singapore +8 (+9)%
Seasonally Adjusted OutlookSeasonally Adjusted OutlookNet Employment OutlookNet Employment Outlook
No bar indicates Net Employment Outlook of zero
20082007 2009 2010 2011 2012 2013 2014 2015 2016  2017
-50
-40
-30
-20
-10
0
10
20
30
40
50
60
70
Taiwan +20 (+25)%
Seasonally Adjusted OutlookSeasonally Adjusted OutlookNet Employment OutlookNet Employment Outlook
No bar indicates Net Employment Outlook of zero
20082007 2009 2010 2011 2012 2013 2014 2015 2016  2017
-20
-10
0
10
20
30
40
50
60
ManpowerGroup Employment Outlook Survey 31
The ManpowerGroup Employment Outlook Survey is
conducted quarterly to measure employers’ intentions
to increase or decrease the number of employees
in their workforces during the next quarter.
ManpowerGroup’s comprehensive forecast of
employer hiring plans has been running for more
than 50 years and is one of the most trusted surveys
of employment activity in the world. Various factors
underpin the success of the ManpowerGroup
Employment Outlook Survey:
Unique: It is unparalleled in its size, scope, longevity
and area of focus.
Projective: The ManpowerGroup Employment
Outlook Survey is the most extensive, forward-looking
employment survey in the world, asking employers to
forecast employment over the next quarter. In contrast,
other surveys and studies focus on retrospective data
to report on what occurred in the past.
Independent: The survey is conducted with a
representative sample of employers from throughout
the countries and territories in which it is conducted.
The survey participants are not derived from
ManpowerGroup’s customer base.
Robust: The survey is based on interviews with
nearly 59,000 public and private employers across
43 countries and territories to measure anticipated
employment trends each quarter. This sample allows
for analysis to be performed across specific sectors
and regions to provide more detailed information.
Focused: For more than five decades the survey has
derived all of its information from a single question:
For the Quarter 1 2017 research, all employers
participating in the survey worldwide are asked
the same question: “How do you anticipate total
employment at your location to change in the three
months to the end of March 2017 as compared
to the current quarter?”
About the Survey
Methodology
The ManpowerGroup Employment Outlook Survey
is conducted using a validated methodology, in
accordance with the highest standards in market
research. The survey has been structured to be
representative of each national economy. The margin
of error for all national, regional and global data is not
greater than +/- 3.9%.
In the UK, the national survey includes 2,104 employers.
With this number of interviews, the margin of error for
the UK survey is +/- 2.1%.
Net Employment Outlook
Throughout this report, we use the term “Net
Employment Outlook.” This figure is derived by taking
the percentage of employers anticipating an increase
in hiring activity and subtracting from this the
percentage of employers expecting to see a decrease
in employment at their location in the next quarter.
The result of this calculation is the Net Employment
Outlook. Net Employment Outlooks for countries and
territories that have accumulated at least 17 quarters
of data are reported in a seasonally adjusted format
unless otherwise stated.
Seasonal adjustments have been applied to the
data for all participating countries except Portugal.
ManpowerGroup intends to add seasonal adjustments
to the Portuguese data in the future, as more historical
data is compiled. Note that in Quarter 2 2008,
ManpowerGroup adopted the TRAMO-SEATS method
of seasonal adjustment for data.
32 ManpowerGroup Employment Outlook Survey
ManpowerGroup®
(NYSE: MAN) is the world’s
workforce expert, creating innovative workforce
solutions for nearly 70 years. As workforce experts,
we connect more than 600,000 people to meaningful
work across a wide range of skills and industries every
day. Through our ManpowerGroup family of brands
– Manpower®
, Experis®
, Right Management®
and
ManpowerGroup®
Solutions – we help more than
400,000 clients in 80 countries and territories address
their critical talent needs, providing comprehensive
solutions to resource, manage and develop talent.
In 2016, ManpowerGroup was named one of the
World’s Most Ethical Companies for the sixth
consecutive year and one of Fortune’s Most Admired
Companies, confirming our position as the most
trusted and admired brand in the industry. See how
ManpowerGroup makes powering the world of work
humanly possible: www.manpowergroup.com.
About ManpowerGroupTM
About Manpower UK
Manpower is the global leader in contingent and
permanent recruitment workforce solutions. It is part
of ManpowerGroup, the world’s workforce expert,
which creates and delivers high-impact solutions that
enable clients to achieve their business goals and
enhance their competitiveness.
With a network of offices in cities across the country,
Manpower has provided organisations in the UK with
a continuum of staffing solutions from the incidental
to the strategic for nearly 60 years, working with
businesses such as BT, IBM, Royal Mail and Xerox
to help them win.
In the Human Age, where talent has replaced access to
capital as the key competitive differentiator, Manpower
UK leverages its trusted brand to develop a deep talent
pool, providing clients with access to the people they
need, fast.
Manpower UK creates powerful connections between
organisations and the talent they need to enhance their
competitiveness and unleash their workforce potential.
By creating these powerful connections, we help
everybody achieve more than they imagined, and
power the world of work.
For more information, see manpower.co.uk
ManpowerGroup, Capital Court, Windsor Street, Uxbridge, Middlesex UB8 1AB
T: 01895 205 200 F: 01895 205 201
manpowergroup.co.uk
© 2016, ManpowerGroup. All rights reserved.

meos_q117_brochure

  • 1.
  • 2.
    The ManpowerGroup Employment Outlook Surveyfor the first quarter 2017 was conducted by interviewing a representative sample of 2,104 employers in the UK. All survey participants were asked: “How do you anticipate total employment at your location to change in the three months to the end of March 2017 as compared to the current quarter?” Contents UK Employment Outlook 1 Organisation-Size Comparisons Regional Comparisons Sector Comparisons Global Employment Outlook 15 International Comparisons – EMEA International Comparisons – Americas International Comparisons – Asia Pacific About the Survey 31 About ManpowerGroup® 32 UnitedKingdom Employment Outlook
  • 3.
    ManpowerGroup Employment OutlookSurvey 1 Increase Decrease No Change Don’t Know Net Employment Outlook Seasonally Adjusted % % % % % % Apr-June 2016 July-Sep 2016 Oct-Dec 2016 Jan-Mar 2017 Jan-Mar 2016 9 2 88 1 7 6 10 3 86 1 7 5 8 4 87 1 4 5 9 3 87 1 6 7 8 3 86 3 5 6 Seasonally Adjusted OutlookSeasonally Adjusted OutlookNet Employment OutlookNet Employment Outlook No bar indicates Net Employment Outlook of zero ’95 ’96 ’97 ’98 ’99 ’00 ’01 ’02 ’03 ’04 ’05 ’06 ’07 ’08 ’09 ’10 ’11 ’12 ’13 ’14 ’15 ’16 ’17 50 40 30 20 10 0 -10 -20 UK Employment Outlook UK employers report some opportunities for job seekers in the upcoming quarter. While 9% of employers forecast an increase in staffing levels, 3% anticipate a decrease and 87% expect no change, resulting in a Net Employment Outlook of +6%. Once the data is adjusted to allow for seasonal variation, the outlook stands at +7%. Hiring prospects are two percentage points stronger, when compared with the previous quarter, while remaining relatively stable year-over-year. Throughout this report, we use the term “Net Employment Outlook”. This figure is derived by taking the percentage of employers anticipating total employment to increase and subtracting from this the percentage expecting to see a decrease in employment at their location in the next quarter. The result of this calculation is the Net Employment Outlook. From this point forward, all data discussed in the commentary is seasonally adjusted, unless stated otherwise.
  • 4.
    2 ManpowerGroup EmploymentOutlook Survey Participating employers are categorised into one of four organisation sizes: Micro businesses have less than 10 employees; Small businesses have 10-49 employees; Medium businesses have 50-199 employees; and Large businesses have 200 or more employees. Payrolls are forecast to grow in all four organisation size categories during Quarter 1 2017. The strongest hiring activity is anticipated by Large- and Medium-size employers, who report Net Employment Outlooks of +13%. Small employers expect a steady increase in employment levels, reporting an outlook of +12%, while the outlook for Micro employers stands at +4%. Organisation-Size Comparisons Quarter-over-quarter, Small employers report an improvement of four percentage points, while outlooks are two percentage points stronger in both the Micro- and Medium-size categories. Meanwhile, Large employers report relatively stable hiring plans. When compared with Quarter 1 2016, Small employers report a slight improvement of two percentage points but the outlook for Large firms is two percentage points weaker. Micro employers report no change and Medium employers report relatively stable hiring plans. IncreaseOrganisation-Size Decrease No Change Don’t Know Net Employment Outlook Seasonally Adjusted % % % % % % Large-Size 200 or more Medium-Size 50-199 Small-Size 10-49 Micro-Size fewer than 10 24 9 62 5 15 13 12 5 80 3 7 13 13 3 83 1 10 12 6 3 90 1 3 4 Micro-Size fewer than 10Micro-Size fewer than 10 Graph displays Seasonally Adjusted DataGraph displays Seasonally Adjusted Data Small-Size 10-49Small-Size 10-49 Medium-Size 50-199Medium-Size 50-199 Large-Size 200 or moreLarge-Size 200 or more 2005 2006 2007 2008 2009 2010 2011 2012 2013 2014 2015 2016 2017 -10 0 10 20 30 40 50
  • 5.
    ManpowerGroup Employment OutlookSurvey 3 Employers in all 12 regions forecast an increase in payrolls during Quarter 1 2017. The strongest hiring prospects are reported in the East, with a Net Employment Outlook of +10%. Elsewhere, London employers anticipate a cautiously optimistic hiring pace, reporting an outlook of +9%, while outlooks stand at +8% in the East Midlands, the South West, the West Midlands, Yorkshire & the Humber and Scotland. Meanwhile, the most cautious hiring prospects are reported in Wales and the North West, with outlooks of +2% and +3%, respectively. When compared with the previous quarter, hiring intentions strengthen in nine of the 12 regions. Yorkshire & the Humber employers report the most noteworthy improvement of nine percentage points, while outlooks are seven and five percentage points East East Midlands London North West North East Northern Ireland Scotland South East South West Decrease Q1 2017 Q1 2017 Q4 2016 Q1 2016 Qtr on Qtr Change Q4 2016 to Q1 2017 Yr on Yr Change Q1 2016 to Q1 2017 Increase Q1 2017 % % % % % % % Wales West Midlands Yorkshire & the Humber 1. Number in parentheses is the Net Employment Outlook when adjusted to remove seasonal variations. 6 11 10 8 7 4 7 11 7 2 1 1 2 5 2 3 5 1 4 (8)1 10 (10)1 9 (9)1 6 (7)1 2 (3)1 2 (4)1 4 (8)1 6 (5)1 6 (8)1 11 (8)1 6 (7)1 8 (8)1 5 (5)1 5 (5)1 0 (-1)1 -4 (1)1 1 (3)1 2 (4)1 6 (9)1 7 (8)1 9 (9)1 7 (8)1 10 (11)1 -4 (-2)1 0 (5)1 10 (10)1 6 (8)1 -7 (0)1 4 (3)1 1 (1)1 1 (2)1 -3 (-2)1 2 (5)1 8 (7)1 5 (2)1 4 (4)1 -2 (-1)1 3 (2)1 0 (0)1 -1 (-1)1 -8 (-8)1 6 (6)1 4 (3)1 -4 (-5)1 0 (0)1 7 8 -1 (2)1 4 (4)1 6 (9)1 -5 (-2)1 -7 (-7)1 14 10 4 (8)1 5 (5)1 0 (4)1 -1 (3)1 4 (4)1 13 4 9 (8)1 -1 (-1)1 0 (-1)1 10 (9)1 9 (9)1 Regional Summary stronger in Scotland and Northern Ireland, respectively. However, outlooks weaken in two regions, with declines of two percentage points reported in both the North West and Wales. Year-over-year, hiring prospects improve in five of the 12 regions. The most notable increase of nine percentage points is reported in Yorkshire & the Humber. Elsewhere, the outlook for Northern Ireland is six percentage points stronger while increases of four and three percentage points are reported in the West Midlands and Scotland, respectively. However, hiring plans also weaken in five regions, including the North West with a decline of eight percentage points. Hiring intentions decline by seven percentage points in Wales and are five percentage points weaker in the South East.
  • 6.
    4 ManpowerGroup EmploymentOutlook Survey Staffing levels are expected to increase in eight of the nine industry sectors during the forthcoming quarter. Utilities sector employers anticipate the strongest labour market, reporting a Net Employment Outlook of +13%, while Construction sector employers report cautiously optimistic hiring intentions with an outlook of +9%. Modest payroll gains are forecast for two sectors with outlooks of +7% − the Finance & Business Services sector and the Hotels & Retail sector – and also in the Manufacturing sector where the outlook stands at +6%. Meanwhile, Transport & Communications sector employers expect an uncertain hiring climate, reporting an outlook of -1%. Quarter-over-quarter, hiring prospects strengthen in seven of the nine industry sectors. The most noteworthy improvements of seven and five Agriculture Community & Social Construction Hotels & Retail Finance & Business Services Manufacturing Mining Transport & Communications Utilities Decrease Q1 2017 Q1 2017 Q4 2016 Q1 2016 Qtr on Qtr Change Q4 2016 to Q1 2017 Yr on Yr Change Q1 2016 to Q1 2017 Increase Q1 2017 % % % % % % % 1. Number in parentheses is the Net Employment Outlook when adjusted to remove seasonal variations. 9 7 8 10 8 9 4 5 15 4 5 0 4 3 4 4 7 2 5 (4)1 2 (3)1 8 (9)1 6 (7)1 5 (7)1 5 (6)1 0 (2)1 -2 (-1)1 13 (13)1 0 (2)1 5 (7)1 2 (4)1 5 (5)1 6 (6)1 2 (5)1 0 (1)1 -2 (1)1 5 (6)1 5 (7)1 -2 (-1)1 -3 (-1)1 8 (10)1 3 (5)1 4 (5)1 -1 (1)1 8 (8)1 3 (3)1 5 (2)1 -3 (-4)1 6 (5)1 1 (2)1 -1 (1)1 3 (1)1 0 (1)1 0 (-2)1 8 (7)1 0 (-3)1 4 (4)1 11 (10)1 -2 (-3)1 2 (2)1 1 (1)1 1 (1)1 -10 (-9)1 10 (10)1 Sector Summary percentage points are reported in the Utilities sector and the Construction sector, respectively. However, hiring plans weaken in two sectors, with outlooks declining by four and two percentage points in the Agriculture sector and the Transport & Communications sector, respectively. Year-over-year, outlooks improve in six of the nine industry sectors. Considerably stronger hiring intentions are reported in both the Construction sector and the Utilities sector, with increases of 10 percentage points, while Agriculture sector employers report an improvement of four percentage points. Elsewhere, hiring intentions decline in three sectors, including the Transport & Communications sector where employers report a considerable decrease of nine percentage points.
  • 7.
    ManpowerGroup Employment OutlookSurvey 5 Job seekers in all 12 regions can expect positive hiring activity during the upcoming quarter, according to UK employers. The strongest labour market is anticipated in the East, where the Net Employment Outlook stands at +10%, while London employers anticipate a fair hiring climate, reporting an outlook of +9%. Elsewhere, outlooks of +8% are reported in the East Midlands, the South West, the West Midlands, Yorkshire & the Humber and Scotland, while the outlook for the North East stands at +7%. The most cautious hiring prospects are reported in Wales, where the outlook is +2%, while employers report modest hiring plans in both the North West and Northern Ireland, with outlooks of +3% and +4%, respectively. When compared with Quarter 4 2016, hiring intentions strengthen in nine of the 12 regions. Yorkshire & the Humber employers report the most notable increase of nine percentage points, while outlooks are seven -5 15 East East Midlands London National Average North East North West Northern Ireland Scotland South East South West Wales West Midlands Yorkshire & the Humber 10 10 8 4 9 9 7 6 7 6 3 2 4 2 8 4 5 6 8 6 2 -1 8 4 8 9 Net Employment OutlookNet Employment Outlook Seasonally Adjusted OutlookSeasonally Adjusted Outlook 0 5 10 Regional Comparisons and five percentage points stronger in Scotland and Northern Ireland, respectively. South West employers report an increase of four percentage points and outlooks are three percentage points stronger in both the West Midlands and the East. However, hiring plans are two percentage points weaker in the North West and Wales. Year-over-year, outlooks improve in five of the 12 regions, including Yorkshire & the Humber, where employers report an increase of nine percentage points. The outlook for Northern Ireland is six percentage points stronger, while increases of four and three percentage points are reported in the West Midlands and Scotland, respectively. However, hiring prospects also weaken in five regions, most notably by eight percentage points in the North West. Elsewhere, hiring intentions decline by seven and five percentage points in Wales and the South East, respectively.
  • 8.
    6 ManpowerGroup EmploymentOutlook Survey East Job seekers can expect an optimistic hiring climate in the upcoming quarter, according to employers who report a Net Employment Outlook of +10%. Hiring intentions improve by three and two percentage points quarter-over-quarter and year-over-year, respectively. East Midlands Reporting a Net Employment Outlook of +8%, employers expect the moderate hiring pace to continue in Quarter 1 2017. Hiring intentions are unchanged when compared with the previous quarter and remain relatively stable year-over-year. Seasonally Adjusted OutlookSeasonally Adjusted OutlookNet Employment OutlookNet Employment Outlook No bar indicates Net Employment Outlook of zero 2001 2002 2003 2004 2005 2006 2007 2008 2009 2010 2011 2012 2013 2014 2015 2016 2017 50 40 30 20 10 0 -10 -20 Seasonally Adjusted OutlookSeasonally Adjusted OutlookNet Employment OutlookNet Employment Outlook No bar indicates Net Employment Outlook of zero 2001 2002 2003 2004 2005 2006 2007 2008 2009 2010 2011 2012 2013 2014 2015 2016 2017 50 40 30 20 10 0 -10 -20 +10 (+10)% +4 (+8)% +9 (+9)% London Employers continue to report cautiously optimistic hiring plans with a Net Employment Outlook of +9% for the January-March period. The outlook remains relatively stable quarter- over-quarter and is unchanged when compared with Quarter 1 2016. Seasonally Adjusted OutlookSeasonally Adjusted OutlookNet Employment OutlookNet Employment Outlook No bar indicates Net Employment Outlook of zero 2001 2002 2003 2004 2005 2006 2007 2008 2009 2010 2011 2012 2013 2014 2015 2016 2017 50 40 30 20 10 0 -10 -20
  • 9.
    ManpowerGroup Employment OutlookSurvey 7 +6 (+7)% North East Some hiring opportunities are forecast for the next three months with employers reporting a Net Employment Outlook of +7%. Hiring prospects improve by two percentage points quarter-over-quarter and remain relatively stable year-over-year. Seasonally Adjusted OutlookSeasonally Adjusted OutlookNet Employment OutlookNet Employment Outlook No bar indicates Net Employment Outlook of zero 2001 2002 2003 2004 2005 2006 2007 2008 2009 2010 2011 2012 2013 2014 2015 2016 2017 50 40 30 20 10 0 -10 -20 North West Reporting a Net Employment Outlook of +3%, employers anticipate slow-paced hiring activity in Quarter 1 2017. Hiring plans are two percentage points weaker when compared with the previous quarter and decline by eight percentage points year-over-year. Northern Ireland Some payroll gains are expected during the next three months. Employers report a Net Employment Outlook of +4%, improving by five and six percentage points quarter-over-quarter and year-over-year, respectively. Seasonally Adjusted OutlookSeasonally Adjusted OutlookNet Employment OutlookNet Employment Outlook No bar indicates Net Employment Outlook of zero 2001 2002 2003 2004 2005 2006 2007 2008 2009 2010 2011 2012 2013 2014 2015 2016 2017 40 30 20 10 0 -10 -20 -30 Seasonally Adjusted OutlookSeasonally Adjusted OutlookNet Employment OutlookNet Employment Outlook Northern Ireland joined the survey in Q2 2003 No bar indicates Net Employment Outlook of zero 2001 2002 2003 2004 2005 2006 2007 2008 2009 2010 2011 2012 2013 2014 2015 2016 2017 50 40 30 20 10 0 -10 -20 +2 (+3)% +2 (+4)%
  • 10.
    8 ManpowerGroup EmploymentOutlook Survey Scotland Employers report the strongest hiring prospects since Quarter 3 2014 with a Net Employment Outlook of +8% for the January-March period. Hiring plans are seven percentage points stronger quarter-over-quarter and increase by three percentage points year-over-year. South East Employers report encouraging signs for job seekers in the upcoming quarter with a Net Employment Outlook of +5%. Hiring prospects improve by two percentage points quarter-over-quarter but are five percentage points weaker year-over-year. Seasonally Adjusted OutlookSeasonally Adjusted OutlookNet Employment OutlookNet Employment Outlook Scotland joined the survey in Q2 2002 No bar indicates Net Employment Outlook of zero 2001 2002 2003 2004 2005 2006 2007 2008 2009 2010 2011 2012 2013 2014 2015 2016 2017 50 40 30 20 10 0 -10 -20 Seasonally Adjusted OutlookSeasonally Adjusted OutlookNet Employment OutlookNet Employment Outlook No bar indicates Net Employment Outlook of zero 2001 2002 2003 2004 2005 2006 2007 2008 2009 2010 2011 2012 2013 2014 2015 2016 2017 50 40 30 20 10 0 -10 -20 +4 (+8)% +6 (+5)% South West Job seekers can expect a fair hiring climate in the first quarter of 2017, according to employers who report a Net Employment Outlook of +8%. Hiring intentions are four percentage points stronger when compared with the previous quarter and are unchanged when compared with Quarter 1 2016. Seasonally Adjusted OutlookSeasonally Adjusted OutlookNet Employment OutlookNet Employment Outlook No bar indicates Net Employment Outlook of zero 2001 2002 2003 2004 2005 2006 2007 2008 2009 2010 2011 2012 2013 2014 2015 2016 2017 40 30 20 10 0 -10 -20 -30 +6 (+8)%
  • 11.
    ManpowerGroup Employment OutlookSurvey 9 Wales With a Net Employment Outlook of +2%, Welsh employers forecast a slight increase in staffing levels during Quarter 1 2017. However, hiring prospects decline by two and seven percentage points quarter-over-quarter and year-over-year, respectively, and the outlook is the weakest reported since Quarter 4 2014. Seasonally Adjusted OutlookSeasonally Adjusted OutlookNet Employment OutlookNet Employment Outlook Wales joined the survey in Q2 2002 No bar indicates Net Employment Outlook of zero 2001 2002 2003 2004 2005 2006 2007 2008 2009 2010 2011 2012 2013 2014 2015 2016 2017 50 40 30 20 10 0 -10 -20 -1 (+2)% West Midlands A moderate hiring pace is anticipated in the January-March time frame, with employers reporting a Net Employment Outlook of +8%. Hiring prospects improve both quarter-over-quarter and year-over-year, increasing by three and four percentage points, respectively. Yorkshire & the Humber With a Net Employment Outlook of +8%, employers forecast the strongest labour market in two years in the forthcoming quarter. The outlook increases by a considerable margin of nine percentage points both quarter-over-quarter and year-over-year. Seasonally Adjusted OutlookSeasonally Adjusted OutlookNet Employment OutlookNet Employment Outlook No bar indicates Net Employment Outlook of zero 2001 2002 2003 2004 2005 2006 2007 2008 2009 2010 2011 2012 2013 2014 2015 2016 2017 50 40 30 20 10 0 -10 -20 Seasonally Adjusted OutlookSeasonally Adjusted OutlookNet Employment OutlookNet Employment Outlook No bar indicates Net Employment Outlook of zero 2001 2002 2003 2004 2005 2006 2007 2008 2009 2010 2011 2012 2013 2014 2015 2016 2017 -20 -10 0 10 20 30 40 50 60 +4 (+8)% +9 (+8)%
  • 12.
    10 ManpowerGroup EmploymentOutlook Survey Employers in eight of the nine industry sectors anticipate an increase in staffing levels during Quarter 1 2017. The strongest labour market is forecast in the Utilities sector, where employers report a Net Employment Outlook of +13%, while Construction sector employers report a cautiously optimistic outlook of +9%. Modest payroll gains are expected in two sectors with outlooks of +7% − the Finance & Business Services sector and the Hotels & Retail sector − while Manufacturing sector employers report an outlook of +6%. Elsewhere, some job growth is forecast by employers in the Community & Social sector and the Agriculture sector, with outlooks of +4% and +3%, respectively. However, Transport & Communications sector employers anticipate a subdued hiring pace with an outlook of -1%. -5 15 Agriculture Community & Social Construction Finance & Business Services Hotels & Retail Manufacturing Mining National Average Transport & Communications Utilities 3 2 4 5 9 8 7 6 7 5 6 5 2 0 7 6 -1 -2 13 13 Net Employment OutlookNet Employment Outlook Seasonally Adjusted OutlookSeasonally Adjusted Outlook 0 5 10 Sector Comparisons Quarter-over-quarter, hiring prospects improve in seven of the nine industry sectors. The most notable increases of seven and five percentage points are reported in the Utilities sector and the Construction sector, respectively. Meanwhile, hiring intentions weaken in two sectors, with outlooks declining by four percentage points for the Agriculture sector and by two percentage points for the Transport & Communications sector. When compared with Quarter 1 2016, outlooks improve in six of the nine industry sectors. Considerable increases of 10 percentage points are reported in both the Construction sector and the Utilities sector, while the outlook for the Agriculture sector is four percentage points stronger. However, hiring plans weaken in three sectors, most notably by nine percentage points in the Transport & Communications sector.
  • 13.
    ManpowerGroup Employment OutlookSurvey 11 Agriculture Job seekers can expect some hiring opportunities in the next three months, according to employers who report a Net Employment Outlook of +3%. While the outlook is four percentage points weaker quarter-over-quarter, employers report a year-over-year improvement of four percentage points. Community & Social With a Net Employment Outlook of +4%, employers anticipate a mild hiring climate in the January-March period. Hiring plans improve by two percentage points when compared with Quarter 4 2016 but are three percentage points weaker year-over-year. Seasonally Adjusted OutlookSeasonally Adjusted OutlookNet Employment OutlookNet Employment Outlook The Agriculture sector joined the survey in Q2 2002 No bar indicates Net Employment Outlook of zero 2001 2002 2003 2004 2005 2006 2007 2008 2009 2010 2011 2012 2013 2014 2015 2016 2017 -30 -20 -10 0 10 20 30 40 50 60 Seasonally Adjusted OutlookNet Employment Outlook No bar indicates Net Employment Outlook of zero 2001 2002 2003 2004 2005 2006 2007 2008 2009 2010 2011 2012 2013 2014 2015 2016 2017 -30 -20 -10 0 10 20 30 40 50 60 +5 (+4)% +2 (+3)% Construction Employers report cautiously optimistic hiring plans for the January-March time frame with a Net Employment Outlook of +9%. Hiring intentions improve by five percentage points when compared with the previous quarter and are 10 percentage points stronger year-over-year. Seasonally Adjusted OutlookSeasonally Adjusted OutlookNet Employment OutlookNet Employment Outlook No bar indicates Net Employment Outlook of zero 2001 2002 2003 2004 2005 2006 2007 2008 2009 2010 2011 2012 2013 2014 2015 2016 2017 -30 -20 -10 0 10 20 30 40 50 60 +8 (+9)%
  • 14.
    12 ManpowerGroup EmploymentOutlook Survey Finance & Business Services A fair hiring climate is forecast for the coming quarter with employers reporting a Net Employment Outlook of +7%. Hiring plans improve by two percentage points when compared with the previous quarter but are three percentage points weaker year-over-year. Finance sub-sector employers anticipate the weakest labour market since Quarter 3 2014, reporting a Net Employment Outlook of -3% for the next three months. Hiring prospects remain relatively stable when compared with the previous quarter but decline by a considerable margin of 17 percentage points year-over-year. In the Business Services sub-sector, employers report cautiously optimistic hiring plans. The Net Employment Outlook of +9% is four percentage points stronger quarter-over-quarter and remains relatively stable when compared with Quarter 1 2016. Seasonally Adjusted OutlookSeasonally Adjusted OutlookNet Employment OutlookNet Employment Outlook No bar indicates Net Employment Outlook of zero 2001 2002 2003 2004 2005 2006 2007 2008 2009 2010 2011 2012 2013 2014 2015 2016 2017 -30 -20 -10 0 10 20 30 40 50 60 +6 (+7)% Hotels & Retail Employers report encouraging signs for job seekers in the next three months. The Net Employment Outlook of +7% remains relatively stable when compared with the previous quarter and is two percentage points stronger year-over-year. B2B sub-sector employers anticipate some hiring opportunities in the January-March time frame, reporting a Net Employment Outlook of +6%. The outlook improves by four and seven percentage points quarter-over-quarter and year-over-year, respectively. In the B2C sub-sector, job seekers can expect a modest hiring pace, according to employers who report a Net Employment Outlook of +4% for Quarter 1 2017. However, hiring prospects decline by four percentage points quarter-over-quarter and are two percentage points weaker year-over-year. Hotels & Restaurants sub-sector employers forecast steady payroll gains during the first quarter of 2017, reporting a Net Employment Outlook of +13%. The outlook strengthens both quarter-over-quarter and year-over-year, increasing by nine and three percentage points, respectively. Seasonally Adjusted OutlookSeasonally Adjusted OutlookNet Employment OutlookNet Employment Outlook No bar indicates Net Employment Outlook of zero 2001 2002 2003 2004 2005 2006 2007 2008 2009 2010 2011 2012 2013 2014 2015 2016 2017 -30 -20 -10 0 10 20 30 40 50 60 +5 (+7)%
  • 15.
    ManpowerGroup Employment OutlookSurvey 13 Manufacturing Job seekers can expect a moderate hiring pace in Quarter 1 2017, according to employers who report a Net Employment Outlook of +6%. Hiring intentions remain relatively stable both quarter-over-quarter and year-over-year. Seasonally Adjusted OutlookSeasonally Adjusted OutlookNet Employment OutlookNet Employment Outlook No bar indicates Net Employment Outlook of zero 2001 2002 2003 2004 2005 2006 2007 2008 2009 2010 2011 2012 2013 2014 2015 2016 2017 -30 -20 -10 0 10 20 30 40 50 60 +5 (+6)% Mining Employers anticipate a quiet labour market in the forthcoming quarter, reporting a Net Employment Outlook of +2%. The outlook remains relatively stable both quarter-over-quarter and year-over-year. Seasonally Adjusted OutlookSeasonally Adjusted OutlookNet Employment OutlookNet Employment Outlook The Mining sector joined the survey in Q2 2002 No bar indicates Net Employment Outlook of zero 2001 2002 2003 2004 2005 2006 2007 2008 2009 2010 2011 2012 2013 2014 2015 2016 2017 -30 -20 -10 0 10 20 30 40 50 60 0 (+2)%
  • 16.
    14 ManpowerGroup EmploymentOutlook Survey Utilities Reporting a Net Employment Outlook of +13%, employers anticipate a steady hiring pace in the first quarter of 2017. Hiring prospects improve by seven percentage points quarter-over- quarter and are considerably stronger year-over-year, increasing by 10 percentage points. Transport & Communications Job seekers can expect to face the weakest – and first negative – labour market since Quarter 4 2012 in the coming quarter, according to employers who report a Net Employment Outlook of -1%. Hiring prospects are two percentage points weaker quarter-over-quarter and decline by nine percentage points when compared with Quarter 1 2016. In the Transport sub-sector employers expect the subdued hiring climate to continue in the upcoming quarter, reporting a Net Employment Outlook of -1%. The outlook is unchanged when compared with the previous quarter but declines by nine percentage points year-over-year. Employers in the Telecoms sub-sector anticipate subdued hiring activity in Quarter 1 2017, reporting a third consecutive negative Net Employment Outlook, standing at -2%. While remaining relatively stable quarter-over-quarter, hiring plans decline by 17 percentage points year-over-year. Seasonally Adjusted OutlookSeasonally Adjusted OutlookNet Employment OutlookNet Employment Outlook The Utilities sector joined the survey in Q2 2002 No bar indicates Net Employment Outlook of zero 2001 2002 2003 2004 2005 2006 2007 2008 2009 2010 2011 2012 2013 2014 2015 2016 2017 -30 -20 -10 0 10 20 30 40 50 60 Seasonally Adjusted OutlookSeasonally Adjusted OutlookNet Employment OutlookNet Employment Outlook No bar indicates Net Employment Outlook of zero 2001 2002 2003 2004 2005 2006 2007 2008 2009 2010 2011 2012 2013 2014 2015 2016 2017 -30 -20 -10 0 10 20 30 40 50 60 +13 (+13)% -2 (-1)%
  • 17.
    ManpowerGroup Employment OutlookSurvey 15 % †EMEA – Europe, Middle East and Africa. 1. Number in parentheses is the Net Employment Outlook when adjusted to remove the impact of seasonal variations in hiring activity. Please note that this data is not available for all countries as a minimum of 17 quarters worth of data is required.  * Indicates unadjusted data. Quarter 1 2017 Net Employment Outlook -15 -10 -5 0 5 10 15 20 25 30 35 40 45 -15 -10 -5 0 5 10 15 20 25 30 35 40 45 Taiwan India Japan Hungary Slovenia Guatemala United States New Zealand Romania Mexico Hong Kong Costa Rica Bulgaria Canada Israel Turkey Australia Poland Singapore Slovakia Colombia Panama Austria Germany Greece Peru South Africa Sweden United Kingdom Argentina Belgium Ireland Netherlands Portugal China Finland Czech Republic Norway Spain France Italy Switzerland Brazil Quarter 1 2017 Qtr on Qtr Change Q4 2016 to Q1 2017 Yr on Yr Change  Q1 2016 to Q1 2017 Americas Asia Pacific Australia China Hong Kong Japan India New Zealand Singapore Taiwan EMEA† Austria Belgium Bulgaria Costa Rica Colombia United States Czech Republic Greece Hungary South Africa Slovenia Slovakia Poland Portugal Romania Canada Mexico Peru Brazil Argentina Guatemala Panama France Germany Finland Ireland Netherlands Norway Spain Turkey Italy Switzerland Sweden Israel UK 4 (4)1 3 (7)1 6 (6)1 8 (9)1 22 (23)1 15 (15)1 13 (13)1 21 (24)1 8 (9)1 20 (25)1 6 (11)1 12 (14)1 7 (7)1 1 (2)1 4 (7)1 5 (5)1 -3 (-2)1 4 (5)1 3 (3)1 1 (3)1 6 (7)1 5 (10)1 -2 (0)1 -1 (-1)1 0 (4)1 5 (5)1 -4 (-2)1 2 (0)1 0 (0)1 0 (1)1 -10 (-7)1 0 (1)1 -2 (4)1 -3 (-3)1 3 (3)1 5 (5)1 0 (0)1 1 (0)1 4 (4)1 -2 (-2)1 -19 (-19)1 -1 (-1)1 -1 (-2)1 7 (11)1 1 (0)1 2 (0)1 16 (12)1 9 (3)1 0 (-3)1 6 (8)1 -5 (-2)1 -4 (-4)1 13 (16)1 -3 (-2)1 -1 (-1)1 1 (3)1 -6 (-4)1 1 (1)1 2 (7)1 2 (1)1 2 (2)1 15 (17)1 5 (5)1 6 (6)1 8 (7)1 -1 (-1)1 1 (2)1 13 (17)1 5 (5)1 13 (13)1 7 (9)1 1 (1)1 -3 (-3)1 4 (9)1 -4 (-1)1 -1 (-1)1 5 1 – 6 (15)1 0 (3)1 5 (5)1 1 (2)1 2 (4)1 0 (-1)1 4 (4)1 -8 (-9)1 1 (-1)1 2 (2)1 7 (6)1 3 (0)1 -1 (-1)1 1 (1)1 16 (16)1 6 (7)1 1 (1)1 -1 (-1)1 8 (8)1 -1 (0)1 -3 (-5)1 -1 (0)1 -5 (-1)1 3 (3)1 1 (4)1 4 (2)1 7 (2)1 4 (4)1 2 (2)1 -4 (-3)1 -5 (-6)1 -1 (-1)1 -1 (-1)1 5 (5)1 -1 (0)1 0 (-1)1 2 (2)1 -3 (-3)1 -3 (-3)1 7 (10)1 -4 (-1)1 2 (2)1 -1 (-1)1 0 (0)1 2 (2)1 -6 (-6)1 6 (7)1 2 (2)1 1 (1)1 -1 (-1)1 +25% +24% +23% +17% +17% +16% +16% +15% +15% +14% +13% +12% +11% +11% +10% +10% +9% +9% +9% +9% +8% +8% +7% +7% +7% +7% +7% +7% +7% +6% +6% +5% +5%  +5%*  +4% +4% +3% +3% +3% +2% 0% -2% -9% Global Employment Outlook
  • 18.
    16 ManpowerGroup EmploymentOutlook Survey ManpowerGroup interviewed nearly 59,000 employers across 43 countries and territories to forecast labour market activity* in Quarter 1 2017. All participants were asked: “How do you anticipate total employment at your location to change in the three months to the end of March 2017 as compared to the current quarter?” The research from ManpowerGroup indicates job seekers across the globe will likely find some opportunities through the first three months of 2017. Hiring activity is expected to continue in the majority of the world’s labour markets. Most outlooks remain relatively stable or have improved since last quarter and this time last year. Altogether, employers in 40 of 43 countries and territories intend to add to their payrolls by varying degrees at the start of 2017. The survey reveals few signs that uncertainty associated with the Brexit vote or the U.S. election will result in any significant labour market volatility. Instead, employers appear content to keep a watchful eye on marketplace conditions and adjust workforce levels according to their business needs. Overall, forecasts are mixed in comparison to the Quarter 4 2016 and Quarter 1 2016 surveys. Hiring plans improve in 19 of 43 countries and territories when compared quarter-over-quarter, decline in 17, and are unchanged in seven. Outlooks strengthen in 20 countries and territories year-over-year, weaken in 18, and are unchanged in four. First-quarter hiring confidence is strongest in Taiwan, India, Japan, Hungary and Slovenia. The weakest forecasts are reported in Brazil, Switzerland and Italy. Job gains are expected in nine of the 10 countries surveyed in the Americas. Hiring confidence strengthens in four countries, declines in four, and is unchanged in two when compared to the final three months of 2016. Year-over-year, hiring prospects improve in four countries but weaken in the remaining six. The strongest first-quarter hiring plans are reported in both Guatemala and the United States, while employers in Brazil expect payrolls to shrink for the eighth consecutive quarter and report the weakest hiring plans across the region as well as across the globe. Employers expect staffing levels to increase by varying degrees in 23 of 25 countries in the Europe, Middle East & Africa (EMEA) region. When compared quarter-over-quarter, hiring plans improve in 12 countries, weaken in 10 and are unchanged in three. In a year-over-year comparison, outlooks improve in 15 countries, decline in seven and are unchanged in two.** The region’s most optimistic first-quarter hiring plans are reported in Hungary and Slovenia with employers in both countries expecting the strongest labour market activity since the surveys were launched in their respective countries. Conversely, the weakest employer sentiment is reported in Switzerland, where the outlook slips into negative territory for the first time in two years and in Italy, where labour market activity is expected to be flat in the first three months of the year. Employers in all eight Asia Pacific countries and territories expect workforce gains in the January- March time frame. When first-quarter forecasts are compared with the final three months of 2016, hiring plans strengthen in three countries/territories, weaken in three and are unchanged in two. In a year-over-year comparison, hiring is expected to accelerate only in New Zealand, slowdown in five other countries/territories and remain unchanged in two. Taiwanese employers expect the strongest hiring pace in the region as well as across the globe. Meanwhile, Chinese employers report the region’s most cautious hiring plans. Full survey results for each of the 43 countries and territories included in this quarter’s survey, plus regional and global comparisons, can be found at www.manpowergroup.com/meos The next ManpowerGroup Employment Outlook Survey will be released on 14 March 2017 and will detail expected labour market activity for the second quarter of 2017. * Commentary is based on seasonally adjusted data where available. Data is not seasonally adjusted for Portugal. ** Portugal joined the survey in Quarter 3 2016 and has no year-over-year trend data to compare at this point. The ManpowerGroup Employment Outlook Survey is ManpowerGroup’s quarterly index of employer hiring confidence.
  • 19.
    ManpowerGroup Employment OutlookSurvey 17 ManpowerGroup interviewed nearly 21,000 employers in 25 countries in the Europe, Middle East and Africa (EMEA) region. Some level of job growth is expected in all of the countries during the January-March time frame except in Italy and Switzerland. Employers in Hungary and Slovenia report the strongest first-quarter forecasts, and hiring intentions in both countries are the most optimistic reported since their respective surveys were launched. Hungary’s upbeat outlook is fuelled by unprecedented optimism in both the Construction and Wholesale & Retail Trade sectors. Similarly, Slovenia’s forecast is underpinned by the most optimistic forecasts reported to date in five of the country’s 10 industry sectors, with the Construction and Wholesale & Retail Trade sector outlooks also included among the five. Job seekers will likely find similarly favourable first- quarter hiring opportunities in both Romania and Bulgaria. Romania’s outlook is the strongest since Quarter 4 2008, with most hiring activity expected in the Manufacturing and Wholesale & Retail Trade sectors where approximately three of every 10 employers say they intend to add to their payrolls. Bulgaria’s forecast is highlighted by the strongest outlooks reported in the Finance, Insurance & Real Estate, Manufacturing, and Wholesale & Retail Trade sectors since the survey began. Noteworthy advances in employer confidence are also evident in Belgium with the strongest forecast reported since Quarter 3 2011. The outlook is buoyed, in large part, by the most optimistic hiring intentions reported in more than five years in the Finance & Business Services sector. International Comparisons – EMEA Similarly, Austrian forecasts in both the Manufacturing and Agriculture sectors are the strongest since Quarter 4 2008, and help boost the country’s overall outlook to a level last reported in Quarter 3 2012. Employer confidence is trending in the opposite direction in Ireland. The outlook grows more conservative as forecasts soften in most industry sectors and regions in both quarter-over-quarter and year-over-year comparisons. Elsewhere, workforce gains are expected to be modest. Employers in the United Kingdom remain resilient following the Brexit referendum, with hiring plans actually improving slightly from the prior quarter and remaining relatively stable when compared to last year at this time. Some level of payroll growth is expected across all industry sectors in Germany, with the most opportunities expected in the Finance & Business Services sector. The survey indicates the hiring pace in France will be more subdued, but job growth is anticipated in most industry sectors, particularly in the Transport, Storage & Communications sector where the outlook climbs considerably from both the prior quarter and last year at this time. Employer hiring confidence is decidedly more muted in Italy and Switzerland. Italy’s outlook is relatively stable in comparison to the prior quarter and last year at this time, but hiring intentions are negative in six of 10 industry sectors and two of four regions. The Swiss forecast drifts again into negative territory for the first time in two years, dipping slightly in both quarter-over- quarter and year-over-year comparisons. Austria +3 (+7)% Seasonally Adjusted OutlookSeasonally Adjusted OutlookNet Employment OutlookNet Employment Outlook No bar indicates Net Employment Outlook of zero 20082007 2009 2010 2011 2012 2013 2014 2015 2016  2017 -20 -10 0 10 20 30 40 50 60
  • 20.
    18 ManpowerGroup EmploymentOutlook Survey Belgium +6 (+6)% Seasonally Adjusted OutlookSeasonally Adjusted OutlookNet Employment OutlookNet Employment Outlook No bar indicates Net Employment Outlook of zero 20082007 2009 2010 2011 2012 2013 2014 2015 2016  2017 -20 -10 0 10 20 30 40 50 60 Bulgaria +7 (+11)% Bulgaria joined the survey in Q1 2011 No bar indicates Net Employment Outlook of zero 20082007 2009 2010 2011 2012 2013 2014 2015 2016  2017 Seasonally Adjusted OutlookNet Employment Outlook -20 -10 0 10 20 30 40 50 60 Czech Republic +1 (+3)% Seasonally Adjusted OutlookSeasonally Adjusted OutlookNet Employment OutlookNet Employment Outlook Czech Republic joined the survey in Q2 2008 No bar indicates Net Employment Outlook of zero 20082007 2009 2010 2011 2012 2013 2014 2015 2016  2017 -20 -10 0 10 20 30 40 50 60 Finland +1 (+4)% Finland joined the survey in Q4 2012 No bar indicates Net Employment Outlook of zero 20082007 2009 2010 2011 2012 2013 2014 2015 2016  2017 Seasonally Adjusted OutlookSeasonally Adjusted OutlookNet Employment OutlookNet Employment Outlook -20 -10 0 10 20 30 40 50 60
  • 21.
    ManpowerGroup Employment OutlookSurvey 19 France +1 (+2)% Seasonally Adjusted OutlookSeasonally Adjusted OutlookNet Employment OutlookNet Employment Outlook No bar indicates Net Employment Outlook of zero 20082007 2009 2010 2011 2012 2013 2014 2015 2016  2017 -20 -10 0 10 20 30 40 50 60 Germany +4 (+7)% Seasonally Adjusted OutlookSeasonally Adjusted OutlookNet Employment OutlookNet Employment Outlook No bar indicates Net Employment Outlook of zero 20082007 2009 2010 2011 2012 2013 2014 2015 2016 2017 -20 -10 0 10 20 30 40 50 60 Greece +2 (+7)% 20082007 2009 2010 2011 2012 2013 2014 2015 2016  2017 Seasonally Adjusted OutlookSeasonally Adjusted OutlookNet Employment OutlookNet Employment Outlook Greece joined the survey in Q2 2008 No bar indicates Net Employment Outlook of zero -20 -10 0 10 20 30 40 50 60 Hungary +15 (+17)% Seasonally Adjusted OutlookSeasonally Adjusted OutlookNet Employment OutlookNet Employment Outlook Hungary joined the survey in Q3 2009 No bar indicates Net Employment Outlook of zero 20082007 2009 2010 2011 2012 2013 2014 2015 2016  2017 -20 -10 0 10 20 30 40 50 60
  • 22.
    20 ManpowerGroup EmploymentOutlook Survey Ireland +4 (+5)% Seasonally Adjusted OutlookSeasonally Adjusted OutlookNet Employment OutlookNet Employment Outlook No bar indicates Net Employment Outlook of zero 20082007 2009 2010 2011 2012 2013 2014 2015 2016  2017 -20 -10 0 10 20 30 40 50 60 Israel +7 (+10)% Israel joined the survey in Q4 2011 No bar indicates Net Employment Outlook of zero 20082007 2009 2010 2011 2012 2013 2014 2015 2016  2017 Seasonally Adjusted OutlookSeasonally Adjusted OutlookNet Employment OutlookNet Employment Outlook -20 -10 0 10 20 30 40 50 60 Italy -2 (0)% Seasonally Adjusted OutlookSeasonally Adjusted OutlookNet Employment OutlookNet Employment Outlook No bar indicates Net Employment Outlook of zero 20082007 2009 2010 2011 2012 2013 2014 2015 2016  2017 -20 -10 0 10 20 30 40 50 60 Netherlands +5 (+5)% Seasonally Adjusted OutlookSeasonally Adjusted OutlookNet Employment OutlookNet Employment Outlook No bar indicates Net Employment Outlook of zero 20082007 2009 2010 2011 2012 2013 2014 2015 2016  2017 -20 -10 0 10 20 30 40 50 60
  • 23.
    ManpowerGroup Employment OutlookSurvey 21 Norway +3 (+3)% Seasonally Adjusted OutlookSeasonally Adjusted OutlookNet Employment OutlookNet Employment Outlook No bar indicates Net Employment Outlook of zero 20082007 2009 2010 2011 2012 2013 2014 2015 2016  2017 -20 -10 0 10 20 30 40 50 60 Poland +4 (+9)% Seasonally Adjusted OutlookSeasonally Adjusted OutlookNet Employment OutlookNet Employment Outlook Poland joined the survey in Q2 2008 No bar indicates Net Employment Outlook of zero 20082007 2009 2010 2011 2012 2013 2014 2015 2016  2017 -20 -10 0 10 20 30 40 50 60 Portugal +5% Net Employment OutlookNet Employment Outlook Portugal joined the survey in Q3 2016 No bar indicates Net Employment Outlook of zero 20082007 2009 2010 2011 2012 2013 2014 2015 2016  2017 -20 -10 0 10 20 30 40 50 60 Romania +6 (+15)% Seasonally Adjusted OutlookSeasonally Adjusted OutlookNet Employment OutlookNet Employment Outlook Romania joined the survey in Q2 2008 No bar indicates Net Employment Outlook of zero 20082007 2009 2010 2011 2012 2013 2014 2015 2016  2017 -20 -10 0 10 20 30 40 50 60
  • 24.
    22 ManpowerGroup EmploymentOutlook Survey Slovenia +13 (+17)% Slovenia joined the survey in Q1 2011 No bar indicates Net Employment Outlook of zero 20082007 2009 2010 2011 2012 2013 2014 2015 2016  2017 Seasonally Adjusted OutlookSeasonally Adjusted OutlookNet Employment OutlookNet Employment Outlook -20 -10 0 10 20 30 40 50 60 South Africa +8 (+7)% Seasonally Adjusted OutlookSeasonally Adjusted OutlookNet Employment OutlookNet Employment Outlook No bar indicates Net Employment Outlook of zero 20082007 2009 2010 2011 2012 2013 2014 2015 2016 2017 -20 -10 0 10 20 30 40 50 60 Spain +1 (+3)% Seasonally Adjusted OutlookSeasonally Adjusted OutlookNet Employment OutlookNet Employment Outlook No bar indicates Net Employment Outlook of zero 20082007 2009 2010 2011 2012 2013 2014 2015 2016  2017 -20 -10 0 10 20 30 40 50 60 Slovakia +7 (+9)% Net Employment OutlookNet Employment Outlook Slovakia joined the survey in Q4 2011 No bar indicates Net Employment Outlook of zero 20082007 2009 2010 2011 2012 2013 2014 2015 2016 2017 Seasonally Adjusted OutlookSeasonally Adjusted Outlook -20 -10 0 10 20 30 40 50 60
  • 25.
    ManpowerGroup Employment OutlookSurvey 23 Switzerland -3 (-2)% Seasonally Adjusted OutlookSeasonally Adjusted OutlookNet Employment OutlookNet Employment Outlook No bar indicates Net Employment Outlook of zero 20082007 2009 2010 2011 2012 2013 2014 2015 2016  2017 -20 -10 0 10 20 30 40 50 60 Turkey +5 (+10)% Turkey joined the survey in Q1 2011 No bar indicates Net Employment Outlook of zero 20082007 2009 2010 2011 2012 2013 2014 2015 2016  2017 Seasonally Adjusted OutlookSeasonally Adjusted OutlookNet Employment OutlookNet Employment Outlook -20 -10 0 10 20 30 40 50 60 United Kingdom +6 (+7)% Seasonally Adjusted OutlookSeasonally Adjusted OutlookNet Employment OutlookNet Employment Outlook No bar indicates Net Employment Outlook of zero 20082007 2009 2010 2011 2012 2013 2014 2015 2016  2017 -20 -10 0 10 20 30 40 50 60 Sweden +6 (+7)% Seasonally Adjusted OutlookSeasonally Adjusted OutlookNet Employment OutlookNet Employment Outlook No bar indicates Net Employment Outlook of zero 20082007 2009 2010 2011 2012 2013 2014 2015 2016  2017 -20 -10 0 10 20 30 40 50 60
  • 26.
    24 ManpowerGroup EmploymentOutlook Survey ManpowerGroup interviewed over 23,000 employers from 10 countries throughout North, Central and South America for the Quarter 1 2017 survey. First- quarter payrolls are expected to grow in all countries except Brazil. The region’s most optimistic hiring plans are reported in Guatemala and the U.S. with approximately one of every five employers in both countries expecting to add to their payrolls in the January-March time frame. Employer confidence in the U.S. is strongest in the Leisure & Hospitality sector with upbeat forecasts also reported in the Wholesale & Retail Trade and Transportation & Utilities sectors. In Guatemala one of every four employers surveyed in the Manufacturing sector plans to hire, boosting that sector’s forecast to its most optimistic level since early 2010. Opportunities for Canadian job seekers are expected to be the strongest in three years. Public Administration sector employers report the first quarter’s most active hiring plans and the forecast climbs to its most optimistic level since Quarter 4 2008. Increasingly favourable forecasts are also reported in both the Durable and Non-Durable Manufacturing sectors, as the weak Canadian dollar is expected to boost U.S. demand for manufactured output. In Mexico, employer confidence remains upbeat with workforce gains expected in all industry sectors and regions. The strongest hiring intentions are reported in both the Transport & Communications sector and the Manufacturing sector, where anticipated job gains are boosted in large part by automotive industry hiring plans. Meanwhile, the hiring pace in Costa Rica is expected to remain steady through the first three months of the International Comparisons – Americas year with upbeat forecasts reported in most industry sectors and regions. Outlooks are also positive across Panama’s industry sectors, but hiring is expected to be moderately slower in comparison to year-ago levels. Colombia’s employers anticipate some opportunities for job seekers in the next three months. However, the outlook dips for the third consecutive quarter to its least optimistic level since Quarter 3 2009, weighed down by the weakest Services sector forecast reported since the survey was launched in Quarter 4 2008 and the gloomiest Mining sector forecast since this sector began reporting separately in 2013. Hiring plans are uniformly positive across Peru’s industry sectors and regions. However, despite sharp year-over-year gains in the Construction and Mining sectors, overall hiring activity is expected to be little changed when compared to the prior quarter and last year at this time. High inflation continues to temper employer confidence in Argentina. But the overall forecast remains cautiously optimistic with payrolls expected to grow in most industry sectors and regions. The Agriculture sector forecast is the strongest in more than five years following four consecutive quarters of growth and expectations of a record grain harvest. Once again Brazilian employers report the weakest hiring plans across the region, as well as across the globe, and the forecast remains mired in negative territory for the eighth consecutive quarter. Prospects for job seekers in the Construction sector remain dim, and the Services sector forecast grows more negative following steep quarter-over-quarter and year-over-year declines. Argentina +7 (+6)% Seasonally Adjusted OutlookSeasonally Adjusted OutlookNet Employment OutlookNet Employment Outlook No bar indicates Net Employment Outlook of zero 20082007 2009 2010 2011 2012 2013 2014 2015 2016  2017 -20 -10 0 10 20 30 40 50 60
  • 27.
    ManpowerGroup Employment OutlookSurvey 25 Brazil -8 (-9)% Seasonally Adjusted OutlookSeasonally Adjusted OutlookNet Employment OutlookNet Employment Outlook Brazil joined the survey in Q4 2009 No bar indicates Net Employment Outlook of zero 20082007 2009 2010 2011 2012 2013 2014 2015 2016  2017 -20 -10 0 10 20 30 40 50 60 Canada +6 (+11)% Seasonally Adjusted OutlookNet Employment Outlook No bar indicates Net Employment Outlook of zero 20082007 2009 2010 2011 2012 2013 2014 2015 2016  2017 -20 -10 0 10 20 30 40 50 60 Colombia +6 (+8)% Seasonally Adjusted OutlookSeasonally Adjusted OutlookNet Employment OutlookNet Employment Outlook Colombia joined the survey in Q4 2008 No bar indicates Net Employment Outlook of zero 20082007 2009 2010 2011 2012 2013 2014 2015 2016 2017 -20 -10 0 10 20 30 40 50 60 Costa Rica +16 (+12)% Seasonally Adjusted OutlookSeasonally Adjusted OutlookNet Employment OutlookNet Employment Outlook No bar indicates Net Employment Outlook of zero 20082007 2009 2010 2011 2012 2013 2014 2015 2016  2017 -20 -10 0 10 20 30 40 50 60
  • 28.
    26 ManpowerGroup EmploymentOutlook Survey Guatemala +16 (+16)% Seasonally Adjusted OutlookSeasonally Adjusted OutlookNet Employment OutlookNet Employment Outlook Guatemala joined the survey in Q2 2008 No bar indicates Net Employment Outlook of zero 20082007 2009 2010 2011 2012 2013 2014 2015 2016  2017 -20 -10 0 10 20 30 40 50 60 Mexico +12 (+14)% Seasonally Adjusted OutlookSeasonally Adjusted OutlookNet Employment OutlookNet Employment Outlook No bar indicates Net Employment Outlook of zero 20082007 2009 2010 2011 2012 2013 2014 2015 2016 2017 -20 -10 0 10 20 30 40 50 60 Panama +8 (+8)% Seasonally Adjusted OutlookSeasonally Adjusted OutlookNet Employment OutlookNet Employment Outlook Panama joined the survey in Q2 2010 No bar indicates Net Employment Outlook of zero 20082007 2009 2010 2011 2012 2013 2014 2015 2016  2017 -20 -10 0 10 20 30 40 50 60 Peru +7 (+7)% Seasonally Adjusted OutlookSeasonally Adjusted OutlookNet Employment OutlookNet Employment Outlook No bar indicates Net Employment Outlook of zero 20082007 2009 2010 2011 2012 2013 2014 2015 2016  2017 -20 -10 0 10 20 30 40 50 60
  • 29.
    ManpowerGroup Employment OutlookSurvey 27 +13 (+16)%United States of America Seasonally Adjusted OutlookSeasonally Adjusted OutlookNet Employment OutlookNet Employment Outlook No bar indicates Net Employment Outlook of zero 20082007 2009 2010 2011 2012 2013 2014 2015 2016  2017 -20 -10 0 10 20 30 40 50 60
  • 30.
    28 ManpowerGroup EmploymentOutlook Survey Nearly 15,000 employers were interviewed in the Asia Pacific region. Employers in each of the eight countries and territories intend to add to their workforces through the first three months of the year, although hiring expectations vary widely. Taiwan’s employers report the region’s strongest first-quarter hiring intentions as well as the most optimistic outlook among the survey’s 43 participating countries and territories. Buoyed by expectations of continued export growth and improving private consumption figures, one of every four Taiwanese employers expect to add to their workforces in the January-March time frame. India’s hiring pace is expected to slow for the fourth consecutive quarter, and employer optimism dips to its least optimistic level since Quarter 3 2013. However, more than one in five Indian employers tell us they intend to add to their payrolls through the next three months. As a result, India’s hiring pace is expected to be stronger than all countries and territories participating in the survey except Taiwan. Employers predict solid levels of job growth in each of India’s seven industry sectors, with particular emphasis on knowledgeable workers across virtually every industry sector. Opportunities for job seekers in Japan remain strong, and a quarter of all employers anticipate adding to their payrolls in the January-March time frame. However, securing the talent they need continues to prove an elusive goal for most employers in Japan. As ManpowerGroup’s recent Talent Shortage Survey reveals, employers remain challenged by a shrinking pool of available talent and few prospects that a solution to the shortage will be found soon. International Comparisons – Asia Pacific Employers in China remain cautiously optimistic with some payroll growth forecast in all industry sectors and regions. However, nearly two thirds of survey respondents replied with “Don’t Know” when asked to share their hiring plans for the January-March time frame. This uncertainty may signal an expanding effort to maintain workforce flexibility and adjust payrolls as needed as the country continues its transition to a more services-oriented economy. Australia’s efforts to emphasise non-mining sectors of the economy appear to be maintaining traction. Employers across all sectors and regions expect varying degrees of payroll gains, with the most opportunities for job seekers expected in the Services and Finance, Insurance & Real Estate sectors. Employer hiring plans are also uniformly positive in New Zealand. The forecast indicates that the most active labour markets will be in the Transportation & Utilities and Mining & Construction sectors. Elsewhere, the hiring climate in Hong Kong is expected to remain favourable despite an overall slowdown in retail and tourism activity. Services sector employers report the first quarter’s strongest outlook, with steady hiring also expected in the Mining & Construction sector, where a quarter of the employers surveyed say they intend to add to payrolls in the January-March period. Employers in most of Singapore’s industry sectors expect varying degrees of job growth. The exception is the Wholesale & Retail Trade sector, where the outlook has gradually declined for four consecutive quarters and employers report their first negative forecast since the 2009 recession. Australia +8 (+9)% Seasonally Adjusted OutlookSeasonally Adjusted OutlookNet Employment OutlookNet Employment Outlook No bar indicates Net Employment Outlook of zero 20082007 2009 2010 2011 2012 2013 2014 2015 2016  2017 -20 -10 0 10 20 30 40 50 60
  • 31.
    ManpowerGroup Employment OutlookSurvey 29 +4 (+4)%China            Seasonally Adjusted OutlookSeasonally Adjusted OutlookNet Employment OutlookNet Employment Outlook No bar indicates Net Employment Outlook of zero 20082007 2009 2010 2011 2012 2013 2014 2015 2016  2017 -20 -10 0 10 20 30 40 50 60 Hong Kong +13 (+13)% Seasonally Adjusted OutlookSeasonally Adjusted OutlookNet Employment OutlookNet Employment Outlook No bar indicates Net Employment Outlook of zero 20082007 2009 2010 2011 2012 2013 2014 2015 2016  2017 -20 -10 0 10 20 30 40 50 60 +21 (+24)%India            Seasonally Adjusted OutlookSeasonally Adjusted OutlookNet Employment OutlookNet Employment Outlook No bar indicates Net Employment Outlook of zero 20082007 2009 2010 2011 2012 2013 2014 2015 2016  2017 -20 -10 0 10 20 30 40 50 60 Japan +22 (+23)% Seasonally Adjusted OutlookSeasonally Adjusted OutlookNet Employment OutlookNet Employment Outlook No bar indicates Net Employment Outlook of zero 20082007 2009 2010 2011 2012 2013 2014 2015 2016  2017 -20 -10 0 10 20 30 40 50 60
  • 32.
    30 ManpowerGroup EmploymentOutlook Survey New Zealand +15 (+15)% Seasonally Adjusted OutlookSeasonally Adjusted OutlookNet Employment OutlookNet Employment Outlook No bar indicates Net Employment Outlook of zero 20082007 2009 2010 2011 2012 2013 2014 2015 2016  2017 -20 -10 0 10 20 30 40 50 60 Singapore +8 (+9)% Seasonally Adjusted OutlookSeasonally Adjusted OutlookNet Employment OutlookNet Employment Outlook No bar indicates Net Employment Outlook of zero 20082007 2009 2010 2011 2012 2013 2014 2015 2016  2017 -50 -40 -30 -20 -10 0 10 20 30 40 50 60 70 Taiwan +20 (+25)% Seasonally Adjusted OutlookSeasonally Adjusted OutlookNet Employment OutlookNet Employment Outlook No bar indicates Net Employment Outlook of zero 20082007 2009 2010 2011 2012 2013 2014 2015 2016  2017 -20 -10 0 10 20 30 40 50 60
  • 33.
    ManpowerGroup Employment OutlookSurvey 31 The ManpowerGroup Employment Outlook Survey is conducted quarterly to measure employers’ intentions to increase or decrease the number of employees in their workforces during the next quarter. ManpowerGroup’s comprehensive forecast of employer hiring plans has been running for more than 50 years and is one of the most trusted surveys of employment activity in the world. Various factors underpin the success of the ManpowerGroup Employment Outlook Survey: Unique: It is unparalleled in its size, scope, longevity and area of focus. Projective: The ManpowerGroup Employment Outlook Survey is the most extensive, forward-looking employment survey in the world, asking employers to forecast employment over the next quarter. In contrast, other surveys and studies focus on retrospective data to report on what occurred in the past. Independent: The survey is conducted with a representative sample of employers from throughout the countries and territories in which it is conducted. The survey participants are not derived from ManpowerGroup’s customer base. Robust: The survey is based on interviews with nearly 59,000 public and private employers across 43 countries and territories to measure anticipated employment trends each quarter. This sample allows for analysis to be performed across specific sectors and regions to provide more detailed information. Focused: For more than five decades the survey has derived all of its information from a single question: For the Quarter 1 2017 research, all employers participating in the survey worldwide are asked the same question: “How do you anticipate total employment at your location to change in the three months to the end of March 2017 as compared to the current quarter?” About the Survey Methodology The ManpowerGroup Employment Outlook Survey is conducted using a validated methodology, in accordance with the highest standards in market research. The survey has been structured to be representative of each national economy. The margin of error for all national, regional and global data is not greater than +/- 3.9%. In the UK, the national survey includes 2,104 employers. With this number of interviews, the margin of error for the UK survey is +/- 2.1%. Net Employment Outlook Throughout this report, we use the term “Net Employment Outlook.” This figure is derived by taking the percentage of employers anticipating an increase in hiring activity and subtracting from this the percentage of employers expecting to see a decrease in employment at their location in the next quarter. The result of this calculation is the Net Employment Outlook. Net Employment Outlooks for countries and territories that have accumulated at least 17 quarters of data are reported in a seasonally adjusted format unless otherwise stated. Seasonal adjustments have been applied to the data for all participating countries except Portugal. ManpowerGroup intends to add seasonal adjustments to the Portuguese data in the future, as more historical data is compiled. Note that in Quarter 2 2008, ManpowerGroup adopted the TRAMO-SEATS method of seasonal adjustment for data.
  • 34.
    32 ManpowerGroup EmploymentOutlook Survey ManpowerGroup® (NYSE: MAN) is the world’s workforce expert, creating innovative workforce solutions for nearly 70 years. As workforce experts, we connect more than 600,000 people to meaningful work across a wide range of skills and industries every day. Through our ManpowerGroup family of brands – Manpower® , Experis® , Right Management® and ManpowerGroup® Solutions – we help more than 400,000 clients in 80 countries and territories address their critical talent needs, providing comprehensive solutions to resource, manage and develop talent. In 2016, ManpowerGroup was named one of the World’s Most Ethical Companies for the sixth consecutive year and one of Fortune’s Most Admired Companies, confirming our position as the most trusted and admired brand in the industry. See how ManpowerGroup makes powering the world of work humanly possible: www.manpowergroup.com. About ManpowerGroupTM About Manpower UK Manpower is the global leader in contingent and permanent recruitment workforce solutions. It is part of ManpowerGroup, the world’s workforce expert, which creates and delivers high-impact solutions that enable clients to achieve their business goals and enhance their competitiveness. With a network of offices in cities across the country, Manpower has provided organisations in the UK with a continuum of staffing solutions from the incidental to the strategic for nearly 60 years, working with businesses such as BT, IBM, Royal Mail and Xerox to help them win. In the Human Age, where talent has replaced access to capital as the key competitive differentiator, Manpower UK leverages its trusted brand to develop a deep talent pool, providing clients with access to the people they need, fast. Manpower UK creates powerful connections between organisations and the talent they need to enhance their competitiveness and unleash their workforce potential. By creating these powerful connections, we help everybody achieve more than they imagined, and power the world of work. For more information, see manpower.co.uk
  • 35.
    ManpowerGroup, Capital Court,Windsor Street, Uxbridge, Middlesex UB8 1AB T: 01895 205 200 F: 01895 205 201 manpowergroup.co.uk © 2016, ManpowerGroup. All rights reserved.