Steven Jagger ReThink 0161 819 7545 report on jobs
•
1 like•443 views

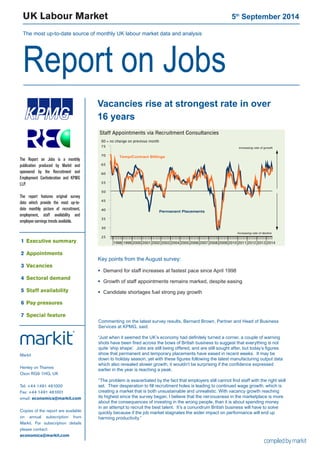
The document summarizes UK labour market data from August 2014. It finds that: - Demand for staff increased at the fastest pace in over 16 years, with growth in both permanent and temporary vacancies. - Staff appointments continued to rise strongly for permanent and temporary workers, although the rate of growth eased slightly. - Shortages of qualified candidates continued to fuel strong pay growth for both permanent and temporary staff.

Recommended
Recommended
More Related Content
What's hot
What's hot (20)
Similar to Steven Jagger ReThink 0161 819 7545 report on jobs
Similar to Steven Jagger ReThink 0161 819 7545 report on jobs (20)
Steven Jagger ReThink 0161 819 7545 report on jobs
- 1. UK Labour Market 5th September 2014 The most up-to-date source of monthly UK labour market data and analysis Report on Jobs 199819992000200120022003200420052006200720082009201020112012201320142530354045505560657075Temp/Contract BillingsPermanent PlacementsIncreasing rate of declineIncreasing rate of growth50 = no change on previous monthStaff Appointments via Recruitment Consultancies Vacancies rise at strongest rate in over 16 years Commenting on the latest survey results, Bernard Brown, Partner and Head of Business Services at KPMG, said: “Just when it seemed the UK’s economy had definitely turned a corner, a couple of warning shots have been fired across the bows of British business to suggest that everything is not quite ‘ship shape’. Jobs are still being offered, and are still sought after, but today’s figures show that permanent and temporary placements have eased in recent weeks. It may be down to holiday season, yet with these figures following the latest manufacturing output data which also revealed slower growth, it wouldn’t be surprising if the confidence expressed earlier in the year is reaching a peak. “The problem is exacerbated by the fact that employers still cannot find staff with the right skill set. Their desperation to fill recruitment holes is leading to continued wage growth, which is creating a market that is both unsustainable and unrealistic. With vacancy growth reaching its highest since the survey began, I believe that the nervousness in the marketplace is more about the consequences of investing in the wrong people, than it is about spending money in an attempt to recruit the best talent. It’s a conundrum British business will have to solve quickly because if the job market stagnates the wider impact on performance will end up harming productivity.” Markit Henley on Thames Oxon RG9 1HG, UK Tel: +44 1491 461000 Fax: +44 1491 461001 email: economics@markit.com Copies of the report are available on annual subscription from Markit. For subscription details please contact: economics@markit.com The Report on Jobs is a monthly publication produced by Markit and sponsored by the Recruitment and Employment Confederation and KPMG LLP. The report features original survey data which provide the most up-to- date monthly picture of recruitment, employment, staff availability and employee earnings trends available. 1 Executive summary 2 Appointments 3 Vacancies 4 Sectoral demand 5 Staff availability 6 Pay pressures 7 Special feature Key points from the August survey: Demand for staff increases at fastest pace since April 1998 Growth of staff appointments remains marked, despite easing Candidate shortages fuel strong pay growth
- 2. Report on Jobs | Recruitment Industry Survey The Report on Jobs is unique in providing the most comprehensive guide to the UK labour market, drawing on original survey data provided by recruitment consultancies and employers to provide the first indication each month of labour market trends. The main findings for August are: Growth of staff appointments eases but still marked... Permanent placements growth remained strong in August, although eased from the five-month high recorded in July. Temp billings also rose at a marked pace, albeit the slowest since May. ...supported by fastest rise in vacancies for over 16 years The number of available job vacancies rose further in August, with the rate of expansion the sharpest since April 1998. Both the private and public sectors saw increased demand, with the former recording the sharper growth. Strong pay growth... Permanent staff salaries continued to rise at an elevated rate in August, with the latest increase only slightly slower than June’s survey-record. Temp pay also rose strongly, and at a faster pace than in July. ...underpinned by tight candidate availability The availability of staff to fill job vacancies fell further in August. Permanent candidates were in particularly short supply, with the latest decline in availability again steep albeit easing from July’s series-record. 1 Executive summary 1998199920002001200220032004200520062007200820092010201120122013201425303540455055606570Staff AppointmentsTemp/Contract BillingsPermanent Placements2530354045505560657050 = no change on previous month50=no change on previous month199819992000200120022003200420052006200720082009201020112012201320143540455055606570Staff Availability and Earnings GrowthSkill shortagesAverage permanent salaries (LHS) 9080706050403050 = no change on previous month50 = no change on previous month (inverted) inverted - RHS) (Availability of staff19981999200020012002200320042005200620072008200920102011201220132014Temp/Contract VacanciesPermanent Vacancies50 = no change on previous month2530354045505560657075Increasing rate of growthIncreasing rate of declineDemand for staff All Intellectual Property Rights owned by Markit Economics Limited
- 3. Report on Jobs | Recruitment Industry Survey Recruitment consultancies report on the number of people placed in permanent jobs each month, and their revenues (billings) received from placing people in temporary or contract positions at employers. Recruitment consultants reported further strong growth of permanent and temporary staff appointments during August, albeit slower than one month previously. Growth of permanent placements eases but still strong The number of people placed in permanent jobs continued to increase in August, extending the current period of expansion to 23 months. That rate of growth remained strong, despite moderating from July’s five-month high. Panellists reported that increased client demand had boosted appointments, although some noted that shortages of suitable candidates had put a brake on growth. All four English regions monitored by the survey saw increased placements in August, with the South posting the fastest expansion. Further marked rise in temp billings Temporary/contract staff billings increased for a sixteenth consecutive month in August. The rate of growth remained strong, despite easing to the slowest since May. Almost twice as many panellists reported a rise in short-term appointments as signalled a decline. Rising levels of business activity at clients were reported to have underpinned the latest expansion of demand for temp workers. The Midlands led a broad-based rise in temp billings during the latest survey period. An index reading above 50 signals a higher number of placements/billings than the previous month. Readings below 50 signal a decline compared with the previous month. 2 Staff appointments 199819992000200120022003200420052006200720082009201020112012201320142530354045505560657075Temp/Contract BillingsPermanent PlacementsIncreasing rate of declineIncreasing rate of growth50 = no change on previous monthStaff Appointments via Recruitment Consultancies 2014 Mar 49.7 32.7 17.6 32.1 66.0 62.6 Apr 50.1 31.3 18.6 31.4 65.7 63.8 May 43.4 38.0 18.6 24.9 62.4 62.8 Jun 49.0 30.9 20.1 28.9 64.4 61.3 Jul 48.4 38.3 13.3 35.1 67.5 64.9 Aug 41.1 33.9 25.0 16.2 58.1 62.4 Higher Same Lower Net Index S.Adj. % % % +/- 50 = no chg Index Permanent Staff Placements Q. Please compare the number of staff placed in permanent positions with the number one month ago. 2014 Mar 40.8 46.6 12.6 28.2 64.1 59.9 Apr 37.8 41.9 20.3 17.4 58.7 58.9 May 39.2 43.2 17.6 21.6 60.8 59.1 Jun 48.1 38.4 13.5 34.6 67.3 62.2 Jul 48.0 37.5 14.5 33.6 66.8 63.0 Aug 40.8 38.2 21.0 19.7 59.9 61.0 Higher Same Lower Net Index S.Adj. % % % +/- 50 = no chg Index Temporary/Contract Staff Billings Q. Please compare your billings received from the employment of temporary and contract staff with the situation one month ago.
- 4. Report on Jobs | Recruitment Industry Survey 3 Vacancies All Intellectual Property Rights owned by Markit Economics Limited Recruitment consultants are asked to specify whether the demand for staff from employers has changed on the previous month, thereby providing an indicator of the number of job vacancies. The summary indexes shown in this page are derived from the detailed sector data shown on page 5. Demand for staff rises at strongest rate since April 1998 The Report on Jobs Vacancy Index posted 68.2 in August, up from 68.0 in July. The latest reading was the highest in over 16 years. Both permanent and temporary staff saw strong increases in vacancies, with rates of growth the strongest since March 1998 and May 1998 respectively. Public & private sector vacancies Demand for staff continued to rise at a considerably stronger rate in the private sector than in the public sector during the latest survey period. In both cases, temps saw faster growth than permanent workers on a non-seasonally adjusted basis in August. Other vacancy indicators Latest official data from the Office for National Statistics (ONS) indicated that vacancies were up 22.2% on an annual basis in the three months to July. Meanwhile, internet-based recruitment spending continued to increase at a strong annual pace. Latest data showed a 7.8% rise in Q1 2014 from the corresponding period one year earlier. The Job Vacancies Index monitors the overall demand for staff at recruitment consultancies. An index reading above 50 signals a higher number of vacancies than the previous month. Readings below 50 signal a decline compared with the previous month. 19981999200020012002200320042005200620072008200920102011201220132014Temp/Contract VacanciesPermanent Vacancies50 = no change on previous month2530354045505560657075Increasing rate of growthIncreasing rate of decline2530354045505560657075Job Vacancies50 = no change on previous monthVacancy IndexIncreasing rate of growthIncreasing rate of decline Job Vacancy Indicators Apr’14 May Jun Jul Aug Job Vacancy Index (recruitment industry survey) 50 = no change on previous month Other key vacancy data Annual % change Sources: Job centre vacancies provided by ONS via EcoWin. Internet recruitment spending provided by WARC.com Total 67.0 66.4 67.2 68.0 68.2 Permanent Staff 67.1 66.5 67.3 68.1 68.2 Temporary Staff 65.2 64.5 65.9 66.8 68.7 Public: perm 56.0 57.1 53.6 55.0 54.1 Public: temp 57.8 55.2 57.6 56.6 58.9 Private: perm 72.6 71.4 73.0 73.2 70.8 Private: temp 67.6 69.4 74.0 72.1 72.6 Job centre vacancies 24.4 24.4 23.0 22.2 n/a Internet recruitment 7.8 -- -- -- -- Public & private sector vacancies (not seasonally adjusted)
- 5. Report on Jobs | Recruitment Industry Survey Recruitment consultancies are requested to compare the demand for staff according to sector with the situation one month ago. Permanent Staff Demand rose for all nine categories of permanent staff monitored by the survey in August. Engineering workers saw the strongest expansion of vacancies, while Hotel & Catering roles registered the slowest growth. 4 Demand for staff by sector 50 = no change on previous monthDemand for staff2030405060708090Secretarial & ClericalPermTemp20022003200420052006200720082009201020112012201320142030405060708090Accounting & FinancialTempPerm20022003200420052006200720082009201020112012201320142002200320042005200620072008200920102011201220132014203040 5060708090Executive & ProfessionalPermTemp20022003200420052006200720082009201020112012201320142030405060708090IT & ComputingTempPerm20304050607080902002200320042005200620072008200920102011201220132014TempBlue CollarPerm20304050607080902002200320042005200620072008200920102011201220132014Nursing/Medical/CareTempPerm20022003200420052006200720082009201020112012201320142030405060708090Hotel & CateringTempPermEngineering; Construction This year (Last year) Rank Aug'14 Rank Aug'13 This year (Last year) Rank Aug'14 Rank Aug'13 *Non-seasonally adjusted data. Prior to April 2013 Engineering/Construction was reported as a single category. Data are presented in the form of diffusion indices whereby a reading of 50 indicates no change on the previous month. Readings above 50 signal stronger demand than a month ago. Readings below 50 signal weaker demand than a month ago. Nursing/Medical/Care 1 73.3 (3) (66.0) Engineering* 2 73.2 (5) (62.2) Construction* 3 70.5 (1) (67.4) Blue Collar 4 69.8 (2) (66.4) Secretarial/Clerical 5 68.7 (6) (62.0) Hotel & Catering 6 66.2 (9) (55.4) Accounting/Financial 7 65.6 (7) (56.9) IT & Computing 8 65.6 (4) (62.6) Executive/Professional 9 59.1 (8) (56.4) Engineering* 1 71.8 (4) (62.2) Nursing/Medical/Care 2 70.4 (6) (61.8) IT & Computing 3 70.4 (2) (65.8) Construction* 4 70.2 (4) (62.2) Accounting/Financial 5 68.3 (3) (63.5) Secretarial/Clerical 6 67.6 (7) (61.5) Executive/Professional 7 67.2 (1) (66.5) Blue Collar 8 62.7 (8) (57.4) Hotel & Catering 9 61.0 (9) (57.3) 465054586266707478EngineeringConstructionPermTemp Temporary/contract staff Nursing/Medical/Care was the most sought-after category for temp workers in August, closely followed by Engineering. The slowest growth was signalled for Executive/Professional workers.
- 6. Report on Jobs | Recruitment Industry Survey Recruitment consultants are asked to report whether availability of permanent and temporary staff has changed on the previous month. An overall indicator of staff availability is also calculated. Availability of permanent staff The availability of candidates to fill permanent job vacancies fell further in August, according to recruitment consultants. The rate of decline remained considerable, despite easing to the slowest in three months. More than half of panellists signalled a fall in permanent staff availability, compared with just 7% that indicated a rise. Permanent staff availability decreased in all four English regions during August, with the sharpest reduction indicated in the Midlands. Availability of temp/contract staff Temp staff availability continued to fall in August. The latest drop was the fourteenth in successive months. That said, the rate of decline eased slightly to the slowest since May. Temp availability declined in each of the four English regions, with the Midlands posting the sharpest reduction. 5 Staff availability 19981999200020012002200320042005200620072008200920102011201220132014Temp AvailabilityPermanent Availability50 = no change on previous month2030405060708090Improving availabilityDeteriorating availability2030405060708090Staff Availability50 = no change on previous monthStaff Availability IndexImproving availabilityDeteriorating availability 2014 Mar 13.8 47.9 38.3 -24.5 37.8 38.0 Apr 12.2 50.1 37.7 -25.5 37.2 37.6 May 7.8 51.6 40.5 -32.7 33.6 34.9 Jun 4.9 45.2 49.9 -45.0 27.5 28.9 Jul 8.0 38.6 53.5 -45.5 27.2 28.5 Aug 7.1 41.1 51.8 -44.8 27.6 29.5 Key permanent staff skills reported in short supply:* Accountancy/Financial: Accountants, Audit, Compliance, Credit, Financial Planners, Investment Banking, Risk, Tax, Treasury. Blue Collar: Drivers, Welders. Construction: Contract Managers, Site Agents, Quantity Surveyors. Engineering: CNC, Engineers, Project Managers, Quantity Surveyors, Technical Procurement. Executive/Professional: Business Managers, Commercial, Marketing, Legal. Hotels/Catering: Chefs. Nursing/Medical/Care: Care Workers, Nurses. IT/Computing: Business Intelligence, Java, .Net, SQL, PHP, Programmers, Project Managers. Other: Languages, Quality Managers, Reprographics, Sales, Teachers. Key temp skills reported in short supply:* Accountancy/Financial: Audit, Compliance, Risk, Treasury. Blue Collar: Drivers, Welders. Construction: Trades. Engineering: CNC, Engineers. IT/Computing: Business Intelligence, Developers, Java, Linux, .Net, SQL. Hotels/Catering: Chefs. Nursing/Medical/Care: Care Workers, Nurses. Other: Customer Service, Procurement, Reprographics, Sales. Availability of permanent staff Q. Is the availability of candidates for permanent vacancies better, the same or worse than one month ago? Better Same Worse Net Index S.Adj. % % % +/- Index 2014 Mar 10.6 60.2 29.1 -18.5 40.8 41.7 Apr 10.3 56.6 33.2 -22.9 38.6 39.8 May 9.8 57.6 32.6 -22.8 38.6 40.1 Jun 10.5 51.9 37.6 -27.2 36.4 36.6 Jul 13.0 44.2 42.8 -29.8 35.1 36.5 Aug 12.8 46.5 40.7 -27.9 36.0 37.9 Availability of temporary/contract staff Q. Is the availability of candidates for temporary vacancies better, the same or worse than one month ago? Better Same Worse Net Index S.Adj. % % % +/- Index All Intellectual Property Rights owned by Markit Economics Limited *consultants are invited to specify any areas in which they have encountered skill shortages during the latest month
- 7. Report on Jobs | Recruitment Industry Survey The recruitment industry survey tracks both the average salaries awarded to people placed in permanent jobs each month, as well as average hourly rates of pay for temp/contract staff. Permanent salaries Average starting salaries for people placed in permanent jobs continued to rise in August. The rate of growth remained strong, despite easing slightly for the second month running following June’s series-record high. Around one-third of panellists reported an increase in salaries during the latest survey period, compared with less than 4% that noted a decline. Recruiters commented on a candidate-led market with employers competing for scarce qualified staff for a number of roles. Salaries increased in all four English regions, with the sharpest increase signalled in the South. Temp/contract pay rates Hourly pay rates for temp staff rose again in August. The latest increase was strong and faster than in July, which panellists attributed to robust demand for short-term staff. The North registered the sharpest rise in temp pay rates during August, followed by the Midlands. 6 Pay pressures 199819992000200120022003200420052006200720082009201020112012201320143540455055606570Temp/Contract Hourly Pay RatesPermanent SalariesIncreasing rate of declineIncreasing rate of growth50 = no change on previous monthPay Pressures 2014 Feb 25.5 71.7 2.8 22.7 61.4 61.7 Mar 29.0 67.4 3.6 25.3 62.7 62.2 Apr 32.1 65.8 2.1 30.1 65.0 64.7 May 33.3 62.4 4.3 29.0 64.5 63.9 Jun 38.3 58.2 3.5 34.8 67.4 66.2 Jul 35.9 62.6 1.5 34.4 67.2 66.0 Aug 33.2 63.2 3.6 29.5 64.8 65.7 Higher Same Lower Net Index S.Adj. % % % +/- Index Permanent Salaries Q. Are average salaries awarded to staff placed in permanent positions higher, the same or lower than one month ago? 2014 Feb 15.4 82.1 2.5 13.0 56.5 56.7 Mar 12.9 83.9 3.2 9.7 54.8 54.6 Apr 13.3 85.4 1.3 12.0 56.0 56.5 May 18.6 76.9 4.5 14.2 57.1 57.2 Jun 22.4 74.1 3.5 18.8 59.4 59.7 Jul 18.9 78.2 2.9 16.0 58.0 58.3 Aug 22.8 73.0 4.2 18.7 59.3 59.7 Higher Same Lower Net Index S.Adj. % % % +/- Index Temporary/Contract Pay Rates Q. Are average hourly pay rates for temporary/contract staff higher, the same or lower than one month ago? 20012002200320042005200620072008200920102011201220132014-6-30369Public sectorPrivate sectorAnnual percent change Yr/yr % chg in average weekly earnings (3mma) 2011 2012 2013 Mar'14 Apr May Jun Whole economy 2.4 1.4 1.2 1.9 0.8 0.4 -0.2 Private sector 2.5 1.5 1.4 2.0 0.7 0.3 -0.1 Public sector 2.5 1.3 0.9 1.1 1.0 0.5 -0.5 Services 2.8 1.4 1.1 1.7 0.7 0.2 -0.4 Manufacturing 1.6 1.8 2.2 3.1 2.1 1.8 1.6 Construction 0.9 0.9 0.0 3.1 -0.3 -1.2 -1.4 UK average weekly earnings Data from the Office for National Statistics indicated that employee earnings (including bonuses) fell slightly on an annual basis in the three months to June. The ONS noted that the -0.2% decline partly reflected unusually high bonus payments in April 2013 following the change in the top rate of tax.
- 8. Report on Jobs | Recruitment Industry Survey 7 Feature Regional unemployment KPMG LLP, a UK limited liability partnership, is a subsidiary of KPMG Europe LLP and operates from 22 offices across the UK with over 12,000 partners and staff. The UK firm recorded a turnover of £1.8 billion in the year ended September 2012. KPMG is a global network of professional firms providing Audit, Tax, and Advisory services. We operate in 156 countries and have 152,000 professionals working in member firms around the world. The independent member firms of the KPMG network are affiliated with KPMG International Cooperative (“KPMG International”), a Swiss entity. KPMG International provides no client services. The REC is the professional body representing the UK’s £24.6 billion private recruitment and staffing industry with more than 8,000 recruitment agencies and 6,000 recruitment consultants in membership. There are over 1 million temporary workers registered with UK agencies who are deployed in industry, commerce and the public services every day. is a leading global diversified provider of financial information services. We provide products that enhance transparency, reduce risk and improve operational efficiency. Our customers include banks, hedge funds, asset managers, central banks, regulators, auditors, fund administrators and insurance companies. Founded in 2003, we employ over 3,000 people in 11 countries. For more information, please see www.markit.com. Recruitment Industry Survey The monthly survey features original research data collected via questionnaire by Markit from a panel of 400 UK recruitment and employment consultancies. In 2010/11, some 1,049,333 people were employed in either temporary or contract work through consultancies and 604,193 people were placed in permanent positions through consultancies. Monthly survey data were first collected in October 1997 and are collected in the end of each month, with respondents asked to specify the direction of change in a number of survey variables. Markit do not revise underlying survey data after first publication, but seasonal adjustment factors may be revised from time to time as appropriate which will affect the seasonally adjusted data series. The intellectual property rights to these data are owned by or licensed to Markit Economics Limited. Any unauthorised use, including but not limited to copying, distributing, transmitting or otherwise of any data appearing is not permitted without Markit’s prior consent. The publication or release of any of these data prior to the general release time is an infringement of Markit Economics Limited’s intellectual property rights. Markit shall not have any liability, duty or obligation for or relating to the content or information (“data”) contained herein, any errors, inaccuracies, omissions or delays in the data, or for any actions taken in reliance thereon. In no event shall Markit be liable for any special, incidental, or consequential damages, arising out of the use of the data. Purchasing Managers’ Index® and PMI® are either registered trade marks of Markit Economics Limited or licensed to Markit Economics Limited. Markit is a registered trade mark of Markit Group Limited. South East posts lowest claimant count rate, Northern Ireland highest The UK claimant count edged closer to the one-million mark in July, according the latest data from the Office for National Statistics. Having fallen by 33,600 since June, the claimant count was 1,007,500, its lowest since September 2008. This translated into an unemployment rate of 3.0%, likewise the lowest for a little under six years. Southern UK regions continued to post the lowest unemployment rates, with the South East (1.7%) and South West of England (1.8%) occupying the top two places in the regional ranking (see right-hand table) ahead of the East of England and London respectively. Northern Ireland’s unemployment rate of 5.9% (a five-year low, nonetheless) placed it bottom in the ranking. All Intellectual Property Rights owned by Markit Economics Limited South East 80 1.7 (1) South West 52 1.8 (2) East of England 67 2.2 (3) London 145 2.7 (4) East Midlands 67 2.9 (5) NW & Merseyside 119 3.3 (6) Scotland 93 3.4 (7) West Midlands 108 3.9 (8) Yorks & Humberside 107 4.0 (9) Wales 56 4.0 (9) North East 61 5.0 (11) Northern Ireland 53 5.9 (12) Claimant count (Jul’14) Region ‘000s Rate (%)* Rank Source: Department for Work & Pensions and National Statistics. * As a percentage of Claimant Count + Workforce Jobs.