This document discusses several long-term factors that influence voting behavior in Britain:
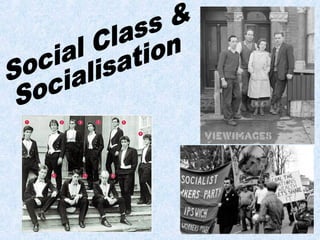
1. Class was traditionally the main determinant of voting patterns, with over two-thirds of working class supporting Labour and four-fifths of the middle class supporting the Conservatives.
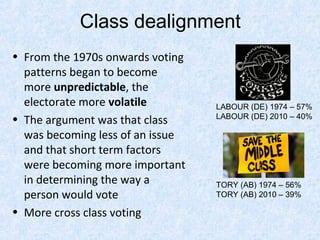
2. Beginning in the 1970s, voting patterns became less predictable as class became a less dominant factor, and short-term issues gained more influence over how people voted.
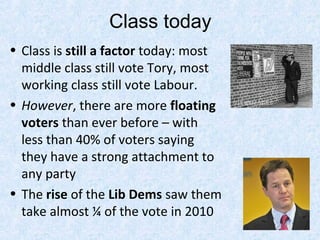
3. While class still influences votes today, with middle class still tending to vote Conservative and working class tending to vote Labour, fewer voters now have a strong attachment to any single party.