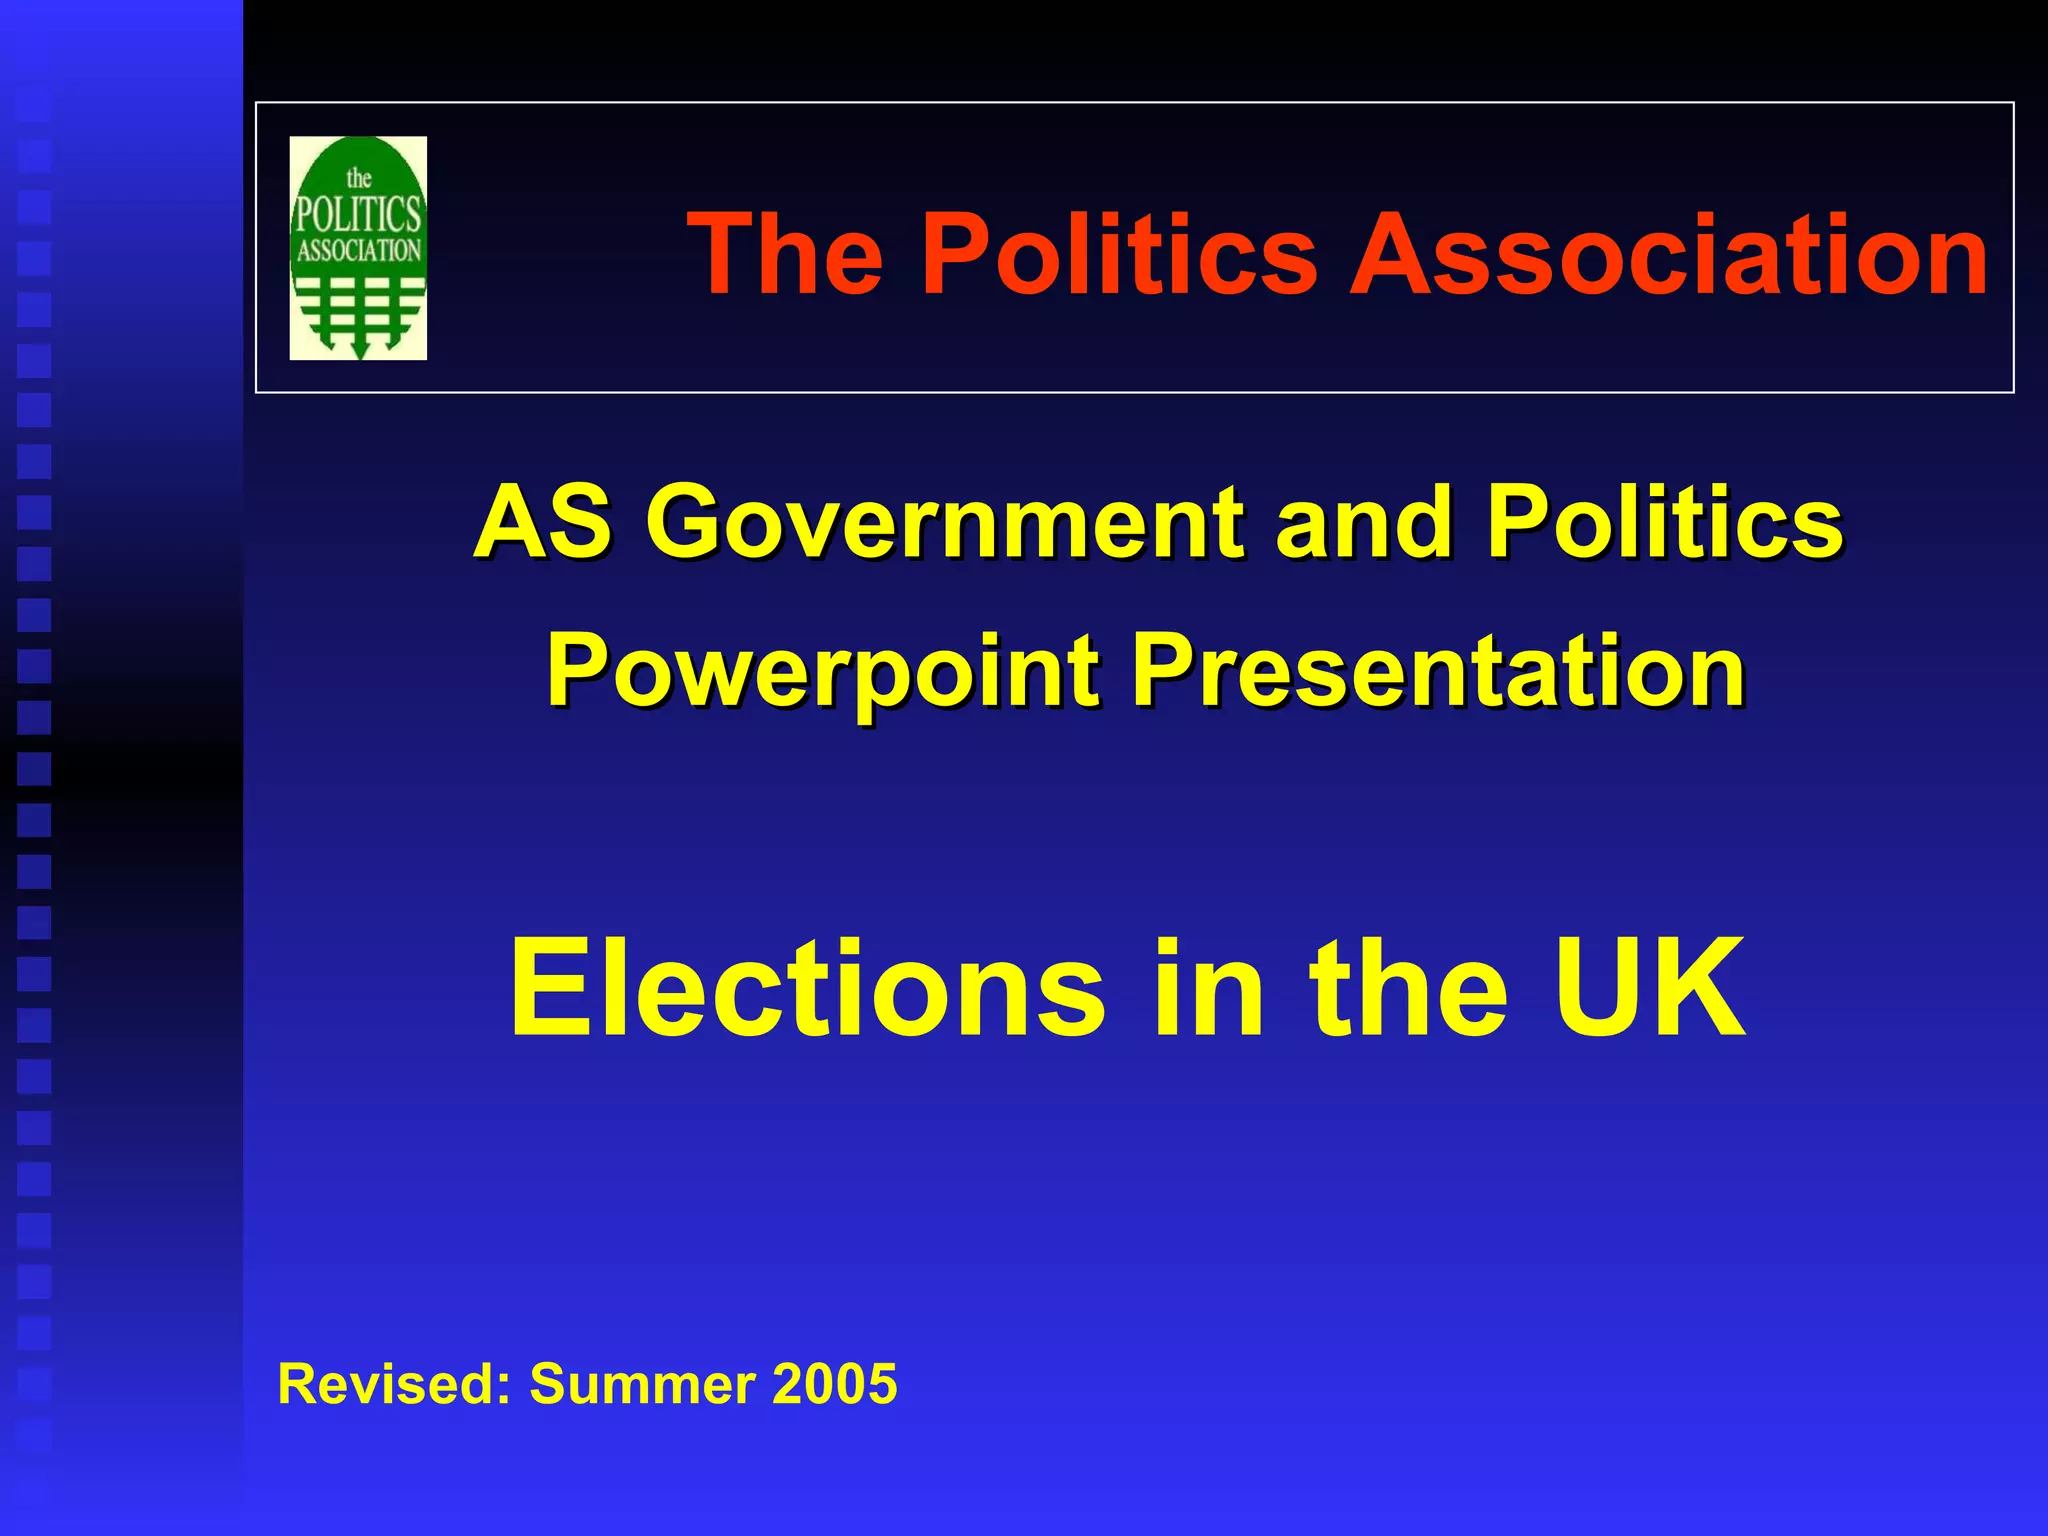
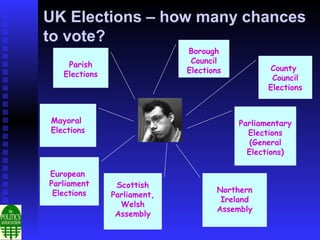
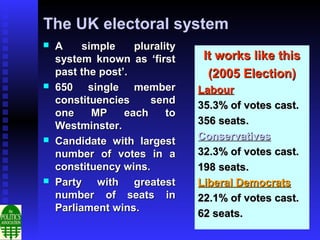
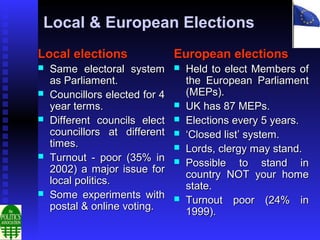
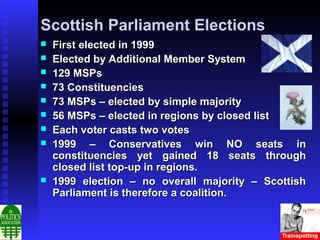
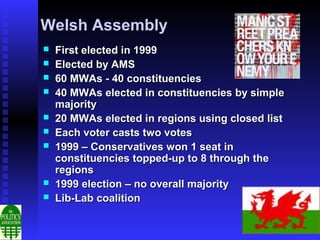
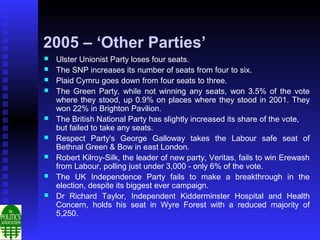
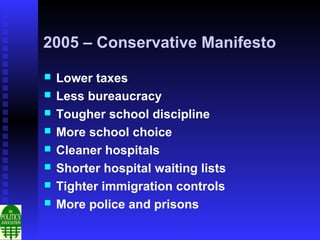
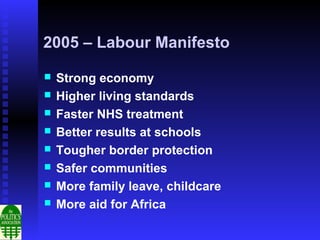
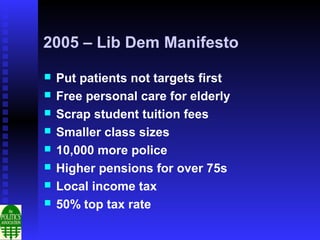
1. The Politics Association
AS Government and Politics
Powerpoint Presentation
Elections in the UK
Revised: Summer 2005
2. UK Elections – how many chances
to vote?
Borough
Parish Council
Elections County
Elections Council
Elections
Mayoral Parliamentary
Elections Elections
(General
Elections)
European
Parliament Scottish
Elections Northern
Parliament,
Ireland
Welsh
Assembly
Assembly
3. NO
Can he vote?
•Member of the
House of Lords
•Detained under YES
Mental Health Act
•Over 18
•In prison
•On the electoral register
•Conviction of corrupt
•Commonwealth citizen,
/ illegal electoral
Rep. Of Ireland citizen –
practice in last five
resident in UK
years
•UK citizens living abroad
up to 20 years
4. Which means . . .
He can’t vote . . . But Kylie can . . .
5. It’s useful to know a bit of the
history…
•1832 – Great Reform Act
By the end of the 19th
•1867 – Second Reform Act
century only 28% of
•1884/5 – Third Reform Act the adult population
had the opportunity to
vote.
Property became less
an less important as a
None of the 19th century qualification to vote.
reforms gave women the
vote.
6. and in the 20th century . . .
Representation of the
‘Votes for Women’ People Act 1918
•Women •Electorate rises from 7.7m to 21.4m.
had been
•All men over 21 and women over 30
campaigning since 1867.
given vote.
•Suffragettes and Equal Franchise Act 1928
Suffragists organised
campaigns in the late 19th •Women given vote on same terms
as men.
and early 20th centuries.
•5m new voters created.
•The campaign was Representation of the
disrupted by World War
One, yet the political
People Act 1949
•Business & undergraduate votes
argument appeared to
abolished.
have been won. •6 month residence qualification
removed.
Minimum voting age lowered to 18 in 1969.
7. Who can stand for Parliament?
Aged 21 or over?
A British citizen?
You also need . . .
Bankrupt? •Nomination papers
•£500 deposit
A member of the judiciary?
In prison? • Strict spending limits.
•Election spending is
A vicar? audited.
Member of the Lords? •Neill Report (1988) -
recommended cap on
Police officer? election spending.
In the army?
A civil servant?
Local government officer?
Lord Neill
8. The UK electoral system
A simple plurality
system known as ‘first It works like this
past the post’. (2005 Election)
650 single member Labour
constituencies send 35.3% of votes cast.
one MP each to
Westminster. 356 seats.
Candidate with largest Conservatives
number of votes in a 32.3% of votes cast.
constituency wins. 198 seats.
Party with greatest Liberal Democrats
number of seats in 22.1% of votes cast.
Parliament wins.
62 seats.
9. Local & European Elections
Local elections European elections
Same electoral system Held to elect Members of
as Parliament. the European Parliament
Councillors elected for 4 (MEPs).
year terms. UK has 87 MEPs.
Different councils elect Elections every 5 years.
councillors at different ‘Closed list’ system.
times. Lords, clergy may stand.
Turnout - poor (35% in Possible to stand in
2002) a major issue for country NOT your home
local politics. state.
Some experiments with Turnout poor (24% in
postal & online voting. 1999).
10. Scottish Parliament Elections
First elected in 1999
Elected by Additional Member System
129 MSPs
73 Constituencies
73 MSPs – elected by simple majority
56 MSPs – elected in regions by closed list
Each voter casts two votes
1999 – Conservatives win NO seats in
constituencies yet gained 18 seats through
closed list top-up in regions.
1999 election – no overall majority – Scottish
Parliament is therefore a coalition.
11. Welsh Assembly
First elected in 1999
Elected by AMS
60 MWAs - 40 constituencies
40 MWAs elected in constituencies by simple
majority
20 MWAs elected in regions using closed list
Each voter casts two votes
1999 – Conservatives won 1 seat in
constituencies topped-up to 8 through the
regions
1999 election – no overall majority
Lib-Lab coalition
12. Northern Ireland Assembly
Product of the 1998 Good Friday Agreement
Assembly has 108 members
Elected in June 1998 by STV
Turnout 69% - higher than Scotland & Wales
Governing Executive – 12 assembly members
Assembly currently suspended
14. Case Study 2005 General Election
356 198 62
Party Seats + - Net
DUP 9 4 0 +4
SNP 6 2 0 +2
SF 5 1 0 +1
PC 3 0 1 -1
SDLP 3 1 1 0
IKHH 1 0 0 0
UUP 1 0 5 -5
Others 2 2 0 +2
15. 2005 - Turnout
Highest – South West England – 66.6%
Lowest – North West – 57.1%
Whole UK turnout – 61.3% (+ 2%)
16. 2005 – ‘Other Parties’
Ulster Unionist Party loses four seats.
The SNP increases its number of seats from four to six.
Plaid Cymru goes down from four seats to three.
The Green Party, while not winning any seats, won 3.5% of the vote
where they stood, up 0.9% on places where they stood in 2001. They
won 22% in Brighton Pavilion.
The British National Party has slightly increased its share of the vote,
but failed to take any seats.
Respect Party's George Galloway takes the Labour safe seat of
Bethnal Green & Bow in east London.
Robert Kilroy-Silk, the leader of new party, Veritas, fails to win Erewash
from Labour, polling just under 3,000 - only 6% of the vote.
The UK Independence Party fails to make a breakthrough in the
election, despite its biggest ever campaign.
Dr Richard Taylor, Independent Kidderminster Hospital and Health
Concern, holds his seat in Wyre Forest with a reduced majority of
5,250.
17. 2005 – Conservative Manifesto
Lower taxes
Less bureaucracy
Tougher school discipline
More school choice
Cleaner hospitals
Shorter hospital waiting lists
Tighter immigration controls
More police and prisons
18. 2005 – Labour Manifesto
Strong economy
Higher living standards
Faster NHS treatment
Better results at schools
Tougher border protection
Safer communities
More family leave, childcare
More aid for Africa
19. 2005 – Lib Dem Manifesto
Put patients not targets first
Free personal care for elderly
Scrap student tuition fees
Smaller class sizes
10,000 more police
Higher pensions for over 75s
Local income tax
50% top tax rate