
Recommended
Recommended
More Related Content
What's hot
What's hot (18)
Similar to Exploring the Relationship between Moisture Content and Electrical Resistivity for Sandy and Silty Soils
Similar to Exploring the Relationship between Moisture Content and Electrical Resistivity for Sandy and Silty Soils (20)
Recently uploaded
Recently uploaded (20)
Exploring the Relationship between Moisture Content and Electrical Resistivity for Sandy and Silty Soils
- 1. International Journal of Engineering Science Invention ISSN (Online): 2319 – 6734, ISSN (Print): 2319 – 6726 www.ijesi.org ||Volume 5 Issue 7|| July 2016 || PP. 42-47 www.ijesi.org 42 | Page Exploring the Relationship between Moisture Content and Electrical Resistivity for Sandy and Silty Soils Danish Kazmi1 , Sadaf Qasim1 , Fahad Irfan Siddiqui2 , Syed Baharom Azhar3 1 (Civil Engineering Department, NED University of Engineering and Technology, Karachi-Pakistan) 2 (Department of Mining Engineering, Mehran University of Engineering and Technology, Jamshoro- Pakistan 3 (Department of Civil and Environmental Engineering, Universiti Teknologi Petronas, Tronoh-Malaysia) Abstract: Conventional borehole sampling and its subsequent geotechnical testing is the most precise and direct method of soil characterization, but conversely it is time-consuming and expensive simultaneously. Electrical resistivity surveys can provide a non-destructive and less expensive way of determining soil properties, if reliable correlations could be established through extensive testing. The main objective of this research work is to establish quantitative relationship of resistivity with moisture content of sandy and silty soils that can be used in geotechnical appraisal of soil slopes. A non-linear relationship trend is observed between moisture content and electrical resistivity values obtained in field and laboratory conditions. Keywords: Borehole sampling, Electrical resistivity, Moisture content, Soil slopes, Regression I. Introduction Conventional borehole sampling and subsequent geotechnical testing is the most accurate and direct method of soil characterization, but conversely it is time-consuming and expensive. Accurate assessment of soil properties required close spacing drilling which would be very expensive in many conditions (Larisa Pozdnyakova, 1999; L. Pozdnyakova, Pozdnyakov, & Zhang, 2001). Electrical resistivity surveys can provide a non-destructive and less expensive way of assessing soil properties, if reliable correlations could be establish through extensive testing. The main objective of the current research work is to establish quantitative relationship of resistivity with moisture content of sandy and silty soils that can be used in geotechnical appraisal of soil slopes. The electrical current flows in soil by electronic and electrolytic conduction. Some specific soil minerals usually metallic minerals conduct current through electronic conduction. However, conducting minerals are rarely exists in sufficient quantity to have considerable effect on the electrical properties of soil. Electrolytic conduction is mainly responsible for the flow of current in soils through the movement of ions in pore fluid. Electrical resistivity of soil depends on various factors such as mineralogy, porosity, pore fluid chemistry, degree of saturation, pore geometry, particle size distribution, salinity, and temperature. The quantity and quality of water in soil has a significant effect on electrical resistivity. Electrical resistivity decreases with increasing moisture content in soils. Electronic conduction is more likely to occur in clayey soil. Chemical composition of water contained in pore spaces of soil material also affects resistivity. Higher concentration of dissolved ions in pore fluids facilitates conduction of electric current thus reducing the resistivity. Kalinski and Kelly (Kalinski & Kelly, 1993) investigated relationship between resistivity and water content of soil. They used different pore fluids with varying conductivity and found that at given water content, resistivity decreases as the water conductivity increase. Arrangement and geometry of pores influences the electrical resistivity in soils. Lower electrical resistivity values are obtained at higher percentage of fines. In general, soils with more fines often contain a higher percentage of conductive clay particles (Abu-Hassanein, Benson, & Blotz, 1996). Clayey soils generally have lower resistivity values than sandy soils. However, saturated sandy soils may exhibit low resistivity than dry compacted clayey soil. Due to these factors, overlapping of resistivity values is observed for different type of soils. Increase in temperature reduces the electrical resistivity of soil due to ions agitation. (Campbell, Bower, & Richards, 1948) found that increase in temperature by 1o C increases the electrical conductivity by 2.02% thus decreasing the electrical resistivity. The amount of water in soils greatly affects its resistivity. In coarse-grain soils, pore-water facilitates current conduction as ions can free moves in fluid medium, thus generates electrolytic conduction. Clayey soils generally have lower resistivity values as the current conduction takes place through electrolytic as well as electronic conduction. Several previous researches showed that moisture content is key factor that controls electrical resistivity in soil. Non-linear relationship between resistivity and water content has been observed in all published literature (Abu-Hassanein et al., 1996; Cosenza et al., 2006; Giao, Chung, Kim, & Tanaka, 2003; Kalinski & Kelly, 1993; McCarter, 1984; Ferhat Ozcep, Tezel, & Asci, 2009; Larisa Pozdnyakova, 1999).
- 2. Exploring the Relationship between Moisture Content and Electrical Resistivity for sandy and silty.. www.ijesi.org 43 | Page (Archie, 1942) was the first to investigate electrical resistivity of water-saturated strata. (Voronin, 1986) introduced break points in relationship curve of resistivity and water content divided into four linear segments, i.e. absorbed, film, film-capillary, and gravitational water zone. Fig 1 shows the work of (Pozdnyakov, Pozdnyakova, & Karpachevskii, 2006) primarily based on (Voronin, 1986). -1 -0.5 0 0.5 1 1.5 2 0 1000 2000 3000 4000 5000 6000 ln(W) Electrical Resistivity (Ohm.m) I II III IV Adsorbed Water Film Water Film-Capillary Water Capillary Water Gravitational Water Figure 1: Segmented-linear correlation of electrical resistivity and natural logarithm of water content; modified after (Pozdnyakov et al., 2006) It can be learned from Fig 1 that, resistivity decreases sharply with water content in Zone I (absorbed water) & Zone II (film water), whereas in high moisture zones (capillary III and gravitational IV), the effect of moisture content on resistivity is relatively insignificant. Similar trends have been found by various studies (Cosenza et al., 2006; Fukue, Minato, Horibe, & Taya, 1999; Syed, Fikri, & Siddiqui, 2011) as shown in Fig 2. These studies showed that below 20% moisture content, effect of moisture content on resistivity become insignificant. Some studies reported this effect at <15% (McCarter, 1984; Michot et al., 2003). 0 10 20 30 40 50 60 0 200 400 600 800 1000 1200 MoistureContent% Electrical Resistivity (Ohm.m) Fukueet al. 1999 Cosenza et al. 2006 Syed et al. 2011 Figure 2: Relationship between water content and resistivity II. Materials and methods The experimental work comprises of four major phases; field resistivity surveys, soil boring, laboratory resistivity measurements, and soil characterization tests. Soil boring was performed using handheld drill at 10 different locations. The soil samples were secured in PVC foil and brought to laboratory for soil characterization test. The laboratory resistivity tests were also performed on soil samples in laboratory conditions. The vertical electrical sounding or 1D survey was conducted at the locations of all ten boreholes. VES is the simplest of all resistivity surveys, providing one dimensional resistivity values of sub-surface soil. 1D resistivity sounding were carried out using very simple equipments i.e. handheld multimeter, D.C. power source, insulated wires, measuring tapes, and stainless steel electrodes. This research work also intended to use simple and inexpensive equipments for resistivity survey rather than expensive and sophisticated resistivity equipments. The process of obtaining resistivity values of sub-surface soil comprises of injection of controlled current through two electrodes and measuring resulting potential difference by another pair of electrodes. In this study, Wenner protocol was used for VES survey. Four electrodes were inserted in soil surface at equal space. Electrodes were properly hammered into soil surface to ensure good contact. Two outer electrode A & B supplied with 0.2 amperes current by DC power supply and resulting potential difference (voltage) was
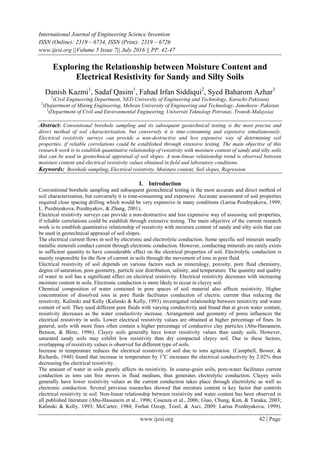
- 3. Exploring the Relationship between Moisture Content and Electrical Resistivity for sandy and silty.. www.ijesi.org 44 | Page measured using multimeter. Equipment and accessories are shown in Figure 3. Distance between electrodes was ranged from 0.5 to 5 meters in order to investigate deeper sub surface soil. Figure 3: Equipments and accessories used in VES survey Electrical resistivity of soil samples from all boreholes at various depths was measured in order to determine resistivity values in laboratory condition. The DC variable power supply unit with dual output was used for this purpose. Figure 4 shows laboratory electrical resistivity arrangements. Figure 4: Laboratory electrical resistivity arrangements III. Results and discussions A non-linear relationship trend is observed between moisture content and electrical resistivity values obtained in field and laboratory conditions. The significant power correlations were observed for all soil samples in both laboratory and field relationships with regression co-efficient R2 =0.59 and R2 =0.54 respectively (as shown in Fig 5 & 6). Electrical resistivity decreases with increasing moisture content in soils as reported in various previous studies (Cosenza et al., 2006; Fukue et al., 1999; Giao et al., 2003; McCarter, 1984; Ferhat Ozcep et al., 2009; F. Ozcep, Yildirim, Tezel, Asci, & Karabulut, 2010; Pozdnyakov et al., 2006; Larisa Pozdnyakova, 1999; Syed et al., 2011). Higher moisture content facilitates conduction of electrical current through movement of ions in pore water. y = 106.65x-0.271 R² = 0.5954 0 10 20 30 40 50 60 0 1000 2000 3000 4000 5000 MoistureContent% Electrical Resistivity (ohm.m) Figure 5: Correlation between laboratory resistivity and moisture content for all soil samples
- 4. Exploring the Relationship between Moisture Content and Electrical Resistivity for sandy and silty.. www.ijesi.org 45 | Page y = 92.862x-0.261 R² = 0.5442 0 10 20 30 40 50 60 0 1000 2000 3000 4000 5000 6000 7000 MoistureContent% Electrical Resistivity (ohm.m) Figure 6: Correlation between field resistivity and moisture content for all soil samples Fig 7 compares the moisture-resistivity relationship obtained by the current research and established relationships reported in published literatures (Cosenza et al., 2006; Fukue et al., 1999; Syed et al., 2011). The moisture-resistivity relationship model obtained by current research shows greater similarity with the relationship established by (Cosenza et al., 2006) 0 10 20 30 40 50 60 1 10 100 1000 10000 MoistureContent% Electrical Resistivity (Ohm.m) Fukueet al. 1999 Cosenza et al. 2006 Syed et al. 2011 Current Research- Lab Current Research- Field Figure 7: Comparison between moisture-resistivity model found by current research with published relations Relationship of laboratory and field resistivity with moisture was also determined for each soil type individually. In silty-sand soils, obtained correlation coefficient is R2 =0.271 and R2 =0.278 respectively for laboratory and field relationships as shown in Fig 8 & 9, which are not as good as it was observed in sandy soils with correlation coefficient; R2 =0.537 and R2 =0.540 as shown in Fig 10 and 11. The reason for relatively higher correlation coefficient in case of sandy soil samples is possibly due to lower moisture content. According to (Voronin, 1986), at lower moisture content the effect of moisture on resistivity is significant and shows good relationship whereas at higher moisture content the effect of moisture on resistivity is relatively insignificant. y = 64.563x-0.16 R² = 0.2717 0 10 20 30 40 50 60 0 200 400 600 800 1000 1200 1400 MoistureContent% Electrical Resistivity (ohm.m) Figure 8: Correlation between moisture content and laboratory electrical resistivity of silty-sand soil samples
- 5. Exploring the Relationship between Moisture Content and Electrical Resistivity for sandy and silty.. www.ijesi.org 46 | Page y = -4.643ln(x) + 53.109 R² = 0.2786 0 10 20 30 40 50 60 0 200 400 600 800 1000 MoistureContent% Electrical Resistivity (ohm.m) Figure 9: Correlation between moisture content and field electrical resistivity of silty-sand soil samples y = -4.467ln(x) + 46.859 R² = 0.5375 0 10 20 30 40 50 60 0 1000 2000 3000 4000 5000 MoistureContent% Electrical Resistivity (ohm.m) Figure 10: Correlation between moisture content and laboratory electrical resistivity of sandy soil samples y = 18.61e-2E-04x R² = 0.5402 0 10 20 30 40 50 60 0 1000 2000 3000 4000 5000 6000 7000 MoistureContent% Electrical Resistivity (ohm.m) Figure 11: Correlation between moisture content and field electrical resistivity of sandy soil samples IV. Conclusion Borehole sampling provides accurate sub-surface information, yet it is very time-consuming, invasive and expensive. Electrical resistivity surveys can provide a non-destructive and less expensive way of assessing soil properties, if reliable correlations could be established through extensive testing. The primary objective of the current research work is to establish quantitative relationship of resistivity with moisture content of sandy and silty soils that can be used in geotechnical appraisal of soil slopes. Relationship between moisture content and resistivity values obtained in field and laboratory resistivity values demonstrates the non-linear correlation. Correlation coefficient is higher in case of sandy soils. The possible reason for relatively higher correlation coefficient in case of sandy soil samples is possibly due to lower moisture content. According to (Voronin, 1986), at lower moisture content the effect of moisture on resistivity is significant and shows good relationship whereas at higher moisture content the effect of moisture on resistivity is relatively insignificant. V. Limitations Of Research The current research has following limitations: 1. Only applicable to silty sand and sandy soils having moisture content ranges from 6.11% to 52.42%. 2. Laboratory electrical resistivity should ranges between 16 to 4500 Ωm.
- 6. Exploring the Relationship between Moisture Content and Electrical Resistivity for sandy and silty.. www.ijesi.org 47 | Page 3. Field electrical resistivity values should ranges between 10 to 6000 Ωm. 4. Depth of investigation is 3m. VI. Recommendations The following recommendations are proposed for the development of full-scale method of geotechnical assessment based on electrical resistivity survey; 1. The obtained correlations of resistivity and various soil parameters of soil are specific to silty-sand and sandy soil conditions. For generalized correlations, more tests and field surveys should be performed in different geological conditions. 2. The specific relationship of resistivity and strength properties i.e. cohesion and friction angle should be more elaborated by further experimentation in controlled conditions over various types of soils. 3. More resistivity and geotechnical tests should be performed in clayey soil conditions. 4. A combine comparison of resistivity and soil strength properties along with chemical properties such as CEC, pH, mineralogical composition should also be conducted. 5. Pilot-scale physical models of flat and sloping grounds with various soil types should be designed to perform resistivity tests by varying different parameters such as moisture content, consolidation, compaction, temperature, void ratio, porosity, grain-size etc. References [1]. Abu-Hassanein, Z. S., Benson, C. H., and Blotz, L. R. (1996). "Electrical resistivity of compacted clays." Journal of Geotechnical Engineering - ASCE, 122(5), 397-406. [2]. Archie, G. E. (1942). "The electrical resistivity log as an aid in determining some reservoir characteristics." Trans. AM. Inst. Min. Metall. Pet. Eng, 146, 54-62. [3]. Campbell, R. B., Bower, C. A., and Richards, L. A. (1948). "Cha nge of electrical conductivity with temperature and the relation of osmotic pressure to electrical conductivity and ion concentration for soil extracts." Soil Sci. Soc. Am. Proc., 13, 66-69. [4]. Cosenza, P., Marmet, E., Rejiba, F., Jun Cui, Y., Tabbagh, A., and Charlery, Y. (2006). "Correlations between geotechnical and electrical data: A case study at Garchy in France." Journal of Applied Geophysics, 60(3-4), 165-178. [5]. Fukue, M., Minato, T., Horibe, H., and Taya, N. (1999). "The micro-structures of clay given by resistivity measurements." Engineering Geology, 54(1-2), 43-53. [6]. Giao, P. H., Chung, S. G., Kim, D. Y., and Tanaka, H. (2003). "Electric imaging and laboratory resistivity testing for geotechnical investigation of Pusan clay deposits." Journal of Applied Geophysics, 52(4), 157-175. [7]. Kalinski, R. J., and Kelly, W. E. (1993). "Estimating water content of soils from electrical resistivity." Geotechnical Testing Journal, 16(3), 323-329. [8]. McCarter, W. J. (1984). "ELECTRICAL RESISTIVITY CHARACTERISTICS OF COMPACTED CLAYS." Geotechnique, 34(2), 263-267. [9]. Michot, D., Benderitter, Y., Dorigny, A., Nicoullaud, B., King, D., and Tabbagh, A. (2003). "Spatial and temporal monitoring of soil water content with an irrigated corn crop cover using electrical resistivity tomography." Water Resour. Res, 39, 1138-1158. [10]. Ozcep, F., Tezel, O., and Asci, M. (2009). "Correlation between electrical resistivity and soil-water content: Istanbul and Golcuk." International Journal of Physical Sciences, 4(6), 362-365. [11]. Ozcep, F., Yildirim, E., Tezel, O., Asci, M., and Karabulut, S. (2010). "Correlation between electrical resistivity and soil-water content based artificial intelligent techniques." International Journal of Physical Sciences, 5(1), 47-56. [12]. Pozdnyakov, A. I., Pozdnyakova, L. A., and Karpachevskii, L. O. (2006). "Relationship between Water Tension and Electrical Resistivity in Soils." Eurasian Soil Science, 39, S78–S83. [13]. Pozdnyakova, L. (1999). Electrical Properties of Soils, University of Wyoming, Laramie, WY, USA. [14]. Pozdnyakova, L., Pozdnyakov, A., and Zhang, R. (2001). "Application of geophysical methods to evaluate hydrology and soil properties in urban areas." Urban Water, 3(3), 205-216 [15]. Osman, S. B. S., Fikri, M. N., & Siddique, F. I. (2012). Correlation of electrical resistivity with some soil parameters for the development of possible prediction of slope stability and bearing capacity of soil using electrical parameters. Pertanika Journal Scince and Technology [16]. Voronin, A. D. (1986). The Bases of Soil Physics: Mosk. Gos. Univ., Moscow