

Recommended
Recommended
More Related Content
What's hot
What's hot (19)
Viewers also liked
Viewers also liked (20)
Similar to G012645256.iosr jmce p1
Similar to G012645256.iosr jmce p1 (20)
More from IOSR Journals
Recently uploaded
Recently uploaded (20)
G012645256.iosr jmce p1
- 1. IOSR Journal of Mechanical and Civil Engineering (IOSR-JMCE) e-ISSN: 2278-1684,p-ISSN: 2320-334X, Volume 12, Issue 6 Ver. IV (Nov. - Dec. 2015), PP 52-56 www.iosrjournals.org DOI: 10.9790/1684-12645256 www.iosrjournals.org 52 | Page Determination of Thickness of Aquifer with Vertical Electrical Sounding S.O. AGHA1 , C. Agha2 and U. IBURU1 1. Department of Industrial Physics, Ebonyi State University, Abakaliki, Nigeria 2. Department of Science Education, Ebonyi State University, Abakaliki, Nigeria Abstract: Depth profiling of resistivity survey aimed at determining the average thickness of aquifer in Abakaliki was carried out using ABEM terrameter (SAS 300C). Three locations within the study area were selected and surveyed and the sounding curves generated showed five geoelectrical layers delineated by the current. The layers were found to have average thicknesses of 2.38m for the first layer; 5.90m for the second layer; 11.27m for the third layer and 28.86m for the fourth layer. The thickness of the fifth layer could not be determined. The fourth layer which was interpreted as probably wet and fractured shales was the aquifer identified in the study area. The thickness of the aquifer was estimated to be 29m. Keywords: Aquifer, resistivity, shale, geoelectrical. I. Introduction An aquifer is a geological formation that is capable of yielding economic quantity of water to man through wells. It must be porous, permeable and saturated. Certain geological deposits are of recurring interest as aquifers. Among the most common are unconsolidated sands and gravels of alluvial, glacial, and deltaic origin; sedimentary rocks, especially limestones and dolomites, and sandstones and conglomerates; and porous or fractured volcanic rocks. (Freeze and Cherry, 1979). There are two surface geophysical techniques that are commonly used in the exploration for aquifers. These are the seismic refraction method and the electrical resistivity method. The seismic refraction method is based on the fact that elastic waves propagate through different earth materials at different velocities. The denser the material, the higher the wave velocity. In groundwater investigation, the seismic refraction method has been used to determine such features as the depth to bedrock, the presence of buried bedrock channels, the thickness of fracture zones and the area coverage of potential aquifers. However in Abakaliki urban, the electrical resistivity method has been more commonly applied in aquifer exploration than the seismic refraction method. The Ebonyi State Rural Water Supply and Sanitation Agency (EBRUWASSA) carried out electrical resistivity survey at the premises of the strategic grain reserve complex, Ezillo, for underground water development using depth sounding approach (VES). The result of the survey showed that the aquifer which was located at the fourth geoelectrical layer 31.1m from the surface was likely to be made up of hard, fissile and fractured shale. The resistivity of this layer was found to be 311.07Ωm. The aquifer thickness was estimated to be 14.9m (Obini, 2005). Among the many geophysical techniques, the resistivity method has the greatest application in Abakaliki and indeed Ebonyi state at large because of the availability of the terrameter and its accessories. This is about the only geophysical equipment routinely used by EBRUWASSA and other researchers in the study area. II. Location And Geology Of Study Area The study area is Abakaliki urban. It is located within the southeastern part of the lower Benue trough. The area lies between longitudes 80 5' 80 10'E and latitudes 60 15' -60 20'N and has an area of about 81km2 (Johnson, 1996; Kogbe, 1976). It lies within the Asu River group and consists of poorly-bedded shales and occasionally, sandy,splintery, metamorphosed mudstones. Lenses of sandstone and sandy limestone are highly joined and fractured. The Albian shale formation in the study area has igneous intrusions. The intrusive bodies in combination with numerous faults and joint systems have created fractures and secondary porosity in the study area. The area is moderately flat. Elevation ranges from 46m to 72m above mean sea level. The highland is sustained by undulating sandstone while the lowland is mainly shaly and consists of mudstones. The sediments are folded and fractured particularly in the country south of the study area. The fold areas stretch NW-SE. Hydrogeologically, groundwater development is not extensive. Weatherd rocks, alluvium and fractured zones form the aquifer. However, pockets of weathered and fractured rocks may form isolated groundwater reservoirs.(Agha et al, 2014).
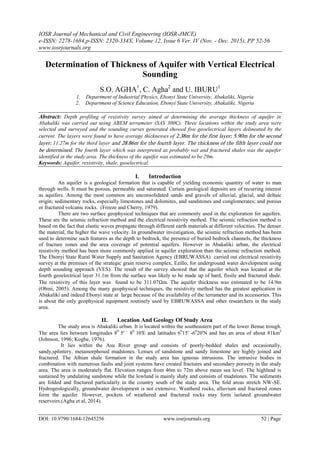
- 2. Determination Of Thickness Of Aquifer With Vertical Electrical Sounding DOI: 10.9790/1684-12645256 www.iosrjournals.org 53 | Page Figure 1: Location map of Abakaliki showing the VES stations III. Materials And Method The materials used in this research work are ABEM terrameter (SAS 300C), and its assessories including current and potential pairs of electrodes and cables. Electrical resistivity of a geological formation, is the resistance to electrical current for a unit block of cross-sectional area, A and length L. The resistivity controls the gradient that will be set up in a formation under the influence of an applied current. In this survey, electric current was passed into the ground at the locations chosen, through a pair of current electrodes and the potential drop was measured across a pair of potential electrodes. The spacing of the electrodes controls the depth of penetration. At each set up, an apparent resistivity, a was calculated on the basis of the measured potential drop, the applied current and the electrode spacing. Series of measurements were made for depth profiling or vertical electrical sounding (VES). The apparent resistivity values were plotted against half current electrode spacing AB/2 and stratigraphic interpretations were made using computer modeling. 60 201 N JUJU HILL EBSU Water work s ogoja ABAKALIKI Ebonyi River 80 051 90 101 E 60 201 N 60 171 N LEGAND INTRUSIVE ALRIAN A SU RIVER GROUP 0 1 2 3km Fig. 2: Geological map of study area 60 171 N
- 3. Determination Of Thickness Of Aquifer With Vertical Electrical Sounding DOI: 10.9790/1684-12645256 www.iosrjournals.org 54 | Page IV. Results And Interpretation The resisitivity curves (VES) generated from the survey for the three locations selected within the study area are shown in Figs 3-5 below. The locations sounded include Unity square, Ebonyi Hotels and Hope High chool.(See Fig. 1 above). The interpretations of the graphs are as shown in Tables 1-3 below. Fig. 4.1: VES Curve for Unity Square
- 4. Determination Of Thickness Of Aquifer With Vertical Electrical Sounding DOI: 10.9790/1684-12645256 www.iosrjournals.org 55 | Page Table 1: Interpretation of result from location 1 (Unity square) Layer Depth(m) Thickness(m) Resistivity a (m) Lithology 1 0.58 0.58 1119.86 Loose but lateritic over burdens 2 6.92 6.34 424.22 Ferruginised clay concretions(probably wet) 3 15.33 8.41 836.90 Limestone bed (probably dry) 4 36.70 21.37 253.75 Well compacted but fissile shale bed (likely fractured and wet) 5 Based not reached 118.24 Compact mineralized mudstone (probably wet) Table 2: Interpretation of result from location 2 (Ebonyi hotels) Layer Depth (m) Thickness (m) Resistivity a (m) Lithology 1 1.1 1.1 872.94 Lateritic overburden earth 2 5.8 4.7 268.34 Ferrugnisied clay concretions (probably wet) 3 11.8 6.0 1169.84 Siltstone bed (probably dry) 4 42.6 30.8 176.17 Well compacted but fissile shale bed(probably fractured and wet) 5 Base not reached 80.67 Well consolidated and mineralized mudstone Table 3: Interpretation of result from location 3, (Hope High school ) Layer Depth (m) Thickness (m) Resistivity a (m) Lithology 1 0.7 0.7 814.31 Loose but lateritic over burden 2 7.4 6.7 162.05 Ferruginised clay concretions(probably wet) 3 25.8 19.4 162.05 Well consolidated but fissile shale bed Well consolidated mineralized mudstone bed(probably fractured and wet) 4 60.2 34.4 57.74 Well consolidated mineralized mudstone bed(probably fractured and wet) 5 Base not reached 1152.92 Hard fissile shale (likely fractured and wet). V. Conclusion From the foregoing analysis and interpretations, the average apparent resistivity values and thicknesses in Abakaliki were estimated to be 935.70Ωm and 2.38m for the first layer; 284.87Ωm and 5.9m for the second layer; 722.93Ωm and 11.27m for the third layer; 162.55Ωm and 28.86m for the fourth layer. The fifth layer has average apparent resistivity of 450.61Ωm and an undetermined depth. The fourth layer with a thickness of 28.86m was identified therefore as the aquiferous layer in the study area. This aquifer probably consists of wet and fractured shales. 100 1000 1000 10 10 100 5
- 5. Determination Of Thickness Of Aquifer With Vertical Electrical Sounding DOI: 10.9790/1684-12645256 www.iosrjournals.org 56 | Page VI. Suggestions It is suggested that the seismic refraction method as an alternative surface geographical method for investigations of this kind be used in the study area for confirmation of findings. Acknowledgement The authors are grateful to the Ebonyi State Rural water supply and sanitation agency (EBRUWASSA) for the release of their equipments which were used for the data acquisition. References [1]. Agha, S.O., Anyigor, S.I and Uwa, R.C. (2014) International Journal of Science and Advanced Technology.4(5),pp11-19. [2]. Allison, I.S, and Palmer, D.F, (1980): The science of changing earth, Geology, 7th edition. pp55-57. [3]. Egboka, B.C.E. and Okpoko, E.I., (1984): Gully erosion in the Agulu Nanka region of Anambra state Nigeria. In: Challenges in African Hydrology:335-347. [4]. Freeze, R.A. and Cherry, J.A. (1978): Groundwater, prentice-Hall Inc, Englewood Chiffs, new Jersey. [5]. Griffiths. D.H., and King R.F, (1981): Applied Geophysics for Geologists and Engineers, perganion press ltd. U.K. [6]. Habberjam, O.E. (1979): Occurrence, Origin and Discharge of Groundwater, Dover, New York. [7]. Johnson, E.E. (1966): Groundwater resource evaluation. McGraw-Hill Publishing. [8]. Johnson, E.I, (1996): groundwater pollution, Elsevier, Amsterdam international. [9]. Kearey, D and Brooks, M.O. (1997): An introduction to geophysical exploration. Blackwell Scientific Publications. [10]. Lioyd, J.W. (1981): Case Studies in groundwater resources evaluation. Clerendum press, Oxford. [11]. Obini, N.(2005): Technical report of resistivity survey for groundwater at Ezillo, submitted to Ebonyi state government of Nigeria by Ebonyi state Rural water Supply and Sanitation Agency (EB-RUWASA), Abakaliki. [12]. Offodile, M.E (1983). The occurrence and exploitation of groundwater in Nigeria basement rocks. Nigeria journal of Mining and Geology 20:131-146. [13]. Telford, W.M. Geldart, L.P., Sheriff, D.A., (1980): Applied Geophysics Cambridge University press, New York 218-399pp. [14]. Todd, D.K. (1980): Groundwater hydrology. John Willery and sons Inc. Second Edition, 35pp. [15]. Walton, W.C. (1970) Groundwater resource evaluation McGraw-Hill publishing, New York.