This document discusses porosity, which is an important property of reservoir rocks from the viewpoint of petroleum engineers. It is defined as the ratio of pore volume to bulk volume. There are different types of porosity, including total porosity (includes all pores), effective porosity (includes only interconnected pores), and secondary porosity (created after rock formation). Factors that affect porosity include grain shape, size, packing, and sorting. Porosity is determined experimentally using a saturation method, where the dry weight, saturated weight, and density of the saturating liquid are used to calculate pore volume and porosity. Effective porosity is most important for production as it includes only interconnected pores that allow fluid flow.
Reservoir Porosity; Porosity Definition; Types Porosity; Origins of Porosity in Clastics and Carbonates; Primary (Original) Porosity; Secondary (Induced) Porosity; Pore Space Porosity Classification; Absolute (or Total) Porosity; Effective Porosity; Porosity Calculated; Porosity Values; Porosity in Sandstone; Sandstones Porosity Types; Factors That Affect Porosity in Sandstones ; Grain Packing in Sandstone; Progressive Destruction of Bedding Through Bioturbation; Dual Porosity in Sandstone; Dissolution Porosity in Sandstone; Porosity in Carbonate; Carbonates Porosity Types; Idealized Carbonate Porosity Types; Comparison of Total and Effective Porosities; Reservoir Average Porosity; MEASUREMENT OF POROSITY
1-To calculate plastic viscosity of the mud .
2-To calculate yield point.
Viscometer or rheometer is a device used to measure the viscosity and yield point of mud, A sample of mud is placed in a slurry cup and rotation of a sleeve in the mud.
Types of sonic logging tools are explained briefly with help of animation and what are the application of these tools in determining the formation properties.
Drilling engineering laboratory
The aim of the test is to know the ability of the mud to suspense the cutting during circulation stop by measuring the gel strength
The objective of this test is to determine the bulk volume,
grain volume, pore volume and effective porosity of
interconnected pores of a core sample with the use of liquid
saturation method.
Introduction to Drilling Fluid /or Mud used to drill Oil and Gas Wells into the sub-surface Hydrocarbon Reservoir. Overview of the rheological properties and general description.
To better understand injection and post-injection flow processes and the entrapment of supercritical CO2 during geological carbon sequestration in a carbonate reservoir, the pore systems of sixty-six Cambrian-Ordovician carbonate samples from multiple states in the Midwest United States were analyzed.
Intro Soils – Lab 2
Soil Texture, Density, and Porosity
o Lecture Materials: Soil Architecture and Physical Properties (Ch 4)
o Labs submitted without advised instructions will result in a 3 point deduction:
Proper document name (LastName_SoilsLab2)
Name included in document
Legible numbering and spacing including questions with answers
Use of spell and grammar check
o Submission Closes Sunday evening, February 5, 2016 with to Module 2.
o Labs submitted on or prior Monday, February 1, 2016 will receive feedback with the opportunity
to resubmit the lab. Do not miss out on a great opportunity to be ensure understanding of the
materials and increase your lab grade.
Lab 2 - Soil Texture, Density, and Porosity
Introduction
Soil physical properties greatly impact how soils behave. Outcomes of most agricultural as well
as engineering projects are often defined by the properties of the soil involved. Soils are made
of soil solids and pore space; the soil solids are made up mostly of minerals as well as organic
matter while the pore space is made up of air and water. Ideally, these two portions are in a
50/50 ratio (Figure 1). Soil physical properties describe the soil particles and the manner in
which they aggregate and are arranged. The following exercise will focus on soil texture, soil
density, and soil porosity.
Figure 1. Ideal soil composition (Text Figure 1.18)
Soil Texture
Soil texture is the proportion of the different sized particles in soil. Only the fine earth fraction
of sand, silt, and clay are included. There are two methods for determining texture in soils by
feel and mechanistically using particle size analysis. Neither the coarse fraction greater than
2mm in diameter nor organic matter are included in textural analysis. In the previous lab
exercise, soil texture was estimated by feel. The particle size analysis procedure via mechanical
means is accomplished using a Bouyoucos hydrometer and calculated using Stokes Law. Stokes
law establishes a relationship between particle size and sedimentation. The velocity by which a
particle fall through a liquid is proportional to the gravitational force and the square of the
effective particle diameter. In other words, ‘the bigger they are, the faster they fall’. When
the soil is dispersed, the larger, sand particles will settle or fall to the bottom of a liquid faster
than silts or clays.
When conducting this experiment in the lab, the first task it to remove the coarse fraction from
the soil sample which is generally done by sieving (2mm). Soil particles want to stay together;
the soil separates and their aggregates do not easily separate. In order to achieve separation
both mechanical and chemical intervention is needed. Sieving removed large portions of the
organic matter, but it still is a significant agent in the binding of soil particles together, so
hydrogen peroxide is al ...
Total (absolute) Porosity and Isolated Porosity MeasurementRaboon Redar
Absolute porosity is the percentage or volume of void spaces or porosity of rocks that can contain hydrocarbons. Porosity is the measure of a rock’s ability to hold hydrocarbons like oil and gas, water, and condensates. Absolute porosity contains effective (interconnected) and ineffective (isolated) porosity. Effective porosity is the volume of connected pores, but isolate is the pore volume which is not connected to the pore network. Isolated porosity can be significant in volcanic rocks and some carbonates.
Porosity is the quality of being porous, or full of tiny holes. Liquids go right through things that have porosity. It is shown as a fraction of the volume of voids over the total volume, which is between 0 and 1, or between 0% and 100% as a percentage. Primary and secondary porosity can be read directly from neutron, density, and sonic logs.
Welcome to WIPAC Monthly the magazine brought to you by the LinkedIn Group Water Industry Process Automation & Control.
In this month's edition, along with this month's industry news to celebrate the 13 years since the group was created we have articles including
A case study of the used of Advanced Process Control at the Wastewater Treatment works at Lleida in Spain
A look back on an article on smart wastewater networks in order to see how the industry has measured up in the interim around the adoption of Digital Transformation in the Water Industry.
Understanding Inductive Bias in Machine LearningSUTEJAS
This presentation explores the concept of inductive bias in machine learning. It explains how algorithms come with built-in assumptions and preferences that guide the learning process. You'll learn about the different types of inductive bias and how they can impact the performance and generalizability of machine learning models.
The presentation also covers the positive and negative aspects of inductive bias, along with strategies for mitigating potential drawbacks. We'll explore examples of how bias manifests in algorithms like neural networks and decision trees.
By understanding inductive bias, you can gain valuable insights into how machine learning models work and make informed decisions when building and deploying them.
Forklift Classes Overview by Intella PartsIntella Parts
Discover the different forklift classes and their specific applications. Learn how to choose the right forklift for your needs to ensure safety, efficiency, and compliance in your operations.
For more technical information, visit our website https://intellaparts.com
NUMERICAL SIMULATIONS OF HEAT AND MASS TRANSFER IN CONDENSING HEAT EXCHANGERS...ssuser7dcef0
Power plants release a large amount of water vapor into the
atmosphere through the stack. The flue gas can be a potential
source for obtaining much needed cooling water for a power
plant. If a power plant could recover and reuse a portion of this
moisture, it could reduce its total cooling water intake
requirement. One of the most practical way to recover water
from flue gas is to use a condensing heat exchanger. The power
plant could also recover latent heat due to condensation as well
as sensible heat due to lowering the flue gas exit temperature.
Additionally, harmful acids released from the stack can be
reduced in a condensing heat exchanger by acid condensation. reduced in a condensing heat exchanger by acid condensation.
Condensation of vapors in flue gas is a complicated
phenomenon since heat and mass transfer of water vapor and
various acids simultaneously occur in the presence of noncondensable
gases such as nitrogen and oxygen. Design of a
condenser depends on the knowledge and understanding of the
heat and mass transfer processes. A computer program for
numerical simulations of water (H2O) and sulfuric acid (H2SO4)
condensation in a flue gas condensing heat exchanger was
developed using MATLAB. Governing equations based on
mass and energy balances for the system were derived to
predict variables such as flue gas exit temperature, cooling
water outlet temperature, mole fraction and condensation rates
of water and sulfuric acid vapors. The equations were solved
using an iterative solution technique with calculations of heat
and mass transfer coefficients and physical properties.
Literature Review Basics and Understanding Reference Management.pptxDr Ramhari Poudyal
Three-day training on academic research focuses on analytical tools at United Technical College, supported by the University Grant Commission, Nepal. 24-26 May 2024
Harnessing WebAssembly for Real-time Stateless Streaming PipelinesChristina Lin
Traditionally, dealing with real-time data pipelines has involved significant overhead, even for straightforward tasks like data transformation or masking. However, in this talk, we’ll venture into the dynamic realm of WebAssembly (WASM) and discover how it can revolutionize the creation of stateless streaming pipelines within a Kafka (Redpanda) broker. These pipelines are adept at managing low-latency, high-data-volume scenarios.
An Approach to Detecting Writing Styles Based on Clustering Techniquesambekarshweta25
An Approach to Detecting Writing Styles Based on Clustering Techniques
Authors:
-Devkinandan Jagtap
-Shweta Ambekar
-Harshit Singh
-Nakul Sharma (Assistant Professor)
Institution:
VIIT Pune, India
Abstract:
This paper proposes a system to differentiate between human-generated and AI-generated texts using stylometric analysis. The system analyzes text files and classifies writing styles by employing various clustering algorithms, such as k-means, k-means++, hierarchical, and DBSCAN. The effectiveness of these algorithms is measured using silhouette scores. The system successfully identifies distinct writing styles within documents, demonstrating its potential for plagiarism detection.
Introduction:
Stylometry, the study of linguistic and structural features in texts, is used for tasks like plagiarism detection, genre separation, and author verification. This paper leverages stylometric analysis to identify different writing styles and improve plagiarism detection methods.
Methodology:
The system includes data collection, preprocessing, feature extraction, dimensional reduction, machine learning models for clustering, and performance comparison using silhouette scores. Feature extraction focuses on lexical features, vocabulary richness, and readability scores. The study uses a small dataset of texts from various authors and employs algorithms like k-means, k-means++, hierarchical clustering, and DBSCAN for clustering.
Results:
Experiments show that the system effectively identifies writing styles, with silhouette scores indicating reasonable to strong clustering when k=2. As the number of clusters increases, the silhouette scores decrease, indicating a drop in accuracy. K-means and k-means++ perform similarly, while hierarchical clustering is less optimized.
Conclusion and Future Work:
The system works well for distinguishing writing styles with two clusters but becomes less accurate as the number of clusters increases. Future research could focus on adding more parameters and optimizing the methodology to improve accuracy with higher cluster values. This system can enhance existing plagiarism detection tools, especially in academic settings.
HEAP SORT ILLUSTRATED WITH HEAPIFY, BUILD HEAP FOR DYNAMIC ARRAYS.
Heap sort is a comparison-based sorting technique based on Binary Heap data structure. It is similar to the selection sort where we first find the minimum element and place the minimum element at the beginning. Repeat the same process for the remaining elements.
6th International Conference on Machine Learning & Applications (CMLA 2024)ClaraZara1
6th International Conference on Machine Learning & Applications (CMLA 2024) will provide an excellent international forum for sharing knowledge and results in theory, methodology and applications of on Machine Learning & Applications.
Hierarchical Digital Twin of a Naval Power SystemKerry Sado
A hierarchical digital twin of a Naval DC power system has been developed and experimentally verified. Similar to other state-of-the-art digital twins, this technology creates a digital replica of the physical system executed in real-time or faster, which can modify hardware controls. However, its advantage stems from distributing computational efforts by utilizing a hierarchical structure composed of lower-level digital twin blocks and a higher-level system digital twin. Each digital twin block is associated with a physical subsystem of the hardware and communicates with a singular system digital twin, which creates a system-level response. By extracting information from each level of the hierarchy, power system controls of the hardware were reconfigured autonomously. This hierarchical digital twin development offers several advantages over other digital twins, particularly in the field of naval power systems. The hierarchical structure allows for greater computational efficiency and scalability while the ability to autonomously reconfigure hardware controls offers increased flexibility and responsiveness. The hierarchical decomposition and models utilized were well aligned with the physical twin, as indicated by the maximum deviations between the developed digital twin hierarchy and the hardware.
Saudi Arabia stands as a titan in the global energy landscape, renowned for its abundant oil and gas resources. It's the largest exporter of petroleum and holds some of the world's most significant reserves. Let's delve into the top 10 oil and gas projects shaping Saudi Arabia's energy future in 2024.
Top 10 Oil and Gas Projects in Saudi Arabia 2024.pdf
Exp6 porosity
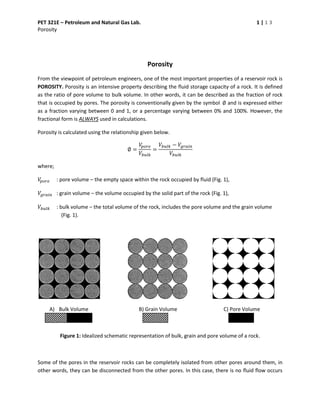
1. PET 321E – Petroleum and Natural Gas Lab. 1 | 1 3
Porosity
Porosity
From the viewpoint of petroleum engineers, one of the most important properties of a reservoir rock is
POROSITY. Porosity is an intensive property describing the fluid storage capacity of a rock. It is defined
as the ratio of pore volume to bulk volume. In other words, it can be described as the fraction of rock
that is occupied by pores. The porosity is conventionally given by the symbol ∅ and is expressed either
as a fraction varying between 0 and 1, or a percentage varying between 0% and 100%. However, the
fractional form is ALWAYS used in calculations.
Porosity is calculated using the relationship given below.
∅ =
𝑉𝑝𝑜𝑟𝑒
𝑉𝑏𝑢𝑙𝑘
=
𝑉𝑏𝑢𝑙𝑘 − 𝑉𝑔𝑟𝑎𝑖𝑛
𝑉𝑏𝑢𝑙𝑘
where;
𝑉𝑝𝑜𝑟𝑒 : pore volume – the empty space within the rock occupied by fluid (Fig. 1),
𝑉𝑔𝑟𝑎𝑖𝑛 : grain volume – the volume occupied by the solid part of the rock (Fig. 1),
𝑉𝑏𝑢𝑙𝑘 : bulk volume – the total volume of the rock, includes the pore volume and the grain volume
(Fig. 1).
A) Bulk Volume B) Grain Volume C) Pore Volume
Figure 1: Idealized schematic representation of bulk, grain and pore volume of a rock.
Some of the pores in the reservoir rocks can be completely isolated from other pores around them, in
other words, they can be disconnected from the other pores. In this case, there is no fluid flow occurs
2. PET 321E – Petroleum and Natural Gas Lab. 2 | 1 3
Porosity
between disconnected pores with other pores, and therefore, there is no pressure communication in
between them. Since the isolated (disconnected) pores filled with oil, gas and/or water have no effect
on the production of oil and gas, petroleum engineers do not interested in with this type of pores.
Therefore, isolated pores are called as dead pores and the total volume of dead pores as dead pore
volume (Fig. 2).
On the other hand, the pores interconnected to each other contribute to the mass transfer in the rock
pores are called as effective pores and the total volume of effective pores as effective pore volume or
simply pore volume (Fig. 2).
Figure 2: Pore spaces in a rock.
From the viewpoint of petroleum engineers, effective porosity which is the ratio of effective pore
volume to the bulk volume is the most important property of a rock.
A range of differently defined porosities is recognized and used within the petroleum industry.
1. Total (or Absolute) Porosity: defined as the ratio of all pore volume to the bulk volume of rock.
∅ 𝑡 =
𝑉𝑑𝑒𝑎𝑑 𝑝𝑜𝑟𝑒 + 𝑉𝑒𝑓𝑓𝑒𝑐𝑡𝑖𝑣𝑒 𝑝𝑜𝑟𝑒
𝑉𝑏𝑢𝑙𝑘
2. Effective (or Connective) Porosity: defined as the ratio of effective pore volume to the bulk volume
of rock.
∅ 𝑒 =
𝑉𝑒𝑓𝑓𝑒𝑐𝑡𝑖𝑣𝑒 𝑝𝑜𝑟𝑒
𝑉𝑏𝑢𝑙𝑘
Rock Matrix Effective Pores Dead PoresRock Matrix
3. PET 321E – Petroleum and Natural Gas Lab. 3 | 1 3
Porosity
In most of the reservoir rocks, the dead pore volume has a negligible value compared to the total pore
volume, and effective porosity almost equals the total porosity. Therefore;
∅ 𝑒 ≤ ∅ 𝑡
For granular materials such as sandstone, the effective porosity may approach the total porosity,
however, for shales and highly cemented or vugular rocks such as some limestones, large variations may
exist between effective and total porosity.
3. Primary (or original) Porosity is developed during the deposition of the sediment.
4. Secondary Porosity is caused by some geologic process subsequent to the formation of the deposit.
These changes in the original pore spaces may be created by ground stresses, water movement, or
various other types of geological activities after the original sediments were deposits. Fracturing or
formation of solution cavities often will increase the original porosity of the rock.
Factors that Affect Porosity: The primary porosity is affected by three major microstructural
parameters. These are grain shape, grain size, grain packing, and grain sorting.
1. Grain Shape: Not all the grains are spherical, and grain shape influences the porosity. Fig. 3
shows the relation between the grain shape and the porosity. As it can be seen the porosity for
more angular grains is larger than those that are sub-spherical.
Figure 3: Relation between the grain shape and the porosity.
High
Low
Very
Angular
Angular
Sub-
Angular
Sub-
Rounded Rounded
Well-
Rounded
ROUNDNESS
Porosity
Porosity
4. PET 321E – Petroleum and Natural Gas Lab. 4 | 1 3
Porosity
2. Grain Size: Porosity is independent of grain size. Consider a cube having dimensions of 2rx2rx2r,
and insert a grain having radius of r into the cube (Fig. 4). Porosity can be calculated as follows:
𝑉𝑏𝑢𝑙𝑘 = 2𝑟 × 2𝑟 × 2𝑟 = 8𝑟3
𝑉𝑔𝑟𝑎𝑖𝑛 =
4
3
𝜋𝑟3
∅ =
𝑉𝑝𝑜𝑟𝑒
𝑉𝑏𝑢𝑙𝑘
=
𝑉𝑏𝑢𝑙𝑘 − 𝑉𝑔𝑟𝑎𝑖𝑛
𝑉𝑏𝑢𝑙𝑘
=
8𝑟3
−
4
3 𝜋𝑟3
8𝑟3
= 0. 476 𝑜𝑟 48%
As it can be seen the grain radius (grain size) do not have an effect on the porosity.
Figure 4: Relation between the grain size and the porosity.
3. Grain Packing: For a uniform grain size, porosity is independent of the size of the grains.
However, the porosity is dependent on the arrangement of the grains, or in other words, it is
dependent on grain packing. A maximum theoretical porosity of 48% is achieved with the cubic
packing of spherical grains (Fig. 5), and the porosity for the rhombic packing is 27%.
Cubic Packing, = 48% Rhombic Packing, = 27%
Figure 5: Relation between the grain packing and the porosity.
2 r
2 r
2 r r
Porosity = 48% Porosity = 27 %
5. PET 321E – Petroleum and Natural Gas Lab. 5 | 1 3
Porosity
4. Grain Sorting: The porosity is dependent on the grain size distribution, or in other words, it is
dependent on grain sorting. If all the grains are of the same size, then sorting is said to be
GOOD, and if the grains of many diverse sizes are mixed together, sorting is said to be POOR
(Fig. 6).
Good Sorting Poor Sorting
Figure 6: Relation between the grain sorting and the porosity.
Porosity decreases as grain sorting become poorer. This is because intergranular pore of a given grain
size may be occupied by ever smaller grains.
Reservoir pore volume is always filled with one or more fluid which means the reservoir rock is
saturated with at least one fluid. As it is shown in Fig. 7, reservoir rock can be saturated with [water],
[water+oil], [water+gas], or [water+oil+gas]. The reservoir pore volume has to be equal to the total fluid
volume which fills the reservoir pores. For example; if the reservoir rock is saturated with water, oil, and
gas, then the following formula can be written.
𝑉𝑝𝑜𝑟𝑒 = 𝑉𝑜𝑖𝑙 + 𝑉𝑔𝑎𝑠 + 𝑉 𝑤𝑎𝑡𝑒𝑟
where,
𝑉𝑝𝑜𝑟𝑒 : effective pore volume,
𝑉𝑜𝑖𝑙 : oil volume in interconnected pores,
𝑉𝑔𝑎𝑠 : gas volume in interconnected pores,
𝑉 𝑤𝑎𝑡𝑒𝑟 : water volume in interconnected pores.
Porosity
6. PET 321E – Petroleum and Natural Gas Lab. 6 | 1 3
Porosity
The saturations of reservoir rock with respect to these three saturating fluids are symbolized as 𝑆 𝑜 for
oil, 𝑆 𝑔 for gas, and 𝑆 𝑤 for water. The saturation of each phases is the ratio of the saturating fluid volume
to the total pore volume, or in other words;
𝑆 𝑜 =
𝑉𝑜𝑖𝑙
𝑉𝑝𝑜𝑟𝑒
, 𝑆 𝑔 =
𝑉𝑔𝑎𝑠
𝑉𝑝𝑜𝑟𝑒
, 𝑆 𝑤 =
𝑉 𝑤𝑎𝑡𝑒𝑟
𝑉𝑝𝑜𝑟𝑒
where,
𝑆 𝑜 : oil saturation, fractional,
𝑆 𝑔 : gas saturation, fractional,
𝑆 𝑤 : water saturation, fractional.
Regarding the definition of saturation, the arithmetic summation of saturations given above is obtained
that;
𝑆 𝑜 + 𝑆 𝑔 + 𝑆 𝑤 =
𝑉𝑜𝑖𝑙 + 𝑉𝑔𝑎𝑠 + 𝑉 𝑤𝑎𝑡𝑒𝑟
𝑉𝑝𝑜𝑟𝑒
=
𝑉𝑝𝑜𝑟𝑒
𝑉𝑝𝑜𝑟𝑒
= 1
𝑆 𝑜 = 0.80
𝑆 𝑔 = 0.00
𝑆 𝑤 = 0.20
𝑆 𝑜 = 0.50
𝑆 𝑔 = 0.30
𝑆 𝑤 = 0.20
Oil Water Gas
Figure 7: Distribution of fluid saturations in pores.
7. PET 321E – Petroleum and Natural Gas Lab. 7 | 1 3
Porosity
Porosity Determination: From the definition of porosity, it is evident that the porosity of a sample of
porous material can be determined by only two out of the three volumes namely bulk volume, grain
volume and pore volume are required to calculate porosity.
APPARATUS used in the Experiment:
• Desiccator
• Vacuum pump
• Saturating liquid
• Saturating liquid vessel
• Thermometers
• Electronic balance
• Vernier caliper
METHODS used for the Experiment:
Of the many methods used to determine porosity, only Saturation Method which is common method is
performed in our laboratory. This method uses the principle based on introducing a liquid of known
density into the pores of the core sample. The weight of the dry sample and the weight of the saturated
sample are determined. The pore volume is determined by dividing the difference in weight between
the saturated sample and the dry sample by the liquid density.
Section A: Preparation of Core Sample
1. Take a core sample is flushed and desiccated over a suitable dehydrating material.
2. Record the identity of the core sample that its properties are not known in the raw data sheet.
3. By using vernier caliper, measure the length and diameter of the core sample and repeat your
measurements six times. Record the length and diameter measurements in the raw data sheet.
4. Weigh dry core sample using a balance and record your measurement in the raw data sheet as
dry weight, 𝑚 𝑑𝑟𝑦.
8. PET 321E – Petroleum and Natural Gas Lab. 8 | 1 3
Porosity
Section B: Saturating the Core Sample
1. Place the glass beads into the bottom of the desiccator (Fig. 8).
2. Place the core sample on to the glass beads in the vertical direction.
3. Place the rubber stopper, having a tubing which providing connection between top and bottom
of desiccator into the mouth of the desiccator.
4. Close and seal the desiccator and evacuate the core sample by opening the vacuum pump for at
least 15 min.
5. To start the saturation procedure, open the liquid valve located on the tubing which provides
the saturating liquid flow from the top of the tubing to the bottom of the desiccator.
6. Close the liquid valve, when the saturating liquid level reached at least 1 cm above the core
sample.
7. Open the vacuum pump and keep the core sample on saturation at least 1 hour.
8. After saturation, allow the air to flow slowly into the system.
9. When the pressure inside the desiccator is reached to the atmospheric pressure, remove the
rubber stopper placed into the mouth of the desiccator.
10. Remove the core sample from the desiccator.
Figure 8: Liquid saturation apparatus (schematic diagram).
..
Desiccator
Core Sample
Glass Beads
Pressure
Gauge
Rubber Stopper
Liquid Valve
Saturating
Fluid
Vacuum Pump
9. PET 321E – Petroleum and Natural Gas Lab. 9 | 1 3
Porosity
11. Remove the excess drops from the core sample by wiping it with a filter paper, which is
saturated with saturating liquid.
12. Weigh the saturated core sample as quickly as possible to avoid the evaporation of saturating
liquid from the sample.
13. Record your measurement in the raw data sheet as saturated weight, 𝑚 𝑠𝑎𝑡𝑢𝑟𝑎𝑡𝑒𝑑.
14. Calculate the weight of the saturating liquid by subtracting the dry weight from the saturated
weight of the core sample.
15. Calculate the pore volume of the core sample by using the weight and density of the saturating
liquid.
16. Write your findings in the raw data sheet.
CALCULATIONS and RESULTS:
Section A: Preparation of Core Sample
1. Calculate the cross-sectional area and bulk volume of the core sample by using each of your core
sample dimension measurements, and write your findings in the raw data sheet.
NOTE:
Cross-sectional Area : 𝐴 = 𝜋
𝐷2
4
, 𝑐𝑚2
Bulk Volume : 𝑉𝑏𝑢𝑙𝑘 = 𝐴 × 𝐿, 𝑐𝑚3
where;
𝐷 : diameter of the core sample, cm
𝐿 : length of the core sample, cm
10. PET 321E – Petroleum and Natural Gas Lab. 10 | 1 3
Porosity
2. Determine the pore volume by using the following equation:
𝑉𝑝𝑜𝑟𝑒 =
𝑚 𝑠𝑎𝑡𝑢𝑟𝑎𝑡𝑒𝑑 − 𝑚 𝑑𝑟𝑦
𝜌𝑠𝑎𝑡𝑢𝑟𝑎𝑡𝑖𝑛𝑔 𝑙𝑖𝑞𝑢𝑖𝑑
, 𝑐𝑚3
NOTE: Density of the saturating liquid, 𝜌𝑠𝑎𝑡𝑢𝑟𝑎𝑡𝑖𝑛𝑔 𝑙𝑖𝑞𝑢𝑖𝑑, will be provided by Lab. Coordinator.
3. Determine the measured porosity by using the following equation:
∅ 𝑚𝑒𝑎𝑠𝑢𝑟𝑒𝑑 =
𝑉𝑝𝑜𝑟𝑒
𝑉𝑏𝑢𝑙𝑘
× 100
4. Determine the pseudo porosity regarding the bulk volume and the matrix density of the core
sample by using the following equation:
𝑉𝑔𝑟𝑎𝑖𝑛 =
𝑚 𝑔𝑟𝑎𝑖𝑛
𝜌 𝑔𝑟𝑎𝑖𝑛
=
𝑚 𝑑𝑟𝑦
𝜌 𝑔𝑟𝑎𝑖𝑛
, 𝑐𝑚3
∅ 𝑝𝑠𝑒𝑢𝑑𝑜 =
𝑉𝑝𝑜𝑟𝑒
𝑉𝑏𝑢𝑙𝑘
=
𝑉𝑏𝑢𝑙𝑘 − 𝑉𝑔𝑟𝑎𝑖𝑛
𝑉𝑏𝑢𝑙𝑘
= 1 −
𝑚 𝑑𝑟𝑦
𝑉𝑏𝑢𝑙𝑘 𝜌 𝑔𝑟𝑎𝑖𝑛
NOTE: Matrix density of the core sample, 𝜌 𝑔𝑟𝑎𝑖𝑛, will be provided by Lab. Coordinator.
5. Calculate the average bulk volume of the core sample by taking the arithmetic average of the
diameter and length measurements. Write your findings in the raw data sheet.
Section B: Error Analysis
1. Calculate the error percentage in the pseudo porosity by using the measured porosity
calculated pseudo porosity in the following formula:
𝐸∅ =
∅ 𝑚𝑒𝑎𝑠𝑢𝑟𝑒𝑑 − ∅ 𝑝𝑠𝑒𝑢𝑑𝑜
∅ 𝑚𝑒𝑎𝑠𝑢𝑟𝑒𝑑
× 100
2. Briefly discuss the error percentage in the pseudo porosity obtained above.
11. PET 321E – Petroleum and Natural Gas Lab. 11 | 1 3
Porosity
Section C: Approximation to Permeability
The ability of the porous medium to allow the fluid(s) to transmit through its pores is called as
permeability. Although it is natural to assume that permeability depends on porosity, it is not
simple to determine a relationship between porosity and permeability. Generally, there is no
specific correlation between the permeability and porosity. However, according to some earth
scientists, the relationship between porosity and permeability can be approximated if the
average grain size is known. In other words; It is required a detailed knowledge of grain size
distribution to have an idea about the permeability of a rock. One of the most well-known
models linking porosity and permeability is known as the Kozeny-Carman Equation which is
given below.
𝑘 = 3.631 × 10⁹
𝐷𝑔𝑟𝑎𝑖𝑛
2
× ∅3
(1 − ∅2)
where,
𝑘 : permeability, mD
∅ : porosity, fraction
𝐷𝑔𝑟𝑎𝑖𝑛 : average diameter of the grains, inches
12. PET 321E – Petroleum and Natural Gas Lab. 12 | 1 3
Porosity
Name, Surname : .....................................................................
Faculty ID Number : .....................................................................
Group : .....................................................................
Date : .....................................................................
RAW DATA SHEET
Porosity
Ambient Temperature, °C (°F) : --------------------- Ambient Pressure, mmHg : ----------------------
Core sample identity :
# Diameter, cm
Cross-Sectional
Area, cm2
Length,
cm
Bulk
Volume,
cm3
Pseudo
Porosity, %
Error in
Porosity, %
1
2
3
4
5
6
Ave.
Min. Bulk Volume , cm3
Max. Bulk Volume , cm3
Average Bulk Volume , cm3
Min. Pseudo Porosity , %
Max. Pseudo Porosity , %
Dry Weight ,g
Saturated Weight ,g
Porosity , %
Lab. Coordinator Name, Surname:
Date:
Signature:
13. PET 321E – Petroleum and Natural Gas Lab. 13 | 1 3
Porosity
Ambient Temperature, °C (°F) : --------------------- Ambient Pressure, mmHg : ----------------------
Core sample identity :
# Diameter, cm
Cross-Sectional
Area, cm2
Length,
cm
Bulk
Volume,
cm3
Pseudo
Porosity, %
Error in
Porosity, %
1
2
3
4
5
6
Ave.
Min. Bulk Volume , cm3
Max. Bulk Volume , cm3
Average Bulk Volume , cm3
Min. Pseudo Porosity , %
Max. Pseudo Porosity , %
Dry Weight ,g
Saturated Weight ,g
Porosity , %
Lab. Coordinator Name, Surname:
Date:
Signature: