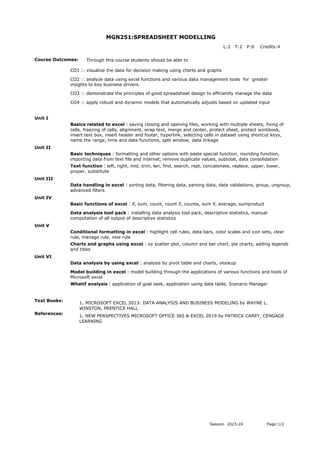
MGN251:SPREADSHEET MODELLING
Course Outcomes:
CO1 :: visualize the data for decision making using charts and graphs
CO2 :: analyze data using excel functions and various data management tools for greater
insights to key business drivers.
CO3 :: demonstrate the principles of good spreadsheet design to efficiently manage the data
Unit I
Basics related to excel : saving closing and opening files, working with multiple sheets, fixing of
cells, freezing of cells, alignment, wrap text, merge and center, protect sheet, protect workbook,
insert text box, insert header and footer, hyperlink, selecting cells in dataset using shortcut keys,
name the range, time and date functions, split window, data linkage
Unit II
Basic techniques : formatting and other options with paste special function, rounding function,
importing data from text file and internet, remove duplicate values, subtotal, data consolidation
Text function : left, right, mid, trim, len, find, search, rept, concatenate, replace, upper, lower,
proper, substitute
Unit III
Data handling in excel : sorting data, filtering data, parsing data, data validations, group, ungroup,
advanced filters
Unit IV
Basic functions of excel : if, sum, count, count if, counta, sum if, average, sumproduct
Data analysis tool pack : installing data analysis tool pack, descriptive statistics, manual
computation of all output of descriptive statistics
Unit V
Conditional formatting in excel : highlight cell rules, data bars, color scales and icon sets, clear
rule, manage rule, new rule
Charts and graphs using excel : xy scatter plot, column and bar chart, pie charts, adding legends
and titles
Unit VI
Data analysis by using excel : analysis by pivot table and charts, vlookup
Model building in excel : model building through the applications of various functions and tools of
Microsoft excel
Whatif analysis : application of goal seek, application using data table, Scenario Manager
Text Books:
1. MICROSOFT EXCEL 2013: DATA ANALYSIS AND BUSINESS MODELING by WAYNE L.
WINSTON, PRENTICE HALL
References:
1. NEW PERSPECTIVES MICROSOFT OFFICE 365 & EXCEL 2019 by PATRICK CAREY, CENGAGE
LEARNING
CO4 :: apply robust and dynamic models that automatically adjusts based on updated input
Through this course students should be able to
L:2 T:2 P:0 Credits:4
Session 2023-24 Page:1/2
Session 2023-24 Page:2/2

excel syllabus .pdf

  • 1.
    MGN251:SPREADSHEET MODELLING Course Outcomes: CO1:: visualize the data for decision making using charts and graphs CO2 :: analyze data using excel functions and various data management tools for greater insights to key business drivers. CO3 :: demonstrate the principles of good spreadsheet design to efficiently manage the data Unit I Basics related to excel : saving closing and opening files, working with multiple sheets, fixing of cells, freezing of cells, alignment, wrap text, merge and center, protect sheet, protect workbook, insert text box, insert header and footer, hyperlink, selecting cells in dataset using shortcut keys, name the range, time and date functions, split window, data linkage Unit II Basic techniques : formatting and other options with paste special function, rounding function, importing data from text file and internet, remove duplicate values, subtotal, data consolidation Text function : left, right, mid, trim, len, find, search, rept, concatenate, replace, upper, lower, proper, substitute Unit III Data handling in excel : sorting data, filtering data, parsing data, data validations, group, ungroup, advanced filters Unit IV Basic functions of excel : if, sum, count, count if, counta, sum if, average, sumproduct Data analysis tool pack : installing data analysis tool pack, descriptive statistics, manual computation of all output of descriptive statistics Unit V Conditional formatting in excel : highlight cell rules, data bars, color scales and icon sets, clear rule, manage rule, new rule Charts and graphs using excel : xy scatter plot, column and bar chart, pie charts, adding legends and titles Unit VI Data analysis by using excel : analysis by pivot table and charts, vlookup Model building in excel : model building through the applications of various functions and tools of Microsoft excel Whatif analysis : application of goal seek, application using data table, Scenario Manager Text Books: 1. MICROSOFT EXCEL 2013: DATA ANALYSIS AND BUSINESS MODELING by WAYNE L. WINSTON, PRENTICE HALL References: 1. NEW PERSPECTIVES MICROSOFT OFFICE 365 & EXCEL 2019 by PATRICK CAREY, CENGAGE LEARNING CO4 :: apply robust and dynamic models that automatically adjusts based on updated input Through this course students should be able to L:2 T:2 P:0 Credits:4 Session 2023-24 Page:1/2
  • 2.