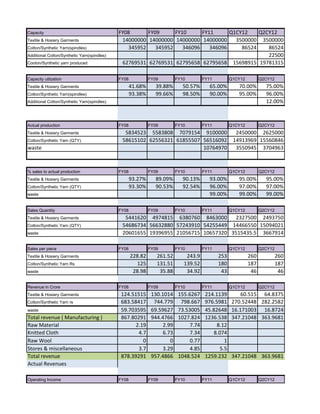
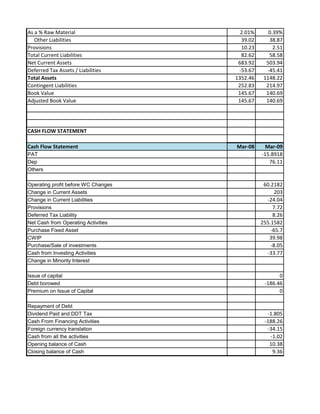
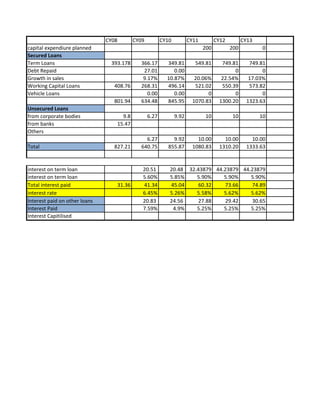
![Nakoda Ltd Balance Sheet - Consolidated - Actual - Schedules- [INR-Crore]
DESCRIPTION Mar-08 Mar-09
SOURCES OF FUNDS:
Share Capital 18.05 18.05
Face Value 5 5
No of shares 3.61 3.61
Share Warrants & Outstandings 0 0
Total Reserves 506.6 487.86
Securities Premium 209.59 209.59
Capital Reserves 13.63 13.63
Profit & Loss Account Balance 5.69 -27.97
General Reserves 277.69 283.38
Exchange Fluctuation reserve 0 9.23
Shareholder's Funds 524.65 505.91
Minority Interest 0.00 0.00
Secured Loans 801.94 634.48
Term Loans - Banks 393.18 366.17
Working Capital Loans - Banks 408.76 268.31
Vehicle loans 0.00 0.00
Unsecured Loans 25.27 6.27
Other Deposits 15.47 0
Other Unsecured Loan 9.8 6.27
Total Debts 827.21 640.75
Total Liabilities 1351.86 1146.66
Debt to Equity Ratio 2.576685 2.26653
APPLICATION OF FUNDS :
Gross Block 1259.1 1324.8
Less: Accumulated Depreciation 609.77 676.06
Net Block 649.33 648.74
Capital Work in Progress 63.88 23.9
Investments 9 17.05
Current Assets, Loans & Advances 0 0
Inventories 405.13 201.73
As a % of Raw Material Consumed 89.14% 40.15%
Sundry Debtors 219.55 237.16
As a % of Net Sales 23.95% 23.68%
Cash and Bank 10.38 9.36
Loans and Advances 131.48 114.27
Total Current Assets 766.54 562.52
Less : Current Liabilities and Provisions
Current Liabilities 72.39 56.07
Sundry Creditors 24.25 15.25
As a % of Raw Material 5.34% 3.03%
Acceptances 9.12 1.95](https://image.slidesharecdn.com/flevy120preview-130616121721-phpapp02/85/Excel-Model-for-Manufacturing-Firm-5-320.jpg)
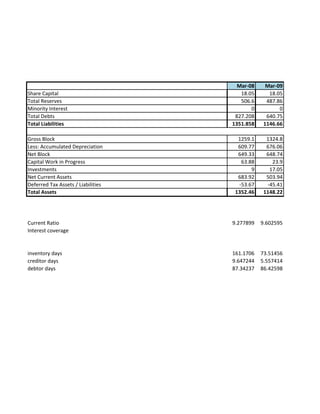
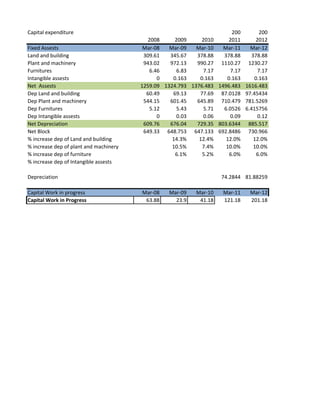

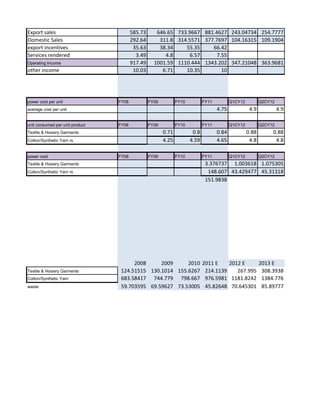
![Nahar Ltd Profit And Loss - Consolidated - Actual - Schedules- [INR-Crore]
DESCRIPTION Mar-08 Mar-09
INCOME :
Gross Sales 917.49 1001.59
Growth Rate % 9.17%
Less: Excise Duty 0.93 0.23
As a % of Sales 0.10% 0.02%
Net Sales 916.56 1001.36
Growth Rate % 9.25%
EXPENDITURE :
Increase/Decrease in Stock -10.55 9.11
Raw Material Consumed 454.50 502.50
As a % of Sales 49.59% 50.18%
Power & Fuel Cost 137.15 130.12
As a % of Sales 14.96% 12.99%
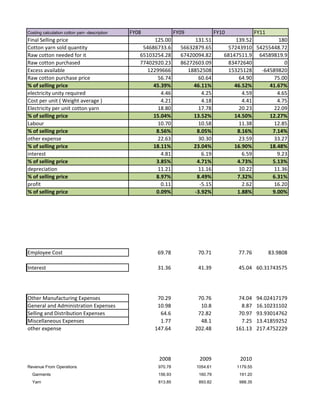
Employee Cost 69.78 70.71
As a % of Sales 7.61% 7.06%
Other Manufacturing Expenses 70.29 70.76
As a % of Sales 7.67% 7.07%
General and Administration Expenses 10.98 10.8
As a % of Sales 1.20% 1.08%
Selling and Distribution Expenses 64.6 72.82
As a % of Sales 7.05% 7.27%
Miscellaneous Expenses 1.77 48.1
As a % of Sales 0.19% 4.80%
Total Expenditure 798.52 914.92
% change 14.58%
As a % of Sales 87.12% 91.37%
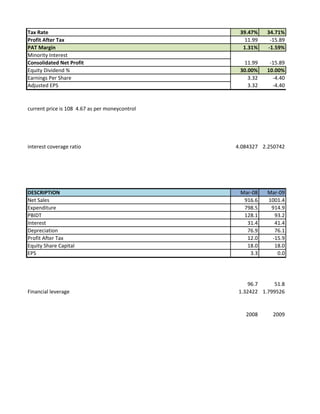
Operating Profit (Excl OI) 118.04 86.44
EBITDA Margin 12.88% 8.63%
Other Income 10.04 6.72
Operating Profit 128.08 93.16
Operating Profit Margin 13.97% 9.30%
Interest 31.36 41.39
As a % of debt 3.79% 6.46%
PBDT 96.72 51.77
Depreciation 76.91 76.11
As a % of gross block 6.11% 5.75%
Profit Before Taxation & Exceptional Items 19.81 -24.34
Exceptional Items - -
Profit Before Tax 19.81 -24.34
PBT Margin 2.16% -2.43%
Provision for Tax 7.82 -8.45](https://image.slidesharecdn.com/flevy120preview-130616121721-phpapp02/85/Excel-Model-for-Manufacturing-Firm-19-320.jpg)
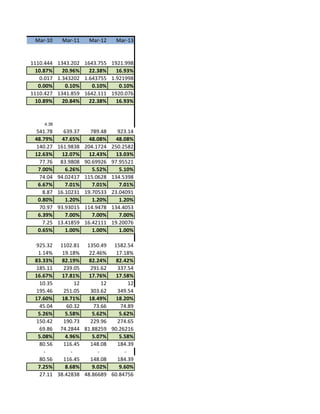
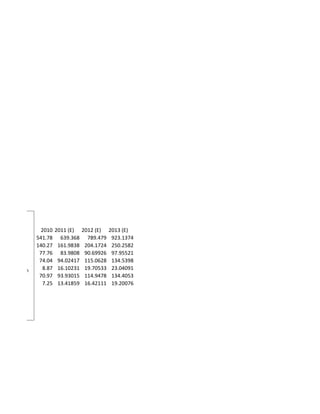

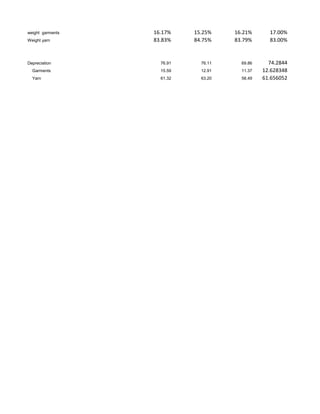
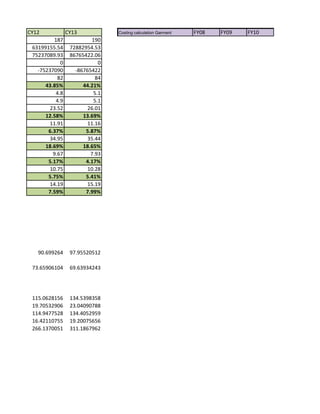


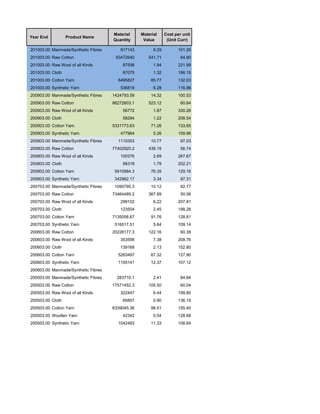


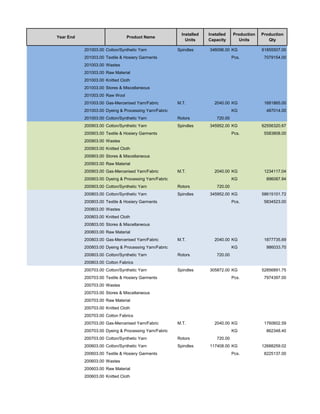
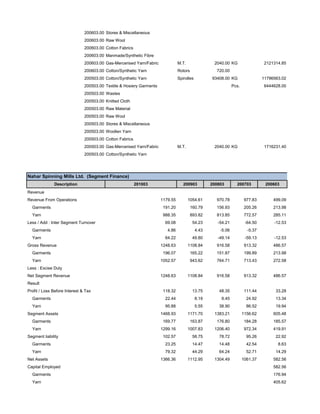
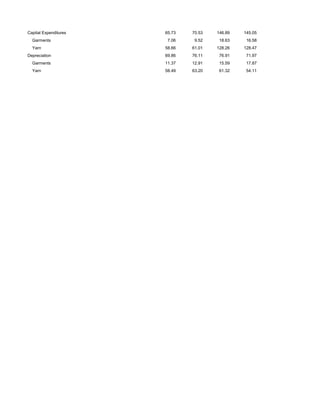
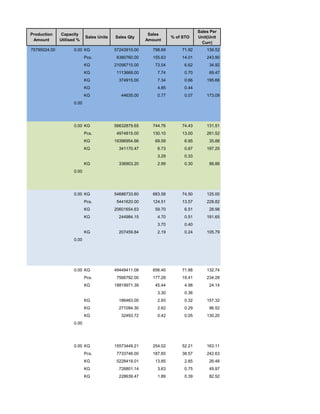
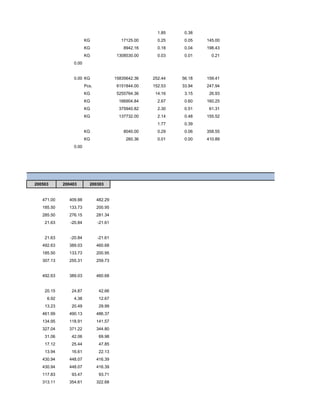


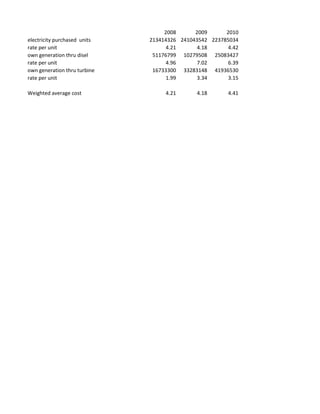
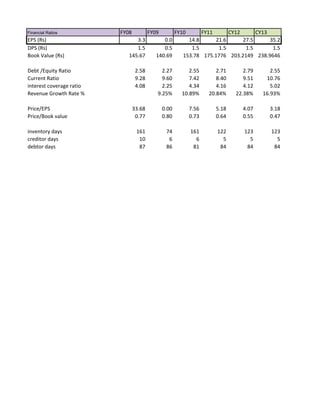

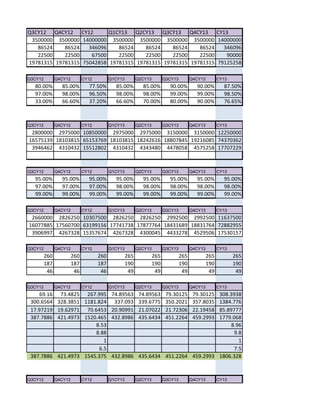
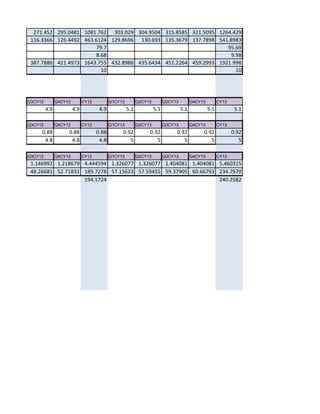
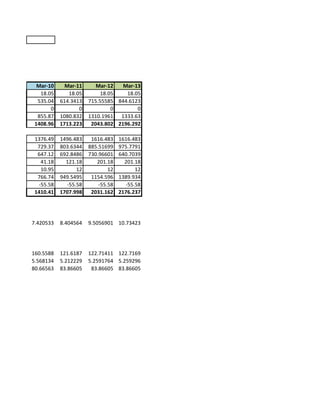
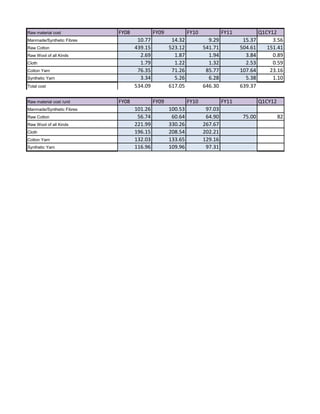
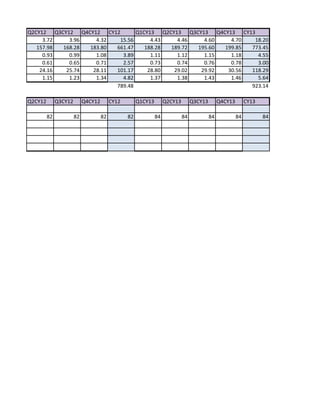
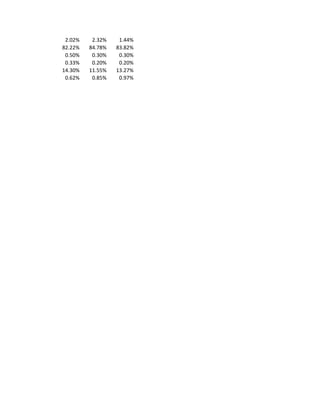
The document provides a comprehensive overview of the textile and hosiery garments industry, including production capacities, utilization rates, actual production figures, revenue statistics, and balance sheet data. It highlights trends over several fiscal years, illustrating changes in production, sales, and financial metrics, with an emphasis on cotton/synthetic yarn and garments. Additionally, key performance indicators such as sales quantities, revenue, and operational income are detailed, alongside future projections.


![[Whitepaper] Business Transformation Success Factors](https://cdn.slidesharecdn.com/ss_thumbnails/5561-210403145933-thumbnail.jpg?width=640&height=640&fit=bounds)
![[Whitepaper] 5 Dimensions of Employee Engagement Scorecard](https://cdn.slidesharecdn.com/ss_thumbnails/5321-210328193614-thumbnail.jpg?width=640&height=640&fit=bounds)
![[Whitepaper] Digital Transformation: Workforce Digitization](https://cdn.slidesharecdn.com/ss_thumbnails/3969-210328125242-thumbnail.jpg?width=640&height=640&fit=bounds)
![[Whitepaper] Strategic Human Resources: Evolution of Competition](https://cdn.slidesharecdn.com/ss_thumbnails/5310-210327151644-thumbnail.jpg?width=640&height=640&fit=bounds)
![[Whitepaper] 8 Key Steps of Data Integration: Restructuring Redeployment Asse...](https://cdn.slidesharecdn.com/ss_thumbnails/8keystepsofdataintegrationrestructuringredeploymentassessmentmanagementbymarkbridgesfeb2021medium-210217191155-thumbnail.jpg?width=640&height=640&fit=bounds)
![[Whitepaper] Strategy Classics: Value Disciplines Model](https://cdn.slidesharecdn.com/ss_thumbnails/thedefinitiveguidetostrategic-210214191052-thumbnail.jpg?width=640&height=640&fit=bounds)
![[Whitepaper] The Definitive Guide to Strategic Planning: Here’s What You Need...](https://cdn.slidesharecdn.com/ss_thumbnails/thedefinitiveguidetostrategic-210214173358-thumbnail.jpg?width=640&height=640&fit=bounds)
![[Whitepaper] The Definitive Introduction to Strategy Development and Strategy...](https://cdn.slidesharecdn.com/ss_thumbnails/thedefinitiveintroductiontostrategydevelopmentandstrategyexecutionbymarkbridgesjan2021medium-210213184931-thumbnail.jpg?width=640&height=640&fit=bounds)
![[Whitepaper] The “Theory of Constraints:” What’s Limiting Your Organization?](https://cdn.slidesharecdn.com/ss_thumbnails/theoryof-210212191639-thumbnail.jpg?width=640&height=640&fit=bounds)
![[Whitepaper] Transportation Cost Reduction in Supply Chain Management](https://cdn.slidesharecdn.com/ss_thumbnails/transportationcostreductioninsupplychainmanagementbymarkbridgesfeb2021medium-210211190249-thumbnail.jpg?width=640&height=640&fit=bounds)
![[Whitepaper] A Great Leadership Experience: Dr. Rachid Yazami, Inventor of th...](https://cdn.slidesharecdn.com/ss_thumbnails/agreatleadershipexperiencedr-210209191633-thumbnail.jpg?width=640&height=640&fit=bounds)
![[Whitepaper] Finding It Hard to Manage Conflict at the Workplace? Use the Tho...](https://cdn.slidesharecdn.com/ss_thumbnails/findingithardto-210117143721-thumbnail.jpg?width=640&height=640&fit=bounds)
![[Whitepaper] Key Account Management: Handling Large Global Accounts the Right...](https://cdn.slidesharecdn.com/ss_thumbnails/keyaccountmanagementhandlinglargeglobalaccountstherightwaybymarkbridgesmedium-210116155811-thumbnail.jpg?width=640&height=640&fit=bounds)
![[Whitepaper] Nudge Theory: An Effective Way to Transform Negative Behaviors](https://cdn.slidesharecdn.com/ss_thumbnails/nudgetheoryaneffectivewaytotransformnegativebehaviorsbymarkbridgesmedium-210114161003-thumbnail.jpg?width=640&height=640&fit=bounds)
![[Whitepaper] Business Model Innovation: Creation of Scalable Business Models ...](https://cdn.slidesharecdn.com/ss_thumbnails/businessmodelinnovationcreationofscalablebusinessmodelsredefinedbymarkbridgesmedium-210105161643-thumbnail.jpg?width=640&height=640&fit=bounds)
![[Whitepaper] Shareholder Value Traps: How to Evade Them and Focus on Value Cr...](https://cdn.slidesharecdn.com/ss_thumbnails/shareholdervaluetrapshowtoevade-210102145039-thumbnail.jpg?width=640&height=640&fit=bounds)


