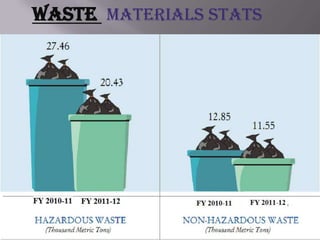
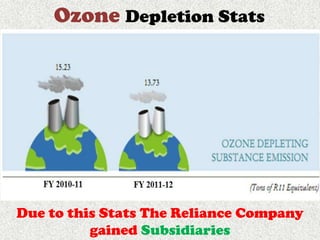
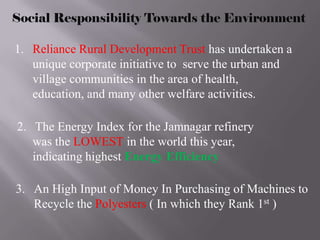
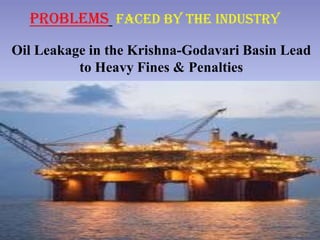
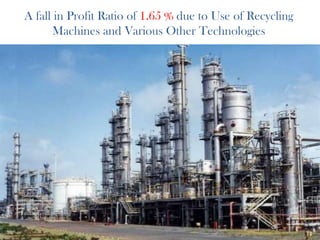
K.P.B.Hinduja College
    Of Commerce
SY-BAF
GROUP-1
3  Semester
  rd

 2012-2013
Reliance industries
    limited (RIL)
Mukesh Ambani
( Chairman & MD of Reliance Industries )
Recent Records
1. Reliance Industry is the worlds largest Polyester producer and
   as a result one of the largest producers of polyester waste in the
   world. In order to deal with this large amount of waste they had
   to create a way to Recycle the waste.

2. They use this process to develop a strong recycling process which
   won them a reward in the Team Excellence competition.

3. Reliance Industries Limited has a wide range of products
   from Petroleum products, Petrochemicals, Garments ( under the
   brand name of Vimal)

4. Reliance Industry,i.e, Oil & Gas Received Carbon Credits
Reliance sustainability project – “My Reliance,My Life”
 Accreditated A+ by Global Report Initiative ( GRI )
Energy consumption Stats
Water Consumption & Discharged Stats
Waste Materials Stats
Ozone Depletion Stats


Due to this Stats The Reliance Company
          gained Subsidiaries
Social Responsibility Towards the Environment

1. Reliance Rural Development Trust has undertaken a
   unique corporate initiative to serve the urban and
   village communities in the area of health,
   education, and many other welfare activities.

2. The Energy Index for the Jamnagar refinery
   was the LOWEST in the world this year,
   indicating highest Energy Efficiency

3. An High Input of Money In Purchasing of Machines to
   Recycle the Polyesters ( In which they Rank 1st )
Problems faced by The Industry
Oil Leakage in the Krishna-Godavari Basin Lead
          to Heavy Fines & Penalties
A fall in Profit Ratio of 1.65 % due to Use of Recycling
       Machines and Various Other Technologies
COMPARATIVE BALANCE SHEET


  MEANING
  FEATURES
PROFIT AND LOSS ACCOUNT
                                    Mar'11      Percentage
                          Mar'12
                                    Increase
                          12 Months 12 Months
Sales Turnover            66.12     36.38       81%
Excise Duty               0.00      0.00        0%
NET SALES                 66.12    36.38         81%
Other Income              0.00     0.00         0%
TOTAL INCOME              336.00   279.96        20%
Manufacturing Expenses    38.47    18.91        111%
Material Consumed         6.89     4.33         59%
Personal Expenses         38.65    60.60        (36)%
Selling Expenses          0.00     3.86         (100)%
Administrative Expenses   73.63    85.55        (14)%
Expenses Capitalised      0.00     0.00         0
Provisions Made           0.00     0.00         0
TOTAL EXPENDITURE         157.64   173.26        (9)%
Operating Profit          -91.52   -136.88      32%
EBITDA                    178.36   106.71        68%
Depreciation                   2.93        1.14        157%
Other Write-offs               0.00        0.00        0
EBIT                           175.43      105.56          66%
Interest                       60.34       42.35       42%
EBT                            115.09      63.22           82%
Taxes                          0.00        0.03        (100)%
Profit and Loss for the Year   115.09      63.19           82%
Non Recurring Items            195.85      190.45      0.02%

Other Non Cash Adjustments     -0.0        20.91       100%

Other Adjustments              0.00        0.00        0
REPORTED PAT                   310.86      274.55      13%
Preference Dividend            0.00        0.00        0
Equity Dividend                0.00        0.00        0
Equity Dividend (%)            0.00        0.00        0

Shares in Issue (Lakhs)        28,051.26   28,051.26   -
EPS - Annualised (Rs)          1.11        0.98            13%
BALANCE SHEET
                           12 months    12 months
Sources Of Funds
Total Share Capital        2,805.13      2,805.13   -
Equity Share Capital       2,805.13      2,805.13   -
Share Application Money    0.00          0.00       -
Preference Share Capital   0.00          0.00       -
Reserves                   13,296.20    13,091.44   1.56%
Revaluation Reserves       0.00         0.00        -
Net worth                  16,101.33   15,896.57    1.28%
Secured Loans              0.00        0.00         -
Unsecured Loans            0.00        1,554.05     (100)%
Total Debt                 0.00        1,554.05     (100)%
Total Liabilities          16,101.33   17,450.62    (77)%
Percentage
                             Mar '12      Mar '11
                                                          Increase/Percentage
                             Mar '12     Mar '11                Decrease
                             12 moths    12 moths
Application Of Funds
Gross Block                  91.20       96.53       (5)%
Less: Accum. Depreciation    0.00        11.30       (100)%
Net Block                    91.20       85.23       7%
Capital Work in Progress     9.01        58.86       (84)%
Investments                  9,619.12    8,578.32     12%
Inventories                  0.00        0.00        -
Sundry Debtors               19.15       12.20       58%
Cash and Bank Balance        205.95      17.20       1111%
Total Current Assets         225.10      29.40       676%
Loans and Advances           6,364.14    7,599.92     (76)%
Fixed Deposits               0.00        1,217.71     (100)%
Total CA, Loans & Advances   6,589.24    8,847.03     (25)%
Deferred Credit              0.00        0.00        -
Current Liabilities          205.05      115.51      78%
Provisions                   2.19        3.33        (34)%
Total CL & Provisions        207.24      118.84      74%
Net Current Assets           6,382.00    8,728.19     (27)%
Miscellaneous Expenses       0.00        0.00        -
Total Assets                 16,101.33   17,450.60    (8)%
Contingent Liabilities       1.74        2.90        (40)%
Book Value (Rs)              57.40       56.67
Highlights

•Turnover :               Rs.3,39,792 Crore ($ 66,790 million)

•PBDIT :                  Rs. 39,811 Crore ($ 7,825 million)
•Cash Profit :            Rs. 31,994 Crore ($ 6,289 million)
•Net Profit :             Rs. 20,040 Crore ($ 3,939 million)
•Net Profit 10 years CAGR : 20%
•Total Assets :           Rs. 2,95,140 Crore ($ 58,013 million)
Significant contribution to India's
economic growth
• 14% of India's total exports
• 5.5% of the Government of India's
   indirect tax revenues
• 4% of the total market capitalization
   in India
• 9.3% Weightage in the BSE Sensex
• 7.8% Weightage in the NSE Nifty
Growing importance across the globe
Largest refining capacity at any single
location
Largest producer of Polyester Fibre and Yarn
5th largest producer of Paraxylene (PX)
and Polypropylene (PP)
8th Largest producer of Purified Terephthalic
Acid (PTA) and Mono Ethylene Glycol
(MEG)

Ma sem 3

  • 1.
  • 2.
  • 3.
    Reliance industries limited (RIL)
  • 4.
    Mukesh Ambani ( Chairman& MD of Reliance Industries )
  • 5.
    Recent Records 1. RelianceIndustry is the worlds largest Polyester producer and as a result one of the largest producers of polyester waste in the world. In order to deal with this large amount of waste they had to create a way to Recycle the waste. 2. They use this process to develop a strong recycling process which won them a reward in the Team Excellence competition. 3. Reliance Industries Limited has a wide range of products from Petroleum products, Petrochemicals, Garments ( under the brand name of Vimal) 4. Reliance Industry,i.e, Oil & Gas Received Carbon Credits
  • 6.
    Reliance sustainability project– “My Reliance,My Life” Accreditated A+ by Global Report Initiative ( GRI )
  • 7.
  • 8.
    Water Consumption &Discharged Stats
  • 9.
  • 10.
    Ozone Depletion Stats Dueto this Stats The Reliance Company gained Subsidiaries
  • 11.
    Social Responsibility Towardsthe Environment 1. Reliance Rural Development Trust has undertaken a unique corporate initiative to serve the urban and village communities in the area of health, education, and many other welfare activities. 2. The Energy Index for the Jamnagar refinery was the LOWEST in the world this year, indicating highest Energy Efficiency 3. An High Input of Money In Purchasing of Machines to Recycle the Polyesters ( In which they Rank 1st )
  • 12.
    Problems faced byThe Industry Oil Leakage in the Krishna-Godavari Basin Lead to Heavy Fines & Penalties
  • 13.
    A fall inProfit Ratio of 1.65 % due to Use of Recycling Machines and Various Other Technologies
  • 14.
  • 15.
    PROFIT AND LOSSACCOUNT Mar'11 Percentage Mar'12 Increase 12 Months 12 Months Sales Turnover 66.12 36.38 81% Excise Duty 0.00 0.00 0% NET SALES 66.12 36.38 81% Other Income 0.00 0.00 0% TOTAL INCOME 336.00 279.96 20% Manufacturing Expenses 38.47 18.91 111% Material Consumed 6.89 4.33 59% Personal Expenses 38.65 60.60 (36)% Selling Expenses 0.00 3.86 (100)% Administrative Expenses 73.63 85.55 (14)% Expenses Capitalised 0.00 0.00 0 Provisions Made 0.00 0.00 0 TOTAL EXPENDITURE 157.64 173.26 (9)% Operating Profit -91.52 -136.88 32% EBITDA 178.36 106.71 68%
  • 16.
    Depreciation 2.93 1.14 157% Other Write-offs 0.00 0.00 0 EBIT 175.43 105.56 66% Interest 60.34 42.35 42% EBT 115.09 63.22 82% Taxes 0.00 0.03 (100)% Profit and Loss for the Year 115.09 63.19 82% Non Recurring Items 195.85 190.45 0.02% Other Non Cash Adjustments -0.0 20.91 100% Other Adjustments 0.00 0.00 0 REPORTED PAT 310.86 274.55 13% Preference Dividend 0.00 0.00 0 Equity Dividend 0.00 0.00 0 Equity Dividend (%) 0.00 0.00 0 Shares in Issue (Lakhs) 28,051.26 28,051.26 - EPS - Annualised (Rs) 1.11 0.98 13%
  • 17.
    BALANCE SHEET 12 months 12 months Sources Of Funds Total Share Capital 2,805.13 2,805.13 - Equity Share Capital 2,805.13 2,805.13 - Share Application Money 0.00 0.00 - Preference Share Capital 0.00 0.00 - Reserves 13,296.20 13,091.44 1.56% Revaluation Reserves 0.00 0.00 - Net worth 16,101.33 15,896.57 1.28% Secured Loans 0.00 0.00 - Unsecured Loans 0.00 1,554.05 (100)% Total Debt 0.00 1,554.05 (100)% Total Liabilities 16,101.33 17,450.62 (77)%
  • 18.
    Percentage Mar '12 Mar '11 Increase/Percentage Mar '12 Mar '11 Decrease 12 moths 12 moths Application Of Funds Gross Block 91.20 96.53 (5)% Less: Accum. Depreciation 0.00 11.30 (100)% Net Block 91.20 85.23 7% Capital Work in Progress 9.01 58.86 (84)% Investments 9,619.12 8,578.32 12% Inventories 0.00 0.00 - Sundry Debtors 19.15 12.20 58% Cash and Bank Balance 205.95 17.20 1111% Total Current Assets 225.10 29.40 676% Loans and Advances 6,364.14 7,599.92 (76)% Fixed Deposits 0.00 1,217.71 (100)% Total CA, Loans & Advances 6,589.24 8,847.03 (25)% Deferred Credit 0.00 0.00 - Current Liabilities 205.05 115.51 78% Provisions 2.19 3.33 (34)% Total CL & Provisions 207.24 118.84 74% Net Current Assets 6,382.00 8,728.19 (27)% Miscellaneous Expenses 0.00 0.00 - Total Assets 16,101.33 17,450.60 (8)% Contingent Liabilities 1.74 2.90 (40)% Book Value (Rs) 57.40 56.67
  • 19.
    Highlights •Turnover : Rs.3,39,792 Crore ($ 66,790 million) •PBDIT : Rs. 39,811 Crore ($ 7,825 million) •Cash Profit : Rs. 31,994 Crore ($ 6,289 million) •Net Profit : Rs. 20,040 Crore ($ 3,939 million) •Net Profit 10 years CAGR : 20% •Total Assets : Rs. 2,95,140 Crore ($ 58,013 million)
  • 20.
    Significant contribution toIndia's economic growth • 14% of India's total exports • 5.5% of the Government of India's indirect tax revenues • 4% of the total market capitalization in India • 9.3% Weightage in the BSE Sensex • 7.8% Weightage in the NSE Nifty
  • 21.
    Growing importance acrossthe globe Largest refining capacity at any single location Largest producer of Polyester Fibre and Yarn 5th largest producer of Paraxylene (PX) and Polypropylene (PP) 8th Largest producer of Purified Terephthalic Acid (PTA) and Mono Ethylene Glycol (MEG)