The document summarizes a class on Excel 2010 - Part 2 that was run by instructor Carrie Williams at New Horizons - Southern California. It provides ratings from 10 students on various aspects of the class such as the instructor, courseware, business results, learning effectiveness, and environment. Overall ratings for each category averaged between 8.49-9.00 with most students rating the class highly and praising the instructor.
The document summarizes evaluations from a class on Excel 2013 taught by instructor Carrie Williams at New Horizons Southern California. Students gave the instructor, courseware, and learning environment high ratings, averaging between 8.5-9 out of 10 for most categories. Specific positive comments mentioned Carrie Williams' knowledge, patience and helpfulness as an instructor. The class appeared to meet students' expectations and they felt they learned new skills that would improve their job performance.
The document provides a summary of a class on Excel 2010 taught by instructor Carrie Williams at New Horizons Southern California on December 1, 2015. It includes ratings from 14 students on various aspects of the class such as the instructor, courseware, business results, and learning environment. Overall ratings for most categories averaged between 8 and 9 out of 10.
This document summarizes evaluations from a class titled "Outlook 2013 Part 1" taught by instructor Carrie Williams at New Horizons - Southern California. Overall ratings for the instructor, courseware, and learning environment averaged between 8.67-8.89 out of 10. Students felt the instructor was knowledgeable and encouraged participation. The courseware was well organized with effective labs and relevance to real world skills. The environment was conducive to learning.
This document provides a summary of student evaluations for an Excel 2013 training course. It shows that 8 students completed the course taught by instructor Carrie Williams on November 6, 2015. Students rated various aspects of the course on a scale of 1 to 9, including the instructor's knowledge, presentation skills, and real-world examples; the clarity and organization of the course content; the effectiveness of labs; and whether the training would improve job performance. Average ratings across all categories ranged from 7.65 to 8.78. Student comments were positive about the instructor.
“Extramarks” help students to practice and score more marks by providing Class 10 Social Science Sample Paper. Once you solve our Sample questions, you understand the important questions which can be asked in the examination.https://www.extramarks.com/ncert-solutions/cbse-class-10/social-science
This document contains an 8 question math quiz about counting various objects like watermelons, caterpillars, apples, and bananas. It asks the learner to identify quantities, ordering of numbers, and what number comes next in a sequence. Upon completing the quiz, the learner's score of 88% is displayed along with a button to return to the main page.
2 Big Mistakes Professionals make using Excel data in PowerPointDave Paradi
When professionals present financial or operational data from Excel, they often make these two mistakes when they move that data into PowerPoint. Learn what you need to do in order to avoid these mistakes.
How to select and create an effective visual for your business presentationDave Paradi
Why do so many business professionals only use bullet point slides and the standard simple graphs in their PowerPoint presentations? This slide deck explains the four reasons why this is the case for many professionals. It shares an approach that works for people like analysts, accountants, engineers, and technical experts who don’t want to become designers just to create effective presentations.
This document summarizes evaluations from students who took an Excel 2010 training course. The one-day course was taught by instructor Carrie Williams at the New Horizons learning center in Tucson, Arizona on September 1, 2015. Student evaluations gave the instructor, courseware, and learning environment high ratings, averaging between 8.5-9 out of 10 for most categories. Two students left comments praising the instructor for being informative and pleasant to work with.
This document summarizes evaluations from students who took an Excel 2013 Part 2 class. It provides averages of student ratings on a scale of 1 to 9 for various aspects of the class including the instructor's knowledge, presentation skills, and encouragement of discussion; clarity and organization of course content; effectiveness and relevance of labs; and whether the training improved job performance. It also includes student comments praising the instructor and a comment criticizing the course for not delivering advanced content as described.
This document summarizes feedback from students who took an Excel 2013 training course. It provides averages of student ratings for various aspects of the course such as the instructor's knowledge, the course materials, how well the training met expectations, and whether students learned new skills. Overall ratings averaged between 7-9 out of 10 for most categories. A few students provided lower ratings for some areas.
1) The document summarizes a Word 2013 training course taught on December 10, 2015 by instructor Carrie Williams at New Horizons Southern California.
2) Ten students completed surveys evaluating the instructor, courseware, learning effectiveness, and environment. Overall ratings averaged between 7.3 and 8.1 out of 10.
3) The anonymous student with ID 46402241 commented that the instructor was well equipped to respond to specific questions and modify the coursework as needed.
1. This document summarizes a class on Word 2013 taught by instructor Carrie Williams at New Horizons Southern California on December 3, 2015.
2. Seven students completed an evaluation providing ratings for the instructor, courseware, business results, learning effectiveness, and environment.
3. On average, students rated the instructor, courseware, and learning effectiveness between 8-9 out of 10, indicating high satisfaction. However, one student commented that the instructor should use proper English for greater professionalism.
This document summarizes student evaluations of an Excel 2010 training course taught by instructor Carrie Williams. Overall, students rated the instructor, courseware, and their learning experience highly, with average scores ranging from 8.63 to 8.95 out of 10. While most students were very satisfied with the training, one student reported being somewhat satisfied. Students estimated that the training would lead to improvements in their job performance related to Excel, ranging from 40% to 100%.
The document appears to be a class summary report for a Word 2013 training course. It includes ratings and feedback from 8 students on various aspects of the course such as the instructor's knowledge, the courseware, and the learning environment. Some key points:
- Students generally rated the instructor highly, particularly for knowledge, presentation skills, and providing real-world examples.
- Ratings for courseware were also largely positive, though one student noted some content could have been presented more clearly.
- Feedback was overall positive about the learning environment and physical space being conducive to learning.
The document provides a summary of a training course on Word 2013 - Part 3 held on December 9, 2015. It includes ratings from four students on various aspects of the course such as the instructor, courseware, learning effectiveness, and environment. All aspects rated received an average score of 9 out of 10 or higher. One student commented that the instructor was "most excellent." The summary also notes that all four students who completed the evaluation form said they would recommend New Horizons to others.
This document provides a summary of student evaluations for an Excel 2013 training course. It shows the average ratings students gave for various aspects of the course such as the instructor, courseware, learning effectiveness, and environment. It also includes individual student ratings for each category as well as comments from students and the instructor. The top students in the class all gave ratings of 9 out of 10 for most categories, indicating high satisfaction with various elements of the training.
This document summarizes evaluations from students of an Excel 2013 training course taught by instructor Carrie Williams at New Horizons in Tucson. Overall ratings for the instructor, courseware, learning effectiveness and environment were high, averaging between 8.5-9 out of 10. A few students provided positive feedback on the instructor's teaching skills and encouragement of class participation. The training was taken by 9 students in a physical classroom setting with the goal of most to build new Excel skills and knowledge.
The document summarizes evaluations from students who completed an Excel 2010 training course. It provides ratings for various aspects of the course such as the instructor's knowledge, the course materials, and the learning environment. On average, students highly rated all areas, giving scores between 8-9 out of 10. A few students provided additional comments, praising the instructor for her teaching skills and noting the course moved at a fast but informative pace.
This document summarizes evaluations from students of a PowerPoint 2013 training course. It provides average ratings across various categories for each student, including instructor quality, courseware, learning effectiveness, and environment. Student comments indicate their objectives for taking the course were to build new skills and most were very satisfied or satisfied with their training experience. Recommendations include following up with any students who provided significantly lower ratings to understand feedback for improvements.
This document provides a summary of student evaluations for a Word 2010 training course. It includes ratings for various aspects of the course such as the instructor, courseware, and learning environment. On average, students rated most components between 8 and 9 out of 10. However, one student commented that the instructor needed to have more patience. Another student felt the courseware could include more practice activities.
The document summarizes evaluations from a PowerPoint 2013 training course. Two students completed the evaluation, anonymously identified as 46048783 and 46048873. Both students gave the highest possible rating of 9 out of 9 to all evaluation categories, including the instructor, courseware, likelihood of improving job performance, learning effectiveness, and environment. The summary indicates that both anonymous students were very satisfied with the training course.
This document summarizes evaluations from students who took a Word 2013 training course. It provides average ratings for each student across various categories related to the course, including the instructor, courseware, learning effectiveness, and environment. Ratings were on a scale of 1 to 10, with all students giving average ratings between 8.82 and 9.00 for each category. The summary also includes student comments praising the instructor and information about the students.
This document summarizes evaluations from a Word 2013 training course. Three students completed evaluations, rating various aspects of the instructor, courseware, learning effectiveness, and environment on a scale of 1 to 10. Average ratings were high, ranging from 7.67 to 9. Overall, students were very satisfied with the training and felt it would improve their job performance and skills. Comments indicated the instructor was knowledgeable and helpful. The document provides recommendations for following up with any low ratings and improving future trainings.
- The document summarizes evaluations from students who took a PowerPoint 2013 training course taught by instructor Carrie Williams at New Horizons Southern California on December 16, 2015.
- Students highly rated the instructor, courseware, and learning environment and effectiveness. The average ratings for all categories ranged from 7.6 to 9 out of 10.
- One student commented that the instructor was "very well spoken, calm and very patient. Very knowledgeable." Another said the instructor "is very welcoming, understanding, and happy to assist anyone in need."
The document summarizes evaluations from five students who completed an Excel 2013 training course. All students rated every category, including the instructor, courseware, learning effectiveness, and environment, as 9 out of 9. Some students provided additional comments, with all expressing satisfaction with the course and that it would improve their job performance or skills. A few students estimated improvements in areas like productivity, quality, and time to complete tasks from 20-40% over the next year as a result of the training.
This document summarizes evaluations from a Word 2010 training course taught by instructor Carrie Williams at New Horizons Southern California on December 11, 2015. Both students, Wara Stewart and Guadalupe Gonzalez, rated every category of the course and instructor as 9 out of 9. Their comments praised the instructor's encouragement and ability to explain concepts clearly. The summary shows that both students were very satisfied with the course and believe it will improve their job performance by 90% or more.
The document provides a summary of evaluations from a training course on Outlook 2010 - Part 2. Two students completed evaluations, rating various aspects of the instructor, courseware, learning effectiveness, and environment on a scale of 1 to 9. Both students rated all categories between 8 and 9, indicating high satisfaction. Comments provided additional positive feedback, with one student noting a technical issue. The summary recommends following up with students who rated aspects lower or higher to improve future trainings.
Carrie E. Williams completed an online course called "Understanding Your Customer" from the U.S. Small Business Administration on December 20, 2016. The certificate recognizes her completion of the course aimed at helping small business owners better understand their customers. The course is offered by the SBA Office of Entrepreneurial Development as part of their training resources for small businesses.
Taking Your High Tech Product to Market dsp_certificateCarrie E. Williams
Carrie E. Williams completed an online course called "Taking Your High-Tech Product to Market" through the U.S. Small Business Administration on December 19, 2016. The certificate recognizes her completion of the course to help entrepreneurs learn how to take high-tech products to market. It encourages continued learning as a valuable asset.
Carrie E. Williams completed an online course from the U.S. Small Business Administration called "Young Entrepreneurs: An Essential Guide to Starting Your Own Business" on December 19, 2016. The course provided guidance for starting a small business.
Encore Entrepreneurs Introduction to Starting Your Own Business dsp_certificateCarrie E. Williams
Carrie E. Williams completed an online course called "Encore Entrepreneurs, An Introduction to Starting Your Own Business" through the U.S. Small Business Administration on December 19, 2016. The certificate recognizes her completion of the course aimed at providing an introduction to starting a small business.
Carrie E. Williams completed an online course called "How To Win Federal Contracts" through the U.S. Small Business Administration on December 18, 2016. The course taught her how to pursue and win federal contracts. The SBA aims to provide small businesses with resources through online training courses.
Carrie E. Williams completed an online course in strategic planning for small businesses offered by the U.S. Small Business Administration on December 17, 2016. The certificate recognizes her completion of the course, which aimed to provide small business owners with strategic planning resources from the SBA.
The SBA Mentor-Protégé Program connects small businesses with federal contractors to provide training and experience. It allows mentors to receive bonus points on future government contracts and credit subcontracts to protégés towards contracting goals. The program aims to strengthen small businesses by helping them develop the skills needed to compete for federal and commercial contracts.
This document is a digital transcript for Carrie Elizabeth Williams that details her Microsoft Office certifications. It shows that she has passed certification exams in Microsoft Office Access 2013, Excel 2010 and 2013, Outlook 2010 and 2013, PowerPoint 2007, 2010 and 2013, Word 2007, 2010, and 2013 including the Word 2013 Expert exams. The transcript provides the names of the testing centers and dates she passed each of the 14 exams. It also describes Certiport as the provider that tracks and authenticates over 12,000 certification exams administered worldwide.
This document contains Carrie Elizabeth Williams' CompTIA certification information including her certificate code and verification URL. It provides her name, certificate number, date of issuance, and credentials needed to validate her CompTIA certification online.
This document provides a summary of the ranking of New Horizons - Southern California as a learning provider based on evaluations from January 1, 2016 to December 31, 2016. It shows that New Horizons ranked 1795 out of 4457 total learning providers based on 27,703 evaluations, with an average score of 8.72 out of 9. The document also provides recommendations on interpreting the report and recommended next steps for analysis.
This report card summarizes learning performance data from a survey based on questions about an instructor and course. It shows average ratings for the instructor and course compared to the organization's internal benchmarks. Ratings were on a scale of 1 to 9, with 9 being the highest. Across all questions, the average rating was 8.33 compared to the benchmark of 8.13. For questions specific to the instructor, the average rating was 8.33, matching the internal benchmark. The report recommends identifying categories that scored below benchmarks and using additional reports to determine how to improve weak areas.
This report summarizes learning performance data from surveys given after training sessions. It provides average scores for questions about the instructor and instructor performance, comparing the organization's scores to its own internal benchmarks. Scores for the organization were consistently higher than the benchmarks. The report recommends determining which question categories scored below benchmarks, using additional reports to identify potential causes, and scheduling regular report distribution to instructors and course managers for development and improvement purposes.
This report summarizes learning performance data from a survey based on questions about an instructor and course. It shows average ratings for the instructor and individual questions, comparing the organization's performance to its own internal benchmarks. Ratings for the instructor met or exceeded the benchmarks. The report recommends identifying any question categories below benchmarks to determine how to improve, and using filters to evaluate specific instructors or courses for performance reviews or redesign plans. It also suggests scheduling regular distribution of the report to communicate results.
This report card summarizes learning performance data by survey question category and individual questions for a training provided by the organization. It shows the average scores for each category and question compared to an internal benchmark. Scores for the instructor category and overall instructor rating were slightly higher than the benchmark. The report recommends analyzing categories below the benchmark to determine how to improve, and using filters to evaluate specific instructors or courses for performance reviews or redesign plans. It also suggests scheduling regular report distribution and reviewing other related reports for further analysis.
This report card summarizes learning performance data from a survey based on questions about an instructor. It shows the average ratings for the instructor and categories like class discussions and real-world examples, all of which were 8.4 or higher on a 9-point scale. The instructor ratings matched the internal benchmark averages. The report recommends determining which categories, if any, fall below benchmarks and using filters to identify strengths or areas for improvement by individual instructors or courses.
This report card summarizes learning performance data from surveys on various questions about an instructor and course. It shows the average ratings for different questions, categories, and an overall instructor rating, and compares the results to an internal benchmark. The ratings were generally high, averaging around 8.4-8.5 on a 9-point scale, but some questions like real-world examples and instructor presentation skills were slightly below the benchmark. It recommends analyzing questions that scored lower to identify areas for improvement and using the report for instructor reviews and development.
This report summarizes learning performance survey results for an instructor-led training. It shows average scores for questions about the instructor and course content, comparing the organization's results to its internal benchmarks. Scores were generally high, ranging from 8.57 to 8.69 out of 9. The report recommends identifying areas scoring below benchmarks to determine how to improve, and using filters to evaluate specific instructors or courses for performance reviews or redesign plans.
This report summarizes learning performance data from a survey based on questions about an instructor and course. It shows average scores for questions in different categories, comparing the organization's performance to its own internal benchmarks. Scores were generally high, averaging around 8.3 out of 9, but some categories like real-world examples were slightly below the benchmark. It recommends analyzing categories below benchmarks to identify areas for improvement, and using filters to guide instructor or course reviews and development plans.
This report summarizes learning performance data from a survey based on questions about instructors and course material. It shows average ratings for an organization compared to its internal benchmarks across various metrics. Ratings for the organization were above the benchmark averages for instructor knowledge, presentation skills, encouragement of discussion, and use of real-world examples. The report recommends identifying areas below benchmarks and using filters to guide instructor or course improvements.
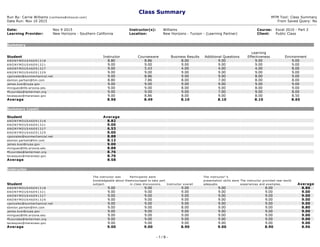
1. Class Summary
Run By: Carrie Williams (cwilliams@nhsocal.com) MTM Tool: Class Summary
Date Run: Nov 10 2015 From Saved Query: No
Date: Nov 9 2015 Instructor(s): Williams Course: Excel 2010 Part 2
Learning Provider: New Horizons Southern California Location: New Horizons Tucson (Learning Partner) Client: Public Class
Summary
Student Instructor Courseware Business Results Additional Questions
Learning
Effectiveness Environment
A N O N Y M O U S 4 6 0 9 1 3 1 8 8.80 8.86 8.00 9.00 9.00 9.00
A N O N Y M O U S 4 6 0 9 1 3 2 1 9.00 9.00 9.00 9.00 9.00 9.00
A N O N Y M O U S 4 6 0 9 1 3 2 7 9.00 5.43 4.00 4.00 4.00 8.00
A N O N Y M O U S 4 6 0 9 1 3 2 9 9.00 9.00 9.00 9.00 9.00 9.00
cgonzalez@sunmechanical.net 9.00 8.86 9.00 9.00 8.00 9.00
damion.parham@hm.com 8.80 7.86 8.00 7.00 8.00 8.00
james.kusi@nypa.gov 9.00 9.00 9.00 9.00 9.00 9.00
miniguez@life.arizona.edu 9.00 9.00 8.00 9.00 8.00 9.00
MLouridas@lanterman.org 9.00 9.00 9.00 7.00 9.00 8.00
tevasquez@maranaaz.gov 9.00 8.86 8.00 9.00 8.00 8.50
Average 8.96 8.49 8.10 8.10 8.10 8.65
Summary (cont)
Student Average
A N O N Y M O U S 4 6 0 9 1 3 1 8 8.82
A N O N Y M O U S 4 6 0 9 1 3 2 1 9.00
A N O N Y M O U S 4 6 0 9 1 3 2 7 6.53
A N O N Y M O U S 4 6 0 9 1 3 2 9 9.00
cgonzalez@sunmechanical.net 8.88
damion.parham@hm.com 8.12
james.kusi@nypa.gov 9.00
miniguez@life.arizona.edu 8.88
MLouridas@lanterman.org 8.76
tevasquez@maranaaz.gov 8.76
Average 8.58
Instructor
Student
The instructor was
knowledgeable about the
subject.
Participants were
encouraged to take part
in class discussions. Instructor overall
The instructor''s
presentation skills were
adequate.
The instructor provided realworld
experiences and examples. Average
A N O N Y M O U S 4 6 0 9 1 3 1 8 9.00 9.00 9.00 9.00 8.00 8.80
A N O N Y M O U S 4 6 0 9 1 3 2 1 9.00 9.00 9.00 9.00 9.00 9.00
A N O N Y M O U S 4 6 0 9 1 3 2 7 9.00 9.00 9.00 9.00 9.00 9.00
A N O N Y M O U S 4 6 0 9 1 3 2 9 9.00 9.00 9.00 9.00 9.00 9.00
cgonzalez@sunmechanical.net 9.00 9.00 9.00 9.00 9.00 9.00
damion.parham@hm.com 9.00 9.00 8.00 9.00 9.00 8.80
james.kusi@nypa.gov 9.00 9.00 9.00 9.00 9.00 9.00
miniguez@life.arizona.edu 9.00 9.00 9.00 9.00 9.00 9.00
MLouridas@lanterman.org 9.00 9.00 9.00 9.00 9.00 9.00
tevasquez@maranaaz.gov 9.00 9.00 9.00 9.00 9.00 9.00
Average 9.00 9.00 8.90 9.00 8.90 8.96
- 1 / 9 -
2.
Courseware
Student
Clarity of the training
content
Technical depth of the
training content
The material was
organized logically.
Effectiveness of the labs
in reinforcing the
knowledge/skills learned
in the modules
Relevance of the
labs to real world
job situations
Time dedicated to activities
such as discussions,
practices, and labs (as
opposed to lecture)
A N O N Y M O U S 4 6 0 9 1 3 1 8 9.00 9.00 9.00 8.00 9.00 9.00
A N O N Y M O U S 4 6 0 9 1 3 2 1 9.00 9.00 9.00 9.00 9.00 9.00
A N O N Y M O U S 4 6 0 9 1 3 2 7 9.00 3.00 3.00 5.00 7.00 2.00
A N O N Y M O U S 4 6 0 9 1 3 2 9 9.00 9.00 9.00 9.00 9.00 9.00
cgonzalez@sunmechanical.net 9.00 9.00 9.00 9.00 9.00 8.00
damion.parham@hm.com 7.00 8.00 8.00 8.00 7.00 8.00
james.kusi@nypa.gov 9.00 9.00 9.00 9.00 9.00 9.00
miniguez@life.arizona.edu 9.00 9.00 9.00 9.00 9.00 9.00
MLouridas@lanterman.org 9.00 9.00 9.00 9.00 9.00 9.00
tevasquez@maranaaz.gov 9.00 9.00 9.00 9.00 9.00 8.00
Average 8.80 8.30 8.30 8.40 8.60 8.00
Courseware (cont)
Student
Language quality of the
courseware (grammar,
terminology, style) Average
A N O N Y M O U S 4 6 0 9 1 3 1 8 9.00 8.86
A N O N Y M O U S 4 6 0 9 1 3 2 1 9.00 9.00
A N O N Y M O U S 4 6 0 9 1 3 2 7 9.00 5.43
A N O N Y M O U S 4 6 0 9 1 3 2 9 9.00 9.00
cgonzalez@sunmechanical.net 9.00 8.86
damion.parham@hm.com 9.00 7.86
james.kusi@nypa.gov 9.00 9.00
miniguez@life.arizona.edu 9.00 9.00
MLouridas@lanterman.org 9.00 9.00
tevasquez@maranaaz.gov 9.00 8.86
Average 9.00 8.49
Business Results
Student
This training will
improve my job
performance. Average
A N O N Y M O U S 4 6 0 9 1 3 1 8 8.00 8.00
A N O N Y M O U S 4 6 0 9 1 3 2 1 9.00 9.00
A N O N Y M O U S 4 6 0 9 1 3 2 7 4.00 4.00
A N O N Y M O U S 4 6 0 9 1 3 2 9 9.00 9.00
cgonzalez@sunmechanical.net 9.00 9.00
damion.parham@hm.com 8.00 8.00
james.kusi@nypa.gov 9.00 9.00
miniguez@life.arizona.edu 8.00 8.00
MLouridas@lanterman.org 9.00 9.00
tevasquez@maranaaz.gov 8.00 8.00
Average 8.10 8.10
Additional Questions
Student
How well did this
training meet your
expectations? Average
- 2 / 9 -
3.
A N O N Y M O U S 4 6 0 9 1 3 1 8 9.00 9.00
A N O N Y M O U S 4 6 0 9 1 3 2 1 9.00 9.00
A N O N Y M O U S 4 6 0 9 1 3 2 7 4.00 4.00
A N O N Y M O U S 4 6 0 9 1 3 2 9 9.00 9.00
cgonzalez@sunmechanical.net 9.00 9.00
damion.parham@hm.com 7.00 7.00
james.kusi@nypa.gov 9.00 9.00
miniguez@life.arizona.edu 9.00 9.00
MLouridas@lanterman.org 7.00 7.00
tevasquez@maranaaz.gov 9.00 9.00
Average 8.10 8.10
Learning Effectiveness
Student
I have learned new
knowledge/skills from
this training. Average
A N O N Y M O U S 4 6 0 9 1 3 1 8 9.00 9.00
A N O N Y M O U S 4 6 0 9 1 3 2 1 9.00 9.00
A N O N Y M O U S 4 6 0 9 1 3 2 7 4.00 4.00
A N O N Y M O U S 4 6 0 9 1 3 2 9 9.00 9.00
cgonzalez@sunmechanical.net 8.00 8.00
damion.parham@hm.com 8.00 8.00
james.kusi@nypa.gov 9.00 9.00
miniguez@life.arizona.edu 8.00 8.00
MLouridas@lanterman.org 9.00 9.00
tevasquez@maranaaz.gov 8.00 8.00
Average 8.10 8.10
Environment
Student
The physical
environment was
conducive to learning.
The hardware was setup
and functioning
appropriately. Average
A N O N Y M O U S 4 6 0 9 1 3 1 8 9.00 9.00 9.00
A N O N Y M O U S 4 6 0 9 1 3 2 1 9.00 9.00 9.00
A N O N Y M O U S 4 6 0 9 1 3 2 7 7.00 9.00 8.00
A N O N Y M O U S 4 6 0 9 1 3 2 9 9.00 9.00 9.00
cgonzalez@sunmechanical.net 9.00 9.00 9.00
damion.parham@hm.com 7.00 9.00 8.00
james.kusi@nypa.gov 9.00 9.00 9.00
miniguez@life.arizona.edu 9.00 9.00 9.00
MLouridas@lanterman.org 7.00 9.00 8.00
tevasquez@maranaaz.gov 8.00 9.00 8.50
Average 8.30 9.00 8.65
Comments
Instructor
Comments: (Instructor)
miniguez@life.arizona.edu great instructor, thank you
User Information
First Name
- 3 / 9 -
4. MLouridas@lanterman.org Maria
miniguez@life.arizona.edu Maria
james.kusi@nypa.gov James
cgonzalez@sunmechanical.net Candice
tevasquez@maranaaz.gov Teri
A N O N Y M O U S 4 6 0 9 1 3 1 8 Kathryn
A N O N Y M O U S 4 6 0 9 1 3 2 1 Tina
A N O N Y M O U S 4 6 0 9 1 3 2 7 Mercedez
damion.parham@hm.com Damion
A N O N Y M O U S 4 6 0 9 1 3 2 9 Mayra
Last Name
MLouridas@lanterman.org Louridas
miniguez@life.arizona.edu Iniguez
james.kusi@nypa.gov Kusi
cgonzalez@sunmechanical.net Gonzalez
tevasquez@maranaaz.gov Vasquez
A N O N Y M O U S 4 6 0 9 1 3 1 8 Fox
A N O N Y M O U S 4 6 0 9 1 3 2 1 Ruiz
A N O N Y M O U S 4 6 0 9 1 3 2 7 Wallace
damion.parham@hm.com Parham
A N O N Y M O U S 4 6 0 9 1 3 2 9 Mora
Phone Number
MLouridas@lanterman.org 2132524956
miniguez@life.arizona.edu 5208704232
james.kusi@nypa.gov 9144191574
cgonzalez@sunmechanical.net (520)7298009
tevasquez@maranaaz.gov 5203821953
A N O N Y M O U S 4 6 0 9 1 3 1 8 4197868325
A N O N Y M O U S 4 6 0 9 1 3 2 1 8016439695
damion.parham@hm.com 6467712984
A N O N Y M O U S 4 6 0 9 1 3 2 9 5203821903
What was your main objective for completing this training?
MLouridas@lanterman.org Build new skills and knowledge (not related to a new software deployment)
miniguez@life.arizona.edu Build new skills and knowledge (not related to a new software deployment)
james.kusi@nypa.gov Solve a particular problem
cgonzalez@sunmechanical.net Build new skills and knowledge (not related to a new software deployment)
tevasquez@maranaaz.gov Build new skills and knowledge (not related to a new software deployment)
A N O N Y M O U S 4 6 0 9 1 3 1 8 Build new skills and knowledge (not related to a new software deployment)
A N O N Y M O U S 4 6 0 9 1 3 2 1 Other
damion.parham@hm.com Build new skills and knowledge (not related to a new software deployment)
A N O N Y M O U S 4 6 0 9 1 3 2 9 Build new skills and knowledge (not related to a new software deployment)
- 4 / 9 -
5. Courseware
What suggestions do you have for enhancing the courseware?
james.kusi@nypa.gov Require more than One day training since there are a lot to learn
A N O N Y M O U S 4 6 0 9 1 3 2 7 separate those who are less familiar with excel. Have prereqs. For instance, if you do not know how to minimize a worksheet, maybe you
shouldn't be learning about formulas just yet.
Overall Satisfaction
Overall, how satisfied are you with this training course? (check only one) [Student Data]
MLouridas@lanterman.org Somewhat satisfied
miniguez@life.arizona.edu Very satisfied
james.kusi@nypa.gov Very satisfied
cgonzalez@sunmechanical.net Very satisfied
tevasquez@maranaaz.gov Very satisfied
A N O N Y M O U S 4 6 0 9 1 3 1 8 Very satisfied
A N O N Y M O U S 4 6 0 9 1 3 2 1 Very satisfied
A N O N Y M O U S 4 6 0 9 1 3 2 7 Somewhat dissatisfied
damion.parham@hm.com Somewhat satisfied
A N O N Y M O U S 4 6 0 9 1 3 2 9 Very satisfied
Business Results
Based on your response to the prior question, estimate how much of the improvement will be a direct result of this training.
MLouridas@lanterman.org 20%
miniguez@life.arizona.edu 40%
james.kusi@nypa.gov 90%
cgonzalez@sunmechanical.net 100%
tevasquez@maranaaz.gov 100%
A N O N Y M O U S 4 6 0 9 1 3 1 8 50%
A N O N Y M O U S 4 6 0 9 1 3 2 1 100%
A N O N Y M O U S 4 6 0 9 1 3 2 7 0%
damion.parham@hm.com 40%
A N O N Y M O U S 4 6 0 9 1 3 2 9 90%
Estimate how much you expect your job performance related to the course subject matter to improve in the next 12 months.
Include in your estimate any performance improvements due to this training, as well as all other factors like onthe job
experience, incentives, and process improvements. (For example, if you feel that you can improve your performance by
20% in the next 12 months based on this training plus all other factors, enter 20% here.)
MLouridas@lanterman.org 50%
miniguez@life.arizona.edu 40%
james.kusi@nypa.gov 90%
cgonzalez@sunmechanical.net 100%
tevasquez@maranaaz.gov 90%
A N O N Y M O U S 4 6 0 9 1 3 1 8 40%
A N O N Y M O U S 4 6 0 9 1 3 2 1 100%
A N O N Y M O U S 4 6 0 9 1 3 2 7 80%
- 5 / 9 -
6. damion.parham@hm.com 40%
A N O N Y M O U S 4 6 0 9 1 3 2 9 90%
If you think this training will have a positive impact on your job performance, what areas will be impacted most? Check all
that apply.
MLouridas@lanterman.org increasing productivity
miniguez@life.arizona.edu increasing quality
miniguez@life.arizona.edu increasing productivity
james.kusi@nypa.gov increasing ability to innovate
cgonzalez@sunmechanical.net increasing productivity
cgonzalez@sunmechanical.net decreasing time to complete task(s)
cgonzalez@sunmechanical.net increasing customer satisfaction
cgonzalez@sunmechanical.net increasing employee satisfaction
tevasquez@maranaaz.gov increasing quality
tevasquez@maranaaz.gov increasing productivity
tevasquez@maranaaz.gov increasing ability to innovate
tevasquez@maranaaz.gov decreasing time to complete task(s)
A N O N Y M O U S 4 6 0 9 1 3 1 8 increasing productivity
A N O N Y M O U S 4 6 0 9 1 3 1 8 decreasing time to complete task(s)
A N O N Y M O U S 4 6 0 9 1 3 2 1 decreasing time to complete task(s)
damion.parham@hm.com increasing quality
A N O N Y M O U S 4 6 0 9 1 3 2 9 increasing quality
A N O N Y M O U S 4 6 0 9 1 3 2 9 increasing productivity
A N O N Y M O U S 4 6 0 9 1 3 2 9 increasing ability to innovate
A N O N Y M O U S 4 6 0 9 1 3 2 9 decreasing time to complete task(s)
Additional Questions
Is this your first time at New Horizons?
MLouridas@lanterman.org Yes
miniguez@life.arizona.edu No
james.kusi@nypa.gov No
cgonzalez@sunmechanical.net No
tevasquez@maranaaz.gov No
A N O N Y M O U S 4 6 0 9 1 3 1 8 No
A N O N Y M O U S 4 6 0 9 1 3 2 1 Yes
A N O N Y M O U S 4 6 0 9 1 3 2 7 Yes
damion.parham@hm.com No
A N O N Y M O U S 4 6 0 9 1 3 2 9 No
Would you recommend New Horizons to others?
MLouridas@lanterman.org Yes
miniguez@life.arizona.edu Yes
james.kusi@nypa.gov Yes
cgonzalez@sunmechanical.net Yes
tevasquez@maranaaz.gov Yes
- 6 / 9 -
7. A N O N Y M O U S 4 6 0 9 1 3 1 8 Yes
A N O N Y M O U S 4 6 0 9 1 3 2 1 Yes
A N O N Y M O U S 4 6 0 9 1 3 2 7 Yes
damion.parham@hm.com Yes
A N O N Y M O U S 4 6 0 9 1 3 2 9 Yes
Other classes you are interested in taking:
MLouridas@lanterman.org Excel 2010 Part 3
cgonzalez@sunmechanical.net Excel 4 and 5
damion.parham@hm.com Project Manager
Would you be willing to provide a public quote about your experience taking this course?
MLouridas@lanterman.org No
miniguez@life.arizona.edu Yes
cgonzalez@sunmechanical.net No
tevasquez@maranaaz.gov Yes
A N O N Y M O U S 4 6 0 9 1 3 1 8 Yes
A N O N Y M O U S 4 6 0 9 1 3 2 1 Yes
A N O N Y M O U S 4 6 0 9 1 3 2 7 No
damion.parham@hm.com Yes
A N O N Y M O U S 4 6 0 9 1 3 2 9 No
Return on Investment
Would you like to be notified about advanced or complementary courses?
MLouridas@lanterman.org Yes
miniguez@life.arizona.edu Yes
james.kusi@nypa.gov Yes
cgonzalez@sunmechanical.net No
A N O N Y M O U S 4 6 0 9 1 3 1 8 Yes
A N O N Y M O U S 4 6 0 9 1 3 2 1 Yes
A N O N Y M O U S 4 6 0 9 1 3 2 7 Yes
damion.parham@hm.com Yes
A N O N Y M O U S 4 6 0 9 1 3 2 9 Yes
Job Impact
What percent of your total work time requires the knowledge or skills presented in this training? Please check only one.
MLouridas@lanterman.org 50%
miniguez@life.arizona.edu 40%
james.kusi@nypa.gov 60%
cgonzalez@sunmechanical.net 40%
tevasquez@maranaaz.gov 60%
A N O N Y M O U S 4 6 0 9 1 3 1 8 50%
A N O N Y M O U S 4 6 0 9 1 3 2 1 90%
A N O N Y M O U S 4 6 0 9 1 3 2 7 70%
- 7 / 9 -
8. damion.parham@hm.com 50%
A N O N Y M O U S 4 6 0 9 1 3 2 9 90%
Environment
Comments (Environment):
tevasquez@maranaaz.gov Classroom was a little warm.
A N O N Y M O U S 4 6 0 9 1 3 2 7 Having a mix of levels in one class slows down the process and ultimately ran out of time.
General Questions
Other (please specify) [What was your main objective for completing this training?]:
A N O N Y M O U S 4 6 0 9 1 3 2 1 To learn more about how to use excel
Response Rate
Form Type Evaluations
Sent
Evaluations
Received
Response
Rate
Post Event 10 10 100.00%
Report Recommendations
Interpreting the Report
Below are tips to help you understand the information in the report. For additional information, please click the Help tab above the report.
Summarizes scores from each student for selected question categories and questions; compare and analyze scores for all students that completed evaluations.
Student comments provide additional insight into the scores displayed within the report.
Determine the students’ overall perceived value derived specifically from training to proactively manage future training events.
Recommended Actions
Below are recommended next steps to take after reviewing the information in this report. Additionally, you'll find links to automatically run complementary reports for
drillingdown further into the data or analyzing the information in another way.
If any learner rated the class much lower than others, and the learner provided an email address, follow up with that person to gather additional feedback regarding the
scores. Share that feedback with instructor and course managers as areas for improvement.
If any learner rated the class much higher than others, especially in the areas of job impact or business results, follow up with those learners to gether additional feedback
on how they were able to maximize their use of what they learned on the job. Share this feedback with course managers to ensure they share the knowledge with future
learners to maximize job impact and business results.
Schedule this report to be emailed automatically to the course and instructor managers on a daily basis so they are able to review performance on a regular basis.
Recommended Links
Run the Learner Comments report to review all the qualitative feedback for specific approaches to make the learning more effective and impactful.
Run the Quick Question report to summarize the scalebased and multiplechoice answers for all of the evaluations.
Run the Performance to Goals report to view how these results compared to your goals.
Report Criteria
Reporting Date: Nov 1 2015 to Nov 30 2015
Form Type: Follow Up;
Instructor Survey;
Post Event
Category: Additional Questions;
Business Results;
Courseware;
Environment;
General Questions;
- 8 / 9 -