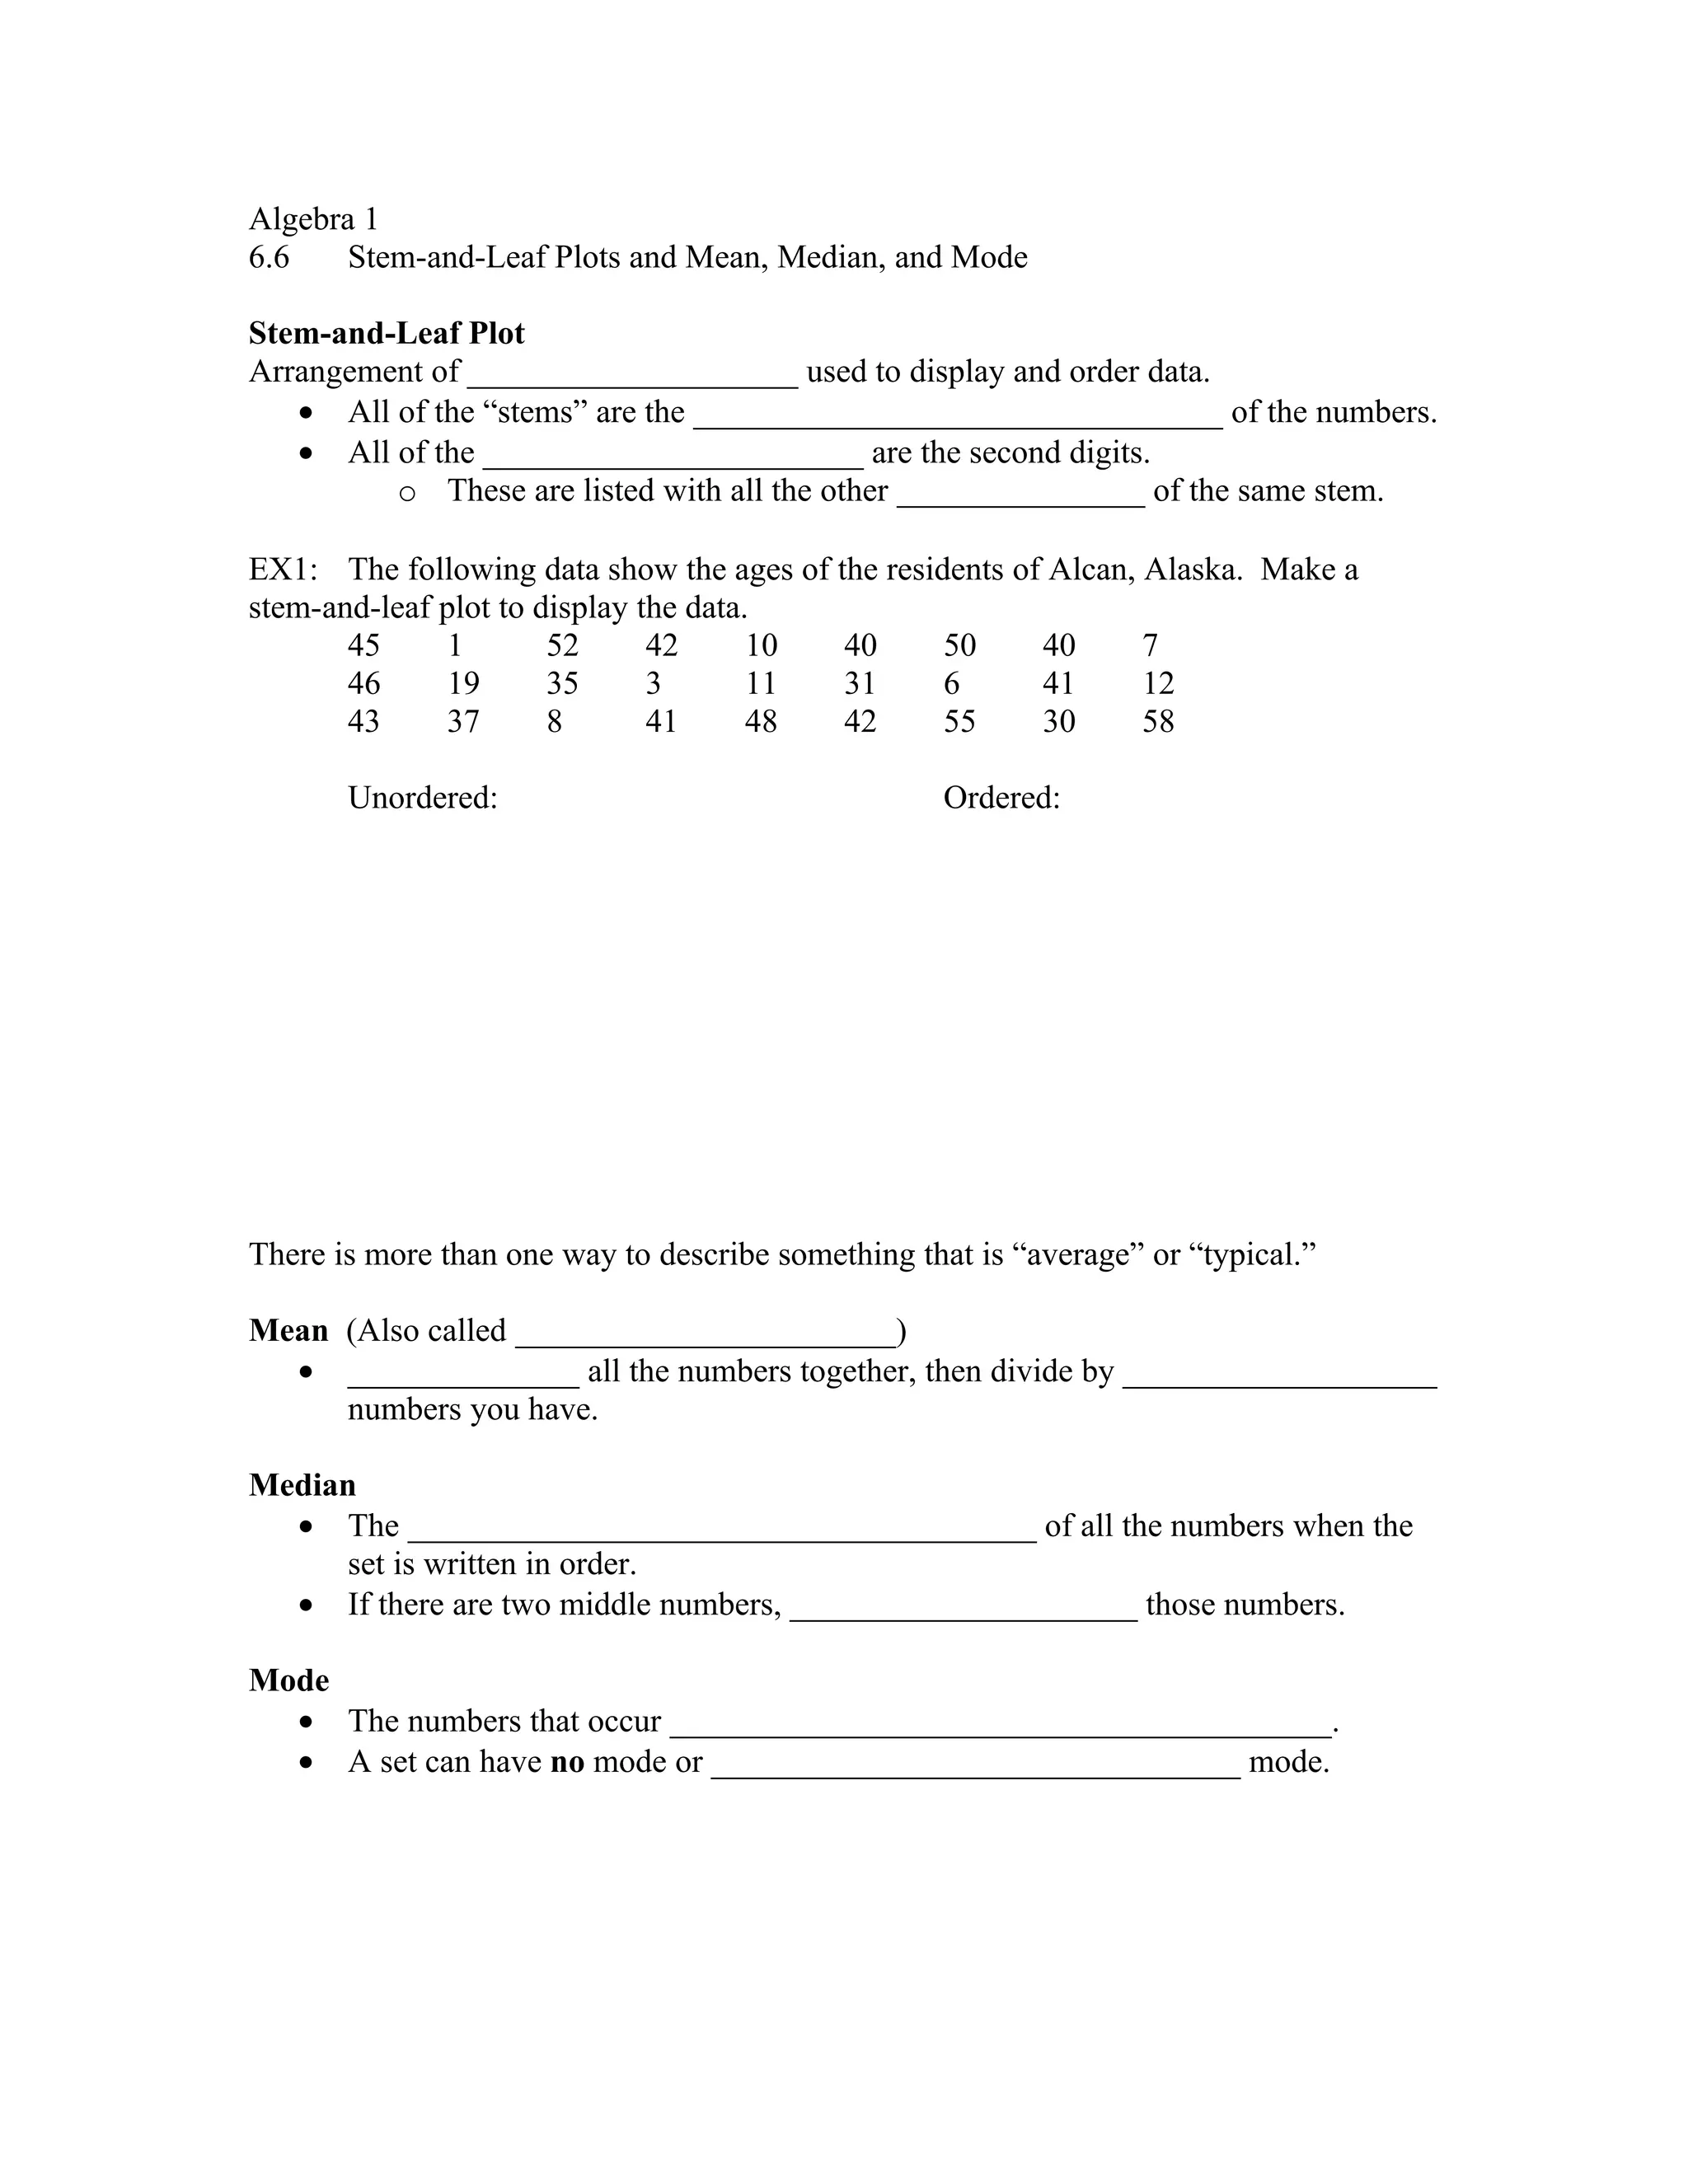
Algebra 1
6.6    Stem-and-Leaf Plots and Mean, Median, and Mode

Stem-and-Leaf Plot
Arrangement of ____________________ used to display and order data.
   • All of the “stems” are the ________________________________ of the numbers.
   • All of the _______________________ are the second digits.
         o These are listed with all the other _______________ of the same stem.

EX1: The following data show the ages of the residents of Alcan, Alaska. Make a
stem-and-leaf plot to display the data.
       45     1        52      42      10 40      50     40      7
       46     19       35      3       11 31      6      41      12
       43     37       8       41      48 42      55     30      58

       Unordered:                                   Ordered:


There is more than one way to describe something that is “average” or “typical.”

Mean (Also called _______________________)
  • ______________ all the numbers together, then divide by ___________________
     numbers you have.

Median
  • The ______________________________________ of all the numbers when the
      set is written in order.
  • If there are two middle numbers, _____________________ those numbers.

Mode
  • The numbers that occur ________________________________________.
  • A set can have no mode or ________________________________ mode.
EX2: Find the (a) mean, (b) median, and (c) mode of the data in Example 1.


EX3: Find the (a) mean, (b) median, and (c) mode of the data represented in the graph.


Sometimes the mean is more ____________________________ of the data. Other times,
especially if the data is very ____________________, the median or the mode is a better
choice.


HW p. 371 (12 – 24 even, 25 – 31 all)

A16-6 Stem&Leaf, Average Notes

  • 1.
    Algebra 1 6.6 Stem-and-Leaf Plots and Mean, Median, and Mode Stem-and-Leaf Plot Arrangement of ____________________ used to display and order data. • All of the “stems” are the ________________________________ of the numbers. • All of the _______________________ are the second digits. o These are listed with all the other _______________ of the same stem. EX1: The following data show the ages of the residents of Alcan, Alaska. Make a stem-and-leaf plot to display the data. 45 1 52 42 10 40 50 40 7 46 19 35 3 11 31 6 41 12 43 37 8 41 48 42 55 30 58 Unordered: Ordered: There is more than one way to describe something that is “average” or “typical.” Mean (Also called _______________________) • ______________ all the numbers together, then divide by ___________________ numbers you have. Median • The ______________________________________ of all the numbers when the set is written in order. • If there are two middle numbers, _____________________ those numbers. Mode • The numbers that occur ________________________________________. • A set can have no mode or ________________________________ mode.
  • 2.
    EX2: Find the(a) mean, (b) median, and (c) mode of the data in Example 1. EX3: Find the (a) mean, (b) median, and (c) mode of the data represented in the graph. Sometimes the mean is more ____________________________ of the data. Other times, especially if the data is very ____________________, the median or the mode is a better choice. HW p. 371 (12 – 24 even, 25 – 31 all)