Download as PDF, PPTX
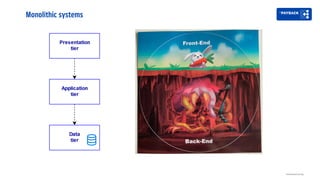
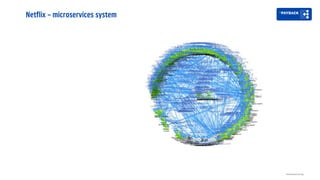

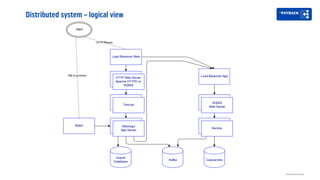


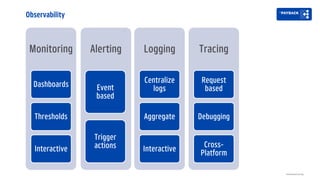
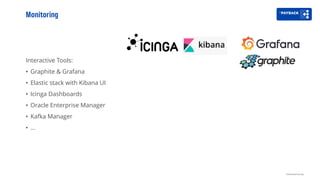
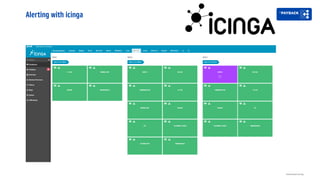
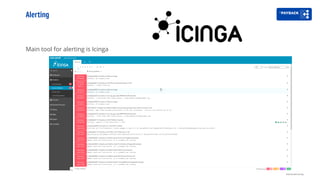
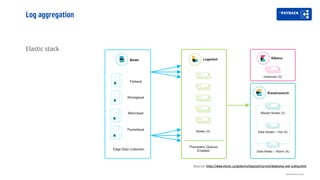
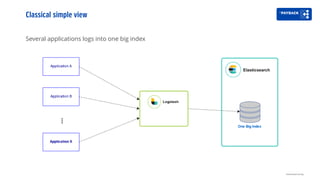
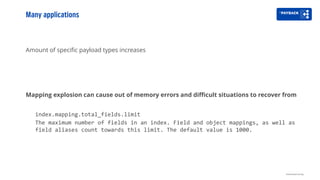
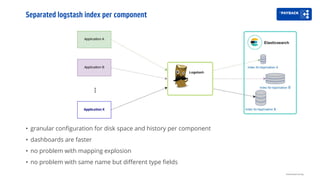
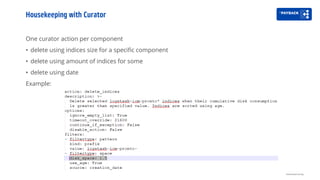


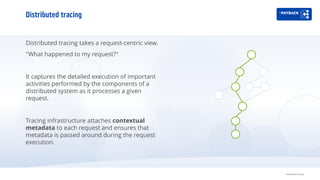
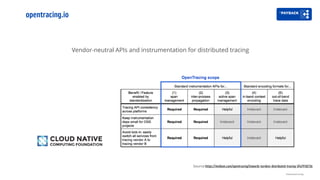
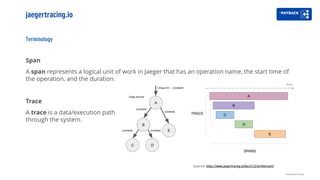
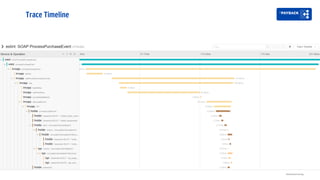
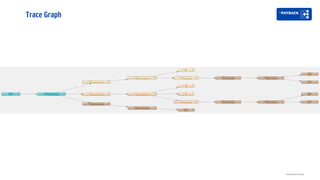
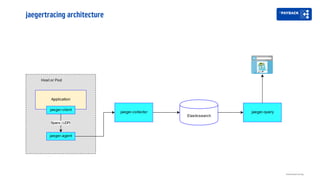


The document discusses distributed systems observability and tracing, emphasizing the need for monitoring tools like the Elastic Stack and Jaeger for effective distributed tracing in microservices architecture. It outlines key concepts such as span, trace, and the use of APIs for instrumentation, along with practical code snippets for implementation. Furthermore, it addresses the challenges of log aggregation and management within distributed systems, highlighting the importance of context and resource management.