SlideShare a Scribd company logo
Hichem Metmer, QingHua Zhao, Chong Ji, Junwei Xiao & Jianfeng Lu
International Journal of Biometrics and Bioinformatics (IJBB), Volume (11) : Issue (1) : 2017 1
Evaluation of Default Mode Network In Mild Cognitive
Impairment and Alzheimer’s Disease Individuals
Hichem Metmer hichemmetmer@qq.com
School of Computer Science and Engineering
Nanjing University of Science and Technology
Nanjing, 210094, Republic of China
QingHua Zhao, Student Member, IEEE qhzhao@njust.edu.cn
School of Computer Science and Engineering
Nanjing University of Science and Technology
Nanjing, 210094, Republic of China
Chong Ji jichong_1993@163.com
School of Computer Science and Engineering
Nanjing University of Science and Technology
Nanjing, 210094, Republic of China
Junwei Xiao junwxiao@163.com
School of Computer Science and Engineering
Nanjing University of Science and Technology
Nanjing, 210094, Republic of China
Jianfeng Lu lujf@njust.edu.cn
Professor, School of Computer Science and Engineering
Nanjing University of Science and Technology
Nanjing, 210094, Republic of China
Abstract
Although progressive functional brain network disorders has been one of the indication of
Alzheimer’s disease, The current research on aging and dementia focus on diagnostics of the
cognitive changes of normal aging and Alzheimer Disease (AD), these changes known as Mild
Cognitive Impairment (MCI). The default mode network (DMN) is a network of interacting brain
regions known to have activity highly correlated with each other and distinct from other networks
in the brain, the default mode network is active during passive rest and consists of a set of brain
areas that are tightly functionally connected and distinct from other systems within the brain.
Anatomically, the DMN includes the posterior cingulated cortex (PCC), dorsal and ventral medial
prefrontal cortex, the lateral parietal cortex, and the medial temporal lobes. DMN involves multiple
anatomical networks that converge on cortical hubs, such as the PCC, ventral medial prefrontal,
and inferior parietal cortices. The aim of this study was to evaluate the default mode network
functional connectivity in MCI patients. While no treatments are recommended for MCI currently,
Mild Cognitive Impairment is becoming a very important subject for researchers and deserves
more recognition and further study, In order to increase the ability to recognize earlier symptoms
of Alzheimer’s disease.
Keywords: Alzheimer’s Disease, Mild Cognitive Impairment, Functional Magnetic Resonance
Imaging, Independent Component Analysis, Default Mode Network.
1. INTRODUCTION
The concept of MCI originally was defined in 1999. The field of aging and dementia is focusing on
the characterization of the earliest stages of cognitive impairment. Recent research had
Hichem Metmer, QingHua Zhao, Chong Ji, Junwei Xiao & Jianfeng Lu
International Journal of Biometrics and Bioinformatics (IJBB), Volume (11) : Issue (1) : 2017 2
indentified a transitional state between the cognitive changes of normal aging and Alzheimer’s
disease, known as Mild Cognitive Impairment (MCI). People diagnosed with MCI may have
different patterns of symptoms and many possible underlying causes. However, only 5 to 10% of
people with MCI will progress to dementia each year. Typically, Mild cognitive impairment is
believed to be a high risk condition for the development of clinically probable AD.
In conjunction with increased attention to the early stages of development of Alzheimer disease
(AD), Most of these studies examined the amnestic subtype of MCI, in which memory impairment
is a key feature. However, other studies, often encompassing a broader definition of MCI, have
demonstrated a reversion to normal in some subjects, implying of stability for the construct over
time. Currently, several approaches and techniques have been used to quantify the different
types of brain connectivity. In this work, we focused on those connectivity derived from functional
Magnetic Resonance Imaging (fMRI): structural connectivity, functional connectivity, and effective
connectivity, Functional MRI has been used to investigate abnormalities in patterns of regional
brain activation during a variety of cognitive tasks in patients diagnosed. It is important to keep in
mind that the abnormalities found in fMRI study of AD or other patient groups are heavily
dependent on the type of behavioral task used in the study.
The nature of functional abnormalities may depend on whether the activated brain regions are
directly affected by the disease, are indirectly affected via connectivity. Analytic and visualization
software tools are now available to directly investigate the overlap of disease-related alterations
in brain structure and task-related functional activity, but further efforts in computational and
visualization software development are essential. It should also be kept in mind that even brain
regions not usually thought to be affected by Alzheimer’s disease have been shown to exhibit
abnormal function in AD patients. Using fMRI, many studies have extensively investigated
functioning and anatomical correlates of the Default mode network (DMN), Default mode network
has received the greatest attention because it contains several regions that support cognitive
functions as well as in neurodegenerative diseases including AD.
Independent component analysis (ICA) is an important signal separation technique. It considered
one of the multivariate techniques that enable the analysis of MRI data in order to extract useful
information about the relationships among the brain substructures for the diagnosis or
classification of Alzheimer’s disease (AD) and Mild Cognitive Impairment (MCI) patients. In the
current study, we have applied Independent component analysis (ICA) based method. The ICA-
based method has three steps. First, all data scans are normalized by statistical parametric
mapping (SPM). Second, ICA is applied to the images for extracting specific neuroimaging
components as potential classifying features. Finally, the separated independent component
among AD, MCI, and control subjects (HC). Our results indicate that the proposed method is able
to classify AD and MCI patients and normal control subjects with certain accuracy.
2. MATERIALS AND METHODS
2.1 Experiment Materials
The data of this study was approved by Alzheimer’s disease Neuroimaging Initiative (ADNI)
http://adni.loni.usc.edu, University of Southern California. One hundred and five individuals
participated in this study: Twenty (20) elderly healthy controls (HC) and Thirty five (35) Mild
Cognitive Impairment (MCI) and Fifty (50) subjects with Alzheimer’s disease (AD). The healthy
control (HC) subjects ranged in age from 65 to 80 (mean age 72.2). The Mild Cognitive
Impairment (MCI) subjects ranged in age from 68 to 85 (mean age 76.7). The Alzheimer’s
disease (AD) subjects ranged in age from 68 to 88 (mean age 77.6). According to the Clinical
Dementia Rating (CDR), Twenty-five (25) of the AD had the rate of 0.7 placing them in (very
mild); the other half of AD had a CDR of 1, classing them to (mild) subjects. The MCI subjects all
had an overall CDR of 0.5. Moreover, All CN subjects received CDR of (0). The three groups
showed significant differences (p < 0.01) in the age, education scores, and MMSE evaluation.
Subjects were evaluated with Mini Mental State Examination (MMSE).
Hichem Metmer, QingHua Zhao, Chong Ji, Junwei Xiao & Jianfeng Lu
International Journal of Biometrics and Bioinformatics (IJBB), Volume (11) : Issue (1) : 2017 3
Table1: Sample characteristics, Age, MMSE Scores and
Education background in ( HC/MCI/AD)
Gender (M/F)
(p = 0.11)a
Age
(p < 0.01)b
MMSE
(p < 0.01)b
Education
(p < 0.01)b
HC
20
25 70.20
(4.20)
30.37
(0.75)
2.20
(1.01)
MCI
35
35 75.80
(5.10)
25.50
(1.50)
2.16
(1.35)
AD
50
70 88.80
(7.20)
38.50
(3.00)
5.60
(3.25)
TABLE 1: Group1, HC (Healthy control), Group2, MCI (Mild Cognitive Impairment), Group3: AD
(Alzheimer’s disease). MMSE: Mini Mental State Examination. Education background: from Elementary
school to High Education. (A/p): Tests values.
2.2 Data Analysis
ICA is a probabilistic and multivariate method for learning a linear transform of random vectors.
The basic goal of ICA is to search for the components which are maximally as independent and
non-Gaussian as possible. It is fundamental difference to classical multivariate statistical methods
such as PCA and linear discriminate analysis (LDA), which ensures the identification of original
components, in comparison with these classical methods. ICA can be mathematically modeled as
X = A × S
Where X is the observed data vector, A is the mixing matrix and S is the source matrix.
FIGURE 1: The methodological framework for analysis of structural MRI data. The rows of the data
matrix X and sources matrix S. The corresponding columns of the mixing matrix A are the time-courses.
In this study, we applied Independent component analysis (ICA) investigating resting-state data,
The data were analyzed with Group ICA of Functional magnetic resonance imaging toolbox
(GIFT) supported by the Medical Image Analysis Laboratory (http://mialab.mrn.org) Implemented
in MATLAB R2014b (Math works). ICA in principle related to principal component analysis and
factor analysis. ICA is a much more powerful and useful technique, however, capable of finding
the underlying factors or sources when these classic methods fail completely. Most recently, ICA
has been used to identify low-frequency neural networks that are active during resting-state
(visual fixation) fMRI data.
Hichem Metmer, QingHua Zhao, Chong Ji, Junwei Xiao & Jianfeng Lu
International Journal of Biometrics and Bioinformatics (IJBB), Volume (11) : Issue (1) : 2017 4
We analyzed output of 50 components data, separately, 10 components from Healthy control
(HC) 15 components from (MCI) and 25 components from (AD). Mild cognitive impairment (MCI)
is a syndrome with cognitive decline greater than expected for an individual’s age and
educational level but not interfering notably with activities of daily living; prevalence of MCI is 15%
in adults older than 65 years; more than half of patients with MCI progress to dementia within 5
years; the amnestic subtype of MCI has a high risk of progression to AD. More specifically, these
Regions including the posterior cingulated, inferior parietal, and medial prefrontal cortex,
constitute a RSN called default mode network (DMN). The areas of the DMN show consistently
greater BOLD activity during rest than during any attention-demanding task, a phenomenon
called deactivation.
FIGURE 2: Default mode network. The DMN includes the medial Prefrontal Cortex (mPFC), Posterior
cingulated cortex (PCC) and anterior cingulated cortex ACC, and the parietal cortex.
In AD subjects, the regions of the DMN altered functional connectivity (FC) at the rest time within
DMN activation. According to these findings, FC at rest-time in individuals at high risk for AD
progression, most previous studies investigating RSNs have used region of-interest (ROI)-based
correlation analyses. The signal time course of a selected ROI is correlated with remaining brain
areas, resulting in a ROI specific correlation map. More recently, the number of studies used
approaches involving independent component analysis (ICA) to describe RSNs in rest-fMRI data.
FIGURE 3: The Default-mode network in healthy elderly and MCI subjects, axial images showing the
default-mode network for the healthy elderly (A) and MCI (B) groups. More specifically, images showing the
default-mode network as detected with regions of interest (ROI) in a group of healthy control (HC). The blue
arrows indicate the posterior parietal cortex (PCC). T score bars are shown at right [1-8.2/1-4.9].
Regions of interest (ROIs) were obtained from these RSN prototypes to compute between-group
differences (HC, MCI, AD). For each, RSN, between-group differences were assessed by means
of Z values obtained from individual ICA group maps.
Hichem Metmer, QingHua Zhao, Chong Ji, Junwei Xiao & Jianfeng Lu
International Journal of Biometrics and Bioinformatics (IJBB), Volume (11) : Issue (1) : 2017 5
Means
Table2: Default-mode network in healthy elderly and
AD subjects (HC, MCI, AD)
Sub. Dynamic
range
Power
(LF/HF)
Peak
Coordinate (mm)
Group
1
001 0.108 0.074 (28.5, -49.5, 17.5)
002 0.067 0.016 ( 30.5, 42.5, -19.5)
003 0.064 0.142 (7.5, -84.5, -19.5)
004 0.000 0.049 (3.5, -36.5, -5.5)
005 0.000 0.040 (42.5,-35.5, 57.5)
Group
2
006 0.040 0.002 (23.5, 50.5, 25.5)
007 0.015 0.044 (11.5, -34.5, -21.5)
008 0.079 0.087 (42.5, -56.5, 50.5)
009 0.041 0.075 (-5.5, -45.5, -34.5)
010 0.002 0.061 (1.5, -61.5, 28.5)
Group
3
011 0.040 0.002 (23.5, 50.5, 25.5)
012 0.015 0.044 (11.5, -34.5, -21.5)
013 0.079 0.087 (42.5, -56.5, 50.5)
014 0.041 0.075 (-5.5, -45.5, -34.5)
015 0.002 0.061 (1.5, -61.5, 28.5)
TABLE 2: Default-mode network in healthy elderly and AD subjects (HC, MCI, and AD): HC (Healthy
control), Group2: MCI (Mild Cognitive Impairment), Group3: AD (Alzheimer’s disease). Each group has five
components [1-5], Dynamic Rang (Power/Frequency), Peak Coordinate (mm).
2.3 fMRI in MCI and AD
Functional Magnetic Resonance Imaging (fMRI) is a useful tool to investigate the modifications in
functional connectivity, also allow the evaluation of brain changes and the progression from
healthy aging to MCI and AD. Many studies have extensively investigated functioning and
anatomical correlates of the Default mode network (DMN). More importantly, with functional
Magnetic Resonance Imaging (fMRI), we investigated resting state network (RSN) activities,
resting state (Rs) fMRI data were analyzed by using Independent Component Analysis (ICA).
Functional MRI has been used to investigate abnormalities in patterns of regional brain activation
during a variety of cognitive tasks in patients diagnosed with AD compared to control subjects. It
is important to keep in mind that the abnormalities found in an fMRI study of an AD or other
patient group are dependent on the type of behavioral task used in the study if the task does not
engage a given brain circuit, functional abnormalities will not likely be observed in that circuit
even if it is affected by the disease. Also, the nature of functional abnormalities may depend on
whether the activated brain regions are directly affected by the disease, are indirectly affected via
connectivity, or are not pathologically affected. Analytic and visualization software tools are now
available to directly investigate the overlap of disease-related alterations in brain structure and
task-related functional activity, but further efforts in computational and visualization software
development are essential. It should also be kept in mind that even brain regions usually not
thought to be affected by AD have been shown to exhibit abnormal function in AD patients.
2.4 Large-scale Brain Networks Supporting Normal Memory Function
Functional neuroimaging has made valuable contributions to the cognitive neuro scientific
investigation of brain networks, overall, multiple fMRI studies using a “subsequent memory”
paradigm have demonstrated that greater fMRI activity during encoding in specific brain regions
is associated with the likelihood of subsequent successful retrieval of the information. Regions
within the prefrontal cortex particularly the left inferior prefrontal cortex and ventral temporal
cortex have consistently demonstrated this subsequent memory effect.
Hichem Metmer, QingHua Zhao, Chong Ji, Junwei Xiao & Jianfeng Lu
International Journal of Biometrics and Bioinformatics (IJBB), Volume (11) : Issue (1) : 2017 6
FIGURE 4: Cortical regions in which activity in increased during successful encoding of new items
(yellow/red) and in which activity in decreased during successful encoding of new items.
2.5 Statistical Analysis
In this study, all the image processing was carried out using SPM8 implemented in MATLAB.
(Version8, Statistical Parametric Mapping, Well-come Trust Centre for Neuroimaging, Institute of
Neurology, UCL, London, UK, http://www.fil.ion.ucl.ac.uk/spm/). Statistical Parametric Mapping, is
a popular neuroimaging analysis software that implements a VBM pipeline thoroughly described
at the theoretical level in Ashburner and Friston (2000, Ashburner and Friston, 2005 and
Ashburner, 2007, and Ashburner and Friston (2009) and at the practical level inAshburner (2010).
In this work, we compared the characteristics of DMN among these three groups (Healthy control,
Mild Cognitive Impairment and Alzheimer’s disease). More important, we investigated the
characteristics of groups in age, gender and educational background. As we mentioned earlier,
for the subgroups of very mild AD (CDR=0.5) and Mild AD (CDR=1).
For group comparisons, the HC and aMCI group, the HC and AD group, as well as the aMCI and
AD group were compared by the variables of age, gender, and education background. All three
groups (HC, MCI, and AD) improved the population over the density. The comparisons showed a
difference among groups over the range of density except 12%–15% (CN compared to MCI) or
14% and 17% (AD compared to MCI).
More specifically, the individual parameters, both AD and MCI group had lower coefficients than
CN over the density. MCI showed significantly lower coefficients than AD at certain densities
(10%, 13%, 17%, and 20%). AD had significantly longer coefficients than MCI at certain densities
(13%, 20%, 25%, and 26%). In subgroup analysis, mild AD subgroup had increased coefficients
and longer coefficients than very mild AD subgroup.
Hichem Metmer, QingHua Zhao, Chong Ji, Junwei Xiao & Jianfeng Lu
International Journal of Biometrics and Bioinformatics (IJBB), Volume (11) : Issue (1) : 2017 7
FIGURE 5: The statistical approach, Diagram (A) from Healthy control, Diagram (B) Cognitively normal
(CN, Black dotted line), Mild Cognitive Impairment (MCI, Blue line) and Alzheimer’s disease (AD, Red line).
Moreover, (A diagram) *p, 0.04 from CN, MCI with density of 19%, 40% and *p, 0.04 from CN, AD with
density of 18%, 30%, *p0.05 from MCI and AD with density of 15%, 20%. (B diagram): **p0.05 CN, MCI with
density of 14%, 22%. AD with clinical dementia rating (CDR=0.5, AD very mild, Red dotted. And AD with
CDR 1 (AD Mild, purple dotted).
3. RESULTS AND DISCUSSION
3.1 Rs-fMRI Evaluation
Resting-state functional magnetic resonance imaging (fMRI) is emerging as an interesting
biomarker for measuring connectivity of the brain in patients with Alzheimer's disease (AD). In
this work, we discuss the origins of resting-state fMRI, common methodologies used to extract
information from these fMRI scans, and important considerations for the analysis of these scans.
Then we present the current state of knowledge in this area by summarizing various AD resting-
state fMRI studies presented in the first section and end with a discussion of future developments
and open questions in the field. The previous studies of Resting State networks (RSN) included
Hichem Metmer, QingHua Zhao, Chong Ji, Junwei Xiao & Jianfeng Lu
International Journal of Biometrics and Bioinformatics (IJBB), Volume (11) : Issue (1) : 2017 8
the Default Mode Network (DMN), the Fronto Parietal Control (FPC) network, Sensory Motor
Network (SMN) and Dorsal Attention Network (DAN), in this study, we analyzed the DMN showed
significant differences between subject groups as well in the classification of DMN in MCI and HC
subjects.
In order to improve the Independent Component Analysis (ICA), we compare the default-mode
network as detected in our previous publication by the ROI approach and as detected here by the
ICA approach. Significant between all the networks including the PCC, bilateral inferior parietal
cortex (IPF), left infer lateral temporal cortex (IFC), medial prefrontal cortex (MPC) and ventral
anterior cingulated cortex (ACC). For each RSN between-group differences were assessed by
means of Z group differences were assessed by means of Z values obtained from individual ICA
group maps Regions of interest (ROIs) were obtained from these RSN prototypes to compute
between-group differences (HC, MCI, AD).
FIGURE 6: Using FastICA, Default-mode network in healthy elderly and AD subjects (HC, MCI, and AD):
HC (Healthy control), Group2: MCI (Mild Cognitive Impairment), Group3: AD (Alzheimer’s disease). Each
group has five components [1-5], Dynamic Rang (Power/Frequency), Peak Coordinate, theses data
investigated by using GIFT MATLAB toolbox.
The MCI group showed significant increased Z values for the DMN. Moreover, the MCI-AD
converted group showed significant increased Z values for the DMN with p < 0.05 corrected for
multiple comparisons. In the case of the DMN, significant increased values of connectivity were
observed in the PCC for the MCI group when compared to the HC group. In the MCI-AD
converted group comparison to HC by showed increased connectivity values in the right, the MCI
group, when compared to HC, showed significant increased connectivity in the right. The MCI-AD
converted group showed increased levels of connectivity compared to other groups of MCI or HC.
Hichem Metmer, QingHua Zhao, Chong Ji, Junwei Xiao & Jianfeng Lu
International Journal of Biometrics and Bioinformatics (IJBB), Volume (11) : Issue (1) : 2017 9
FIGURE 7: Functional network connectivity correlations are computed for each data-set and averaged
across sessions.
3.2 Default Mode Network In MCI and AD
In this paper, our findings could indicate the low connectivity in MCI patients relative to HC and
AD groups in the DMN regions, Including PCC, These findings are generally already fine with
previous DMN studies in MCI and AD. Moreover, we notify the possibility of decrease in
functional connectivity within the DMN in the early stages of AD, specifically, our findings indicate
functional changes in the Default mode network which may precede large brain disorders in
participants likely to progress to AD, and more important, specific regions of the DMN, particularly
the PCC, are selectively vulnerable to early AD. The patients presented increased DMN
connectivity between the medial prefrontal regions and the posterior cingulated. Our findings
suggest that increasing DMN connectivity may contribute to semantic memory deficits in MCI,
Increased DMN connectivity with posterior cingulated.
Task-induced deactivation of the DMN is generally studied with standardized analysis methods,
focusing on decreases in the BOLD signal during experimental conditions compared to control
conditions. In contrast, resting state functional connectivity studies utilize a variety of post-
processing methods. The majority of approaches are model-driven, with strong a priori
hypotheses regarding the functional connectivity between a small brain region (seed) and the rest
of the brain (seed-based analysis). Another often applied technique is independent component
analysis (ICA). With this data-driven technique, the functional connectivity within large-scale
networks can be analyzed.
Hichem Metmer, QingHua Zhao, Chong Ji, Junwei Xiao & Jianfeng Lu
International Journal of Biometrics and Bioinformatics (IJBB), Volume (11) : Issue (1) : 2017 10
FIGURE 8: Cortical representation of Default Mode Network (DMN) in MCI patients and HC.
The MCI group showed significant increased Z values for the DMN. Moreover, the MCI-AD
converted group showed significant increased Z values for the DMN with p < 0.05 corrected for
multiple comparisons. In the case of the DMN, significant increased values of connectivity were
observed in the PCC for the MCI group when compared to the HC group. In the MCI-AD
converted group comparison to HC by showed increased connectivity values in the right, the MCI
group, when compared to HC, showed significant increased connectivity in the right. The MCI-AD
converted group showed increased levels of connectivity compared to other groups of MCI or HC.
3.3 Validation of ICA Approach
In order to improve the Independent Component Analysis (ICA), we compare the default-mode
network as detected in our previous publication by the ROI approach and as detected here by the
ICA approach. Significant between all the networks including the PCC, bilateral inferior parietal
cortex (IPF), left infer lateral temporal cortex (IFC), medial prefrontal cortex (MPC) and ventral
anterior cingulated cortex (ACC). For each RSN between-group differences were assessed by
means of Z group differences were assessed by means of Z values obtained from individual ICA
group maps Regions of interest (ROIs) were obtained from these RSN prototypes to compute
between-group differences (HC, MCI, AD).
4. CONCLUSION
In this study we investigated the evaluation of Default mode network in Mild Cognitive Impairment
and Alzheimer’s disease individual’s healthy elderly and patients with amnestic MCI and AD. By
applying ICA method, and ROI-based correlation analyses, we characterized the RSNs in all
subjects. More important, the study based on the DMN and the executive attention network
showed diminished functional connectivity in patients (HC, MCI, and AD). Functional connectivity
between both HCs and left PCC of the DMN was absent in patients. These results suggest that in
aMCI a selected subset of RSNs is affected by altered functional connectivity.
Mild cognitive impairment has been defined by biological variables with its core characteristics
drawn from concepts of dementia. Other terms describe related clinical and pathological states,
but amnestic mild cognitive impairment relates to a pathological state which differs from normal
ageing, there is objective evidence of memory impairment, and patients are more likely to
develop into Alzheimer’s disease than the normal population. Mild Cognitive Impairment is
becoming a very important subject for researchers and deserves more recognition and further
study in order to increase the ability to recognize earlier symptoms of Alzheimer’s disease. More
research is needed on the biological changes associated with normal aging, MCI, and
Alzheimer's disease and other dementias to better understand the causes of and risk factors for
MCI, as well as the prognosis for those with MCI.
Hichem Metmer, QingHua Zhao, Chong Ji, Junwei Xiao & Jianfeng Lu
International Journal of Biometrics and Bioinformatics (IJBB), Volume (11) : Issue (1) : 2017 11
5. REFERENCES
[1] Roberto Esposito, Alessandra Mosca, Valentina Pieramico, Filippo Cieri, Nicoletta Cera and
Stefano L. Sensi, Characterization of resting state activity in MCI individuals. 2013, 3-4, DOI
10.7717/peerj.135
[2] Jose Angel Pineda-Pardo, Pilar Garces, Maria Eugenia Lopez, Sara Aurtenetxe, Pablo
Cuesta, Alberto Marcos, Pedro Montejo, Miguel Yus, Juan Antonio Hernandez-Tamames,
Francisco del Pozo, James T. Becker, and Fernando Maestu. White Matter Damage
Disorgani.
[3] Ronald C. Petersen, PhD, MD; John C. Morris, MD, Mild Cognitive Impairment as a Clinical
Entity and Treatment Target, 200, 2, ARCH NEUROL/VOL 62, JULY 2005, The American
Medical Association.
[4] Bradford C. Dickerson, Reisa A. Sperling, Large-scale functional brain network
abnormalities in Alzheimer’s disease:Insights from functional neuroimaging, 2009, 5,
Behavioural Neurology 21 (2009) 63–75 63, DOI 10.3233/BEN-2009-0227. IOS Press.
[5] Laia Farràs-Permanyer, Guàrdia-Olmosand, Maribel Peró-Cebollero, Mild cognitive
impairment and fMRI studies of brain functional connectivity: the state of the art, 2015, 3-7,
doi: 10.3389/fpsyg.2015.01095.
[6] Jianchao Yang, Jiangping Wang, and Thomas Huang, LEARNING THE SPARSE
REPRESENTATION FOR CLASSIFICATION, 4.
[7] RC.PE TERSEN, Mild cognitive impairment as a diagnostic entity, 2004, 2-3, 2004
Blackwell.
[8] Eun Hyun Seo, Dong Young Lee, Jong-Min Lee, Jun-Sung Park, Bo Kyung Sohn, Dong Soo
Lee, Young Min Choe, Jong Inn Woo,Whole-brain Functional Networks in Cognitively
Normal, Mild Cognitive Impairment and Alzheimer’s Disease20134-10, 8(1)e53922,
Doi:10.1371/journal.pone.0053922.
[9] The Alzheimer's disease Neuroimaging Initiative: A review of papers published since its
inception, 2013, 47-50, Alzheimer’s Dement. 2013 September; 9(5):e111–
e194.Doi:10.1016/j.
[10] Morris, J. C. (1993) Neurology 43, 2412–2414.11
[11] Rombouts SA, Barkhof F, Goekoop R, Stam CJ, Scheltens P (2005)Hum Brain Mapp
26:231–239.
[12] De Luca M, Beckmann CF, De Stefano N, Matthews PM, Smith SM (2006) NeuroImage
29:1359–1367.
[13] Morris JC, Heyman A, Mohs RC, Hughes JP, van Belle G, Fillenbaum G, Mellits ED, Clark C
(1989) Neurology 39:1159–1165.
[14] Dickerson BC, Salat DH, Greve DN, Chua EF, Rand-Giovannetti E, Rentz DM, Bertram L,
Mullin K, Tanzi RE, Blacker D, et al. (2005) Neurology 65:404– Martin R. Farlow, Sujuan
Gao, Tamiko R. MaGee, Brenna C. McDonald, Darren P. O'Neill, Shannon L. Risacher,
Andrew J. Saykin, Yang Wang, John D. West, Journal of Alzheimer’s disease.
[15] Korf ES, Wahlund LO, Visser PJ, Scheltens P. Medial temporal lobe atrophy on MRI
predicts dementia in patients with mild cognitive impairment. Neurology. 2004;63:94-100.
[16] Petersen RC, ed. Mild Cognitive Impairment: Aging to Alzheimer’s disease. New York, NY:
Oxford University Press.
Hichem Metmer, QingHua Zhao, Chong Ji, Junwei Xiao & Jianfeng Lu
International Journal of Biometrics and Bioinformatics (IJBB), Volume (11) : Issue (1) : 2017 12
[17] Petersen RC, Smith GE, Waring SC, Ivnik RJ, Tangalos EG, Kokmen E. Mild cognitive
impairment: clinical characterization and outcome. Arch Neurol. 1999;56:303-308.
[18] Bookheimer SY, Strojwas MH, Cohen MS, Saunders AM, Pericak-Vance MA, Mazziotta JC,
Small GW. 2000. Patterns of brain activation in people at risk for Alzheimer’s disease. New
England Journal of Medicine 343:450–456 DOI 10.1056/NEJM200008173430701.
[19] Broyd SJ, Demanuele C, Debener S, Helps SK, James CJ, Sonuga-Barke EJ. 2009.
Default-mode brain dysfunction in mental disorders: a systematic review. Neuroscience and
Biobehavioral Reviews 33:279–296 DOI 10.1016/j.neubiorev.2008.09.002.
[20] De Martino F, Gentile F, Esposito F, Balsi M, Di Salle F, Goebel R, Formisano E. 2007.
Classification of fMRI independent components using IC-fingerprints and support vector
machine classifiers. Neuroimage 34(1):177–194DOI .1016/j.neuroimage.2006.08.041.
[21] Larrieu S, Letenneur L, Orgogozo JM, et al. Incidence and outcome of mild cognitive
impairment in a population-based prospective cohort. Neurology. 2002;59:1594-1599.
[22] Morris JC, Storandt M, Miller JP, et al. Mild cognitive impairment represents early-stage
Alzheimer’s disease. Arch Neurol 2000; 58: 397–405.
[23] S.S. Bassett, D.M. Yousem, C. Cristinzio, I. Kusevic, M.A. Yassa, B.S. Caffo and S.L.
Zeger, Familial risk for Alzheimer’s disease alters fMRI activation patterns, Brain 129 (2006),
1229–1239.
[24] Wang, Y., Risacher, S. L., West, J. D., McDonald, B. C., Magee, T. R., Farlow, M. R., et al.
(2013). Altered default mode network connectivity in older adults with cognitive complaints
and amnestic mild cognitive impairment. J. Alzheimers Dis. 35, 751–760, doi: 10.3233/JAD-
130080.
[25] Staffen, W., Ladurner, G., Höller, Y., Bergmann, J., Aichhorn, M., Golaszewski, S., et al.
(2012). Brain activation disturbance for target detection in patients with mild cognitive
impairment: an fMRI study. Neurobiol. Aging 33, 1002, e1–e16. doi:
10.1016/j.neurobiolaging.2011.09.002.
[26] Julien Mairal, Francis Bach, Jean Ponce, and Guillermo Sapiro, “Online learning for matrix
factorization and sparse coding,” Journal of Machine Learning Research, vol. 11, pp. 19–60,
2010.
[27] Jack CR Jr, Petersen RC, Xu YC et al. Prediction of AD with MRI-based hippocampal
volume in mild cognitive impairment. Neurology 1999; 52: 1397–403.
[28] De Luca M, Beckmann CF, De Stefano N, Matthews PM, Smith SM (2006) NeuroImage
29:1359–1367.

More Related Content

What's hot

SEGMENTATION OF MULTIPLE SCLEROSIS LESION IN BRAIN MR IMAGES USING FUZZY C-MEANS
SEGMENTATION OF MULTIPLE SCLEROSIS LESION IN BRAIN MR IMAGES USING FUZZY C-MEANSSEGMENTATION OF MULTIPLE SCLEROSIS LESION IN BRAIN MR IMAGES USING FUZZY C-MEANS
SEGMENTATION OF MULTIPLE SCLEROSIS LESION IN BRAIN MR IMAGES USING FUZZY C-MEANS
ijaia
 
IRJET- A Study on Brain Tumor Detection Algorithms for MRI Images
IRJET- A Study on Brain Tumor Detection Algorithms for MRI ImagesIRJET- A Study on Brain Tumor Detection Algorithms for MRI Images
IRJET- A Study on Brain Tumor Detection Algorithms for MRI Images
IRJET Journal
 
IRJET- A Novel Segmentation Technique for MRI Brain Tumor Images
IRJET- A Novel Segmentation Technique for MRI Brain Tumor ImagesIRJET- A Novel Segmentation Technique for MRI Brain Tumor Images
IRJET- A Novel Segmentation Technique for MRI Brain Tumor Images
IRJET Journal
 
Early detection-of-alzheimers-disease-using-image-processing-ijertv8 is050303
Early detection-of-alzheimers-disease-using-image-processing-ijertv8 is050303Early detection-of-alzheimers-disease-using-image-processing-ijertv8 is050303
Early detection-of-alzheimers-disease-using-image-processing-ijertv8 is050303
Deenadayalan Thanigaimalai
 
An Artificial Neural Network Model for Neonatal Disease Diagnosis
An Artificial Neural Network Model for Neonatal Disease DiagnosisAn Artificial Neural Network Model for Neonatal Disease Diagnosis
An Artificial Neural Network Model for Neonatal Disease Diagnosis
Waqas Tariq
 
Computer Aided Therapeutic of Alzheimer’s Disease Eulogizing Pattern Classifi...
Computer Aided Therapeutic of Alzheimer’s Disease Eulogizing Pattern Classifi...Computer Aided Therapeutic of Alzheimer’s Disease Eulogizing Pattern Classifi...
Computer Aided Therapeutic of Alzheimer’s Disease Eulogizing Pattern Classifi...
DR.P.S.JAGADEESH KUMAR
 
Mri brain tumour detection by histogram and segmentation
Mri brain tumour detection by histogram and segmentationMri brain tumour detection by histogram and segmentation
Mri brain tumour detection by histogram and segmentation
iaemedu
 
Successive iteration method for reconstruction of missing data
Successive iteration method for reconstruction of missing dataSuccessive iteration method for reconstruction of missing data
Successive iteration method for reconstruction of missing data
IAEME Publication
 
Survey of various methods used for integrating machine learning into brain tu...
Survey of various methods used for integrating machine learning into brain tu...Survey of various methods used for integrating machine learning into brain tu...
Survey of various methods used for integrating machine learning into brain tu...
Drjabez
 
IRJET - Machine Learning Applications on Cancer Prognosis and Prediction
IRJET - Machine Learning Applications on Cancer Prognosis and PredictionIRJET - Machine Learning Applications on Cancer Prognosis and Prediction
IRJET - Machine Learning Applications on Cancer Prognosis and Prediction
IRJET Journal
 
Classification of Abnormalities in Brain MRI Images Using PCA and SVM
Classification of Abnormalities in Brain MRI Images Using PCA and SVMClassification of Abnormalities in Brain MRI Images Using PCA and SVM
Classification of Abnormalities in Brain MRI Images Using PCA and SVM
IJERA Editor
 
Review on classification based on artificial
Review on classification based on artificialReview on classification based on artificial
Review on classification based on artificial
ijasa
 
AN EFFICIENT PSO BASED ENSEMBLE CLASSIFICATION MODEL ON HIGH DIMENSIONAL DATA...
AN EFFICIENT PSO BASED ENSEMBLE CLASSIFICATION MODEL ON HIGH DIMENSIONAL DATA...AN EFFICIENT PSO BASED ENSEMBLE CLASSIFICATION MODEL ON HIGH DIMENSIONAL DATA...
AN EFFICIENT PSO BASED ENSEMBLE CLASSIFICATION MODEL ON HIGH DIMENSIONAL DATA...
ijsc
 
Application of Hybrid Genetic Algorithm Using Artificial Neural Network in Da...
Application of Hybrid Genetic Algorithm Using Artificial Neural Network in Da...Application of Hybrid Genetic Algorithm Using Artificial Neural Network in Da...
Application of Hybrid Genetic Algorithm Using Artificial Neural Network in Da...
IOSRjournaljce
 
B042207018
B042207018B042207018
B042207018
ijceronline
 
IRJET- Analysis of Brain Tumor Classification by using Multiple Clustering Al...
IRJET- Analysis of Brain Tumor Classification by using Multiple Clustering Al...IRJET- Analysis of Brain Tumor Classification by using Multiple Clustering Al...
IRJET- Analysis of Brain Tumor Classification by using Multiple Clustering Al...
IRJET Journal
 
Ijetcas14 313
Ijetcas14 313Ijetcas14 313
Ijetcas14 313
Iasir Journals
 
Intelligent algorithms for cell tracking and image segmentation
Intelligent algorithms for cell tracking and image segmentationIntelligent algorithms for cell tracking and image segmentation
Intelligent algorithms for cell tracking and image segmentation
ijcsit
 

What's hot (18)

SEGMENTATION OF MULTIPLE SCLEROSIS LESION IN BRAIN MR IMAGES USING FUZZY C-MEANS
SEGMENTATION OF MULTIPLE SCLEROSIS LESION IN BRAIN MR IMAGES USING FUZZY C-MEANSSEGMENTATION OF MULTIPLE SCLEROSIS LESION IN BRAIN MR IMAGES USING FUZZY C-MEANS
SEGMENTATION OF MULTIPLE SCLEROSIS LESION IN BRAIN MR IMAGES USING FUZZY C-MEANS
 
IRJET- A Study on Brain Tumor Detection Algorithms for MRI Images
IRJET- A Study on Brain Tumor Detection Algorithms for MRI ImagesIRJET- A Study on Brain Tumor Detection Algorithms for MRI Images
IRJET- A Study on Brain Tumor Detection Algorithms for MRI Images
 
IRJET- A Novel Segmentation Technique for MRI Brain Tumor Images
IRJET- A Novel Segmentation Technique for MRI Brain Tumor ImagesIRJET- A Novel Segmentation Technique for MRI Brain Tumor Images
IRJET- A Novel Segmentation Technique for MRI Brain Tumor Images
 
Early detection-of-alzheimers-disease-using-image-processing-ijertv8 is050303
Early detection-of-alzheimers-disease-using-image-processing-ijertv8 is050303Early detection-of-alzheimers-disease-using-image-processing-ijertv8 is050303
Early detection-of-alzheimers-disease-using-image-processing-ijertv8 is050303
 
An Artificial Neural Network Model for Neonatal Disease Diagnosis
An Artificial Neural Network Model for Neonatal Disease DiagnosisAn Artificial Neural Network Model for Neonatal Disease Diagnosis
An Artificial Neural Network Model for Neonatal Disease Diagnosis
 
Computer Aided Therapeutic of Alzheimer’s Disease Eulogizing Pattern Classifi...
Computer Aided Therapeutic of Alzheimer’s Disease Eulogizing Pattern Classifi...Computer Aided Therapeutic of Alzheimer’s Disease Eulogizing Pattern Classifi...
Computer Aided Therapeutic of Alzheimer’s Disease Eulogizing Pattern Classifi...
 
Mri brain tumour detection by histogram and segmentation
Mri brain tumour detection by histogram and segmentationMri brain tumour detection by histogram and segmentation
Mri brain tumour detection by histogram and segmentation
 
Successive iteration method for reconstruction of missing data
Successive iteration method for reconstruction of missing dataSuccessive iteration method for reconstruction of missing data
Successive iteration method for reconstruction of missing data
 
Survey of various methods used for integrating machine learning into brain tu...
Survey of various methods used for integrating machine learning into brain tu...Survey of various methods used for integrating machine learning into brain tu...
Survey of various methods used for integrating machine learning into brain tu...
 
IRJET - Machine Learning Applications on Cancer Prognosis and Prediction
IRJET - Machine Learning Applications on Cancer Prognosis and PredictionIRJET - Machine Learning Applications on Cancer Prognosis and Prediction
IRJET - Machine Learning Applications on Cancer Prognosis and Prediction
 
Classification of Abnormalities in Brain MRI Images Using PCA and SVM
Classification of Abnormalities in Brain MRI Images Using PCA and SVMClassification of Abnormalities in Brain MRI Images Using PCA and SVM
Classification of Abnormalities in Brain MRI Images Using PCA and SVM
 
Review on classification based on artificial
Review on classification based on artificialReview on classification based on artificial
Review on classification based on artificial
 
AN EFFICIENT PSO BASED ENSEMBLE CLASSIFICATION MODEL ON HIGH DIMENSIONAL DATA...
AN EFFICIENT PSO BASED ENSEMBLE CLASSIFICATION MODEL ON HIGH DIMENSIONAL DATA...AN EFFICIENT PSO BASED ENSEMBLE CLASSIFICATION MODEL ON HIGH DIMENSIONAL DATA...
AN EFFICIENT PSO BASED ENSEMBLE CLASSIFICATION MODEL ON HIGH DIMENSIONAL DATA...
 
Application of Hybrid Genetic Algorithm Using Artificial Neural Network in Da...
Application of Hybrid Genetic Algorithm Using Artificial Neural Network in Da...Application of Hybrid Genetic Algorithm Using Artificial Neural Network in Da...
Application of Hybrid Genetic Algorithm Using Artificial Neural Network in Da...
 
B042207018
B042207018B042207018
B042207018
 
IRJET- Analysis of Brain Tumor Classification by using Multiple Clustering Al...
IRJET- Analysis of Brain Tumor Classification by using Multiple Clustering Al...IRJET- Analysis of Brain Tumor Classification by using Multiple Clustering Al...
IRJET- Analysis of Brain Tumor Classification by using Multiple Clustering Al...
 
Ijetcas14 313
Ijetcas14 313Ijetcas14 313
Ijetcas14 313
 
Intelligent algorithms for cell tracking and image segmentation
Intelligent algorithms for cell tracking and image segmentationIntelligent algorithms for cell tracking and image segmentation
Intelligent algorithms for cell tracking and image segmentation
 

Similar to Evaluation of Default Mode Network In Mild Cognitive Impairment and Alzheimer's Disease Individuals

A modified residual network for detection and classification of Alzheimer’s ...
A modified residual network for detection and classification of  Alzheimer’s ...A modified residual network for detection and classification of  Alzheimer’s ...
A modified residual network for detection and classification of Alzheimer’s ...
IJECEIAES
 
A Review On Methods For Feature Extraction And Classification For The Automat...
A Review On Methods For Feature Extraction And Classification For The Automat...A Review On Methods For Feature Extraction And Classification For The Automat...
A Review On Methods For Feature Extraction And Classification For The Automat...
Heather Strinden
 
PauloLMelo_Report_2nd_lab_rotation_ICNAS_IBILI
PauloLMelo_Report_2nd_lab_rotation_ICNAS_IBILIPauloLMelo_Report_2nd_lab_rotation_ICNAS_IBILI
PauloLMelo_Report_2nd_lab_rotation_ICNAS_IBILI
Paulo Melo
 
Hippocampus’s volume calculation on coronal slice’s for strengthening the dia...
Hippocampus’s volume calculation on coronal slice’s for strengthening the dia...Hippocampus’s volume calculation on coronal slice’s for strengthening the dia...
Hippocampus’s volume calculation on coronal slice’s for strengthening the dia...
TELKOMNIKA JOURNAL
 
Convolutional Networks
Convolutional NetworksConvolutional Networks
Convolutional Networks
Nicole Savoie
 
electronics-12-01218.pdf
electronics-12-01218.pdfelectronics-12-01218.pdf
electronics-12-01218.pdf
Khaled Bouazizi
 
IRJET - Detection for Alzheimer’s Disease using Image Processing
IRJET -  	  Detection for Alzheimer’s Disease using Image ProcessingIRJET -  	  Detection for Alzheimer’s Disease using Image Processing
IRJET - Detection for Alzheimer’s Disease using Image Processing
IRJET Journal
 
Alzheimer’s detection through neuro imaging and subsequent fusion for clinica...
Alzheimer’s detection through neuro imaging and subsequent fusion for clinica...Alzheimer’s detection through neuro imaging and subsequent fusion for clinica...
Alzheimer’s detection through neuro imaging and subsequent fusion for clinica...
IJECEIAES
 
ARTIFICIAL NEURAL NETWORKS FOR MEDICAL DIAGNOSIS: A REVIEW OF RECENT TRENDS
ARTIFICIAL NEURAL NETWORKS FOR MEDICAL DIAGNOSIS: A REVIEW OF RECENT TRENDSARTIFICIAL NEURAL NETWORKS FOR MEDICAL DIAGNOSIS: A REVIEW OF RECENT TRENDS
ARTIFICIAL NEURAL NETWORKS FOR MEDICAL DIAGNOSIS: A REVIEW OF RECENT TRENDS
IJCSES Journal
 
Current issues - International Journal of Computer Science and Engineering Su...
Current issues - International Journal of Computer Science and Engineering Su...Current issues - International Journal of Computer Science and Engineering Su...
Current issues - International Journal of Computer Science and Engineering Su...
IJCSES Journal
 
Brain Abnormality Categorization
Brain Abnormality CategorizationBrain Abnormality Categorization
Brain Abnormality Categorization
IRJET Journal
 
Detection of heart pathology using deep learning methods
Detection of heart pathology using deep learning methodsDetection of heart pathology using deep learning methods
Detection of heart pathology using deep learning methods
IJECEIAES
 
Model for autism disorder detection using deep learning
Model for autism disorder detection using deep learningModel for autism disorder detection using deep learning
Model for autism disorder detection using deep learning
IAESIJAI
 
Alzheimer’s diseases classification using YOLOv2 object detection technique
Alzheimer’s diseases classification using YOLOv2 object  detection techniqueAlzheimer’s diseases classification using YOLOv2 object  detection technique
Alzheimer’s diseases classification using YOLOv2 object detection technique
International Journal of Reconfigurable and Embedded Systems
 
Automatic brain tumor detection using adaptive region growing with thresholdi...
Automatic brain tumor detection using adaptive region growing with thresholdi...Automatic brain tumor detection using adaptive region growing with thresholdi...
Automatic brain tumor detection using adaptive region growing with thresholdi...
IAESIJAI
 
Survey on Segmentation Techniques for Spinal Cord Images
Survey on Segmentation Techniques for Spinal Cord ImagesSurvey on Segmentation Techniques for Spinal Cord Images
Survey on Segmentation Techniques for Spinal Cord Images
IIRindia
 
Alzheimer Disease Prediction using Machine Learning Algorithms
Alzheimer Disease Prediction using Machine Learning AlgorithmsAlzheimer Disease Prediction using Machine Learning Algorithms
Alzheimer Disease Prediction using Machine Learning Algorithms
IRJET Journal
 
Deep convolutional neural network framework with multi-modal fusion for Alzhe...
Deep convolutional neural network framework with multi-modal fusion for Alzhe...Deep convolutional neural network framework with multi-modal fusion for Alzhe...
Deep convolutional neural network framework with multi-modal fusion for Alzhe...
International Journal of Reconfigurable and Embedded Systems
 
Image Processing Technique for Brain Abnormality Detection
Image Processing Technique for Brain Abnormality DetectionImage Processing Technique for Brain Abnormality Detection
Image Processing Technique for Brain Abnormality Detection
CSCJournals
 
An effective feature selection using improved marine predators algorithm for ...
An effective feature selection using improved marine predators algorithm for ...An effective feature selection using improved marine predators algorithm for ...
An effective feature selection using improved marine predators algorithm for ...
IJECEIAES
 

Similar to Evaluation of Default Mode Network In Mild Cognitive Impairment and Alzheimer's Disease Individuals (20)

A modified residual network for detection and classification of Alzheimer’s ...
A modified residual network for detection and classification of  Alzheimer’s ...A modified residual network for detection and classification of  Alzheimer’s ...
A modified residual network for detection and classification of Alzheimer’s ...
 
A Review On Methods For Feature Extraction And Classification For The Automat...
A Review On Methods For Feature Extraction And Classification For The Automat...A Review On Methods For Feature Extraction And Classification For The Automat...
A Review On Methods For Feature Extraction And Classification For The Automat...
 
PauloLMelo_Report_2nd_lab_rotation_ICNAS_IBILI
PauloLMelo_Report_2nd_lab_rotation_ICNAS_IBILIPauloLMelo_Report_2nd_lab_rotation_ICNAS_IBILI
PauloLMelo_Report_2nd_lab_rotation_ICNAS_IBILI
 
Hippocampus’s volume calculation on coronal slice’s for strengthening the dia...
Hippocampus’s volume calculation on coronal slice’s for strengthening the dia...Hippocampus’s volume calculation on coronal slice’s for strengthening the dia...
Hippocampus’s volume calculation on coronal slice’s for strengthening the dia...
 
Convolutional Networks
Convolutional NetworksConvolutional Networks
Convolutional Networks
 
electronics-12-01218.pdf
electronics-12-01218.pdfelectronics-12-01218.pdf
electronics-12-01218.pdf
 
IRJET - Detection for Alzheimer’s Disease using Image Processing
IRJET -  	  Detection for Alzheimer’s Disease using Image ProcessingIRJET -  	  Detection for Alzheimer’s Disease using Image Processing
IRJET - Detection for Alzheimer’s Disease using Image Processing
 
Alzheimer’s detection through neuro imaging and subsequent fusion for clinica...
Alzheimer’s detection through neuro imaging and subsequent fusion for clinica...Alzheimer’s detection through neuro imaging and subsequent fusion for clinica...
Alzheimer’s detection through neuro imaging and subsequent fusion for clinica...
 
ARTIFICIAL NEURAL NETWORKS FOR MEDICAL DIAGNOSIS: A REVIEW OF RECENT TRENDS
ARTIFICIAL NEURAL NETWORKS FOR MEDICAL DIAGNOSIS: A REVIEW OF RECENT TRENDSARTIFICIAL NEURAL NETWORKS FOR MEDICAL DIAGNOSIS: A REVIEW OF RECENT TRENDS
ARTIFICIAL NEURAL NETWORKS FOR MEDICAL DIAGNOSIS: A REVIEW OF RECENT TRENDS
 
Current issues - International Journal of Computer Science and Engineering Su...
Current issues - International Journal of Computer Science and Engineering Su...Current issues - International Journal of Computer Science and Engineering Su...
Current issues - International Journal of Computer Science and Engineering Su...
 
Brain Abnormality Categorization
Brain Abnormality CategorizationBrain Abnormality Categorization
Brain Abnormality Categorization
 
Detection of heart pathology using deep learning methods
Detection of heart pathology using deep learning methodsDetection of heart pathology using deep learning methods
Detection of heart pathology using deep learning methods
 
Model for autism disorder detection using deep learning
Model for autism disorder detection using deep learningModel for autism disorder detection using deep learning
Model for autism disorder detection using deep learning
 
Alzheimer’s diseases classification using YOLOv2 object detection technique
Alzheimer’s diseases classification using YOLOv2 object  detection techniqueAlzheimer’s diseases classification using YOLOv2 object  detection technique
Alzheimer’s diseases classification using YOLOv2 object detection technique
 
Automatic brain tumor detection using adaptive region growing with thresholdi...
Automatic brain tumor detection using adaptive region growing with thresholdi...Automatic brain tumor detection using adaptive region growing with thresholdi...
Automatic brain tumor detection using adaptive region growing with thresholdi...
 
Survey on Segmentation Techniques for Spinal Cord Images
Survey on Segmentation Techniques for Spinal Cord ImagesSurvey on Segmentation Techniques for Spinal Cord Images
Survey on Segmentation Techniques for Spinal Cord Images
 
Alzheimer Disease Prediction using Machine Learning Algorithms
Alzheimer Disease Prediction using Machine Learning AlgorithmsAlzheimer Disease Prediction using Machine Learning Algorithms
Alzheimer Disease Prediction using Machine Learning Algorithms
 
Deep convolutional neural network framework with multi-modal fusion for Alzhe...
Deep convolutional neural network framework with multi-modal fusion for Alzhe...Deep convolutional neural network framework with multi-modal fusion for Alzhe...
Deep convolutional neural network framework with multi-modal fusion for Alzhe...
 
Image Processing Technique for Brain Abnormality Detection
Image Processing Technique for Brain Abnormality DetectionImage Processing Technique for Brain Abnormality Detection
Image Processing Technique for Brain Abnormality Detection
 
An effective feature selection using improved marine predators algorithm for ...
An effective feature selection using improved marine predators algorithm for ...An effective feature selection using improved marine predators algorithm for ...
An effective feature selection using improved marine predators algorithm for ...
 

Recently uploaded

The basics of sentences session 6pptx.pptx
The basics of sentences session 6pptx.pptxThe basics of sentences session 6pptx.pptx
The basics of sentences session 6pptx.pptx
heathfieldcps1
 
Digital Artefact 1 - Tiny Home Environmental Design
Digital Artefact 1 - Tiny Home Environmental DesignDigital Artefact 1 - Tiny Home Environmental Design
Digital Artefact 1 - Tiny Home Environmental Design
amberjdewit93
 
Lapbook sobre os Regimes Totalitários.pdf
Lapbook sobre os Regimes Totalitários.pdfLapbook sobre os Regimes Totalitários.pdf
Lapbook sobre os Regimes Totalitários.pdf
Jean Carlos Nunes Paixão
 
Introduction to AI for Nonprofits with Tapp Network
Introduction to AI for Nonprofits with Tapp NetworkIntroduction to AI for Nonprofits with Tapp Network
Introduction to AI for Nonprofits with Tapp Network
TechSoup
 
Digital Artifact 1 - 10VCD Environments Unit
Digital Artifact 1 - 10VCD Environments UnitDigital Artifact 1 - 10VCD Environments Unit
Digital Artifact 1 - 10VCD Environments Unit
chanes7
 
PCOS corelations and management through Ayurveda.
PCOS corelations and management through Ayurveda.PCOS corelations and management through Ayurveda.
PCOS corelations and management through Ayurveda.
Dr. Shivangi Singh Parihar
 
World environment day ppt For 5 June 2024
World environment day ppt For 5 June 2024World environment day ppt For 5 June 2024
World environment day ppt For 5 June 2024
ak6969907
 
Film vocab for eal 3 students: Australia the movie
Film vocab for eal 3 students: Australia the movieFilm vocab for eal 3 students: Australia the movie
Film vocab for eal 3 students: Australia the movie
Nicholas Montgomery
 
MARY JANE WILSON, A “BOA MÃE” .
MARY JANE WILSON, A “BOA MÃE”           .MARY JANE WILSON, A “BOA MÃE”           .
MARY JANE WILSON, A “BOA MÃE” .
Colégio Santa Teresinha
 
C1 Rubenstein AP HuG xxxxxxxxxxxxxx.pptx
C1 Rubenstein AP HuG xxxxxxxxxxxxxx.pptxC1 Rubenstein AP HuG xxxxxxxxxxxxxx.pptx
C1 Rubenstein AP HuG xxxxxxxxxxxxxx.pptx
mulvey2
 
How to Build a Module in Odoo 17 Using the Scaffold Method
How to Build a Module in Odoo 17 Using the Scaffold MethodHow to Build a Module in Odoo 17 Using the Scaffold Method
How to Build a Module in Odoo 17 Using the Scaffold Method
Celine George
 
South African Journal of Science: Writing with integrity workshop (2024)
South African Journal of Science: Writing with integrity workshop (2024)South African Journal of Science: Writing with integrity workshop (2024)
South African Journal of Science: Writing with integrity workshop (2024)
Academy of Science of South Africa
 
S1-Introduction-Biopesticides in ICM.pptx
S1-Introduction-Biopesticides in ICM.pptxS1-Introduction-Biopesticides in ICM.pptx
S1-Introduction-Biopesticides in ICM.pptx
tarandeep35
 
RPMS TEMPLATE FOR SCHOOL YEAR 2023-2024 FOR TEACHER 1 TO TEACHER 3
RPMS TEMPLATE FOR SCHOOL YEAR 2023-2024 FOR TEACHER 1 TO TEACHER 3RPMS TEMPLATE FOR SCHOOL YEAR 2023-2024 FOR TEACHER 1 TO TEACHER 3
RPMS TEMPLATE FOR SCHOOL YEAR 2023-2024 FOR TEACHER 1 TO TEACHER 3
IreneSebastianRueco1
 
How to Fix the Import Error in the Odoo 17
How to Fix the Import Error in the Odoo 17How to Fix the Import Error in the Odoo 17
How to Fix the Import Error in the Odoo 17
Celine George
 
Hindi varnamala | hindi alphabet PPT.pdf
Hindi varnamala | hindi alphabet PPT.pdfHindi varnamala | hindi alphabet PPT.pdf
Hindi varnamala | hindi alphabet PPT.pdf
Dr. Mulla Adam Ali
 
The Diamonds of 2023-2024 in the IGRA collection
The Diamonds of 2023-2024 in the IGRA collectionThe Diamonds of 2023-2024 in the IGRA collection
The Diamonds of 2023-2024 in the IGRA collection
Israel Genealogy Research Association
 
How to Add Chatter in the odoo 17 ERP Module
How to Add Chatter in the odoo 17 ERP ModuleHow to Add Chatter in the odoo 17 ERP Module
How to Add Chatter in the odoo 17 ERP Module
Celine George
 
Chapter 4 - Islamic Financial Institutions in Malaysia.pptx
Chapter 4 - Islamic Financial Institutions in Malaysia.pptxChapter 4 - Islamic Financial Institutions in Malaysia.pptx
Chapter 4 - Islamic Financial Institutions in Malaysia.pptx
Mohd Adib Abd Muin, Senior Lecturer at Universiti Utara Malaysia
 
Your Skill Boost Masterclass: Strategies for Effective Upskilling
Your Skill Boost Masterclass: Strategies for Effective UpskillingYour Skill Boost Masterclass: Strategies for Effective Upskilling
Your Skill Boost Masterclass: Strategies for Effective Upskilling
Excellence Foundation for South Sudan
 

Recently uploaded (20)

The basics of sentences session 6pptx.pptx
The basics of sentences session 6pptx.pptxThe basics of sentences session 6pptx.pptx
The basics of sentences session 6pptx.pptx
 
Digital Artefact 1 - Tiny Home Environmental Design
Digital Artefact 1 - Tiny Home Environmental DesignDigital Artefact 1 - Tiny Home Environmental Design
Digital Artefact 1 - Tiny Home Environmental Design
 
Lapbook sobre os Regimes Totalitários.pdf
Lapbook sobre os Regimes Totalitários.pdfLapbook sobre os Regimes Totalitários.pdf
Lapbook sobre os Regimes Totalitários.pdf
 
Introduction to AI for Nonprofits with Tapp Network
Introduction to AI for Nonprofits with Tapp NetworkIntroduction to AI for Nonprofits with Tapp Network
Introduction to AI for Nonprofits with Tapp Network
 
Digital Artifact 1 - 10VCD Environments Unit
Digital Artifact 1 - 10VCD Environments UnitDigital Artifact 1 - 10VCD Environments Unit
Digital Artifact 1 - 10VCD Environments Unit
 
PCOS corelations and management through Ayurveda.
PCOS corelations and management through Ayurveda.PCOS corelations and management through Ayurveda.
PCOS corelations and management through Ayurveda.
 
World environment day ppt For 5 June 2024
World environment day ppt For 5 June 2024World environment day ppt For 5 June 2024
World environment day ppt For 5 June 2024
 
Film vocab for eal 3 students: Australia the movie
Film vocab for eal 3 students: Australia the movieFilm vocab for eal 3 students: Australia the movie
Film vocab for eal 3 students: Australia the movie
 
MARY JANE WILSON, A “BOA MÃE” .
MARY JANE WILSON, A “BOA MÃE”           .MARY JANE WILSON, A “BOA MÃE”           .
MARY JANE WILSON, A “BOA MÃE” .
 
C1 Rubenstein AP HuG xxxxxxxxxxxxxx.pptx
C1 Rubenstein AP HuG xxxxxxxxxxxxxx.pptxC1 Rubenstein AP HuG xxxxxxxxxxxxxx.pptx
C1 Rubenstein AP HuG xxxxxxxxxxxxxx.pptx
 
How to Build a Module in Odoo 17 Using the Scaffold Method
How to Build a Module in Odoo 17 Using the Scaffold MethodHow to Build a Module in Odoo 17 Using the Scaffold Method
How to Build a Module in Odoo 17 Using the Scaffold Method
 
South African Journal of Science: Writing with integrity workshop (2024)
South African Journal of Science: Writing with integrity workshop (2024)South African Journal of Science: Writing with integrity workshop (2024)
South African Journal of Science: Writing with integrity workshop (2024)
 
S1-Introduction-Biopesticides in ICM.pptx
S1-Introduction-Biopesticides in ICM.pptxS1-Introduction-Biopesticides in ICM.pptx
S1-Introduction-Biopesticides in ICM.pptx
 
RPMS TEMPLATE FOR SCHOOL YEAR 2023-2024 FOR TEACHER 1 TO TEACHER 3
RPMS TEMPLATE FOR SCHOOL YEAR 2023-2024 FOR TEACHER 1 TO TEACHER 3RPMS TEMPLATE FOR SCHOOL YEAR 2023-2024 FOR TEACHER 1 TO TEACHER 3
RPMS TEMPLATE FOR SCHOOL YEAR 2023-2024 FOR TEACHER 1 TO TEACHER 3
 
How to Fix the Import Error in the Odoo 17
How to Fix the Import Error in the Odoo 17How to Fix the Import Error in the Odoo 17
How to Fix the Import Error in the Odoo 17
 
Hindi varnamala | hindi alphabet PPT.pdf
Hindi varnamala | hindi alphabet PPT.pdfHindi varnamala | hindi alphabet PPT.pdf
Hindi varnamala | hindi alphabet PPT.pdf
 
The Diamonds of 2023-2024 in the IGRA collection
The Diamonds of 2023-2024 in the IGRA collectionThe Diamonds of 2023-2024 in the IGRA collection
The Diamonds of 2023-2024 in the IGRA collection
 
How to Add Chatter in the odoo 17 ERP Module
How to Add Chatter in the odoo 17 ERP ModuleHow to Add Chatter in the odoo 17 ERP Module
How to Add Chatter in the odoo 17 ERP Module
 
Chapter 4 - Islamic Financial Institutions in Malaysia.pptx
Chapter 4 - Islamic Financial Institutions in Malaysia.pptxChapter 4 - Islamic Financial Institutions in Malaysia.pptx
Chapter 4 - Islamic Financial Institutions in Malaysia.pptx
 
Your Skill Boost Masterclass: Strategies for Effective Upskilling
Your Skill Boost Masterclass: Strategies for Effective UpskillingYour Skill Boost Masterclass: Strategies for Effective Upskilling
Your Skill Boost Masterclass: Strategies for Effective Upskilling
 

Evaluation of Default Mode Network In Mild Cognitive Impairment and Alzheimer's Disease Individuals

  • 1. Hichem Metmer, QingHua Zhao, Chong Ji, Junwei Xiao & Jianfeng Lu International Journal of Biometrics and Bioinformatics (IJBB), Volume (11) : Issue (1) : 2017 1 Evaluation of Default Mode Network In Mild Cognitive Impairment and Alzheimer’s Disease Individuals Hichem Metmer hichemmetmer@qq.com School of Computer Science and Engineering Nanjing University of Science and Technology Nanjing, 210094, Republic of China QingHua Zhao, Student Member, IEEE qhzhao@njust.edu.cn School of Computer Science and Engineering Nanjing University of Science and Technology Nanjing, 210094, Republic of China Chong Ji jichong_1993@163.com School of Computer Science and Engineering Nanjing University of Science and Technology Nanjing, 210094, Republic of China Junwei Xiao junwxiao@163.com School of Computer Science and Engineering Nanjing University of Science and Technology Nanjing, 210094, Republic of China Jianfeng Lu lujf@njust.edu.cn Professor, School of Computer Science and Engineering Nanjing University of Science and Technology Nanjing, 210094, Republic of China Abstract Although progressive functional brain network disorders has been one of the indication of Alzheimer’s disease, The current research on aging and dementia focus on diagnostics of the cognitive changes of normal aging and Alzheimer Disease (AD), these changes known as Mild Cognitive Impairment (MCI). The default mode network (DMN) is a network of interacting brain regions known to have activity highly correlated with each other and distinct from other networks in the brain, the default mode network is active during passive rest and consists of a set of brain areas that are tightly functionally connected and distinct from other systems within the brain. Anatomically, the DMN includes the posterior cingulated cortex (PCC), dorsal and ventral medial prefrontal cortex, the lateral parietal cortex, and the medial temporal lobes. DMN involves multiple anatomical networks that converge on cortical hubs, such as the PCC, ventral medial prefrontal, and inferior parietal cortices. The aim of this study was to evaluate the default mode network functional connectivity in MCI patients. While no treatments are recommended for MCI currently, Mild Cognitive Impairment is becoming a very important subject for researchers and deserves more recognition and further study, In order to increase the ability to recognize earlier symptoms of Alzheimer’s disease. Keywords: Alzheimer’s Disease, Mild Cognitive Impairment, Functional Magnetic Resonance Imaging, Independent Component Analysis, Default Mode Network. 1. INTRODUCTION The concept of MCI originally was defined in 1999. The field of aging and dementia is focusing on the characterization of the earliest stages of cognitive impairment. Recent research had
  • 2. Hichem Metmer, QingHua Zhao, Chong Ji, Junwei Xiao & Jianfeng Lu International Journal of Biometrics and Bioinformatics (IJBB), Volume (11) : Issue (1) : 2017 2 indentified a transitional state between the cognitive changes of normal aging and Alzheimer’s disease, known as Mild Cognitive Impairment (MCI). People diagnosed with MCI may have different patterns of symptoms and many possible underlying causes. However, only 5 to 10% of people with MCI will progress to dementia each year. Typically, Mild cognitive impairment is believed to be a high risk condition for the development of clinically probable AD. In conjunction with increased attention to the early stages of development of Alzheimer disease (AD), Most of these studies examined the amnestic subtype of MCI, in which memory impairment is a key feature. However, other studies, often encompassing a broader definition of MCI, have demonstrated a reversion to normal in some subjects, implying of stability for the construct over time. Currently, several approaches and techniques have been used to quantify the different types of brain connectivity. In this work, we focused on those connectivity derived from functional Magnetic Resonance Imaging (fMRI): structural connectivity, functional connectivity, and effective connectivity, Functional MRI has been used to investigate abnormalities in patterns of regional brain activation during a variety of cognitive tasks in patients diagnosed. It is important to keep in mind that the abnormalities found in fMRI study of AD or other patient groups are heavily dependent on the type of behavioral task used in the study. The nature of functional abnormalities may depend on whether the activated brain regions are directly affected by the disease, are indirectly affected via connectivity. Analytic and visualization software tools are now available to directly investigate the overlap of disease-related alterations in brain structure and task-related functional activity, but further efforts in computational and visualization software development are essential. It should also be kept in mind that even brain regions not usually thought to be affected by Alzheimer’s disease have been shown to exhibit abnormal function in AD patients. Using fMRI, many studies have extensively investigated functioning and anatomical correlates of the Default mode network (DMN), Default mode network has received the greatest attention because it contains several regions that support cognitive functions as well as in neurodegenerative diseases including AD. Independent component analysis (ICA) is an important signal separation technique. It considered one of the multivariate techniques that enable the analysis of MRI data in order to extract useful information about the relationships among the brain substructures for the diagnosis or classification of Alzheimer’s disease (AD) and Mild Cognitive Impairment (MCI) patients. In the current study, we have applied Independent component analysis (ICA) based method. The ICA- based method has three steps. First, all data scans are normalized by statistical parametric mapping (SPM). Second, ICA is applied to the images for extracting specific neuroimaging components as potential classifying features. Finally, the separated independent component among AD, MCI, and control subjects (HC). Our results indicate that the proposed method is able to classify AD and MCI patients and normal control subjects with certain accuracy. 2. MATERIALS AND METHODS 2.1 Experiment Materials The data of this study was approved by Alzheimer’s disease Neuroimaging Initiative (ADNI) http://adni.loni.usc.edu, University of Southern California. One hundred and five individuals participated in this study: Twenty (20) elderly healthy controls (HC) and Thirty five (35) Mild Cognitive Impairment (MCI) and Fifty (50) subjects with Alzheimer’s disease (AD). The healthy control (HC) subjects ranged in age from 65 to 80 (mean age 72.2). The Mild Cognitive Impairment (MCI) subjects ranged in age from 68 to 85 (mean age 76.7). The Alzheimer’s disease (AD) subjects ranged in age from 68 to 88 (mean age 77.6). According to the Clinical Dementia Rating (CDR), Twenty-five (25) of the AD had the rate of 0.7 placing them in (very mild); the other half of AD had a CDR of 1, classing them to (mild) subjects. The MCI subjects all had an overall CDR of 0.5. Moreover, All CN subjects received CDR of (0). The three groups showed significant differences (p < 0.01) in the age, education scores, and MMSE evaluation. Subjects were evaluated with Mini Mental State Examination (MMSE).
  • 3. Hichem Metmer, QingHua Zhao, Chong Ji, Junwei Xiao & Jianfeng Lu International Journal of Biometrics and Bioinformatics (IJBB), Volume (11) : Issue (1) : 2017 3 Table1: Sample characteristics, Age, MMSE Scores and Education background in ( HC/MCI/AD) Gender (M/F) (p = 0.11)a Age (p < 0.01)b MMSE (p < 0.01)b Education (p < 0.01)b HC 20 25 70.20 (4.20) 30.37 (0.75) 2.20 (1.01) MCI 35 35 75.80 (5.10) 25.50 (1.50) 2.16 (1.35) AD 50 70 88.80 (7.20) 38.50 (3.00) 5.60 (3.25) TABLE 1: Group1, HC (Healthy control), Group2, MCI (Mild Cognitive Impairment), Group3: AD (Alzheimer’s disease). MMSE: Mini Mental State Examination. Education background: from Elementary school to High Education. (A/p): Tests values. 2.2 Data Analysis ICA is a probabilistic and multivariate method for learning a linear transform of random vectors. The basic goal of ICA is to search for the components which are maximally as independent and non-Gaussian as possible. It is fundamental difference to classical multivariate statistical methods such as PCA and linear discriminate analysis (LDA), which ensures the identification of original components, in comparison with these classical methods. ICA can be mathematically modeled as X = A × S Where X is the observed data vector, A is the mixing matrix and S is the source matrix. FIGURE 1: The methodological framework for analysis of structural MRI data. The rows of the data matrix X and sources matrix S. The corresponding columns of the mixing matrix A are the time-courses. In this study, we applied Independent component analysis (ICA) investigating resting-state data, The data were analyzed with Group ICA of Functional magnetic resonance imaging toolbox (GIFT) supported by the Medical Image Analysis Laboratory (http://mialab.mrn.org) Implemented in MATLAB R2014b (Math works). ICA in principle related to principal component analysis and factor analysis. ICA is a much more powerful and useful technique, however, capable of finding the underlying factors or sources when these classic methods fail completely. Most recently, ICA has been used to identify low-frequency neural networks that are active during resting-state (visual fixation) fMRI data.
  • 4. Hichem Metmer, QingHua Zhao, Chong Ji, Junwei Xiao & Jianfeng Lu International Journal of Biometrics and Bioinformatics (IJBB), Volume (11) : Issue (1) : 2017 4 We analyzed output of 50 components data, separately, 10 components from Healthy control (HC) 15 components from (MCI) and 25 components from (AD). Mild cognitive impairment (MCI) is a syndrome with cognitive decline greater than expected for an individual’s age and educational level but not interfering notably with activities of daily living; prevalence of MCI is 15% in adults older than 65 years; more than half of patients with MCI progress to dementia within 5 years; the amnestic subtype of MCI has a high risk of progression to AD. More specifically, these Regions including the posterior cingulated, inferior parietal, and medial prefrontal cortex, constitute a RSN called default mode network (DMN). The areas of the DMN show consistently greater BOLD activity during rest than during any attention-demanding task, a phenomenon called deactivation. FIGURE 2: Default mode network. The DMN includes the medial Prefrontal Cortex (mPFC), Posterior cingulated cortex (PCC) and anterior cingulated cortex ACC, and the parietal cortex. In AD subjects, the regions of the DMN altered functional connectivity (FC) at the rest time within DMN activation. According to these findings, FC at rest-time in individuals at high risk for AD progression, most previous studies investigating RSNs have used region of-interest (ROI)-based correlation analyses. The signal time course of a selected ROI is correlated with remaining brain areas, resulting in a ROI specific correlation map. More recently, the number of studies used approaches involving independent component analysis (ICA) to describe RSNs in rest-fMRI data. FIGURE 3: The Default-mode network in healthy elderly and MCI subjects, axial images showing the default-mode network for the healthy elderly (A) and MCI (B) groups. More specifically, images showing the default-mode network as detected with regions of interest (ROI) in a group of healthy control (HC). The blue arrows indicate the posterior parietal cortex (PCC). T score bars are shown at right [1-8.2/1-4.9]. Regions of interest (ROIs) were obtained from these RSN prototypes to compute between-group differences (HC, MCI, AD). For each, RSN, between-group differences were assessed by means of Z values obtained from individual ICA group maps.
  • 5. Hichem Metmer, QingHua Zhao, Chong Ji, Junwei Xiao & Jianfeng Lu International Journal of Biometrics and Bioinformatics (IJBB), Volume (11) : Issue (1) : 2017 5 Means Table2: Default-mode network in healthy elderly and AD subjects (HC, MCI, AD) Sub. Dynamic range Power (LF/HF) Peak Coordinate (mm) Group 1 001 0.108 0.074 (28.5, -49.5, 17.5) 002 0.067 0.016 ( 30.5, 42.5, -19.5) 003 0.064 0.142 (7.5, -84.5, -19.5) 004 0.000 0.049 (3.5, -36.5, -5.5) 005 0.000 0.040 (42.5,-35.5, 57.5) Group 2 006 0.040 0.002 (23.5, 50.5, 25.5) 007 0.015 0.044 (11.5, -34.5, -21.5) 008 0.079 0.087 (42.5, -56.5, 50.5) 009 0.041 0.075 (-5.5, -45.5, -34.5) 010 0.002 0.061 (1.5, -61.5, 28.5) Group 3 011 0.040 0.002 (23.5, 50.5, 25.5) 012 0.015 0.044 (11.5, -34.5, -21.5) 013 0.079 0.087 (42.5, -56.5, 50.5) 014 0.041 0.075 (-5.5, -45.5, -34.5) 015 0.002 0.061 (1.5, -61.5, 28.5) TABLE 2: Default-mode network in healthy elderly and AD subjects (HC, MCI, and AD): HC (Healthy control), Group2: MCI (Mild Cognitive Impairment), Group3: AD (Alzheimer’s disease). Each group has five components [1-5], Dynamic Rang (Power/Frequency), Peak Coordinate (mm). 2.3 fMRI in MCI and AD Functional Magnetic Resonance Imaging (fMRI) is a useful tool to investigate the modifications in functional connectivity, also allow the evaluation of brain changes and the progression from healthy aging to MCI and AD. Many studies have extensively investigated functioning and anatomical correlates of the Default mode network (DMN). More importantly, with functional Magnetic Resonance Imaging (fMRI), we investigated resting state network (RSN) activities, resting state (Rs) fMRI data were analyzed by using Independent Component Analysis (ICA). Functional MRI has been used to investigate abnormalities in patterns of regional brain activation during a variety of cognitive tasks in patients diagnosed with AD compared to control subjects. It is important to keep in mind that the abnormalities found in an fMRI study of an AD or other patient group are dependent on the type of behavioral task used in the study if the task does not engage a given brain circuit, functional abnormalities will not likely be observed in that circuit even if it is affected by the disease. Also, the nature of functional abnormalities may depend on whether the activated brain regions are directly affected by the disease, are indirectly affected via connectivity, or are not pathologically affected. Analytic and visualization software tools are now available to directly investigate the overlap of disease-related alterations in brain structure and task-related functional activity, but further efforts in computational and visualization software development are essential. It should also be kept in mind that even brain regions usually not thought to be affected by AD have been shown to exhibit abnormal function in AD patients. 2.4 Large-scale Brain Networks Supporting Normal Memory Function Functional neuroimaging has made valuable contributions to the cognitive neuro scientific investigation of brain networks, overall, multiple fMRI studies using a “subsequent memory” paradigm have demonstrated that greater fMRI activity during encoding in specific brain regions is associated with the likelihood of subsequent successful retrieval of the information. Regions within the prefrontal cortex particularly the left inferior prefrontal cortex and ventral temporal cortex have consistently demonstrated this subsequent memory effect.
  • 6. Hichem Metmer, QingHua Zhao, Chong Ji, Junwei Xiao & Jianfeng Lu International Journal of Biometrics and Bioinformatics (IJBB), Volume (11) : Issue (1) : 2017 6 FIGURE 4: Cortical regions in which activity in increased during successful encoding of new items (yellow/red) and in which activity in decreased during successful encoding of new items. 2.5 Statistical Analysis In this study, all the image processing was carried out using SPM8 implemented in MATLAB. (Version8, Statistical Parametric Mapping, Well-come Trust Centre for Neuroimaging, Institute of Neurology, UCL, London, UK, http://www.fil.ion.ucl.ac.uk/spm/). Statistical Parametric Mapping, is a popular neuroimaging analysis software that implements a VBM pipeline thoroughly described at the theoretical level in Ashburner and Friston (2000, Ashburner and Friston, 2005 and Ashburner, 2007, and Ashburner and Friston (2009) and at the practical level inAshburner (2010). In this work, we compared the characteristics of DMN among these three groups (Healthy control, Mild Cognitive Impairment and Alzheimer’s disease). More important, we investigated the characteristics of groups in age, gender and educational background. As we mentioned earlier, for the subgroups of very mild AD (CDR=0.5) and Mild AD (CDR=1). For group comparisons, the HC and aMCI group, the HC and AD group, as well as the aMCI and AD group were compared by the variables of age, gender, and education background. All three groups (HC, MCI, and AD) improved the population over the density. The comparisons showed a difference among groups over the range of density except 12%–15% (CN compared to MCI) or 14% and 17% (AD compared to MCI). More specifically, the individual parameters, both AD and MCI group had lower coefficients than CN over the density. MCI showed significantly lower coefficients than AD at certain densities (10%, 13%, 17%, and 20%). AD had significantly longer coefficients than MCI at certain densities (13%, 20%, 25%, and 26%). In subgroup analysis, mild AD subgroup had increased coefficients and longer coefficients than very mild AD subgroup.
  • 7. Hichem Metmer, QingHua Zhao, Chong Ji, Junwei Xiao & Jianfeng Lu International Journal of Biometrics and Bioinformatics (IJBB), Volume (11) : Issue (1) : 2017 7 FIGURE 5: The statistical approach, Diagram (A) from Healthy control, Diagram (B) Cognitively normal (CN, Black dotted line), Mild Cognitive Impairment (MCI, Blue line) and Alzheimer’s disease (AD, Red line). Moreover, (A diagram) *p, 0.04 from CN, MCI with density of 19%, 40% and *p, 0.04 from CN, AD with density of 18%, 30%, *p0.05 from MCI and AD with density of 15%, 20%. (B diagram): **p0.05 CN, MCI with density of 14%, 22%. AD with clinical dementia rating (CDR=0.5, AD very mild, Red dotted. And AD with CDR 1 (AD Mild, purple dotted). 3. RESULTS AND DISCUSSION 3.1 Rs-fMRI Evaluation Resting-state functional magnetic resonance imaging (fMRI) is emerging as an interesting biomarker for measuring connectivity of the brain in patients with Alzheimer's disease (AD). In this work, we discuss the origins of resting-state fMRI, common methodologies used to extract information from these fMRI scans, and important considerations for the analysis of these scans. Then we present the current state of knowledge in this area by summarizing various AD resting- state fMRI studies presented in the first section and end with a discussion of future developments and open questions in the field. The previous studies of Resting State networks (RSN) included
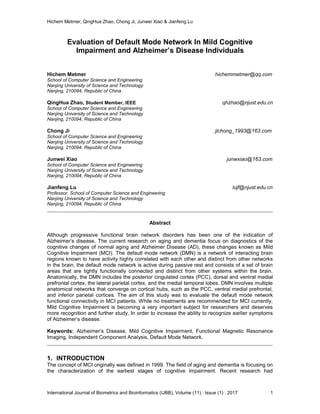
  • 8. Hichem Metmer, QingHua Zhao, Chong Ji, Junwei Xiao & Jianfeng Lu International Journal of Biometrics and Bioinformatics (IJBB), Volume (11) : Issue (1) : 2017 8 the Default Mode Network (DMN), the Fronto Parietal Control (FPC) network, Sensory Motor Network (SMN) and Dorsal Attention Network (DAN), in this study, we analyzed the DMN showed significant differences between subject groups as well in the classification of DMN in MCI and HC subjects. In order to improve the Independent Component Analysis (ICA), we compare the default-mode network as detected in our previous publication by the ROI approach and as detected here by the ICA approach. Significant between all the networks including the PCC, bilateral inferior parietal cortex (IPF), left infer lateral temporal cortex (IFC), medial prefrontal cortex (MPC) and ventral anterior cingulated cortex (ACC). For each RSN between-group differences were assessed by means of Z group differences were assessed by means of Z values obtained from individual ICA group maps Regions of interest (ROIs) were obtained from these RSN prototypes to compute between-group differences (HC, MCI, AD). FIGURE 6: Using FastICA, Default-mode network in healthy elderly and AD subjects (HC, MCI, and AD): HC (Healthy control), Group2: MCI (Mild Cognitive Impairment), Group3: AD (Alzheimer’s disease). Each group has five components [1-5], Dynamic Rang (Power/Frequency), Peak Coordinate, theses data investigated by using GIFT MATLAB toolbox. The MCI group showed significant increased Z values for the DMN. Moreover, the MCI-AD converted group showed significant increased Z values for the DMN with p < 0.05 corrected for multiple comparisons. In the case of the DMN, significant increased values of connectivity were observed in the PCC for the MCI group when compared to the HC group. In the MCI-AD converted group comparison to HC by showed increased connectivity values in the right, the MCI group, when compared to HC, showed significant increased connectivity in the right. The MCI-AD converted group showed increased levels of connectivity compared to other groups of MCI or HC.
  • 9. Hichem Metmer, QingHua Zhao, Chong Ji, Junwei Xiao & Jianfeng Lu International Journal of Biometrics and Bioinformatics (IJBB), Volume (11) : Issue (1) : 2017 9 FIGURE 7: Functional network connectivity correlations are computed for each data-set and averaged across sessions. 3.2 Default Mode Network In MCI and AD In this paper, our findings could indicate the low connectivity in MCI patients relative to HC and AD groups in the DMN regions, Including PCC, These findings are generally already fine with previous DMN studies in MCI and AD. Moreover, we notify the possibility of decrease in functional connectivity within the DMN in the early stages of AD, specifically, our findings indicate functional changes in the Default mode network which may precede large brain disorders in participants likely to progress to AD, and more important, specific regions of the DMN, particularly the PCC, are selectively vulnerable to early AD. The patients presented increased DMN connectivity between the medial prefrontal regions and the posterior cingulated. Our findings suggest that increasing DMN connectivity may contribute to semantic memory deficits in MCI, Increased DMN connectivity with posterior cingulated. Task-induced deactivation of the DMN is generally studied with standardized analysis methods, focusing on decreases in the BOLD signal during experimental conditions compared to control conditions. In contrast, resting state functional connectivity studies utilize a variety of post- processing methods. The majority of approaches are model-driven, with strong a priori hypotheses regarding the functional connectivity between a small brain region (seed) and the rest of the brain (seed-based analysis). Another often applied technique is independent component analysis (ICA). With this data-driven technique, the functional connectivity within large-scale networks can be analyzed.
  • 10. Hichem Metmer, QingHua Zhao, Chong Ji, Junwei Xiao & Jianfeng Lu International Journal of Biometrics and Bioinformatics (IJBB), Volume (11) : Issue (1) : 2017 10 FIGURE 8: Cortical representation of Default Mode Network (DMN) in MCI patients and HC. The MCI group showed significant increased Z values for the DMN. Moreover, the MCI-AD converted group showed significant increased Z values for the DMN with p < 0.05 corrected for multiple comparisons. In the case of the DMN, significant increased values of connectivity were observed in the PCC for the MCI group when compared to the HC group. In the MCI-AD converted group comparison to HC by showed increased connectivity values in the right, the MCI group, when compared to HC, showed significant increased connectivity in the right. The MCI-AD converted group showed increased levels of connectivity compared to other groups of MCI or HC. 3.3 Validation of ICA Approach In order to improve the Independent Component Analysis (ICA), we compare the default-mode network as detected in our previous publication by the ROI approach and as detected here by the ICA approach. Significant between all the networks including the PCC, bilateral inferior parietal cortex (IPF), left infer lateral temporal cortex (IFC), medial prefrontal cortex (MPC) and ventral anterior cingulated cortex (ACC). For each RSN between-group differences were assessed by means of Z group differences were assessed by means of Z values obtained from individual ICA group maps Regions of interest (ROIs) were obtained from these RSN prototypes to compute between-group differences (HC, MCI, AD). 4. CONCLUSION In this study we investigated the evaluation of Default mode network in Mild Cognitive Impairment and Alzheimer’s disease individual’s healthy elderly and patients with amnestic MCI and AD. By applying ICA method, and ROI-based correlation analyses, we characterized the RSNs in all subjects. More important, the study based on the DMN and the executive attention network showed diminished functional connectivity in patients (HC, MCI, and AD). Functional connectivity between both HCs and left PCC of the DMN was absent in patients. These results suggest that in aMCI a selected subset of RSNs is affected by altered functional connectivity. Mild cognitive impairment has been defined by biological variables with its core characteristics drawn from concepts of dementia. Other terms describe related clinical and pathological states, but amnestic mild cognitive impairment relates to a pathological state which differs from normal ageing, there is objective evidence of memory impairment, and patients are more likely to develop into Alzheimer’s disease than the normal population. Mild Cognitive Impairment is becoming a very important subject for researchers and deserves more recognition and further study in order to increase the ability to recognize earlier symptoms of Alzheimer’s disease. More research is needed on the biological changes associated with normal aging, MCI, and Alzheimer's disease and other dementias to better understand the causes of and risk factors for MCI, as well as the prognosis for those with MCI.
  • 11. Hichem Metmer, QingHua Zhao, Chong Ji, Junwei Xiao & Jianfeng Lu International Journal of Biometrics and Bioinformatics (IJBB), Volume (11) : Issue (1) : 2017 11 5. REFERENCES [1] Roberto Esposito, Alessandra Mosca, Valentina Pieramico, Filippo Cieri, Nicoletta Cera and Stefano L. Sensi, Characterization of resting state activity in MCI individuals. 2013, 3-4, DOI 10.7717/peerj.135 [2] Jose Angel Pineda-Pardo, Pilar Garces, Maria Eugenia Lopez, Sara Aurtenetxe, Pablo Cuesta, Alberto Marcos, Pedro Montejo, Miguel Yus, Juan Antonio Hernandez-Tamames, Francisco del Pozo, James T. Becker, and Fernando Maestu. White Matter Damage Disorgani. [3] Ronald C. Petersen, PhD, MD; John C. Morris, MD, Mild Cognitive Impairment as a Clinical Entity and Treatment Target, 200, 2, ARCH NEUROL/VOL 62, JULY 2005, The American Medical Association. [4] Bradford C. Dickerson, Reisa A. Sperling, Large-scale functional brain network abnormalities in Alzheimer’s disease:Insights from functional neuroimaging, 2009, 5, Behavioural Neurology 21 (2009) 63–75 63, DOI 10.3233/BEN-2009-0227. IOS Press. [5] Laia Farràs-Permanyer, Guàrdia-Olmosand, Maribel Peró-Cebollero, Mild cognitive impairment and fMRI studies of brain functional connectivity: the state of the art, 2015, 3-7, doi: 10.3389/fpsyg.2015.01095. [6] Jianchao Yang, Jiangping Wang, and Thomas Huang, LEARNING THE SPARSE REPRESENTATION FOR CLASSIFICATION, 4. [7] RC.PE TERSEN, Mild cognitive impairment as a diagnostic entity, 2004, 2-3, 2004 Blackwell. [8] Eun Hyun Seo, Dong Young Lee, Jong-Min Lee, Jun-Sung Park, Bo Kyung Sohn, Dong Soo Lee, Young Min Choe, Jong Inn Woo,Whole-brain Functional Networks in Cognitively Normal, Mild Cognitive Impairment and Alzheimer’s Disease20134-10, 8(1)e53922, Doi:10.1371/journal.pone.0053922. [9] The Alzheimer's disease Neuroimaging Initiative: A review of papers published since its inception, 2013, 47-50, Alzheimer’s Dement. 2013 September; 9(5):e111– e194.Doi:10.1016/j. [10] Morris, J. C. (1993) Neurology 43, 2412–2414.11 [11] Rombouts SA, Barkhof F, Goekoop R, Stam CJ, Scheltens P (2005)Hum Brain Mapp 26:231–239. [12] De Luca M, Beckmann CF, De Stefano N, Matthews PM, Smith SM (2006) NeuroImage 29:1359–1367. [13] Morris JC, Heyman A, Mohs RC, Hughes JP, van Belle G, Fillenbaum G, Mellits ED, Clark C (1989) Neurology 39:1159–1165. [14] Dickerson BC, Salat DH, Greve DN, Chua EF, Rand-Giovannetti E, Rentz DM, Bertram L, Mullin K, Tanzi RE, Blacker D, et al. (2005) Neurology 65:404– Martin R. Farlow, Sujuan Gao, Tamiko R. MaGee, Brenna C. McDonald, Darren P. O'Neill, Shannon L. Risacher, Andrew J. Saykin, Yang Wang, John D. West, Journal of Alzheimer’s disease. [15] Korf ES, Wahlund LO, Visser PJ, Scheltens P. Medial temporal lobe atrophy on MRI predicts dementia in patients with mild cognitive impairment. Neurology. 2004;63:94-100. [16] Petersen RC, ed. Mild Cognitive Impairment: Aging to Alzheimer’s disease. New York, NY: Oxford University Press.
  • 12. Hichem Metmer, QingHua Zhao, Chong Ji, Junwei Xiao & Jianfeng Lu International Journal of Biometrics and Bioinformatics (IJBB), Volume (11) : Issue (1) : 2017 12 [17] Petersen RC, Smith GE, Waring SC, Ivnik RJ, Tangalos EG, Kokmen E. Mild cognitive impairment: clinical characterization and outcome. Arch Neurol. 1999;56:303-308. [18] Bookheimer SY, Strojwas MH, Cohen MS, Saunders AM, Pericak-Vance MA, Mazziotta JC, Small GW. 2000. Patterns of brain activation in people at risk for Alzheimer’s disease. New England Journal of Medicine 343:450–456 DOI 10.1056/NEJM200008173430701. [19] Broyd SJ, Demanuele C, Debener S, Helps SK, James CJ, Sonuga-Barke EJ. 2009. Default-mode brain dysfunction in mental disorders: a systematic review. Neuroscience and Biobehavioral Reviews 33:279–296 DOI 10.1016/j.neubiorev.2008.09.002. [20] De Martino F, Gentile F, Esposito F, Balsi M, Di Salle F, Goebel R, Formisano E. 2007. Classification of fMRI independent components using IC-fingerprints and support vector machine classifiers. Neuroimage 34(1):177–194DOI .1016/j.neuroimage.2006.08.041. [21] Larrieu S, Letenneur L, Orgogozo JM, et al. Incidence and outcome of mild cognitive impairment in a population-based prospective cohort. Neurology. 2002;59:1594-1599. [22] Morris JC, Storandt M, Miller JP, et al. Mild cognitive impairment represents early-stage Alzheimer’s disease. Arch Neurol 2000; 58: 397–405. [23] S.S. Bassett, D.M. Yousem, C. Cristinzio, I. Kusevic, M.A. Yassa, B.S. Caffo and S.L. Zeger, Familial risk for Alzheimer’s disease alters fMRI activation patterns, Brain 129 (2006), 1229–1239. [24] Wang, Y., Risacher, S. L., West, J. D., McDonald, B. C., Magee, T. R., Farlow, M. R., et al. (2013). Altered default mode network connectivity in older adults with cognitive complaints and amnestic mild cognitive impairment. J. Alzheimers Dis. 35, 751–760, doi: 10.3233/JAD- 130080. [25] Staffen, W., Ladurner, G., Höller, Y., Bergmann, J., Aichhorn, M., Golaszewski, S., et al. (2012). Brain activation disturbance for target detection in patients with mild cognitive impairment: an fMRI study. Neurobiol. Aging 33, 1002, e1–e16. doi: 10.1016/j.neurobiolaging.2011.09.002. [26] Julien Mairal, Francis Bach, Jean Ponce, and Guillermo Sapiro, “Online learning for matrix factorization and sparse coding,” Journal of Machine Learning Research, vol. 11, pp. 19–60, 2010. [27] Jack CR Jr, Petersen RC, Xu YC et al. Prediction of AD with MRI-based hippocampal volume in mild cognitive impairment. Neurology 1999; 52: 1397–403. [28] De Luca M, Beckmann CF, De Stefano N, Matthews PM, Smith SM (2006) NeuroImage 29:1359–1367.