Download as PDF, PPTX

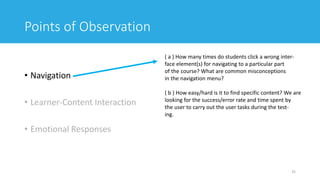
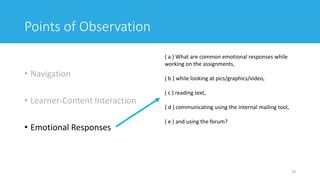
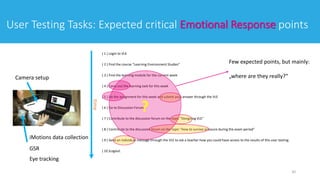
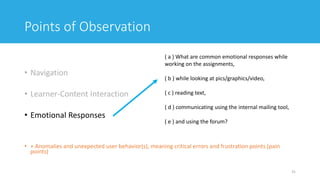
![Introduction: Teachers‘ Motivation and Design
• LMS/VLE are used by: students and teachers
• Teachers are users AND designers
• Two seperate kinds of motivation and motivation showstoppers
• How do they evaluate their own design?
3
3 defining factors for teachers‘ motivation:
Human factors (most often related to skills, attitudes, opinions and
confidence)
Intrinsic values (including satisfaction, level of interest, joy and
entertainment)
Requirements towards the tool itself (including usability, interactivity
level, monitor progress, specialization, adaptability, and learning
requirements)[1]](https://image.slidesharecdn.com/awajishimaschulz2019-191212043143/85/Evaluating-the-User-Experience-of-Virtual-Learning-Environments-Using-Biometric-Data-Experimental-Setup-Description-and-Preparation-3-320.jpg)
![Introduction: HCD and Design for Teachers
• Human-centred Design for VLEs (as usbale interactive systems)
4
[ISO 9141 – 210]](https://image.slidesharecdn.com/awajishimaschulz2019-191212043143/85/Evaluating-the-User-Experience-of-Virtual-Learning-Environments-Using-Biometric-Data-Experimental-Setup-Description-and-Preparation-4-320.jpg)
![Introduction: HCD and Design for Teachers
• Human-centred Design for VLEs (as usbale interactive systems)
5
[ISO 9141 – 210]
This research project
mostly operates on
testing and evaluation
based on the existing
system and different
teachers‘ designs](https://image.slidesharecdn.com/awajishimaschulz2019-191212043143/85/Evaluating-the-User-Experience-of-Virtual-Learning-Environments-Using-Biometric-Data-Experimental-Setup-Description-and-Preparation-5-320.jpg)
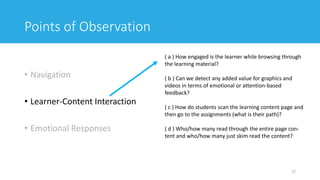
![Introduction
• Task Design
• Gamification and (game) task design
• Intrinsic and extrinsic motivation
7
Graphics used and produced for [2]](https://image.slidesharecdn.com/awajishimaschulz2019-191212043143/85/Evaluating-the-User-Experience-of-Virtual-Learning-Environments-Using-Biometric-Data-Experimental-Setup-Description-and-Preparation-7-320.jpg)


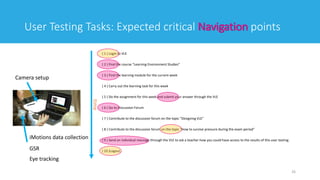
![16
Methods and Setup: Usability Laboratory
[One of the usability laboratories at University of Agder.]](https://image.slidesharecdn.com/awajishimaschulz2019-191212043143/85/Evaluating-the-User-Experience-of-Virtual-Learning-Environments-Using-Biometric-Data-Experimental-Setup-Description-and-Preparation-16-320.jpg)
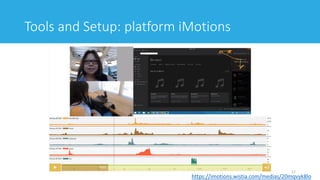
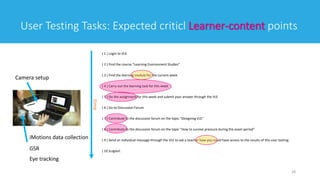
![Tools and Setup
• Shimmmer3 GSR+ (Galvanic Skin Response)
• Optical Pulse Sensing Probe (Finger)
• Optical pulse sensors (Earlobe)
• GSR+ Electrodes (x2)
• Biophysical 9" leads (x2)
• 1x Wrist Strap
• Applications
• GSR+ can be used for:
• Affective Computing and Cognitive Factors Research
• Stress Detection and Analysis
• Emotional Engagement
• Psychological Arousal (Mental Effort, Excitement, Shock)
• Relaxation Training and Psychotherapy
18[http://www.shimmersensing.com/products/shimmer3-wireless-gsr-sensor]](https://image.slidesharecdn.com/awajishimaschulz2019-191212043143/85/Evaluating-the-User-Experience-of-Virtual-Learning-Environments-Using-Biometric-Data-Experimental-Setup-Description-and-Preparation-18-320.jpg)
![• The galvanic skin response (GSR, which falls under the umbrella term of
electrodermal activity, or EDA) refers to changes in sweat gland activity that are
reflective of the intensity of our emotional state, otherwise known as emotional
arousal.
• … measuring of the continuous variations in the electrical characteristics of
the skin, i.e. for instance the conductance, caused by the variation of the human
body sweating.
19[https://www.brainsigns.com/en/science/s2/technologies/gsr]
Tools and Setup](https://image.slidesharecdn.com/awajishimaschulz2019-191212043143/85/Evaluating-the-User-Experience-of-Virtual-Learning-Environments-Using-Biometric-Data-Experimental-Setup-Description-and-Preparation-19-320.jpg)
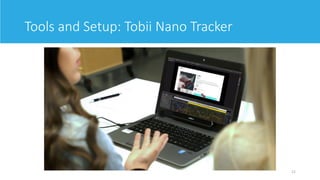
![Tools and Setup
Tobii Nano Eye Tracker allows for further analysis on:
“Advanced analytic tools for screen-based multimedia”
• Stimuli (images, videos, websites, games, software interfaces and 3D environments
• Individual and aggregate gaze replays
• Static and dynamic areas of interest (AOIs), manual and semi-automated options
• Automated metrics such as time to first fixation, time spent, ratio, revisits, fixation count, mouse
clicks, key-strokes etc.
• Static and dynamic heatmaps
• Raw data including X,Y coordinates of eye position,
• pupil size, and distance to the screen
• Automated gaze mapping on websites, both on screen and mobile phones for fast and automatic
analysis
20
[https://www.tobiipro.com/de/produkte/tobii-pro-nano/]](https://image.slidesharecdn.com/awajishimaschulz2019-191212043143/85/Evaluating-the-User-Experience-of-Virtual-Learning-Environments-Using-Biometric-Data-Experimental-Setup-Description-and-Preparation-20-320.jpg)
![Tools and Setup
• Affectiva AFFDEX
„facial coding: understand users’ unfiltered responses & a
wide range of emotional responses “
• Measures 7 emotions and 20 facial expressions; filter by
demo and survey data.
• Seamlessly integrates with your survey and research
methodology; works with any panel provider.
• Easy to use SaaS solution; all you need is a standard webcam
and internet connectivity.
• Norms to benchmark the effectiveness of your content by
geography, product category, media length and repeat view
22
[https://www.affectiva.com/product/affdex-for-market-research/]](https://image.slidesharecdn.com/awajishimaschulz2019-191212043143/85/Evaluating-the-User-Experience-of-Virtual-Learning-Environments-Using-Biometric-Data-Experimental-Setup-Description-and-Preparation-22-320.jpg)
![Tools and Setup
Why Eye Tracking?
• Diagnosis of problem areas
• A/B testing: quntifiable data to prove better permorming areas
• Benchmarking of experiences up against competition
• Measure non-verbalized emotions and Feelings
• Understand visual attention and cognitive states
23
[iMotions UX Brochure]](https://image.slidesharecdn.com/awajishimaschulz2019-191212043143/85/Evaluating-the-User-Experience-of-Virtual-Learning-Environments-Using-Biometric-Data-Experimental-Setup-Description-and-Preparation-23-320.jpg)


![References
[1] Schulz, R., Isabwe, G. M., & Reichert, F. (2015, September). Investigating teachers’ motivation to use ICT
tools in higher education. In 2015 Internet Technologies and Applications (ITA) (pp. 62-67). IEEE.
[2] Schulz, R. P. (2017). Listening to Teachers’ Needs: Human-centred Design for Mobile Technology in Higher
Education. Doctoral dissertations at University of Agder.
43](https://image.slidesharecdn.com/awajishimaschulz2019-191212043143/85/Evaluating-the-User-Experience-of-Virtual-Learning-Environments-Using-Biometric-Data-Experimental-Setup-Description-and-Preparation-43-320.jpg)

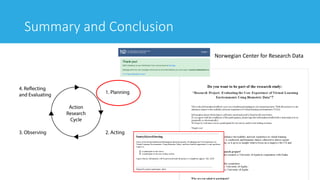
The document discusses a collaborative research project between Norway and Japan that evaluates user experience in virtual learning environments (VLEs) utilizing biometric data. It outlines research questions related to emotional satisfaction and engagement, describes the methods and tools used for data collection, and emphasizes the importance of human-centered design in enhancing the usability of learning systems. The study aims to quickly adapt and improve educational designs based on user feedback gathered through testing in various learning courses.


![[Poster] Towards a Game-Design Framework for Evidence-based Clinical Procedur...](https://cdn.slidesharecdn.com/ss_thumbnails/posterfinal-190810090058-thumbnail.jpg?width=640&height=640&fit=bounds)


