Economic indicators
•
1 like•443 views

After a promising start to a decade in 2012-11 with achievement like GDP growth of 8.4% but in 2011-12 GDP growth decelerated sharply to a nine year low of 6.5%. since, then Indian economy is facing a downward trends due to various reasons. A brief report is prepared by us in layman's language showing how Indian economy is moving and what are it's impact.

Recommended
Recommended
More Related Content
What's hot
What's hot (20)
Similar to Economic indicators
Similar to Economic indicators (20)
Recently uploaded
Recently uploaded (20)
Economic indicators
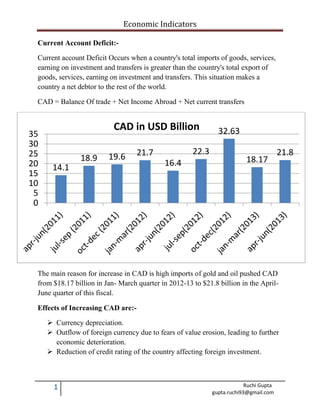
- 1. Economic Indicators 1 Ruchi Gupta gupta.ruchi93@gmail.com Current Account Deficit:- Current account Deficit Occurs when a country's total imports of goods, services, earning on investment and transfers is greater than the country's total export of goods, services, earning on investment and transfers. This situation makes a country a net debtor to the rest of the world. CAD = Balance Of trade + Net Income Abroad + Net current transfers The main reason for increase in CAD is high imports of gold and oil pushed CAD from $18.17 billion in Jan- March quarter in 2012-13 to $21.8 billion in the April- June quarter of this fiscal. Effects of Increasing CAD are:- Currency depreciation. Outflow of foreign currency due to fears of value erosion, leading to further economic deterioration. Reduction of credit rating of the country affecting foreign investment. 14.1 18.9 19.6 21.7 16.4 22.3 32.63 18.17 21.8 0 5 10 15 20 25 30 35 CAD in USD Billion
- 2. Economic Indicators 2 Ruchi Gupta gupta.ruchi93@gmail.com Foreign Exchange Reserve:- Foreign Exchange Reserves also known as Official Reserves and International Reserves are the foreign assets held or controlled by RBI. The reserves themselves can either be gold or a specific currency like the dollar or the euro. They can also be special drawing rights and marketable securities denominated in foreign currencies like treasury bills, government bonds, corporate bonds and equities and foreign currency loans. The reserves are generally used to finance the balance of payments imbalances or to control exchange rates. 295.3 288.2 289.9 288.6 290.4 294.8 295.2 294.5 296.5 295.7 291.9 292.6 296.3 287.8 284.6 280.1 275.4 277.3 260 265 270 275 280 285 290 295 300 27 april 2012 25 may 2012 29 june 2012 27 july 2012 31 aug 2012 28 sep 2012 26 oct 2012 30 nov 2012 28 dec 2012 25 jan 2013 22 feb 2013 29 march 2013 26 april 2013 31 may 2013 28 june 2013 26 july 2013 30 aug 2013 20 sep 2013 Foreign exchange Reserve in USD Billion
- 3. Economic Indicators 3 Ruchi Gupta gupta.ruchi93@gmail.com Import and Export:- A good or service brought into one country from another. The higher the value of imports entering a country, compared to the value of exports, the more negative that country's balance of trade becomes. Export means when goods produced in one country are shipped to another country for future sale or trade. The sale of such goods adds to the producing nation's gross output. If used for trade, exports are exchanged for other products or services. (Taking USD equal to INR 55) 99.8 100.5 111.1 114.6 112.4 120.2 126.9 126.0 124.4 62.2 64.7 67.0 72.6 72.3 69.1 68.1 80.3 73.1 0.0 20.0 40.0 60.0 80.0 100.0 120.0 140.0 Apr-jun (2011) july-sep oct-dec jan-mar apr-jun (2012) july-sep oct-dec jan-mar apr-jun (2013) IN USD Billion Import Export
- 4. Economic Indicators 4 Ruchi Gupta gupta.ruchi93@gmail.com Inflation Rate:- In India Inflation is a persistent rise in the price level in an economy. The price level refers to the average price of goods and services in the economy. Inflation arises when the demand for goods and services in an economy exceeds the supply of same. In August, India's headline inflation rate, rose to 6.10 percent from 5.79 percent in July and is the highest in six months. The speed up is mainly due to higher prices for food and energy. Effects of Increase in inflation are:- When inflation in a country is more than that in a competitive country, the exports from former country will be less attractive compared to the other country. When Inflation increases the currency of that country depreciate. Inflation will also affect interest rate levels. The higher the inflation rate, the more interest rates are likely to rise. When inflation increases the investment made in stock market, treasury notes, and certificates of deposit become less attractive as these investments offer low interest rates that are usually lower than the inflation rate. The low 7.5 7.55 7.58 6.87 7.55 8.07 7.45 7.24 7.18 6.62 7.28 5.65 4.77 4.58 5.16 5.79 6.1 0 1 2 3 4 5 6 7 8 9 Inflation Rate(CPI)
- 5. Economic Indicators 5 Ruchi Gupta gupta.ruchi93@gmail.com interest rates and negative returns make investing in gold an attractive option for many investors. Gross Domestic Products:- The monetary value of all the finished goods and services produced within a country's borders in a specific period of time. A common equation for GDP calculation is: GDP = Private Consumption + Government + Investment + Net Exports (or simply GDP = C + I + G + NX) where C is private consumption or consumer expenditure, I is business investments, G is government expenditure, NX is gross exports - gross imports. For calculation of GDP, net interest expenses in financial sector are added to GDP. For the April-to-June quarter in 2013, it grew at a rate of 4.4%, compared with the same period in the previous year. It was a weaker performance than most economists had been expecting and was a slowdown from the first three months of the year, when growth was 4.8%. A contraction in mining and manufacturing activity was behind the slowdown. 7.7 6.9 6.1 5.3 5.5 5.3 4.7 4.8 4.4 0 1 2 3 4 5 6 7 8 9 april-jun (2011) july-sep oct-dec jan-mar april-jun (2012) july-sep oct-dec jan-mar april-jun (2013) % change in GDP
- 6. Economic Indicators 6 Ruchi Gupta gupta.ruchi93@gmail.com Repo Rate and Reserve Repo Rates:- Repo rate is the rate at which the central bank of a country (Reserve Bank of India in case of India) lends money to commercial banks in the event of any shortfall of funds. Reverse repo rate is the rate at which the central bank of a country (Reserve Bank of India in case of India) borrows money from commercial banks within the country. It is a monetary policy instrument which can be used to control the money supply in the country. 6.75 7.25 7.5 8 8.25 8.5 8.5 8 8 7.75 7.5 7.25 7.5 5.75 6.25 6.5 7 7.25 7.5 7.5 7 7 6.75 6.5 6.25 6.5 0 1 2 3 4 5 6 7 8 9 Mar-11 Apr-11 May-11 Jun-11 Jul-11 Aug-11 Sep-11 Oct-11 Nov-11 Dec-11 Jan-12 Feb-12 Mar-12 Apr-12 May-12 Jun-12 Jul-12 Aug-12 Sep-12 Oct-12 Nov-12 Dec-12 Jan-13 Feb-13 Mar-13 Apr-13 May-13 Jun-13 Jul-13 Aug-13 Sep-13 Repo Rate Reserve Repo Rate
- 7. Economic Indicators 7 Ruchi Gupta gupta.ruchi93@gmail.com INR v/s USD:- The rupee has plunged to an all-time low against the dollar which was 68.36 on 28th august 2013. The reasons for depreciation in rupee are:- In the first quarter of 2013 the CAD was 18.1 billion and at present it has gone up over 21 billion. This has hit hard on the rupee. India's gross domestic product (GDP) growth fell to a decade low of 5% in 2012-13 and 4.4% in the April – June quarter in 2013-14. As a result, foreign investors are losing confidence and pulling money out of the Indian markets. Insufficient inflow of FDIs and outflow of the foreign investments. In the gulf countries, the dealing of oil is done in dollars, i.e., if India has to purchase oil, it has to pay in dollars, so for this India needs to purchase dollars. This has led to the further devaluation of the rupee. 50.5 55.9 55.8 55.4 55.4 52.7 53.7 54.5 54.8 53.3 54.4 54.3 52.953.7 56.5 59.1 60.7 65.8 62.3 0 10 20 30 40 50 60 70 INR v/s USD
- 8. Economic Indicators 8 Ruchi Gupta gupta.ruchi93@gmail.com Steps Taken by RBI to strengthen Rupees against dollar:- The Reserve Bank of India (RBI), in order to stall the rupee slide, has prohibited purchase of real estate by Indians in overseas markets, lowered the ceiling on outward remittance from $200,000 to $75,000 a year and increased the import tax on gold from 8% to 10%. Any approved agency importing gold should ensure that at least 20% of the imported metal is used for exports. The Reserve Bank today reduced the limit for overseas direct investment (ODI) by domestic companies, other than oil PSUs, under automatic route from 400 per cent of the net worth to 100 per cent. The Reserve Bank of India (RBI) will provide dollars directly to stgv2ate oil companies in attempt to support the rupee that has slumped over 20 percent this year. State-run companies are the biggest source of dollar demand in markets - worth $400 million to $500 million daily - and directing them to a special window is meant to reduce pressure on the rupee. In a bid to attract NRI deposits, the RBI liberalized bank deposit schemes and some banks raised rates for overseas Indians this month. To spur banks to attract more dollar deposits from NRIs, the RBI has exempted deposits from cash reserve ratio and statutory liquidity ratio requirements. PSU oil companies would be allowed to raise additional funds - $4 billion - through external commercial borrowings (ECBs). The RBI has tightened the norms for gold imports by linking them to exports. Also, credit availability for gold imports has also been tightened. The RBI will sell Rs. 22,000 crore bonds every week to check the volatility in forex market.