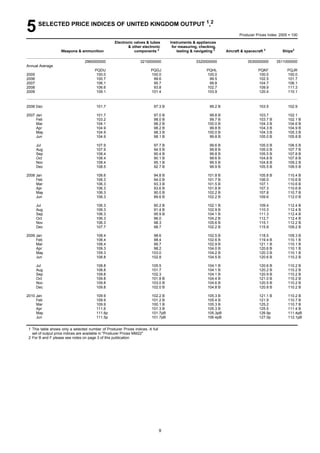
Download to read offline
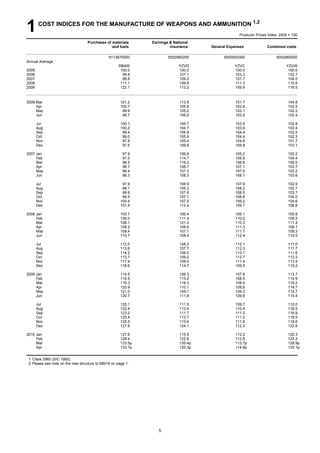
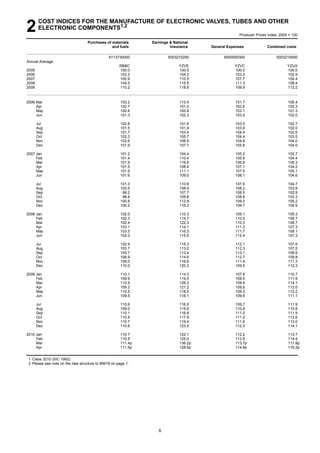
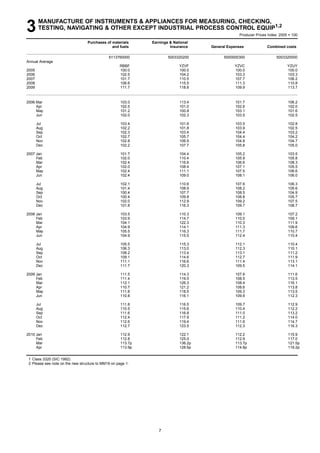

The document provides cost indices for various industries in the aerospace and electronics sectors for April 2010. It includes: 1) Index values for purchases of materials and fuels, earnings and national insurance, general expenses, and combined costs for industries such as weapons manufacturing, electronics component manufacturing, and aircraft manufacturing. 2) Information on data sources, component weights, definitions, and contact details for the publication. 3) The publication is from the Office for National Statistics and provides monthly cost index data for various industries to monitor prices and costs.


