Download to read offline

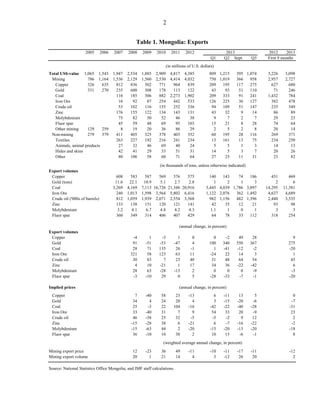
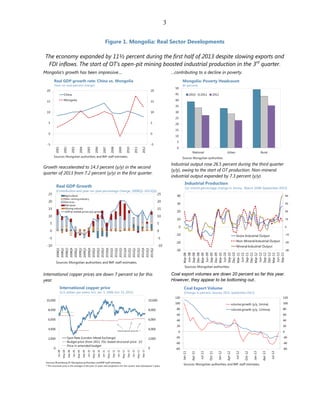
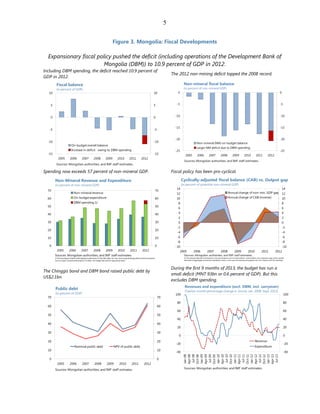

The document provides economic indicators and analysis of Mongolia's macroeconomic performance. It notes that while the economy expanded by 11.5% in the first half of 2013 due to mining growth, exports and FDI inflows are slowing. Inflation reached double digits in 2012 due to expansionary fiscal policy, and the current account deficit remained high. International reserves increased following Mongolia's successful international bond issuance in late 2012. Fiscal policy has been procyclical, with the budget deficit including DBM operations reaching 10.9% of GDP in 2012, exceeding the previous record.


