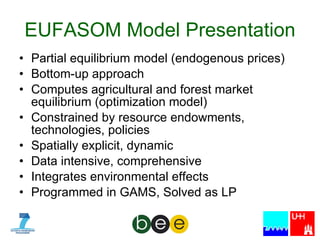
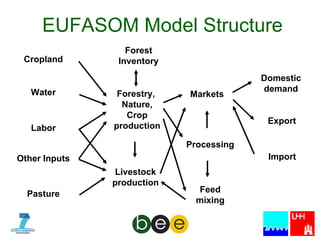
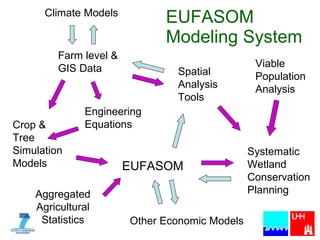
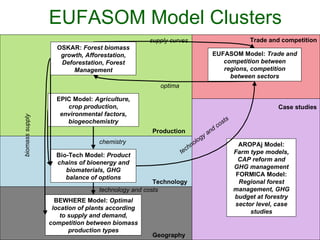
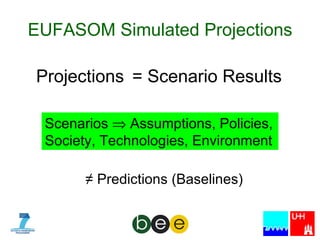
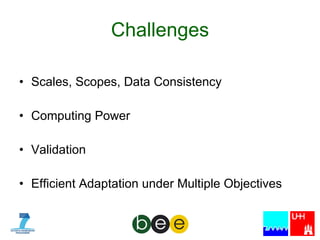
The European Forest and Agricultural Sector Optimization Model (EUFASOM) Chrystalyn Ivie S. Ramos and Uwe A. Schneider, Hamburg University 3 rd  Project Meeting, Skopje, Macedonia, 10-11 September 2009 BEE project is funded by the European Commission under the Framework Programme 7 FP7 GRANT AGREEMENT N˚: 213417
Presentation Summary Part I: The EUFASOM Model Part II: Policy Scenario Analysis
Part I: The EUFASOM Model
EUFASOM Model Presentation Partial equilibrium model (endogenous prices)  Bottom-up approach  Computes agricultural and forest market equilibrium (optimization model) Constrained by resource endowments, technologies, policies Spatially explicit, dynamic Data intensive, comprehensive Integrates environmental effects Programmed in GAMS, Solved as LP
EUFASOM Model Presentation Supply functions implicit: technology1 (RfCvSt)  yield1 technology2 (IrZeSt)  yield2 Demand functions explicit: changing prices Temporal resolution: 5-year time periods, regional or national aggregation levels
Purpose and Objectives To advice policy makers about the agricultural and forestry sector response to  structural changes  based on: Policies Environmental change Technical change Socioeconomic change
Food Timber Fiber Bioenergy Biomaterial Carbon  Sinks Land use  competition Nature Reserves Sealed  Lands
EUFASOM Structure Resources Land Use Technologies Processing Technologies Products Markets Inputs Limits Supply  Functions Limits Demand  Functions, Trade Limits Enviro nmental  Impacts
EUFASOM Model Structure Processing Markets Feed mixing Labor Pasture Other Inputs Cropland Water Livestock production Forestry,  Nature, Crop production Export Domestic demand Import Forest Inventory
EUFASOM  Modeling System EUFASOM Crop &  Tree Simulation Models Spatial Analysis Tools Farm level & GIS Data Viable Population Analysis Systematic Wetland Conservation Planning Engineering Equations Other Economic Models Climate Models Aggregated Agricultural Statistics
EUFASOM Model Clusters AROPAj Model:  Farm type models, CAP reform and GHG management FORMICA Model:  Regional forest management, GHG budget at forestry sector level, case studies Bio-Tech Model:  Product chains of bioenergy and biomaterials, GHG balance of options EPIC Model:  Agriculture, crop production, environmental factors, biogeochemistry supply curves OSKAR:  Forest biomass growth, Afforestation, Deforestation, Forest Management EUFASOM Model:  Trade and competition between regions, competition between sectors optima biomass supply chemistry technology and costs BEWHERE Model:  Optimal location of plants according to supply and demand, competition between biomass production types Geography Case studies Technology Production technology and costs Trade and competition
EUFASOM Simulated Projections Projections  = Scenario Results ≠  Predictions (Baselines) Scenarios    Assumptions, Policies, Society, Technologies, Environment
Challenges Scales, Scopes, Data Consistency Computing Power Validation Efficient Adaptation under Multiple Objectives
Reference Schneider  U.A., J. Balkovic, S. De Cara, O. Franklin, S. Fritz, P. Havlik, I. Huck, K. Jantke, A.M.I. Kallio, F. Kraxner, A. Moiseyev, M. Obersteiner, C.I. Ramos, C. Schleupner, E. Schmid, D. Schwab, R. Skalsky (2008), “The European Forest and Agricultural Sector Optimization Model – EUFASOM”,  FNU-156 , Hamburg University and Centre for Marine and Atmospheric Sciences, Hamburg. http://www.fnu.zmaw.de/
Part II: Policy Scenario Analysis  (Bioenergy Illustration Case)
Illustration Case: Bioenergy Model characteristics National and regional levels (EU25 wide) Scenarios done for the agricultural sector only  conventional food crops biomass from dedicated energy crops (willow, miscanthus and reed canary grass) Regional trade included Bioenergy scope: biomass, biopower, biofuels, biogas Subjected to bioenergy policy, ie: subsidies
Illustration Case: Bioenergy Inputs  resource quantities, crop yields, production costs  Bioenergy processes: technologies, biomass input, processing costs, unit bioenergy output  Market data: base prices Outputs Production/Consumption quantities Economic and technical potentials Prices Trade flows Assumptions:  For the EU27, about 4% of total land and about 8% of agricultural land were used to grow first generation bio-energy crops (EURURALIS,2008).  Only minimum demand for biomass, everything else used for the production of bioenergy (in scenario runs)
Scenarios: Economic and Technical Potentials 0 250 500 750 1000 1250 1500 1750 2000 0 100 200 300 400 500 600 Biomass Incentive in Euro/ton Biomass Demand in million dry tons Competitive Economic  Potential Technical  Potential Current Consumption*  * Consumption, 385 M dry tons (fact-finding study by Broek van den et al, 2003)
Scenarios: Economic and Technical Potentials Incentive in Euro/MWh Sectoral Demand in billion MWh 0 500 1000 1500 2000 0 5 10 15 20 25 30 35 40 45 50 Biogas BioPower Biofuel 60
Scenarios: Economic and Technical Potentials 0 500 1000 1500 2000 0 10 20 30 40 50 60 Incentive in Euro/MWh Bioenergy Demand in billion MWh Competitive Economic Potential Technical Potential
Impact on Food Price, Consumption and Trade Net Export Volume in Billion Euros -1000 -500 0 500 0 2000 4000 6000 8000 10000 12000 14000 16000 -10000 -5000 0 5000 Fisher Index for Food Price and Consumption Biofuel Demand in million MWh Price Consumption Net   Export
Policies  Greenhouse gas taxes (climate, environment) Other policies (agriculture, trade, etc)
Forest Policy: Crop Emissions Emissions (kg C/ha) Carbon price (Euro/tce) -15 -10 -5 0 5 10 15 0 50 100 150 200 250 300 Nitrogen Fertilizer Ag-Soil Carbon Irrigation Use Fossil Fuel Use
 
Power Plant Biomass Supply 0 10 20 30 40 50 60 70 80 0 20 40 60 80 100 Energy Crops (million tons) Carbon tax on energy (EUR/ton of carbon) 2010 Capacity 2030 Capacity 2050 Capacity Unrestricted Capacity
Thank you! Chrystalyn Ivie S. Ramos Hamburg University +49 40 42838 4830 [email_address] BEE project is funded by the European Commission under the Framework Programme 7 FP7 GRANT AGREEMENT N˚: 213417

Eufasom_BiomassPotentials_Skopje2009

  • 1.
    The European Forestand Agricultural Sector Optimization Model (EUFASOM) Chrystalyn Ivie S. Ramos and Uwe A. Schneider, Hamburg University 3 rd Project Meeting, Skopje, Macedonia, 10-11 September 2009 BEE project is funded by the European Commission under the Framework Programme 7 FP7 GRANT AGREEMENT N˚: 213417
  • 2.
    Presentation Summary PartI: The EUFASOM Model Part II: Policy Scenario Analysis
  • 3.
    Part I: TheEUFASOM Model
  • 4.
    EUFASOM Model PresentationPartial equilibrium model (endogenous prices) Bottom-up approach Computes agricultural and forest market equilibrium (optimization model) Constrained by resource endowments, technologies, policies Spatially explicit, dynamic Data intensive, comprehensive Integrates environmental effects Programmed in GAMS, Solved as LP
  • 5.
    EUFASOM Model PresentationSupply functions implicit: technology1 (RfCvSt) yield1 technology2 (IrZeSt) yield2 Demand functions explicit: changing prices Temporal resolution: 5-year time periods, regional or national aggregation levels
  • 6.
    Purpose and ObjectivesTo advice policy makers about the agricultural and forestry sector response to structural changes based on: Policies Environmental change Technical change Socioeconomic change
  • 7.
    Food Timber FiberBioenergy Biomaterial Carbon Sinks Land use competition Nature Reserves Sealed Lands
  • 8.
    EUFASOM Structure ResourcesLand Use Technologies Processing Technologies Products Markets Inputs Limits Supply Functions Limits Demand Functions, Trade Limits Enviro nmental Impacts
  • 9.
    EUFASOM Model StructureProcessing Markets Feed mixing Labor Pasture Other Inputs Cropland Water Livestock production Forestry, Nature, Crop production Export Domestic demand Import Forest Inventory
  • 10.
    EUFASOM ModelingSystem EUFASOM Crop & Tree Simulation Models Spatial Analysis Tools Farm level & GIS Data Viable Population Analysis Systematic Wetland Conservation Planning Engineering Equations Other Economic Models Climate Models Aggregated Agricultural Statistics
  • 11.
    EUFASOM Model ClustersAROPAj Model: Farm type models, CAP reform and GHG management FORMICA Model: Regional forest management, GHG budget at forestry sector level, case studies Bio-Tech Model: Product chains of bioenergy and biomaterials, GHG balance of options EPIC Model: Agriculture, crop production, environmental factors, biogeochemistry supply curves OSKAR: Forest biomass growth, Afforestation, Deforestation, Forest Management EUFASOM Model: Trade and competition between regions, competition between sectors optima biomass supply chemistry technology and costs BEWHERE Model: Optimal location of plants according to supply and demand, competition between biomass production types Geography Case studies Technology Production technology and costs Trade and competition
  • 12.
    EUFASOM Simulated ProjectionsProjections = Scenario Results ≠ Predictions (Baselines) Scenarios  Assumptions, Policies, Society, Technologies, Environment
  • 13.
    Challenges Scales, Scopes,Data Consistency Computing Power Validation Efficient Adaptation under Multiple Objectives
  • 14.
    Reference Schneider U.A., J. Balkovic, S. De Cara, O. Franklin, S. Fritz, P. Havlik, I. Huck, K. Jantke, A.M.I. Kallio, F. Kraxner, A. Moiseyev, M. Obersteiner, C.I. Ramos, C. Schleupner, E. Schmid, D. Schwab, R. Skalsky (2008), “The European Forest and Agricultural Sector Optimization Model – EUFASOM”, FNU-156 , Hamburg University and Centre for Marine and Atmospheric Sciences, Hamburg. http://www.fnu.zmaw.de/
  • 15.
    Part II: PolicyScenario Analysis (Bioenergy Illustration Case)
  • 16.
    Illustration Case: BioenergyModel characteristics National and regional levels (EU25 wide) Scenarios done for the agricultural sector only conventional food crops biomass from dedicated energy crops (willow, miscanthus and reed canary grass) Regional trade included Bioenergy scope: biomass, biopower, biofuels, biogas Subjected to bioenergy policy, ie: subsidies
  • 17.
    Illustration Case: BioenergyInputs resource quantities, crop yields, production costs Bioenergy processes: technologies, biomass input, processing costs, unit bioenergy output Market data: base prices Outputs Production/Consumption quantities Economic and technical potentials Prices Trade flows Assumptions: For the EU27, about 4% of total land and about 8% of agricultural land were used to grow first generation bio-energy crops (EURURALIS,2008). Only minimum demand for biomass, everything else used for the production of bioenergy (in scenario runs)
  • 18.
    Scenarios: Economic andTechnical Potentials 0 250 500 750 1000 1250 1500 1750 2000 0 100 200 300 400 500 600 Biomass Incentive in Euro/ton Biomass Demand in million dry tons Competitive Economic Potential Technical Potential Current Consumption* * Consumption, 385 M dry tons (fact-finding study by Broek van den et al, 2003)
  • 19.
    Scenarios: Economic andTechnical Potentials Incentive in Euro/MWh Sectoral Demand in billion MWh 0 500 1000 1500 2000 0 5 10 15 20 25 30 35 40 45 50 Biogas BioPower Biofuel 60
  • 20.
    Scenarios: Economic andTechnical Potentials 0 500 1000 1500 2000 0 10 20 30 40 50 60 Incentive in Euro/MWh Bioenergy Demand in billion MWh Competitive Economic Potential Technical Potential
  • 21.
    Impact on FoodPrice, Consumption and Trade Net Export Volume in Billion Euros -1000 -500 0 500 0 2000 4000 6000 8000 10000 12000 14000 16000 -10000 -5000 0 5000 Fisher Index for Food Price and Consumption Biofuel Demand in million MWh Price Consumption Net Export
  • 22.
    Policies Greenhousegas taxes (climate, environment) Other policies (agriculture, trade, etc)
  • 23.
    Forest Policy: CropEmissions Emissions (kg C/ha) Carbon price (Euro/tce) -15 -10 -5 0 5 10 15 0 50 100 150 200 250 300 Nitrogen Fertilizer Ag-Soil Carbon Irrigation Use Fossil Fuel Use
  • 24.
  • 25.
    Power Plant BiomassSupply 0 10 20 30 40 50 60 70 80 0 20 40 60 80 100 Energy Crops (million tons) Carbon tax on energy (EUR/ton of carbon) 2010 Capacity 2030 Capacity 2050 Capacity Unrestricted Capacity
  • 26.
    Thank you! ChrystalynIvie S. Ramos Hamburg University +49 40 42838 4830 [email_address] BEE project is funded by the European Commission under the Framework Programme 7 FP7 GRANT AGREEMENT N˚: 213417

Editor's Notes

  • #5 spatially explicit information such as road layouts, existing land uses, population densities and growth rates, distributions of endangered species, archeologically significant areas, etc. to inform planning and policy development related to biomass energy at a regional or national level.
  • #6 Supply functions: implicit meaning there are no direct supply functions for crops for example but we have inputs of resources, labor, technologies which in the end brings about yields as an output for example. Demand functions: changing prices, ex. decreasing prices
  • #7 Policies: energy taxes, carbon taxes, tariffs and subsidies, standards Technical change: example – 20% increase in crop productivitiy, agricultural mechanization, etc. Environmental change: introduction of environmental policies, etc. Socioeconomic change: Population, Low income population effects, high-income population; inequalities; land tenure; standard of living
  • #8 Sealed lands include lands used for roads, railroads, lands where buildings were erected, etc.
  • #16 It is a small static model which marginally represents the bioenergy module in EUFASOM but does not possess all the advantages and characteristics of EUFASOM which is dynamic. It is also a stand alone model – runs outside EUFASOM.
  • #18 Inputs: Resource constraints: (Land) - fixed total quantity and/or increasing resource supply functions Outputs: production Q = land use, water use, environment (CO2 emissions) consumption Q = undernourishment indicators trade flows = net exports or net imports
  • #19 1 km2 = 100 ha. The EU27 has a total land area of 433.2 Mha, of which 196.6 Mha is agricultural and 113.5 Mha arable. Forest area is around 150.85 million has. Data from Institute of Science and Society, 2008. (other data as of 2006 from Europe Statistical Pocketbook). According from EURURALIS, for the EU27 about 4% of total land and about 8% of agricultural land will be used to grow first generation bio-energy crops. As of 2003, availability of biomass resources for EU25 according to a fact finding study done by Broek van den et al (biofuels in the dutch market) shows a potential of around 165 mtoe including electricity, heat and biofuels. From this study, it is around 214 mtoe (500 million tons biomass).