Download as PDF, PPTX


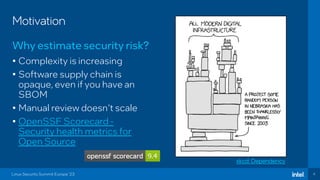
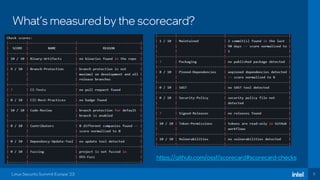
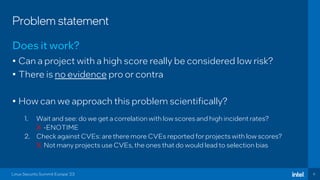
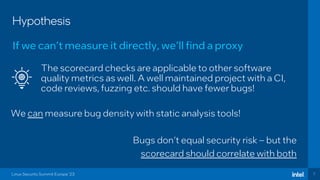
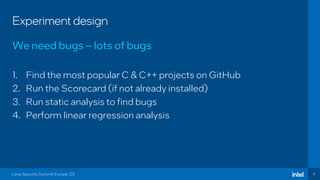
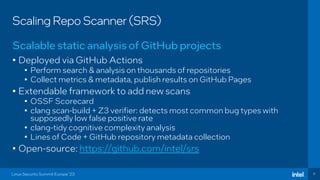
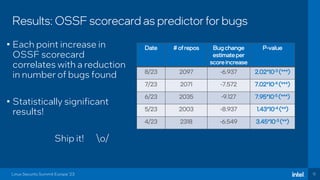
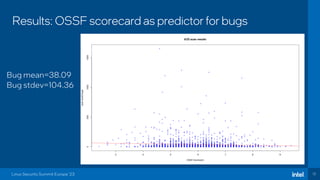
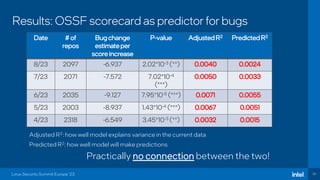
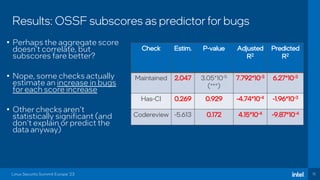
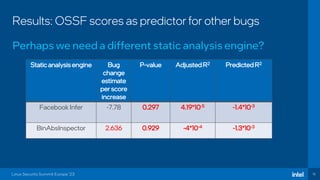
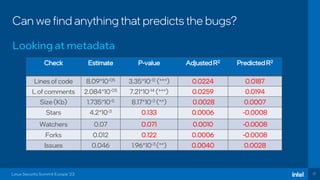
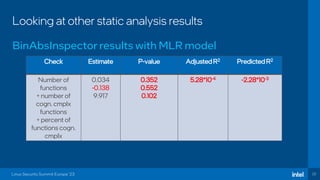
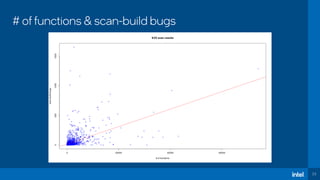
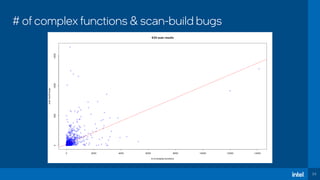
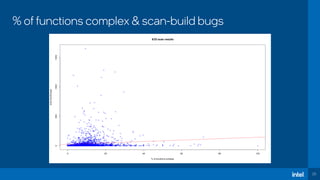


The document discusses the challenges of estimating security risks in open-source projects using the OpenSSF scorecard and automated static analysis tools. It presents findings that suggest a correlation between higher scorecard ratings and reduced bug density, though indicates potential limitations and biases in the data. Ultimately, it emphasizes the need for improved methods to evaluate open-source project risks scientifically and calls for community feedback and collaboration in this area.
![[USENIX-WOOT] Introduction to Procedural Debugging through Binary Libification](https://cdn.slidesharecdn.com/ss_thumbnails/woot24-brossard1-240814201939-0cc12cfe-thumbnail.jpg?width=640&height=640&fit=bounds)


![Getting Started with Apache Spark: Big Data Made Simple [Free Meetup]](https://cdn.slidesharecdn.com/ss_thumbnails/apachesparkgettingstarted-260203175547-8361bcc3-thumbnail.jpg?width=640&height=640&fit=bounds)


