SlideShare a Scribd company logo
For more information about Esri’s data products, call
1-800-447-9778 or visit esri.com/bizdata.
Esri U.S. Data
Database Name
EsriBusinessAnalyst
Online
SM
EsriCommunityAnalyst
EsriBusiness
Analyst™
Desktop
EsriBusinessAnalyst
Server
AdHocDatabase
Orders
ArcGISOnline
Updated Demographics • • • • • •
Census 2010 Data • • • • • •
ACS Data • • •
Tapestry Segmentation • • • • •
Retail MarketPlace • • $ $ •
Business Locations • • • • •
Business Summary • • • • •
Consumer Spending • • • • • •
• Indicates entire database or subset of database is available in the product
$ Indicates database can be added to the product for an additional cost
NOTE: Vintages noted are for data orders; however, these vintages may differ in
software and online products.
Fact Sheet
Esri
®
U.S. Data
Database Name Source Vintage Description Updated
Updated
Demographics
Esri 2012/2017 Esri offers current-year updates and five-year projections of
population, age by sex, race and Hispanic origin, house-
holds and families, tenure, home value, household income,
household income by age of householder, per capita income,
current-year employed population by occupation and indus-
try, current-year age by sex and race, current-year disposable
income, current-year net worth, and more.
Annually
Census Data Esri and US
Census Bureau
2010 & 2000 Esri provides Census data for geographies not supplied by the
Census Bureau including ZIP codes, DMAs, rings, drive times,
and hand drawn areas. Esri also provides data for States,
Counties, Tracts, Block Groups, Places, CBSAs, Congressional
Districts, and County Subdivisions.
Decennially
American
Community
Survey (ACS)
U.S. Census
Bureau
2006-2010 Esri provides ACS data for poverty status, education, labor
force, journey to work, marital status, languages spoken,
ancestry, and home value. To increase understanding of the
data, Esri developed a system of Reliability symbols that
indicates the accuracy of each estimate. Esri also provides the
ACS data for geographies not supplied by the Census Bureau
such as ZIP codes, rings, drive times, and hand-drawn areas.
Annually
Tapestry™
Segmentation
Esri 2012 Tapestry segmentation provides an accurate, detailed de-
scription of America’s neighborhoods. US residential areas are
divided into 65 distinctive segments based on their socioeco-
nomic and demographic composition.
Annually
Retail
MarketPlace
Esri 2012 This database includes retail sales by industry to households
and retail potential or spending by households. The database
provides a direct comparison between retail sales and con-
sumer spending by industry and measures the gap between
supply and demand.
Annually
Business
Locations
Esri and D&B July 2012 Esri’s business locations data is extracted from a comprehen-
sive list of businesses licensed from Dun & Bradstreet. The
business list contains data for more than 18 million US busi-
nesses including name and location, industrial classification
code, number of employees, and sales.
Annually
Business
Summary
Esri and D&B July 2012 This geographic database summarizes the comprehensive list
of businesses from Dun & Bradstreet for select NAICS and SIC
summary categories and includes total number of businesses,
total sales, and total number of employees for a trade area.
Annually
Consumer
Spending
Esri and Bureau
of Labor
Statistics
2012 This comprehensive database, developed by Esri, is based on
a combination of the latest Consumer Expenditure Surveys
(CEX) from the Bureau of Labor Statistics. Data is reported by
product or service and includes total expenditures, average
spending per household, and a Spending Potential Index (SPI).
Annually
April 2013
Copyright © 2013 Esri. All rights reserved. Esri, the Esri globe logo, Business Analyst, Business Analyst Online, Tapestry, and esri.com are
trademarks, service marks, or registered marks of Esri in the United States, the European Community, or certain other jurisdictions. Other
companies and products or services mentioned herein may be trademarks, service marks, or registered marks of their respective mark owners.
Fact Sheet
Esri
®
U.S. Data
Database Name Source Vintage Description Updated
Market Potential Esri and
GfK MRI
2012 The Market Potential database includes data representing
goods, services, attitudes, and activities and is collected from
the Gfk MRI consumer survey. The database provides the
expected number of consumers and a Market Potential Index
(MPI).
Annually
1990 Data in 2000
Geography
Esri 1990 To compare 1990 and 2000 data for a given site, Esri created
a 1990–2000 block group correspondence file and converted
1990 data in 1990 geography into 1990 data in 2000 geography.
Not Updated
Traffic Counts Market Plan-
ning Solutions
Inc.
Q1, 2013 Esri’s traffic count data comes from MPSI/DataMetrix and pro-
vides the most current and extensive US traffic data for trade
analysis, routing, or mathematical modeling.
Quarterly
Major Shopping
Centers
Directory of
Major Malls,
Inc.
January 2013 The Major Shopping Centers data from the Directory of Major
Malls (DMM) database includes information about shopping
centers with a gross leasable area (GLA) of 250,000 square
feet or more.
Semiannually
Bank Branches RPM Consulting 2013 Esri’s Bank Branches database incorporates information from
the BranchInfoTM
data created by RPM Consulting. Detailed
information about every bank location in the US is carefully
standardized and address-matched to provide branch-level
information by institution and site over a five-year period.
Annually
Banking Potential RPM Consulting 2012 MarketBankTM
data from RPM Consulting is the source of
Esri’s Banking Potential database. This information estimates
market penetration and potential for 15 savings, investment,
and lending products for every block group in the US.
Annually
Crime Indexes Applied
Geographic
Solutions
2013A Esri’s Crime Indexes data incorporates information from
the AGS national CrimeRisk database that is based on an
extensive analysis of several years of crime incidents reported
by most US law enforcement jurisdictions. The Crime Indexes
database includes standardized indexes for a range of
serious crimes against both persons and property. The data
is available at multiple geographies down to the block group
level.
Semiannually
Cable Boundaries EMSi/The Janus
Group, Inc.
Q1, 2013 Esri’s Cable Boundaries geodatabase is based on the
MediaPrintsTM
cable boundary data from EMSi/The Janus
Group, Inc., the premier source for US cable system boundar-
ies and data. Information includes data for digital service
areas and high-speed Internet access areas. Cable overbuilds
and wireless cable systems are represented as separate map-
ping layers.
Quarterly
Employment by
Occupation
Applied
Geographic
Solutions
2013A This geographic database provides counts for the daytime
working population by 17 specified occupation classifications,
plus white- and blue-collar summarizations.
Semiannually
Esri U.S. Data
Database Name
EsriBusinessAnalyst
Online
SM
EsriCommunityAnalyst
EsriBusiness
Analyst™
Desktop
EsriBusinessAnalyst
Server
AdHocDatabase
Orders
Market Potential • • • • •
Census 2000 and 1990 Data • • • • •
Traffic Counts • • $ $ •
Major Shopping Centers • • • • •
Bank Branches $ $ •
Banking Potential $ $ •
Crime Indexes • • $ $ •
Cable Boundaries $ $ •
Employment by Occupation $ $ •
• Indicates entire database or subset of database is available in the product
$ Indicates database can be added to the product for an additional cost
NOTE: Vintages noted are for data orders; however, these vintages may differ in
software and online products.
G58014 4/13ek/ca April 2013
For more information about Esri’s data products, call
1-800-447-9778 or visit esri.com/bizdata.
Copyright © 2013 Esri. All rights reserved. Esri, the Esri globe logo, Business Analyst, Business Analyst Online, Tapestry, and esri.com are
trademarks, service marks, or registered marks of Esri in the United States, the European Community, or certain other jurisdictions. Other
companies and products or services mentioned herein may be trademarks, service marks, or registered marks of their respective mark owners.

More Related Content

Similar to Esri U.S. Data Fact Sheet

Esri US Data Fact Sheet
Esri US Data Fact SheetEsri US Data Fact Sheet
Esri US Data Fact Sheet
Esri
 
Esri US Market Potential Database Methodology Statement
Esri US Market Potential Database Methodology StatementEsri US Market Potential Database Methodology Statement
Esri US Market Potential Database Methodology Statement
Esri
 
Esri Data: Business Locations and Business Summary 2012 Methodology Statement
Esri Data: Business Locations and Business Summary 2012 Methodology StatementEsri Data: Business Locations and Business Summary 2012 Methodology Statement
Esri Data: Business Locations and Business Summary 2012 Methodology Statement
Esri
 
Data conf 2010 bus demos
Data conf 2010 bus demosData conf 2010 bus demos
Data conf 2010 bus demos
kenmomaha
 
Business Plan Toolkit, Part 2 of 3
Business Plan Toolkit, Part 2 of 3Business Plan Toolkit, Part 2 of 3
ESRI Feb 29
ESRI Feb 29ESRI Feb 29
ESRI Feb 29
Bob Trescott
 
Esri Data Tapestry Segmentation Methodology Statement
Esri Data Tapestry Segmentation Methodology StatementEsri Data Tapestry Segmentation Methodology Statement
Esri Data Tapestry Segmentation Methodology Statement
Esri
 
Hardware Stores
Hardware StoresHardware Stores
Hardware Stores
Patty P. Lundy
 
Graph Database
Graph Database  Graph Database
Graph Database
Ashutosh Sable
 
All Things Data - Core Tools for Economic Development Practitioners
All Things Data - Core Tools for Economic Development PractitionersAll Things Data - Core Tools for Economic Development Practitioners
All Things Data - Core Tools for Economic Development Practitioners
Tom Dworetsky, AICP
 
Modern Data Discovery and Integration in Insurance
Modern Data Discovery and Integration in InsuranceModern Data Discovery and Integration in Insurance
Modern Data Discovery and Integration in Insurance
Cambridge Semantics
 
What Is Your LMIQ
What Is Your LMIQWhat Is Your LMIQ
What Is Your LMIQ
Kristin Wolff
 
The 10 MUSTS of Economic Development Data
The 10 MUSTS of Economic Development DataThe 10 MUSTS of Economic Development Data
The 10 MUSTS of Economic Development Data
GIS Planning
 
Esri Business Analyst
Esri Business AnalystEsri Business Analyst
Esri Business Analyst
Esri
 
WUSTL Roundtable
WUSTL RoundtableWUSTL Roundtable
WUSTL Roundtable
Christopher Klaus
 
Workforce Analytics Market.pdf
Workforce Analytics Market.pdfWorkforce Analytics Market.pdf
Workforce Analytics Market.pdf
sagarsingh443888
 
Spring 2013
Spring 2013Spring 2013
Spring 2013
Esri
 
Big Data
Big DataBig Data
Big Data
Amit Singh
 
Biz 240 and the library3
Biz 240 and the library3Biz 240 and the library3
Biz 240 and the library3
Traciwm
 
Strategies to Monetize Energy Data - How Utilities Can Increase Their 'Earnin...
Strategies to Monetize Energy Data - How Utilities Can Increase Their 'Earnin...Strategies to Monetize Energy Data - How Utilities Can Increase Their 'Earnin...
Strategies to Monetize Energy Data - How Utilities Can Increase Their 'Earnin...
Indigo Advisory Group
 

Similar to Esri U.S. Data Fact Sheet (20)

Esri US Data Fact Sheet
Esri US Data Fact SheetEsri US Data Fact Sheet
Esri US Data Fact Sheet
 
Esri US Market Potential Database Methodology Statement
Esri US Market Potential Database Methodology StatementEsri US Market Potential Database Methodology Statement
Esri US Market Potential Database Methodology Statement
 
Esri Data: Business Locations and Business Summary 2012 Methodology Statement
Esri Data: Business Locations and Business Summary 2012 Methodology StatementEsri Data: Business Locations and Business Summary 2012 Methodology Statement
Esri Data: Business Locations and Business Summary 2012 Methodology Statement
 
Data conf 2010 bus demos
Data conf 2010 bus demosData conf 2010 bus demos
Data conf 2010 bus demos
 
Business Plan Toolkit, Part 2 of 3
Business Plan Toolkit, Part 2 of 3Business Plan Toolkit, Part 2 of 3
Business Plan Toolkit, Part 2 of 3
 
ESRI Feb 29
ESRI Feb 29ESRI Feb 29
ESRI Feb 29
 
Esri Data Tapestry Segmentation Methodology Statement
Esri Data Tapestry Segmentation Methodology StatementEsri Data Tapestry Segmentation Methodology Statement
Esri Data Tapestry Segmentation Methodology Statement
 
Hardware Stores
Hardware StoresHardware Stores
Hardware Stores
 
Graph Database
Graph Database  Graph Database
Graph Database
 
All Things Data - Core Tools for Economic Development Practitioners
All Things Data - Core Tools for Economic Development PractitionersAll Things Data - Core Tools for Economic Development Practitioners
All Things Data - Core Tools for Economic Development Practitioners
 
Modern Data Discovery and Integration in Insurance
Modern Data Discovery and Integration in InsuranceModern Data Discovery and Integration in Insurance
Modern Data Discovery and Integration in Insurance
 
What Is Your LMIQ
What Is Your LMIQWhat Is Your LMIQ
What Is Your LMIQ
 
The 10 MUSTS of Economic Development Data
The 10 MUSTS of Economic Development DataThe 10 MUSTS of Economic Development Data
The 10 MUSTS of Economic Development Data
 
Esri Business Analyst
Esri Business AnalystEsri Business Analyst
Esri Business Analyst
 
WUSTL Roundtable
WUSTL RoundtableWUSTL Roundtable
WUSTL Roundtable
 
Workforce Analytics Market.pdf
Workforce Analytics Market.pdfWorkforce Analytics Market.pdf
Workforce Analytics Market.pdf
 
Spring 2013
Spring 2013Spring 2013
Spring 2013
 
Big Data
Big DataBig Data
Big Data
 
Biz 240 and the library3
Biz 240 and the library3Biz 240 and the library3
Biz 240 and the library3
 
Strategies to Monetize Energy Data - How Utilities Can Increase Their 'Earnin...
Strategies to Monetize Energy Data - How Utilities Can Increase Their 'Earnin...Strategies to Monetize Energy Data - How Utilities Can Increase Their 'Earnin...
Strategies to Monetize Energy Data - How Utilities Can Increase Their 'Earnin...
 

More from Esri

INIA- CISA: Análisis de las amenazas en la fauna silvestre
INIA- CISA: Análisis de las amenazas en la fauna silvestreINIA- CISA: Análisis de las amenazas en la fauna silvestre
INIA- CISA: Análisis de las amenazas en la fauna silvestre
Esri
 
Aena Aeropuerto Adolfo Suárez-Barajas crea potentes aplicaciones para sus cli...
Aena Aeropuerto Adolfo Suárez-Barajas crea potentes aplicaciones para sus cli...Aena Aeropuerto Adolfo Suárez-Barajas crea potentes aplicaciones para sus cli...
Aena Aeropuerto Adolfo Suárez-Barajas crea potentes aplicaciones para sus cli...
Esri
 
Plataforma Smart City de Móstoles
Plataforma Smart City de MóstolesPlataforma Smart City de Móstoles
Plataforma Smart City de Móstoles
Esri
 
ArcGIS Online para Organizaciones
ArcGIS Online para OrganizacionesArcGIS Online para Organizaciones
ArcGIS Online para Organizaciones
Esri
 
Molina de Segura se convierte en una smart city
Molina de Segura se convierte en una smart cityMolina de Segura se convierte en una smart city
Molina de Segura se convierte en una smart city
Esri
 
Portal for ArcGIS
Portal for ArcGISPortal for ArcGIS
Portal for ArcGIS
Esri
 
GIS-Based Web Services Provide Rapid Analysis and Dissemination of Maritime Data
GIS-Based Web Services Provide Rapid Analysis and Dissemination of Maritime DataGIS-Based Web Services Provide Rapid Analysis and Dissemination of Maritime Data
GIS-Based Web Services Provide Rapid Analysis and Dissemination of Maritime Data
Esri
 
An Effective Tool for Drinking Water Protection
An Effective Tool for Drinking Water ProtectionAn Effective Tool for Drinking Water Protection
An Effective Tool for Drinking Water Protection
Esri
 
GeoCollector for ArcPad
GeoCollector for ArcPadGeoCollector for ArcPad
GeoCollector for ArcPad
Esri
 
GeoCollector for ArcGIS for Windows Mobile
GeoCollector for ArcGIS for Windows MobileGeoCollector for ArcGIS for Windows Mobile
GeoCollector for ArcGIS for Windows Mobile
Esri
 
Data Appliance for ArcGIS
Data Appliance for ArcGISData Appliance for ArcGIS
Data Appliance for ArcGIS
Esri
 
Esri and BlackBridge
Esri and BlackBridgeEsri and BlackBridge
Esri and BlackBridge
Esri
 
GeoPlanner for ArcGIS
GeoPlanner for ArcGISGeoPlanner for ArcGIS
GeoPlanner for ArcGIS
Esri
 
Esri and AccuWeather
Esri and AccuWeatherEsri and AccuWeather
Esri and AccuWeather
Esri
 
Esri and Airbus Defense & Space
Esri and Airbus Defense & SpaceEsri and Airbus Defense & Space
Esri and Airbus Defense & Space
Esri
 
ArcGIS for Server on Microsoft Azure Jumpstart
ArcGIS for Server on Microsoft Azure JumpstartArcGIS for Server on Microsoft Azure Jumpstart
ArcGIS for Server on Microsoft Azure Jumpstart
Esri
 
ArcGIS for the Military--Maritime Operations
ArcGIS for the Military--Maritime OperationsArcGIS for the Military--Maritime Operations
ArcGIS for the Military--Maritime Operations
Esri
 
Esri Geoportal Server
Esri Geoportal ServerEsri Geoportal Server
Esri Geoportal Server
Esri
 
ArcGIS GeoEvent Extension for Server
ArcGIS GeoEvent Extension for ServerArcGIS GeoEvent Extension for Server
ArcGIS GeoEvent Extension for Server
Esri
 
The NATO Core Geographic Services System
The NATO Core Geographic Services SystemThe NATO Core Geographic Services System
The NATO Core Geographic Services System
Esri
 

More from Esri (20)

INIA- CISA: Análisis de las amenazas en la fauna silvestre
INIA- CISA: Análisis de las amenazas en la fauna silvestreINIA- CISA: Análisis de las amenazas en la fauna silvestre
INIA- CISA: Análisis de las amenazas en la fauna silvestre
 
Aena Aeropuerto Adolfo Suárez-Barajas crea potentes aplicaciones para sus cli...
Aena Aeropuerto Adolfo Suárez-Barajas crea potentes aplicaciones para sus cli...Aena Aeropuerto Adolfo Suárez-Barajas crea potentes aplicaciones para sus cli...
Aena Aeropuerto Adolfo Suárez-Barajas crea potentes aplicaciones para sus cli...
 
Plataforma Smart City de Móstoles
Plataforma Smart City de MóstolesPlataforma Smart City de Móstoles
Plataforma Smart City de Móstoles
 
ArcGIS Online para Organizaciones
ArcGIS Online para OrganizacionesArcGIS Online para Organizaciones
ArcGIS Online para Organizaciones
 
Molina de Segura se convierte en una smart city
Molina de Segura se convierte en una smart cityMolina de Segura se convierte en una smart city
Molina de Segura se convierte en una smart city
 
Portal for ArcGIS
Portal for ArcGISPortal for ArcGIS
Portal for ArcGIS
 
GIS-Based Web Services Provide Rapid Analysis and Dissemination of Maritime Data
GIS-Based Web Services Provide Rapid Analysis and Dissemination of Maritime DataGIS-Based Web Services Provide Rapid Analysis and Dissemination of Maritime Data
GIS-Based Web Services Provide Rapid Analysis and Dissemination of Maritime Data
 
An Effective Tool for Drinking Water Protection
An Effective Tool for Drinking Water ProtectionAn Effective Tool for Drinking Water Protection
An Effective Tool for Drinking Water Protection
 
GeoCollector for ArcPad
GeoCollector for ArcPadGeoCollector for ArcPad
GeoCollector for ArcPad
 
GeoCollector for ArcGIS for Windows Mobile
GeoCollector for ArcGIS for Windows MobileGeoCollector for ArcGIS for Windows Mobile
GeoCollector for ArcGIS for Windows Mobile
 
Data Appliance for ArcGIS
Data Appliance for ArcGISData Appliance for ArcGIS
Data Appliance for ArcGIS
 
Esri and BlackBridge
Esri and BlackBridgeEsri and BlackBridge
Esri and BlackBridge
 
GeoPlanner for ArcGIS
GeoPlanner for ArcGISGeoPlanner for ArcGIS
GeoPlanner for ArcGIS
 
Esri and AccuWeather
Esri and AccuWeatherEsri and AccuWeather
Esri and AccuWeather
 
Esri and Airbus Defense & Space
Esri and Airbus Defense & SpaceEsri and Airbus Defense & Space
Esri and Airbus Defense & Space
 
ArcGIS for Server on Microsoft Azure Jumpstart
ArcGIS for Server on Microsoft Azure JumpstartArcGIS for Server on Microsoft Azure Jumpstart
ArcGIS for Server on Microsoft Azure Jumpstart
 
ArcGIS for the Military--Maritime Operations
ArcGIS for the Military--Maritime OperationsArcGIS for the Military--Maritime Operations
ArcGIS for the Military--Maritime Operations
 
Esri Geoportal Server
Esri Geoportal ServerEsri Geoportal Server
Esri Geoportal Server
 
ArcGIS GeoEvent Extension for Server
ArcGIS GeoEvent Extension for ServerArcGIS GeoEvent Extension for Server
ArcGIS GeoEvent Extension for Server
 
The NATO Core Geographic Services System
The NATO Core Geographic Services SystemThe NATO Core Geographic Services System
The NATO Core Geographic Services System
 

Recently uploaded

AWS Cloud Cost Optimization Presentation.pptx
AWS Cloud Cost Optimization Presentation.pptxAWS Cloud Cost Optimization Presentation.pptx
AWS Cloud Cost Optimization Presentation.pptx
HarisZaheer8
 
Operating System Used by Users in day-to-day life.pptx
Operating System Used by Users in day-to-day life.pptxOperating System Used by Users in day-to-day life.pptx
Operating System Used by Users in day-to-day life.pptx
Pravash Chandra Das
 
leewayhertz.com-AI in predictive maintenance Use cases technologies benefits ...
leewayhertz.com-AI in predictive maintenance Use cases technologies benefits ...leewayhertz.com-AI in predictive maintenance Use cases technologies benefits ...
leewayhertz.com-AI in predictive maintenance Use cases technologies benefits ...
alexjohnson7307
 
Main news related to the CCS TSI 2023 (2023/1695)
Main news related to the CCS TSI 2023 (2023/1695)Main news related to the CCS TSI 2023 (2023/1695)
Main news related to the CCS TSI 2023 (2023/1695)
Jakub Marek
 
Building Production Ready Search Pipelines with Spark and Milvus
Building Production Ready Search Pipelines with Spark and MilvusBuilding Production Ready Search Pipelines with Spark and Milvus
Building Production Ready Search Pipelines with Spark and Milvus
Zilliz
 
Ocean lotus Threat actors project by John Sitima 2024 (1).pptx
Ocean lotus Threat actors project by John Sitima 2024 (1).pptxOcean lotus Threat actors project by John Sitima 2024 (1).pptx
Ocean lotus Threat actors project by John Sitima 2024 (1).pptx
SitimaJohn
 
Recommendation System using RAG Architecture
Recommendation System using RAG ArchitectureRecommendation System using RAG Architecture
Recommendation System using RAG Architecture
fredae14
 
How to Interpret Trends in the Kalyan Rajdhani Mix Chart.pdf
How to Interpret Trends in the Kalyan Rajdhani Mix Chart.pdfHow to Interpret Trends in the Kalyan Rajdhani Mix Chart.pdf
How to Interpret Trends in the Kalyan Rajdhani Mix Chart.pdf
Chart Kalyan
 
HCL Notes und Domino Lizenzkostenreduzierung in der Welt von DLAU
HCL Notes und Domino Lizenzkostenreduzierung in der Welt von DLAUHCL Notes und Domino Lizenzkostenreduzierung in der Welt von DLAU
HCL Notes und Domino Lizenzkostenreduzierung in der Welt von DLAU
panagenda
 
UI5 Controls simplified - UI5con2024 presentation
UI5 Controls simplified - UI5con2024 presentationUI5 Controls simplified - UI5con2024 presentation
UI5 Controls simplified - UI5con2024 presentation
Wouter Lemaire
 
Nunit vs XUnit vs MSTest Differences Between These Unit Testing Frameworks.pdf
Nunit vs XUnit vs MSTest Differences Between These Unit Testing Frameworks.pdfNunit vs XUnit vs MSTest Differences Between These Unit Testing Frameworks.pdf
Nunit vs XUnit vs MSTest Differences Between These Unit Testing Frameworks.pdf
flufftailshop
 
System Design Case Study: Building a Scalable E-Commerce Platform - Hiike
System Design Case Study: Building a Scalable E-Commerce Platform - HiikeSystem Design Case Study: Building a Scalable E-Commerce Platform - Hiike
System Design Case Study: Building a Scalable E-Commerce Platform - Hiike
Hiike
 
A Comprehensive Guide to DeFi Development Services in 2024
A Comprehensive Guide to DeFi Development Services in 2024A Comprehensive Guide to DeFi Development Services in 2024
A Comprehensive Guide to DeFi Development Services in 2024
Intelisync
 
Energy Efficient Video Encoding for Cloud and Edge Computing Instances
Energy Efficient Video Encoding for Cloud and Edge Computing InstancesEnergy Efficient Video Encoding for Cloud and Edge Computing Instances
Energy Efficient Video Encoding for Cloud and Edge Computing Instances
Alpen-Adria-Universität
 
Skybuffer SAM4U tool for SAP license adoption
Skybuffer SAM4U tool for SAP license adoptionSkybuffer SAM4U tool for SAP license adoption
Skybuffer SAM4U tool for SAP license adoption
Tatiana Kojar
 
Taking AI to the Next Level in Manufacturing.pdf
Taking AI to the Next Level in Manufacturing.pdfTaking AI to the Next Level in Manufacturing.pdf
Taking AI to the Next Level in Manufacturing.pdf
ssuserfac0301
 
Your One-Stop Shop for Python Success: Top 10 US Python Development Providers
Your One-Stop Shop for Python Success: Top 10 US Python Development ProvidersYour One-Stop Shop for Python Success: Top 10 US Python Development Providers
Your One-Stop Shop for Python Success: Top 10 US Python Development Providers
akankshawande
 
GenAI Pilot Implementation in the organizations
GenAI Pilot Implementation in the organizationsGenAI Pilot Implementation in the organizations
GenAI Pilot Implementation in the organizations
kumardaparthi1024
 
Monitoring and Managing Anomaly Detection on OpenShift.pdf
Monitoring and Managing Anomaly Detection on OpenShift.pdfMonitoring and Managing Anomaly Detection on OpenShift.pdf
Monitoring and Managing Anomaly Detection on OpenShift.pdf
Tosin Akinosho
 
Presentation of the OECD Artificial Intelligence Review of Germany
Presentation of the OECD Artificial Intelligence Review of GermanyPresentation of the OECD Artificial Intelligence Review of Germany
Presentation of the OECD Artificial Intelligence Review of Germany
innovationoecd
 

Recently uploaded (20)

AWS Cloud Cost Optimization Presentation.pptx
AWS Cloud Cost Optimization Presentation.pptxAWS Cloud Cost Optimization Presentation.pptx
AWS Cloud Cost Optimization Presentation.pptx
 
Operating System Used by Users in day-to-day life.pptx
Operating System Used by Users in day-to-day life.pptxOperating System Used by Users in day-to-day life.pptx
Operating System Used by Users in day-to-day life.pptx
 
leewayhertz.com-AI in predictive maintenance Use cases technologies benefits ...
leewayhertz.com-AI in predictive maintenance Use cases technologies benefits ...leewayhertz.com-AI in predictive maintenance Use cases technologies benefits ...
leewayhertz.com-AI in predictive maintenance Use cases technologies benefits ...
 
Main news related to the CCS TSI 2023 (2023/1695)
Main news related to the CCS TSI 2023 (2023/1695)Main news related to the CCS TSI 2023 (2023/1695)
Main news related to the CCS TSI 2023 (2023/1695)
 
Building Production Ready Search Pipelines with Spark and Milvus
Building Production Ready Search Pipelines with Spark and MilvusBuilding Production Ready Search Pipelines with Spark and Milvus
Building Production Ready Search Pipelines with Spark and Milvus
 
Ocean lotus Threat actors project by John Sitima 2024 (1).pptx
Ocean lotus Threat actors project by John Sitima 2024 (1).pptxOcean lotus Threat actors project by John Sitima 2024 (1).pptx
Ocean lotus Threat actors project by John Sitima 2024 (1).pptx
 
Recommendation System using RAG Architecture
Recommendation System using RAG ArchitectureRecommendation System using RAG Architecture
Recommendation System using RAG Architecture
 
How to Interpret Trends in the Kalyan Rajdhani Mix Chart.pdf
How to Interpret Trends in the Kalyan Rajdhani Mix Chart.pdfHow to Interpret Trends in the Kalyan Rajdhani Mix Chart.pdf
How to Interpret Trends in the Kalyan Rajdhani Mix Chart.pdf
 
HCL Notes und Domino Lizenzkostenreduzierung in der Welt von DLAU
HCL Notes und Domino Lizenzkostenreduzierung in der Welt von DLAUHCL Notes und Domino Lizenzkostenreduzierung in der Welt von DLAU
HCL Notes und Domino Lizenzkostenreduzierung in der Welt von DLAU
 
UI5 Controls simplified - UI5con2024 presentation
UI5 Controls simplified - UI5con2024 presentationUI5 Controls simplified - UI5con2024 presentation
UI5 Controls simplified - UI5con2024 presentation
 
Nunit vs XUnit vs MSTest Differences Between These Unit Testing Frameworks.pdf
Nunit vs XUnit vs MSTest Differences Between These Unit Testing Frameworks.pdfNunit vs XUnit vs MSTest Differences Between These Unit Testing Frameworks.pdf
Nunit vs XUnit vs MSTest Differences Between These Unit Testing Frameworks.pdf
 
System Design Case Study: Building a Scalable E-Commerce Platform - Hiike
System Design Case Study: Building a Scalable E-Commerce Platform - HiikeSystem Design Case Study: Building a Scalable E-Commerce Platform - Hiike
System Design Case Study: Building a Scalable E-Commerce Platform - Hiike
 
A Comprehensive Guide to DeFi Development Services in 2024
A Comprehensive Guide to DeFi Development Services in 2024A Comprehensive Guide to DeFi Development Services in 2024
A Comprehensive Guide to DeFi Development Services in 2024
 
Energy Efficient Video Encoding for Cloud and Edge Computing Instances
Energy Efficient Video Encoding for Cloud and Edge Computing InstancesEnergy Efficient Video Encoding for Cloud and Edge Computing Instances
Energy Efficient Video Encoding for Cloud and Edge Computing Instances
 
Skybuffer SAM4U tool for SAP license adoption
Skybuffer SAM4U tool for SAP license adoptionSkybuffer SAM4U tool for SAP license adoption
Skybuffer SAM4U tool for SAP license adoption
 
Taking AI to the Next Level in Manufacturing.pdf
Taking AI to the Next Level in Manufacturing.pdfTaking AI to the Next Level in Manufacturing.pdf
Taking AI to the Next Level in Manufacturing.pdf
 
Your One-Stop Shop for Python Success: Top 10 US Python Development Providers
Your One-Stop Shop for Python Success: Top 10 US Python Development ProvidersYour One-Stop Shop for Python Success: Top 10 US Python Development Providers
Your One-Stop Shop for Python Success: Top 10 US Python Development Providers
 
GenAI Pilot Implementation in the organizations
GenAI Pilot Implementation in the organizationsGenAI Pilot Implementation in the organizations
GenAI Pilot Implementation in the organizations
 
Monitoring and Managing Anomaly Detection on OpenShift.pdf
Monitoring and Managing Anomaly Detection on OpenShift.pdfMonitoring and Managing Anomaly Detection on OpenShift.pdf
Monitoring and Managing Anomaly Detection on OpenShift.pdf
 
Presentation of the OECD Artificial Intelligence Review of Germany
Presentation of the OECD Artificial Intelligence Review of GermanyPresentation of the OECD Artificial Intelligence Review of Germany
Presentation of the OECD Artificial Intelligence Review of Germany
 

Esri U.S. Data Fact Sheet

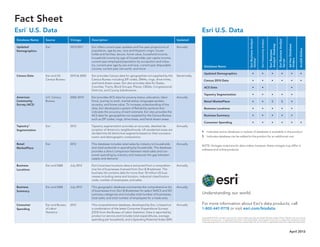
  • 1. For more information about Esri’s data products, call 1-800-447-9778 or visit esri.com/bizdata. Esri U.S. Data Database Name EsriBusinessAnalyst Online SM EsriCommunityAnalyst EsriBusiness Analyst™ Desktop EsriBusinessAnalyst Server AdHocDatabase Orders ArcGISOnline Updated Demographics • • • • • • Census 2010 Data • • • • • • ACS Data • • • Tapestry Segmentation • • • • • Retail MarketPlace • • $ $ • Business Locations • • • • • Business Summary • • • • • Consumer Spending • • • • • • • Indicates entire database or subset of database is available in the product $ Indicates database can be added to the product for an additional cost NOTE: Vintages noted are for data orders; however, these vintages may differ in software and online products. Fact Sheet Esri ® U.S. Data Database Name Source Vintage Description Updated Updated Demographics Esri 2012/2017 Esri offers current-year updates and five-year projections of population, age by sex, race and Hispanic origin, house- holds and families, tenure, home value, household income, household income by age of householder, per capita income, current-year employed population by occupation and indus- try, current-year age by sex and race, current-year disposable income, current-year net worth, and more. Annually Census Data Esri and US Census Bureau 2010 & 2000 Esri provides Census data for geographies not supplied by the Census Bureau including ZIP codes, DMAs, rings, drive times, and hand drawn areas. Esri also provides data for States, Counties, Tracts, Block Groups, Places, CBSAs, Congressional Districts, and County Subdivisions. Decennially American Community Survey (ACS) U.S. Census Bureau 2006-2010 Esri provides ACS data for poverty status, education, labor force, journey to work, marital status, languages spoken, ancestry, and home value. To increase understanding of the data, Esri developed a system of Reliability symbols that indicates the accuracy of each estimate. Esri also provides the ACS data for geographies not supplied by the Census Bureau such as ZIP codes, rings, drive times, and hand-drawn areas. Annually Tapestry™ Segmentation Esri 2012 Tapestry segmentation provides an accurate, detailed de- scription of America’s neighborhoods. US residential areas are divided into 65 distinctive segments based on their socioeco- nomic and demographic composition. Annually Retail MarketPlace Esri 2012 This database includes retail sales by industry to households and retail potential or spending by households. The database provides a direct comparison between retail sales and con- sumer spending by industry and measures the gap between supply and demand. Annually Business Locations Esri and D&B July 2012 Esri’s business locations data is extracted from a comprehen- sive list of businesses licensed from Dun & Bradstreet. The business list contains data for more than 18 million US busi- nesses including name and location, industrial classification code, number of employees, and sales. Annually Business Summary Esri and D&B July 2012 This geographic database summarizes the comprehensive list of businesses from Dun & Bradstreet for select NAICS and SIC summary categories and includes total number of businesses, total sales, and total number of employees for a trade area. Annually Consumer Spending Esri and Bureau of Labor Statistics 2012 This comprehensive database, developed by Esri, is based on a combination of the latest Consumer Expenditure Surveys (CEX) from the Bureau of Labor Statistics. Data is reported by product or service and includes total expenditures, average spending per household, and a Spending Potential Index (SPI). Annually April 2013 Copyright © 2013 Esri. All rights reserved. Esri, the Esri globe logo, Business Analyst, Business Analyst Online, Tapestry, and esri.com are trademarks, service marks, or registered marks of Esri in the United States, the European Community, or certain other jurisdictions. Other companies and products or services mentioned herein may be trademarks, service marks, or registered marks of their respective mark owners.
  • 2. Fact Sheet Esri ® U.S. Data Database Name Source Vintage Description Updated Market Potential Esri and GfK MRI 2012 The Market Potential database includes data representing goods, services, attitudes, and activities and is collected from the Gfk MRI consumer survey. The database provides the expected number of consumers and a Market Potential Index (MPI). Annually 1990 Data in 2000 Geography Esri 1990 To compare 1990 and 2000 data for a given site, Esri created a 1990–2000 block group correspondence file and converted 1990 data in 1990 geography into 1990 data in 2000 geography. Not Updated Traffic Counts Market Plan- ning Solutions Inc. Q1, 2013 Esri’s traffic count data comes from MPSI/DataMetrix and pro- vides the most current and extensive US traffic data for trade analysis, routing, or mathematical modeling. Quarterly Major Shopping Centers Directory of Major Malls, Inc. January 2013 The Major Shopping Centers data from the Directory of Major Malls (DMM) database includes information about shopping centers with a gross leasable area (GLA) of 250,000 square feet or more. Semiannually Bank Branches RPM Consulting 2013 Esri’s Bank Branches database incorporates information from the BranchInfoTM data created by RPM Consulting. Detailed information about every bank location in the US is carefully standardized and address-matched to provide branch-level information by institution and site over a five-year period. Annually Banking Potential RPM Consulting 2012 MarketBankTM data from RPM Consulting is the source of Esri’s Banking Potential database. This information estimates market penetration and potential for 15 savings, investment, and lending products for every block group in the US. Annually Crime Indexes Applied Geographic Solutions 2013A Esri’s Crime Indexes data incorporates information from the AGS national CrimeRisk database that is based on an extensive analysis of several years of crime incidents reported by most US law enforcement jurisdictions. The Crime Indexes database includes standardized indexes for a range of serious crimes against both persons and property. The data is available at multiple geographies down to the block group level. Semiannually Cable Boundaries EMSi/The Janus Group, Inc. Q1, 2013 Esri’s Cable Boundaries geodatabase is based on the MediaPrintsTM cable boundary data from EMSi/The Janus Group, Inc., the premier source for US cable system boundar- ies and data. Information includes data for digital service areas and high-speed Internet access areas. Cable overbuilds and wireless cable systems are represented as separate map- ping layers. Quarterly Employment by Occupation Applied Geographic Solutions 2013A This geographic database provides counts for the daytime working population by 17 specified occupation classifications, plus white- and blue-collar summarizations. Semiannually Esri U.S. Data Database Name EsriBusinessAnalyst Online SM EsriCommunityAnalyst EsriBusiness Analyst™ Desktop EsriBusinessAnalyst Server AdHocDatabase Orders Market Potential • • • • • Census 2000 and 1990 Data • • • • • Traffic Counts • • $ $ • Major Shopping Centers • • • • • Bank Branches $ $ • Banking Potential $ $ • Crime Indexes • • $ $ • Cable Boundaries $ $ • Employment by Occupation $ $ • • Indicates entire database or subset of database is available in the product $ Indicates database can be added to the product for an additional cost NOTE: Vintages noted are for data orders; however, these vintages may differ in software and online products. G58014 4/13ek/ca April 2013 For more information about Esri’s data products, call 1-800-447-9778 or visit esri.com/bizdata. Copyright © 2013 Esri. All rights reserved. Esri, the Esri globe logo, Business Analyst, Business Analyst Online, Tapestry, and esri.com are trademarks, service marks, or registered marks of Esri in the United States, the European Community, or certain other jurisdictions. Other companies and products or services mentioned herein may be trademarks, service marks, or registered marks of their respective mark owners.