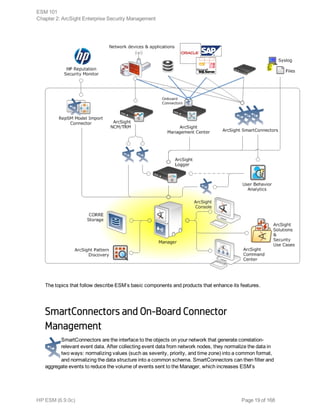
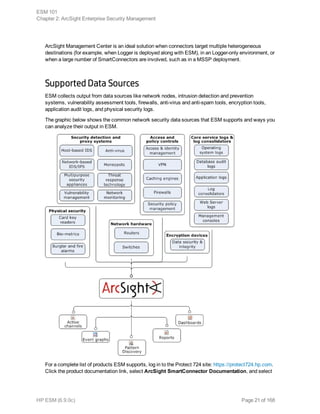
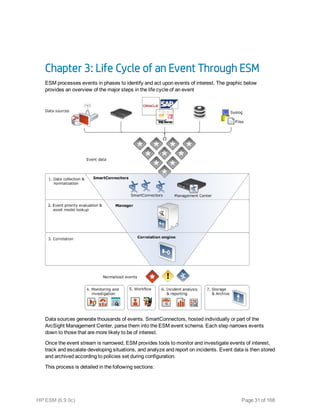
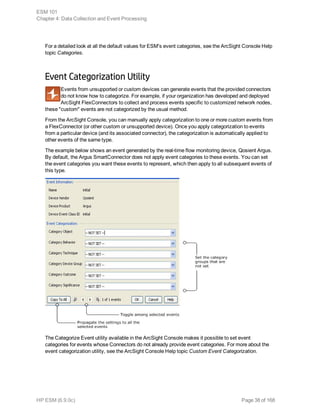
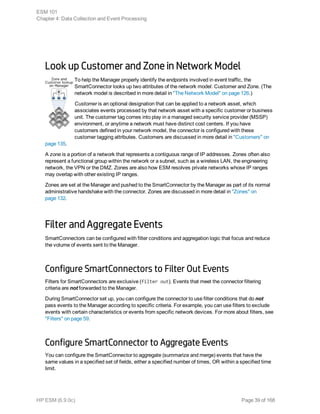
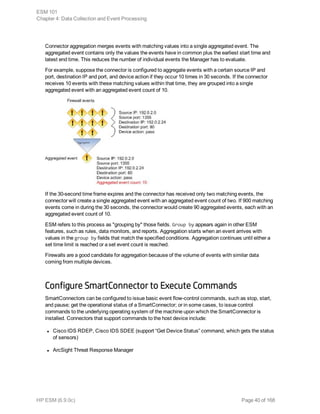
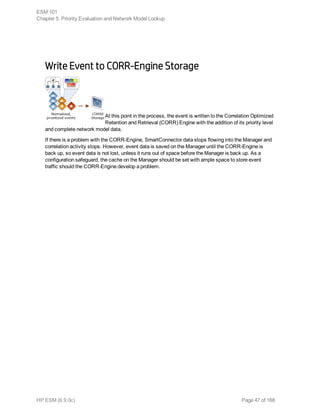
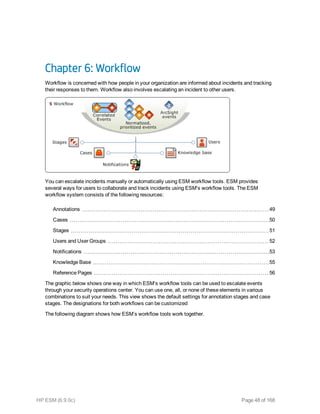
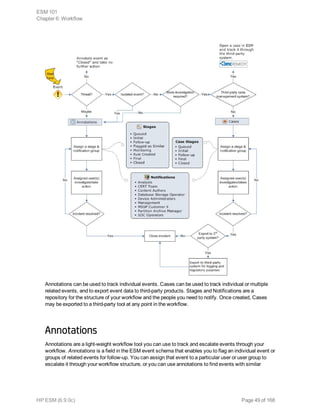
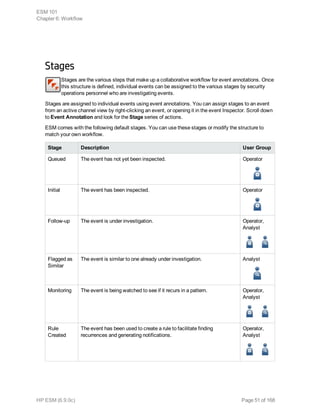
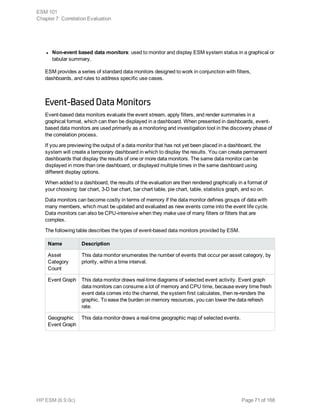
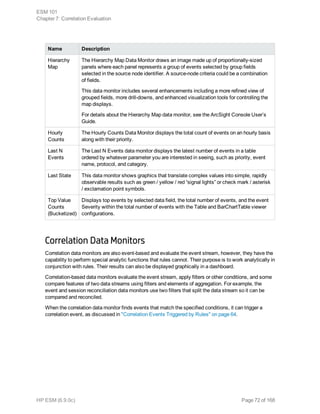
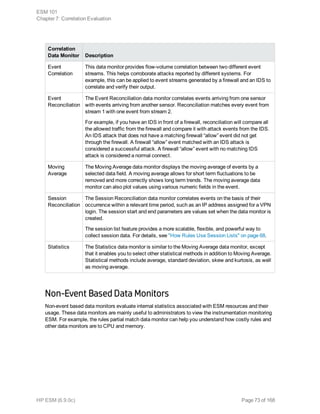
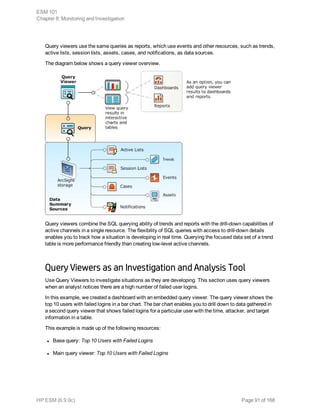
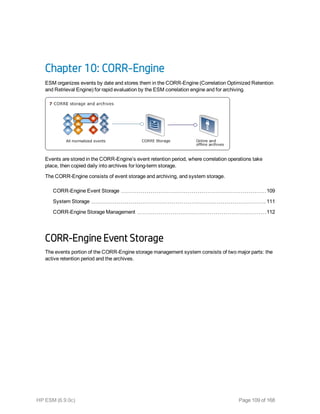
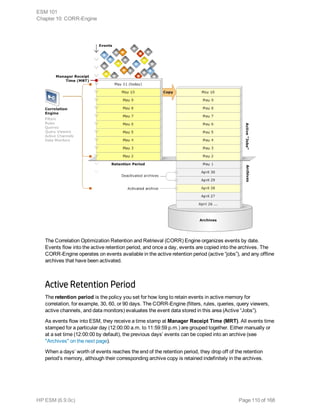
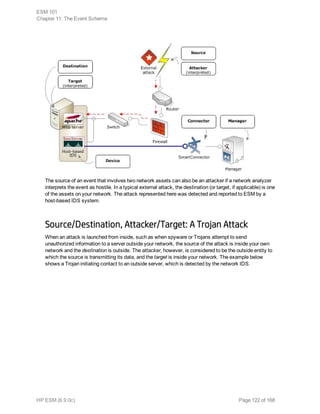
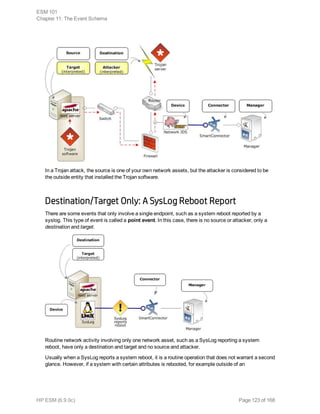
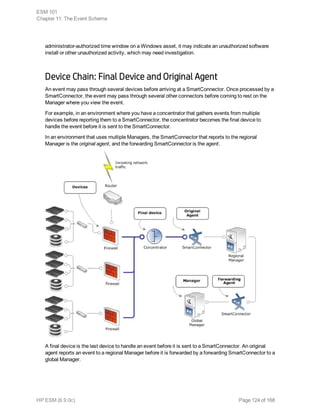
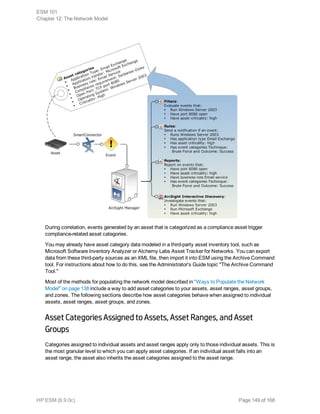
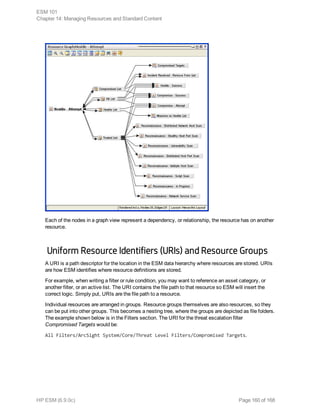
This document provides an overview and introduction to HP ArcSight ESM software. It describes ESM's capabilities for security event monitoring, network intelligence, correlation, anomaly detection, and automated remediation. It also outlines the key components of ESM including the CORR-Engine for high-speed event storage and retrieval, and introduces the various tools and user roles within ESM. The document is intended to provide readers with a basic understanding of how ESM works and how its different functions are used throughout the lifecycle of analyzing and responding to security events.


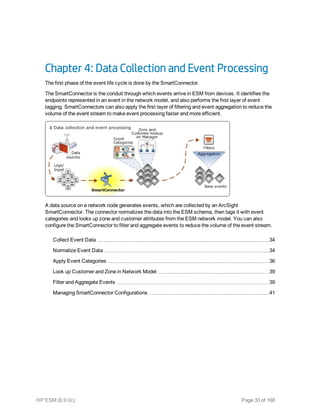
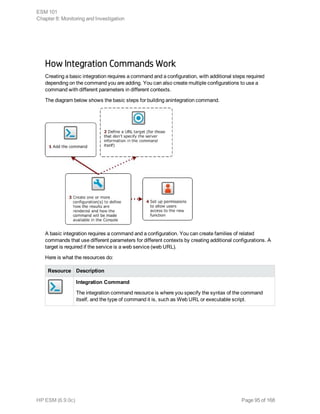
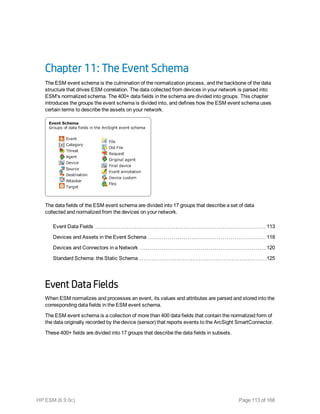
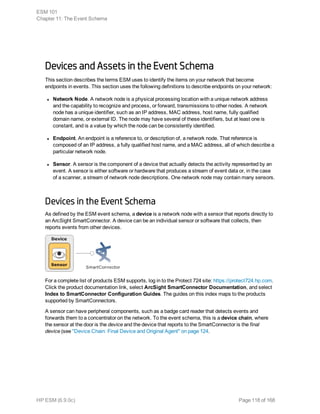
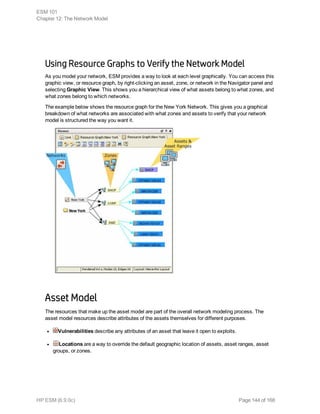
![Collect Event Data
Event collection is the process of gathering information from network nodes on your
network. Network nodes may be primary (such as a firewall or an IDS) or a concentrator
(such as a syslog service, Symantec SESA, or SiteProtector) that gathers data from
multiple similar primary network nodes. Events are then collected from these sources by
ArcSight SmartConnectors.
The data collected is log data generated by the different types of sources on your network.
Each item of the log is translated into one event. How the data reaches the connector
depends on the source that generates the logs.
For example, event data may be retrieved from databases, such as EPO or SiteProtector, or sent as an
event stream via the network, such as syslog or SNMP. In some cases, the data is read from log files,
and in other cases, it is pulled by the connector using proprietary protocols, such as OPSEC (Check
Point) or RDEP (Cisco IDS).
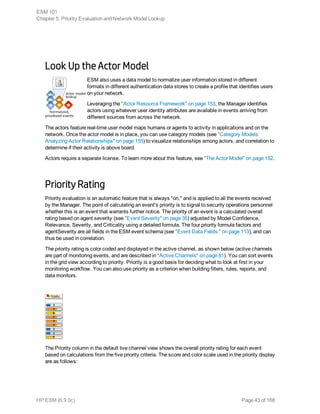
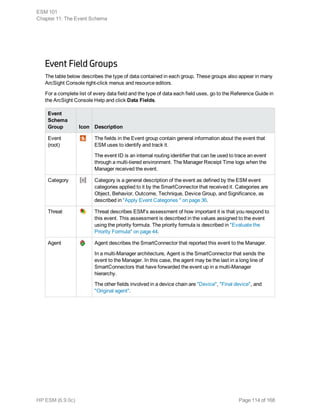
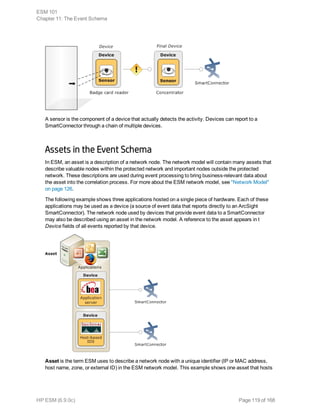
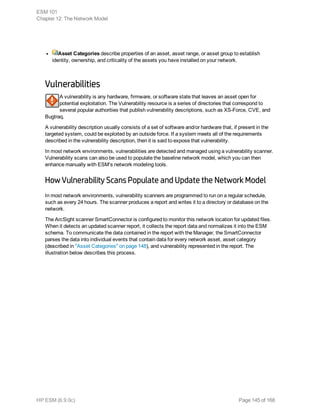
Normalize Event Data
Normalize means to conform to an accepted standard or norm. Because
networks are heterogeneous environments, each device has a different
logging format and reporting mechanism. You may also have logs from
remote sites where security policies and procedures may be different,
with different types of network devices, security devices, operating
systems and application logs. Because the formats are all different, it is difficult to extract information
for querying without normalizing the events first.
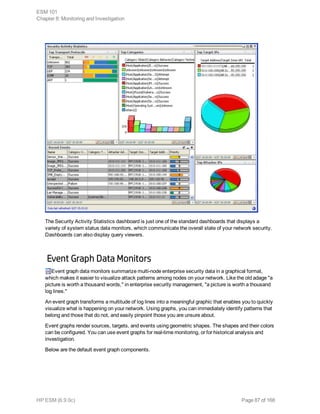
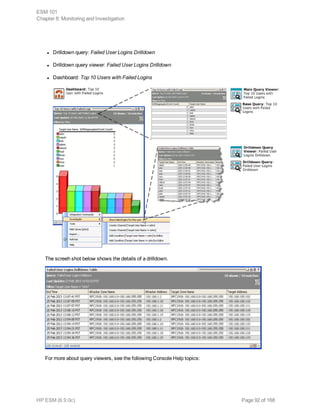
The following examples are logs from different sources that each report on the same packet traveling
across the network. These logs represent a remote printer buffer overflow that connects to IIS servers
over port 80.
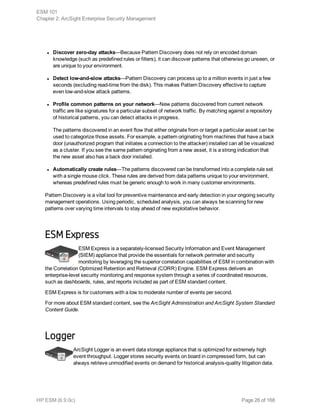
Check Point:
"14" "21Nov2015" "12:10:29" "eth-s1p4c0" "ip.of.firewall" "log" "accept" "www-http"
"192.0.2.0" "192.0.2.1" "tcp" "4" "1355" "" "" "" "" "" "" "" "" "" "firewall" "len
68"
Cisco Router:
Nov 21 15:10:27: %SEC-6-IPACCESSLOGP: list 102 permitted tcp 192.0.2.0(1355) ->
192.0.2.1(80), 1 packet Cisco PIX: Nov 21 2005 12:10:28: %PIX-6-302001: Built
inbound TCP connection 125891 for faddr 192.0.2.0/1355 gaddr 192.0.2.1/80 laddr
10.0.111.22/80
Snort:
[**] [1:971:1] WEB-IIS ISAPI .printer access [**] [Classification: Attempted
Information Leak] [Priority: 3] 11/21-12:10:29.100000 192.0.2.0:1355 ->
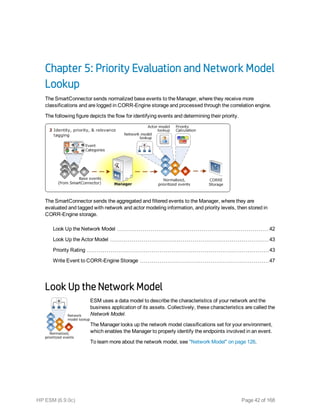
ESM 101
Chapter 4: Data Collection and Event Processing
HP ESM (6.9.0c) Page 34 of 168](https://image.slidesharecdn.com/esm1016-170530070932/85/ESM_101_6-9-0-pdf-34-320.jpg)
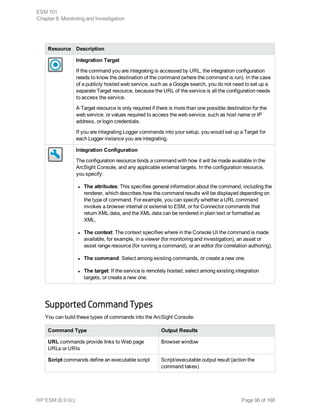
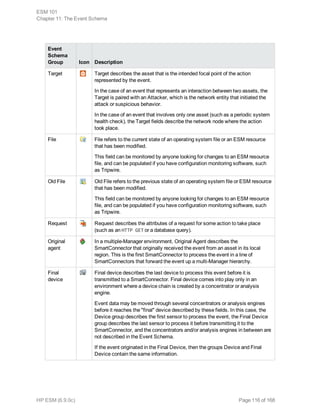
![192.0.2.1:80 TCP TTL:63 TOS:0x0 ID:5752 IpLen:20 DgmLen:1234 DF ***AP*** Seq:
0xB13810DC Ack: 0xC5D2E066 Win: 0x7D78 TcpLen: 32 TCP Options (3) => NOP NOP TS:
493412860 0 [Xref => http://cve.mitre.org/cgi-bin/cvename.cgi?name=CAN-2001-0241]
[Xref => http://www.whitehats.com/info/IDS533]
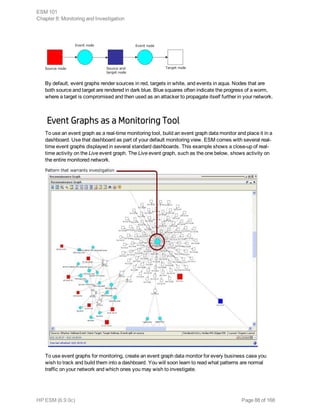
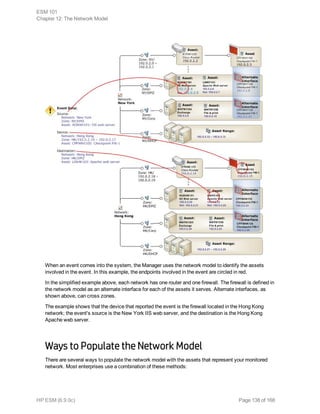
In order to productively store this diverse data in a common data store, SmartConnectors evaluate
which fields are relevant and arrange them in a common schema. The choice of fields are content
driven, not based on syntactic differences between what Checkpoint may call target address and what
Cisco calls destination address.
To normalize, SmartConnectors use a parser to pull out those values from the event and populate the
corresponding fields in the schema. Here is a very simple example of these same alerts after they have
been normalized.
Date Time Event_Name Src_IP
Src_
Port Tgt_IP
Tgt_
Port
Device_
Type
21-Nov-
15
12:10:29 Accept 192.0.2.0 1355 192.0.2.1 80 CheckPoint
21-Nov-
15
12:10:27 List 102 permitted tcp 192.0.2.0 1355 192.0.2.1 80 Cisco
Router
21-Nov-
15
12:10:29 WEB-IIS ISAPI printer
access
192.0.2.0 1355 192.0.2.1 80 Snort
ArcSight refers to an event that has been processed by a SmartConnector or other ESM component
that has gone through this schema normalization as a normalized event. Events that have been
processed by the SmartConnector and are ready to be sent to the Manager are also referred to as base
events. With the data organized, you can pull all records containing a value that is of interest or sort by
any field.
Another factor in normalization is converting timestamps to a common format. Since the devices may
all use different time zones, ESM normalization converts the timestamps to UTC (GMT).
ESM's normalization process captures and delivers to the correlation engine all the relevant security
information collected by the sensors on your network that report to connectors.
As source devices evolve, ArcSight releases regular updates to the connector parsers that perform
normalization into the ESM schema.
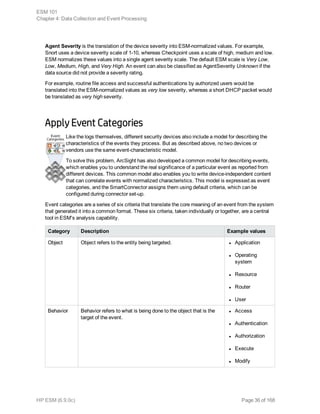
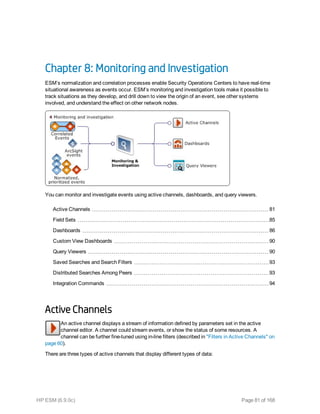
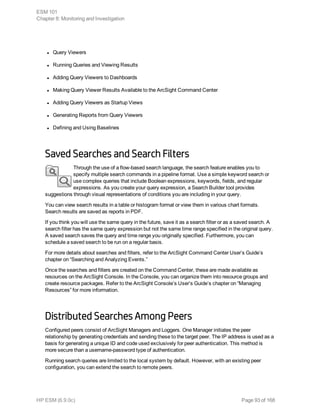
Event Severity
During the normalization process, the SmartConnector collects data about the level of danger
associated with a particular event as interpreted by the data source that reported the event to the
connector. These data points, device severity and agent severity, become factors in calculating the
event's overall priority described in "Evaluate the Priority Formula" on page 44.
Device severity captures the language used by the data source to describe its interpretation of the
danger posed by a particular event. For example, if a network IDS detects a DHCP packet that does
not contain enough data to conform to the DHCP format, the device flags this as a high-priority exploit.
ESM 101
Chapter 4: Data Collection and Event Processing
HP ESM (6.9.0c) Page 35 of 168](https://image.slidesharecdn.com/esm1016-170530070932/85/ESM_101_6-9-0-pdf-35-320.jpg)


![[2.3] Large enterprise SIEM: get ready for oversize - Svetlana (Mona) Arkhipova](https://cdn.slidesharecdn.com/ss_thumbnails/2-150301071201-conversion-gate02-thumbnail.jpg?width=640&height=640&fit=bounds)