Download to read offline
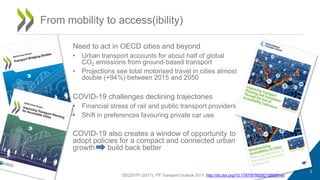
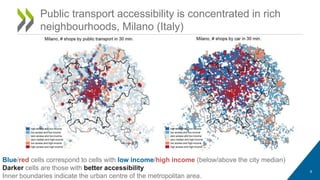
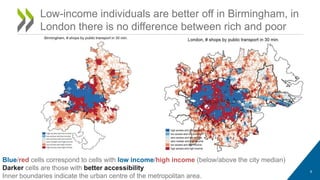

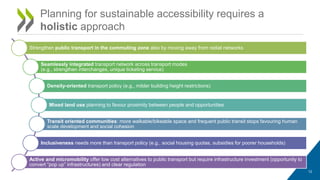
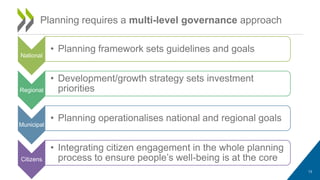

The document discusses sustainable mobility in cities, highlighting that urban transport accounts for about half of global CO2 emissions and predicting a significant increase in motorized travel by 2050. It emphasizes the inequalities in public transport accessibility, which often favors wealthier neighborhoods, and advocates for a holistic planning approach that includes enhancing public transport and mixed land use to promote inclusivity. The report also stresses the importance of citizen engagement and multi-level governance in urban planning processes.

![Implementing TOD [To Scale] [For All]](https://cdn.slidesharecdn.com/ss_thumbnails/lucnadaltt2017todscreen-170120143550-thumbnail.jpg?width=640&height=640&fit=bounds)


