Download as PDF, PPTX


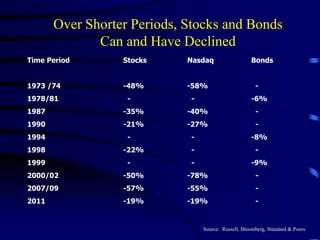
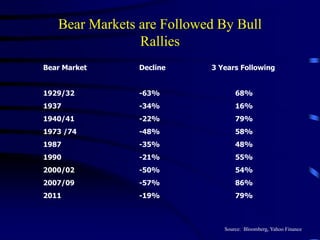


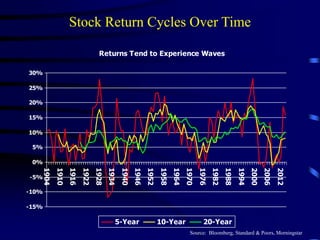
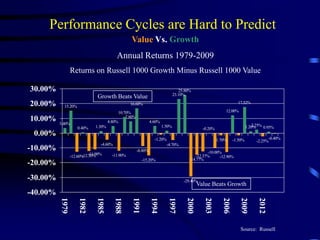


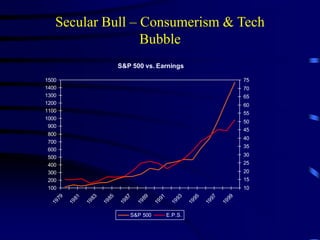
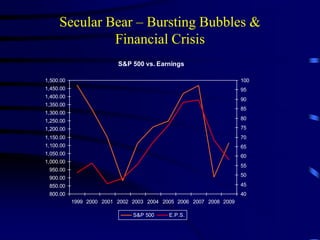
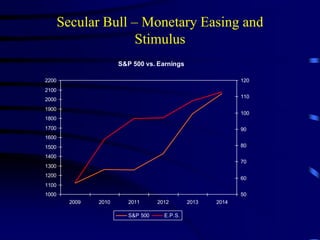

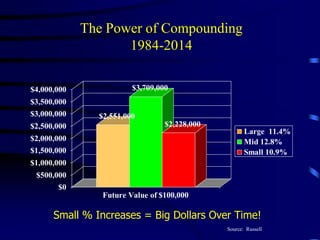


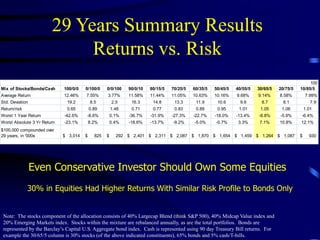


This document contains multiple charts and graphs showing the historical performance of various asset classes including stocks, bonds, and cash over different time periods from the 1970s to 2014. The key information provided is that stocks have consistently outperformed other asset classes over long periods of time, though they also experience greater short-term volatility. Maintaining a long-term investment strategy with a balanced mix of stocks, bonds, and cash tailored to an individual's risk tolerance provides the best chance of achieving financial goals.


