Eops 2015 9_21
•
0 likes•267 views

Air temperatures are warm and Puget Sound continues to show record high water temperatures. Some rain has returned to our region, yet river flows remain unusually low. Puget Sound is saltier than normal allowing oxygen-rich surface waters to more easily mix to greater depths. Lower oxygen was measured only in the Coastal Bays, Hood Canal, and South Sound. Large jellyfish aggregations continue in South Sound, the Kitsap Peninsula, and East Sound (Orcas Island). Sediment plumes in Bellingham Bay form unique patterns. Warm waters and sunny conditions fostered green tides, raising a stink along some local beaches.

Recommended
More Related Content
What's hot
What's hot (19)
Viewers also liked
Similar to Eops 2015 9_21
More from Christopher Krembs
Recently uploaded
Recently uploaded (20)
Eops 2015 9_21
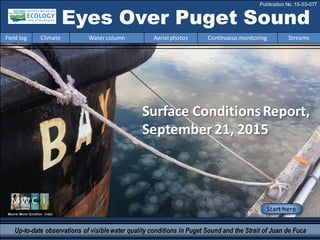
- 1. Marine Water Condition Index Start here Surface ConditionsReport, September 21, 2015 Up-to-date observations of visiblewater quality conditions in Puget Sound and the Strait of Juan de Fuca Eyes Over Puget Sound Field log Climate Watercolumn Aerial photos Continuous monitoring Streams Publication No. 15-03-077
- 2. Personalfield log p. 3 Green tides cancause a rottenegg smell onbeaches. Climateconditions p. 4 Air temperature andoceanconditions remainwarm. Precipitationhas increased, yet river flows remainunusually low. Upwellinghas beennormal while sea surface temperatures are high. Watercolumn p. 5 Puget Sound waters continue to have recordhightemperatures. Ongoing drought effects (lower freshwater inputs)shift salinity to higher than normal levels. Coastal Bays,HoodCanal,and SouthSound exhibit lower oxygen. Aerialphotography p. 10 Large jellyfish aggregations are visiblein some finger inlets of SouthSound, inlets of the Kitsap Peninsula, and East Sound (Orcas Island). Algae blooms present inSouth Soundand Kilisut Harbor. Nooksack andStillaguamishriver plumes carry soil. Continuous monitoring p. 35 At the Mukilteo mooring,watertemperature remains warmer than past five years,salinity is about normal,and dissolved oxygendeclines slightly. Streams p. 39 The Skagit River delivers less freshwaterto Puget Soundin the summer. LONG-TERMMARINEMONITORINGUNIT Skip Albertson Dr. Christopher Krembs Julia Bos Suzan Pool Editorial assistanceprovided by: Suzan Pool, Laura Hermanson, CarolMaloy Marine conditionsfrom 9-21-2015at a glance Field log Climate Watercolumn Aerial photos Continuous monitoring Streams Mya Keyzers Laura Hermanson Markus von Prause
- 3. Informationon Hydrogen Sulfide from the Washington Department ofHealth: http://www.doh.wa.gov/CommunityandEnvironment/Contaminants/HydrogenSulfide Algal Mats and Human Health Personal Field Impression Field log Weather Watercolumn Aerial photos Continuous monitoring Streams Personal Field Impression Field log Climate Watercolumn Aerial photos Continuous monitoring Streams During the summer, boaters and beachgoers may see large islands of green algae on the water and on the beach. These algal mats may contain a menagerie of seaweed, seagrass, eelgrass, and debris. The “green tides” can be a visible sign of eutrophication in coastalenvironments which then negatively effect water quality. The algal mats can also impact human health. When the algae decompose, they give off hydrogen sulfidegas, which is an irritant and a chemical asphyxiant(causing breathing difficulty). Itcan lead to headaches, fatigue, dizziness, and poor memory. If you smell rotten eggs at the beach, it might be fromgreen tides. Algalmats decomposing on the beach cansmell like rotten eggs. Boaters beware!Floatingalgal mats can also trap debrissuch as logs.
- 4. Field log Climate Watercolumn Aerial photos Continuous monitoring Streams Natural Influencesleadingto 9-21-2015 Summary: Air temperatures haveremained warmer than normal across western Washington since March of 2014. Precipitation levels were generally abovenormal in western Washington during August; rain was episodic. Sunshine has generally been abovenormal. River flows arebelow normal, especially for the Fraser and Skagitrivers to the north. Upwelling has returned to normal and the PDO remains in the warm phase. Climate and naturalinfluences,includingweather,rivers,and the adjacent ocean,canaffect our marine waters. Graphics are basedonprovisional data andare subject to change. http://www.ecy.wa.gov/programs/eap/mar_wat/weather.html,page 26. Putting the puzzle piecesof influencing factorstogether… lowerhigher expected No data*Upwelling Anomalies (PFEL) *
- 5. We usea chartered float plane and boat to access our monthly monitoring stations. We communicate data and environmentalmarine conditions using: 1. Marine Water Condition Index (MWCI) 2. Eyes OverPuget Sound (EOPS) 3. Anomaliesand sourcedata Field log Climate Watercolumn Aerial photos Continuous monitoring Streams Ourlong-termmarinemonitoringstationsinWashington Starthere Isl. .
- 6. Field log Climate Watercolumn Aerial photos Continuous monitoring Streams UnusualPugetSoundconditionsexplained In2014, a massive pool of warmwater developedinthe NE Pacific (the Blob). Duringthe summer of 2014,Blobwaters were held offshore by the process of upwelling,as northerly winds movedsurface watersoffshore to be replacedby cooler upwelledwater. This bufferedthe coast. Inthe fall of 2014,northerly winds subsided and the Blobmoved onshore,entering Puget Sound on a massive scale. Fraser River is the largest freshwater source for the Salish Sea - significantlyaffectingestuarine circulation Higherthan normal Lower thannormal Expected As of Aug 2015 (left), the Blobis sitting offshore, separatedfrom the coast by a thin band of cooler,upwelled water,like in summer of 2014. Estuarine circulationis now weak since the snowpack-starved rivers have recordlow flows. This reduces chances tobringcool, upwelledoceanwaterinto Puget Sound. The freshet of the FraserRiver and other rivers flowinginto Puget Sound came much earlier due to the mild winter, resulting in below normal flows. Water that is inPuget Sound will therefore remainlonger. That means more warming and, potentially,anaccumulationof pollutants. Credit: Christopher Krembs 0 2000 4000 6000 8000 10000 12000 Dec-13 Jan-14 Feb-14 Mar-14 Apr-14 May-14 Jun-14 Jul-14 Aug-14 Sep-14 Oct-14 Nov-14 Dec-14 Jan-15 Feb-15 Mar-15 Apr-15 May-15 Jun-15 Jul-15 Aug-15 Discharge(m3s-1) Source: http://wateroffice.ec.gc.ca/index_e.html
- 7. Physical conditionstracked in historicalcontext Field log Climate Watercolumn Aerial photos Continuous monitoring Streams Higher Temperature! ExpectedOxygenHigher Salinity Is lower oxygen in HoodCanal andSouth Sound due to lack of water exchange? Explore profiles at all stations August temperaturesare still at record-breakinghighs. Ongoingdrought effects (lower freshwaterinputs) shift salinity to higher than normal levels. Coastal Bays,HoodCanal,andSouthSoundexhibit lower oxygen.
- 8. a) PacificDecadalOscillationIndex(PDO,temperature) (explanation) b) UpwellingIndex(anomalies)(Upwelling,low oxygen) (explanation) c) NorthPacificGyreOscillationIndex(NPGO, productivity) (explanation) Field log Climate Watercolumn Aerial photos Continuous monitoring Streams Theoceanaffectswaterquality: OceanClimateIndices NPGO(x10) PDO/UpwellingIndex Three-year running average of PDO, Upwelling, and NPGO indices scores . Ocean boundaryconditions are in transition: (a)water is warm (PDO), (b) upwellingoflow oxygen and high nutrient ocean water is expected (UpwellingIndex), and (c) higher surface productivityalongthe coast (NPGO) is expected. Where are we headingnext? -25 -20 -15 -10 -5 0 5 10 15 20 25 -1.5 -1 -0.5 0 0.5 1 1.5 1945 1950 1955 1960 1965 1970 1975 1980 1985 1990 1995 2000 2005 2010 2015
- 9. Is the food web changing in Puget Sound? Followthe experts WebEx Hypothesis! Increasesin nitrate concentrations could be caused by a top-down controlon phytoplankton biomass. Is Noctiluca a visible harbingerof a food web change? Hypothesis for combining a series of recent observations affecting energy and material transfer to higher trophic levels Are changesin highertropic levelspart of a story of the lowerfood web?
- 10. Summary: Aerial photography9-21-2015 Largejellyfish aggregations arein some finger inlets of South Soundand present in inlets of the Kitsap Peninsula and EastSound (Orcas Island). Phytoplankton blooms in colors of red- brown in South Sound. Brown bloom was in Kilisut Bay. Occasionalalgal mats drift in Central Sound and Samish Bay. Nooksack and Stillaguamish river plumes carry sediment. Field log Climate Water column Aerial photos Continuous monitoring Streams Start here Mixing and Fronts: Fronts visible around river plumes. Debris: Occasionalmats in Central Sound and Samish Bay. Visible blooms: Green-brown: Quartermaster Harbor. Red-brown: Eld, Budd, and Henderson Inlets. Brown: Kilisut Harbor, MarrowstoneIsland. Jellyfish: Very abundant and largejellyfish patches in southern inlets of South Sound (Budd and Eld Inlets), Sinclair Inlet, and EastSound (Orcas Island). BloomDebrisFront Suspendedsediment: Suspended sediments with brownish color suggestsoil in Nooksack and Stillaguamish River plumes. SkagitRiver with glacial flour. Plume Greetedin the morning by moonjellyfish Algal bloominQuartermaster Harbor
- 11. Strait of Juan de Fuca San Juan Islands Padilla Bay Main Basin Hood Canal SouthSound Whidbey Basin Field log Climate Water column Aerial photos Continuous monitoring Streams Observation Maps: Good visibilityin North Sound, broken clouds in South Sound. Flight Information: 11 10 Aerial photography and navigation guide Central and NorthSound South Sound 7 5 Flight route 9 18 3 2 1 4 14 19 16 15 20 8 Tide data (Seattle): Time Pred High/Low 04:59 AM 0.96 L 12:13 PM 9.51 H 05:50 PM 6.82 L 11:02 PM 8.86 H 17 6 13 12
- 12. Large patches of moon jellyfishmixedin with red-brown bloom. Reflections and shadow of cloud. Location: Budd Inlet (South Sound),10:21 AM. 1 Aerial photography 9-21-2015 Navigate Field log Climate Watercolumn Aerial photos Continuous monitoring Streams Bloom boat jellyfish jellyfish jellyfish jellyfishjellyfish jellyfish jellyfish cloud reflections cloud shadow jellyfish
- 13. jellyfish boat jellyfish jellyfish jellyfish 2 NavigateAerial photography 9-21-2015 Field log Climate Watercolumn Aerial photos Continuous monitoring Streams Numerous patches of jellyfishin water containing red-brown algal bloom. Location: Priest Point Park, Budd Inlet (South Sound),10:22 AM. Bloom logs jellyfish boat jellyfish jellyfish jellyfish jellyfish jellyfish jellyfish jellyfish cloud reflections
- 14. 3 NavigateAerial photography 9-21-2015 Large jellyfishpatches in water containing fading red-brown algal bloom. Location: Eld Inlet (South Sound), 10:24 AM. Field log Climate Watercolumn Aerial photos Continuous monitoring Streams Bloom jellyfish jellyfish jellyfish boat boat boat jellyfish jellyfish cloud reflections cloud reflections shadow
- 15. 4 Navigate Field log Climate Watercolumn Aerial photos Continuous monitoring Streams Aerial photography 9-21-2015 Numerous large patches of jellyfishin water of turquoise color. Location: SinclairInlet (Central Sound), 10:46 AM. boat jellyfish jellyfish jellyfish jellyfish jellyfish jellyfish
- 16. 5 NavigateAerial photography 9-21-2015 Field log Climate Watercolumn Aerial photos Continuous monitoring Streams Mixing of water containing different colors due to algae bloom. Location: Off Illahee State Park, Port Orchard (Central Sound),10:50 AM. Bloom boat cloud shadow cloud shadow
- 17. Greenishalgae bloom and fish pen. Location: Port Gamble (Central Sound),11:00 AM. 6 NavigateAerial photography 9-21-2015 Field log Climate Watercolumn Aerial photos Continuous monitoring Streams boat Bloom fishpen
- 18. Northern end of brown algal bloom bordering clearer water with a view to bottom. Location: Kilisut Harbor,Marrowstone Island (Central Sound),11:09 AM. 7 NavigateAerial photography 9-21-2015 Field log Climate Watercolumn Aerial photos Continuous monitoring Streams Bloom Bloom
- 19. Greenishalgal bloom in westernportion of Penn Cove. Location: Off Fort Ebey State Park, Penn Cove (South Sound), 11:50 AM. 8 NavigateAerial photography 9-21-2015 Field log Climate Watercolumn Aerial photos Continuous monitoring Streams Bloom boatboat
- 20. A. B. Coastal erosion and suspended sediment near cliffs along shoreline. Location: A. Off Fort Ebey State Park, B. West Hastie Lake Road,WhidbeyIsland (North Sound),11:52 AM. 9 NavigateAerial photography 9-21-2015 Field log Climate Watercolumn Aerial photos Continuous monitoring Streams suspendedsediment suspendedsediment kelp kelp ship kelp
- 21. 10 NavigateAerial photography 9-21-2015 Signs of a red-brown bloom mixedwith a greenishbloom. Location: Mud Bay, Lopez Sound (North Sound), 11:59 AM. Field log Climate Watercolumn Aerial photos Continuous monitoring Streams Bloom cloud shadow
- 22. Plume 11 NavigateAerial photography 9-21-2015 Sediment-richwater of the Nooksack River flowing across “the Portage” during high tide. Location: Portage Bay,BellinghamBay(North Sound),12:57 PM. Field log Climate Watercolumn Aerial photos Continuous monitoring Streams boat Plume “the Portage”
- 23. Sediment-richplume of the Nooksack River with a brown hue discharging into Bellingham Bay. Location: Portage Bay,BellinghamBay(North Sound),12:57 PM. 12 Navigate Field log Climate Watercolumn Aerial photos Continuous monitoring Streams Aerial photography 9-21-2015 ship Plume dust on lens
- 24. boat boat Boat wake shows thin sediment-richlayer at surface. Front and water carrying glacial flour off Lummi Island. Location: Off Portage Island,BellinghamBay(North Sound),12:58 PM. 13 NavigateAerial photography 9-21-2015 Field log Climate Watercolumn Aerial photos Continuous monitoring Streams Debris Plume Plume
- 25. Bands of internal waves form near surface of thin sediment-richsurface layer. Location: BellinghamBay(North Sound), 1:21 PM. 14 Navigate Field log Climate Watercolumn Aerial photos Continuous monitoring Streams Aerial photography 9-21-2015 plane shadow Plume internal waves dust on lens
- 26. Debris 15 Navigate Field log Climate Watercolumn Aerial photos Continuous monitoring Streams Water discolored by glacial flour and distinct front that carries organic debris. Location: Off Carter Point,Lummi Island,Bellingham Bay(North Sound), 1:22 PM. Aerial photography 9-21-2015 Plume
- 27. Bloom Debris 16 Navigate Sediment-richwater and tidal fronts with organic debris mixingwith clearer water. Location: Hat Island,Guemes Channel (North Sound),1:27 PM. Aerial photography 9-21-2015 Field log Climate Watercolumn Aerial photos Continuous monitoring Streams boat boat boat ship
- 28. Bloom boat 17 Navigate Field log Climate Watercolumn Aerial photos Continuous monitoring Streams Bright green algal bloom in a disconnected slough. Location: Northern end ofSwinomish Channel (North Sound),1:30 PM. Aerial photography 9-21-2015 dust on lens
- 29. boat boat Patches of sediment-richwater with glacial flour of the Skagit River bordered with organic debris. Location: Off Goat Island,Skagit Bay(Central Sound),1:34 PM. 18 Navigate Field log Climate Watercolumn Aerial photos Continuous monitoring Streams Aerial photography 9-21-2015 Debris Debris Plume Plume Plume dust on lens
- 30. 19 Navigate Field log Climate Watercolumn Aerial photos Continuous monitoring Streams Brownish sediment-richplume of the StillaguamishRiver flowing into Port Susan. Location: Port Susan,WhidbeyBasin (Central Sound), 2:10 PM. Aerial photography 9-21-2015 Plume dust on lens
- 31. boat boat jellyfish Bloom 20 Navigate Red-brown algal bloom and jellyfishpatches. Location: Henderson Inlet, (South Sound), 4:02 PM. Aerial photography 9-21-2015 Field log Climate Watercolumn Aerial photos Continuous monitoring Streams jellyfish raft jellyfish jellyfish boat dust on lens
- 32. Numbers on map refer to picture numbers for spatial reference Date: 9-21-2015 Central Sound Aerial photography observations in Central SoundQualitative aerial observer map during transit Navigate Field log Climate Water column Aerial photos Continuous monitoring Streams Numbers on map refer to picture numbers for spatial reference North Sound/SanJuan Islands 19 North Sound/SanJuan IslandsCentral Sound 104 5 6 89 11 12 13 14 15 16 17 18 7
- 33. Date: 9-21-2015 Qualitative aerial observer map during transit Numbers on map refer to picture numbers for spatial reference Navigate Field log Climate Water column Aerial photos Continuous monitoring Streams South Sound 12 3 20
- 34. Legendto map annotations Comments: Maps are producedby observers during and afterflights. They are intendedto give an approximate reconstructionofthe surface conditions onscales that connect to and overlapwithsatellite images in the sectionthat follows. Debris: Debris canbe distinguished into natural and anthropogenic debris floatingat the surface sensu Moore andAllen (2000). The majority of organic debris in Puget Sound is natural and mixedwith discardedman-made pieces of plastic,wood,etc. Fromthe plane,we cannot differentiatethe quality of debris at the surface and therefore,call it forreasons of practicality just “debris”. S.L. Moore,M. J. Allen. 2000. Distribution of Anthropogenic and Natural Debris on the Mainland Shelf of the Southern California Bight. Marine Pollution Bulletin,40(1): 83–88. Navigate Field log Climate Watercolumn Aerial photos Continuous monitoring Streams
- 35. Field log Climate Watercolumn Aerial photos Continuous monitoring Streams Continuousmonitoring 9-21-2015 Data are not available for this time period. Look for themnext month. No oxygensensor on the shallow instrument package. 2-6 m depth These plots show the probability of observations over the pasttwo-week period. High probability shown in warmcolors. Left Panels: Density is defined by salinity and temperature. Right Panel: Dissolved oxygen concentration in relation to salinity. 12-16 m depth Summary: The Mukilteo mooring station continues to havemonthly water temperature that is higher than the pastfive years. Mean daily temperatureand salinity are becoming more variable. River flows remain low and minimal.
- 36. Field log Climate Watercolumn Aerial photos Continuous monitoring Streams Continuousmonitoring 9-21-2015 In September, water temperature remains warmer than the pastfive years, salinity is about normal, and dissolved oxygen declines slightly. Seasonality of each parameter remains apparent. Please note that data are provisional. Data are in GMT.
- 37. Our mooring station in Mukilteo is located in Whidbey Basin near Everett. Itis also located at the transition between Possession and Central Sounds at a depth that is influenced by the Skagitand Snohomish River discharges, prevailing winds, and tidal mixing. As the largestregional contributor of freshwater to Puget Sound, understanding the timing and magnitude of the Skagit River flow is important. Southerly winds coincided with increased river flows. We presentdaily means for the past31 days. Data are plotted in Pacific Standard Time. Wind data are fromPaine Field in Everett. River flow data are fromUSGS. Click on icon to view real-time data of the moorings Field log Climate Watercolumn Aerial photos Continuous monitoring Streams Continuousmonitoring 9-21-2015
- 38. Changesin the flows of the SkagitRiver Field log Climate Water column Aerial photos Continuous monitoring Streams The Skagit River changes when it delivers its freshwater to Puget Sound According to the SkagitClimate Science Consortium, changes in temperature and precipitation will alter the hydrologic behavior of the SkagitRiver by the late 21st century. 0 5000 10000 15000 20000 25000 30000 Discharge(CFS) Mean of daily mean values for each day for 44 - 46 years of record in, ft3/s (Calculation Period 1942-10-01 -> 2015-09-30) WY 2015 CFS Minimum of daily mean values for each day for 44 - 46 years of record in, ft3/s (Calculation Period 1942-10-01 -> 2015-09-30) The Skagit River contributes 20% of all the freshwater entering Puget Sound. • In spring, 2015 river flows (black line) were much abovehistorical mean daily values (blue line). • Starting in June, flows decreased below historical averages butdid not reach record lows (red line). Mean daily values 1942-2015 2015 Water Year discharge(CFS) Minimum daily mean value 1942-2015 Ecology’s Riverand Stream MonitoringProgram measureswater qualityof the Skagit Riversince the 1940’s at two sites (03A060) (04A100).
- 39. What will the flows of the Skagit River look like Field log Climate Water column Aerial photos Continuous monitoring Streams Easton Glacier photographedin 2011. Easton Glacier photographedin 1912. Hydrographs of projected monthly stream flows (CFS) on the SkagitRiver at Mt. Vernon. Warmer temperatures and a higher proportion of winter precipitation falling as rain, rather than stored as snow, will reduce the amountof water stored as snow in the Skagit Basin overall. The retreat and loss of the glaciers (e.g., Easton Glacier) will continue to effect summertime low flows (400 billion gallons of reduced water supply since 1993) in the SkagitRiver basin. Simulations for the historical (blue), the 2020s (yellow), the 2040s (green) and the 2080s (red).Source : Skagit Climate Science Consortium,
- 40. Accessmooring data: ftp://www.ecy.wa.gov/ea p/Mooring_Raw/Puget_S ound/ Continuous monitoring : Suzan.Pool@ecy.wa.gov Get data from Ecology’sMarine MonitoringPrograms Long–Term MonitoringNetwork Real–Time Sensor Network Accesscore monitoringdata: https://fortress.wa.gov/ec y/eap/marinewq/mwdata set.asp christopher.krembs@ecy.w a.gov Ecology’s long-termmarine monitoring stations Continuous track Field log Climate Watercolumn Aerial photos Continuous monitoring Streams Riverand Stream WaterQuality Monitoring http://www.ecy.wa.gov/programs/eap/fw_riv /rv_main.html Discontinued (fundingcuts)
- 41. You may subscribe or unsubscribe to the Eyes Over Puget Sound email listservby going to: http://listserv.wa.gov/cgi-bin/wa?A0=ECOLOGY-EYES-OVER-PUGET-SOUND Many thanks to our business partners: Clipper Navigation,SwantownMarina,andKenmore Air. We are looking forfeedbackto improve ourproducts. Dr. ChristopherKrembs christopher.krembs@ecy.wa.gov Marine Monitoring Unit EnvironmentalAssessment Program WA Department of Ecology Field log Climate Water column Aerial photos Continuous monitoring Streams