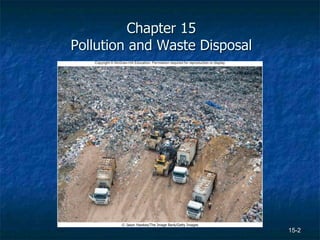
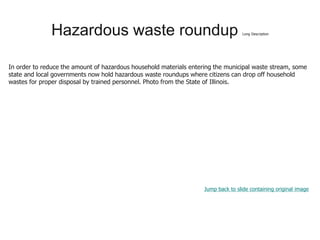
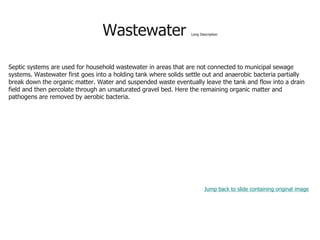
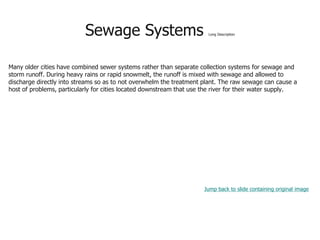
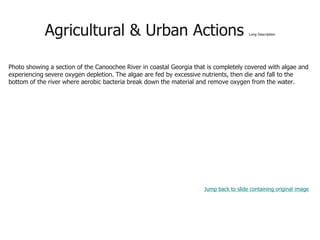
The document discusses various topics related to pollution and waste disposal, including:
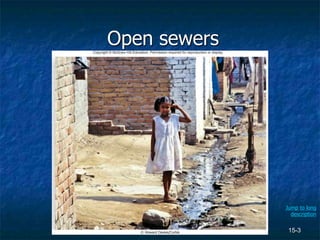
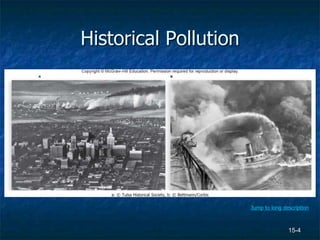
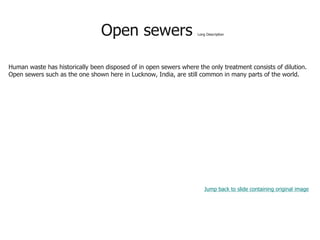
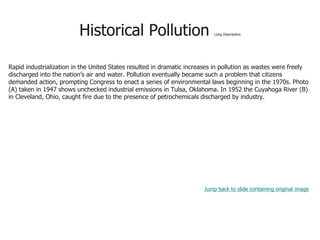
- Historical practices of open sewers and unchecked industrial pollution.
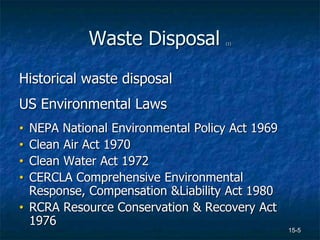
- Key US environmental laws passed in the 1960s-1980s to regulate pollution.
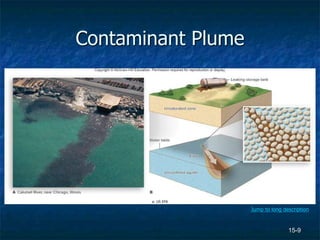
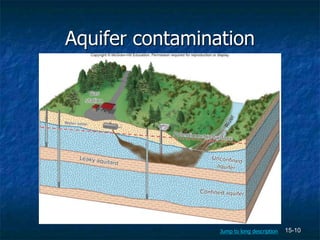
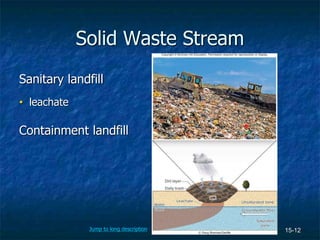
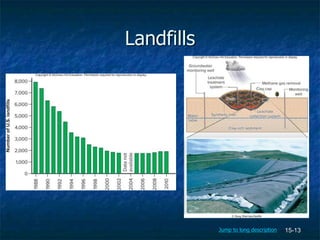
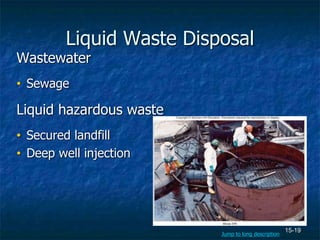
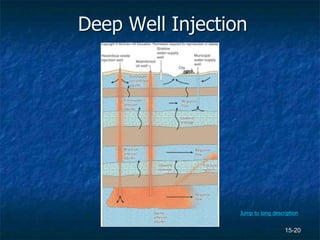
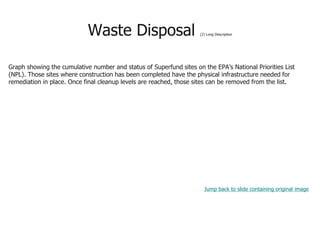
- Modern landfill designs that include liners and leachate collection to prevent groundwater contamination.
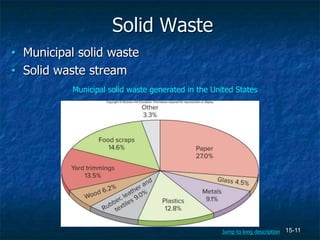
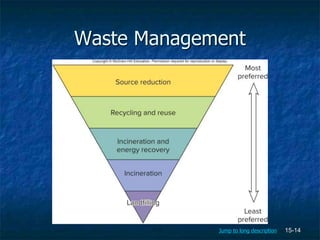
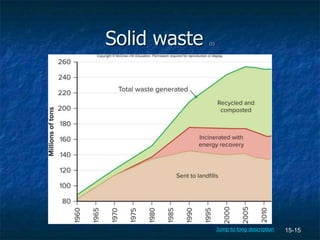
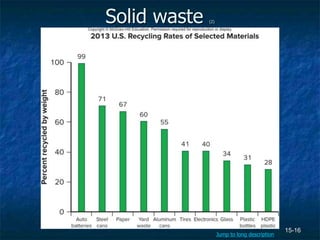
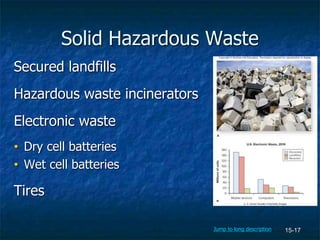
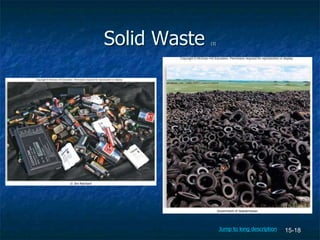
- Efforts to reduce solid waste through recycling, composting, and waste-to-energy incineration.