Engagement Metrics March 2012
•Download as PPTX, PDF•
0 likes•201 views

The document provides analytics data for the Absolute Radio Network across multiple platforms from 2009 to 2012. It shows trends in key metrics such as mobile app installs and usage, online visitors and traffic, social media followers and engagement, and radio listenership over time. Overall, the data demonstrates growth in the network's digital presence and audience while its broadcast radio reach and hours remained relatively stable.

More Related Content
What's hot
What's hot (19)
Viewers also liked
Viewers also liked (14)
Similar to Engagement Metrics March 2012
Similar to Engagement Metrics March 2012 (20)
More from Absolute Radio
More from Absolute Radio (15)
Recently uploaded
Recently uploaded (20)
Engagement Metrics March 2012
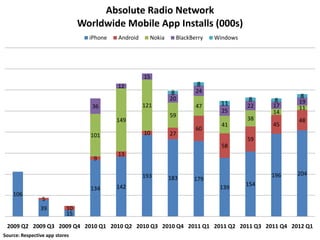
- 1. Absolute Radio Network Worldwide Mobile App Installs (000s) iPhone Android Nokia BlackBerry Windows 15 12 8 8 24 20 8 8 11 8 19 36 121 47 22 17 11 25 14 59 149 38 48 41 45 60 101 10 27 59 58 13 9 193 196 204 183 179 142 154 134 139 106 5 39 10 15 2009 Q2 2009 Q3 2009 Q4 2010 Q1 2010 Q2 2010 Q3 2010 Q4 2011 Q1 2011 Q2 2011 Q3 2011 Q4 2012 Q1 Source: Respective app stores
- 2. Absolute Radio Network Worldwide Mobile App Usage Active Users (000s) Sessions (millions) 332 313 306 304 279 2.42 268 269 2.25 259 259 2.18 246 2.08 1.97 1.92 1.86 219 219 1.88 1.76 1.80 1.61 1.57 Jul 2011 Jul 2011 Dec 2011 May 2011 Jun 2011 Jun 2011 May 2011 Jan 2012 Dec 2011 Aug 2011 Sep 2011 Apr 2011 Aug 2011 Sep 2011 Jan 2012 Apr 2011 Oct 2011 Feb 2012 Mar 2012 Feb 2012 Mar 2012 Nov 2011 Oct 2011 Nov 2011 * * Sources: Spodtronic and Flurry *March Spodtronic data estimated based on three month average
- 3. Absolute Radio Network Worldwide Mobile App Active Users (000s) Station Players Other Apps 92 77 86 88 34 36 48 66 30 64 14 15 226 236 241 216 223 219 212 220 215 206 204 205 Apr May Jun Jul Aug Sep Oct Nov Dec Jan Feb Mar* 2011 2011 2011 2011 2011 2011 2011 2011 2011 2012 2012 2012 Sources: Spodtronic and Flurry *March Spodtronic data estimated based on three month average
- 4. Absolute Radio Network Total Registered Accounts (000s) Legacy Desktop Mobile 700 600 500 400 300 200 100 0 Feb Mar Apr May Jun Jul Aug Sep Oct Nov Dec Jan Feb 2011 2011 2011 2011 2011 2011 2011 2011 2011 2011 2011 2012 2012 Source: Internal server logs
- 5. Absolute Radio Worldwide YouTube Video Views (000s) 790 797 750 744 615 575 541 503 505 510 421 411 Apr May Jun Jul Aug Sep Oct Nov Dec Jan Feb Mar 2011 2011 2011 2011 2011 2011 2011 2011 2011 2012 2012 2012 Source: YouTube
- 6. Absolute Radio Worldwide YouTube Activity Likes Comments Shares 4,000 3,500 3,000 2,500 2,135 2,000 1,500 1,152 1,000 500 274 0 Apr May Jun Jul Aug Sep Oct Nov Dec Jan Feb Mar 2011 2011 2011 2011 2011 2011 2011 2011 2011 2012 2012 2012 Source: YouTube
- 7. Absolute Radio Network Worldwide Online Unique Visitors (000s) 557 532 514 475 439 438 444 452 399 Utility broken Utility broken Apr May Jun Jul Aug Sep Oct Nov Dec Jan Feb Mar 2011 2011 2011 2011 2011 2011 2011 2011 2011 2012 2012 2012 Source: Piwik
- 8. UK Online Unique Visitors (000s) Mar-11 Feb-12 Mar-12 388 386 307 303 275 174 145 95 88 22 Heart FM Capital talkSPORT Absolute Classic FM KISS Real Magic Smooth XFM Websites Network Radio Radio 105.4 Radio Online Network Source: UKOM
- 9. Absolute Radio Network Worldwide Site Traffic Visits (000s) Page Views (000s) 937 878 882 875 7,124 823 840 813 797 6,574 785 767 6,288 755 5,971 5,933 6,090 5,6115,711 675 5,315 5,422 5,434 4,975 Apr May Jun Jul Aug Sep Oct Nov Dec Jan Feb Mar Apr May Jun Jul Aug Sep Oct Nov Dec Jan Feb Mar 11 11 11 11 11 11 11 11 11 12 12 12 11 11 11 11 11 11 11 11 11 12 12 12 Source: Google
- 10. Absolute Radio RadioPlayer Unique Visitors (000s) Visits (000s) 906 906 301 861 283 282 813 811 260 257 750 688 682 686 663 654 219 220 215 219 223 590 192 195 Apr May Jun Jul Aug Sep Oct Nov Dec Jan Feb Mar Apr May Jun Jul Aug Sep Oct Nov Dec Jan Feb Mar 11 11 11 11 11 11 11 11 11 12 12 12 11 11 11 11 11 11 11 11 11 12 12 12 Source: Google
- 11. Absolute Radio Social Media Total Facebook Likes (000s) Total Twitter Follows (000s) Absolute Radio Other Network Pages Absolute Radio Other Network Profiles 46 95 98 42 90 87 80 83 86 75 40 68 72 36 38 32 34 63 31 29 30 57 27 26 72 73 75 77 79 30 56 62 64 66 69 70 21 22 27 46 17 17 18 19 20 20 15 15 Apr May Jun Jul Aug Sep Oct Nov Dec Jan Feb Mar Apr May Jun Jul Aug Sep Oct Nov Dec Jan Feb Mar 11 11 11 11 11 11 11 11 11 12 12 12 11 11 11 11 11 11 11 11 11 12 12 12 Source: Facebook and Twitter
- 12. Absolute Radio Network Facebook Talking About (000s) Nov 11 Dec 11 Jan 12 Feb 12 Mar 12 9.0 8.0 7.0 5.9 6.0 5.0 4.9 4.0 4.0 3.0 2.0 1.9 1.0 0.0 Absolute Breakfast 80s Others Source: Facebook
- 13. Unprompted Awareness 1.25 2.50 6.25 7.50 0.00 3.75 5.00 8.75 10.00 Oct 08 Nov 08 Dec 08 Jan 09 Feb 09 Mar 09 Apr 09 May 09 Jun 09 Jul 09 Aug 09 Sep 09 Oct 09 Nov 09 Dec 09 Jan 10 Feb 10 Mar 10 Source: Harris Interactive 16+ UK Online Omnibus (three-month roll) Apr 10 May 10 Jun 10 Unprompted Jul 10 Aug 10 Sep 10 Oct 10 Nov 10 Dec 10 Jan 11 Prompted Feb 11 National Awareness Mar 11 Apr 11 Absolute Radio Network May 11 Jun 11 Jul 11 Aug 11 Sep 11 Oct 11 Nov 11 Dec 11 Jan 12 Feb 12 Mar 12 7.7 0.0 5.0 15.0 20.0 30.0 35.0 37.9 40.0 10.0 25.0 Prompted Awareness
- 14. Absolute Radio Network Weekly Reach (millions) W4:10 W3:11 W4:11 3.0 2.9 2.8 2.8 2.3 2.2 1.1 1.1 1.0 1.1 0.9 0.9 Total 10+ Total 15+ London 10+ London 15+ Source: RAJAR
- 15. Absolute Radio Network Monthly Reach (millions) W4:10 W3:11 W4:11 5.0 4.9 4.8 4.7 3.9 3.8 1.8 1.8 1.7 1.7 1.4 1.4 Total 10+ Total 15+ London 10+ London 15+ Source: RAJAR
- 16. Absolute Radio Network Weekly Hours (millions) W4:10 W3:11 W4:11 20.7 20.3 19.0 18.8 16.0 15.9 7.2 7.8 7.7 6.9 5.7 5.7 Total 10+ Total 15+ London 10+ London 15+ Source: RAJAR